Green Total Factor Productivity Growth and Its Determinants in China’s Industrial Economy

Abstract
:1. Introduction
2. Method and Data
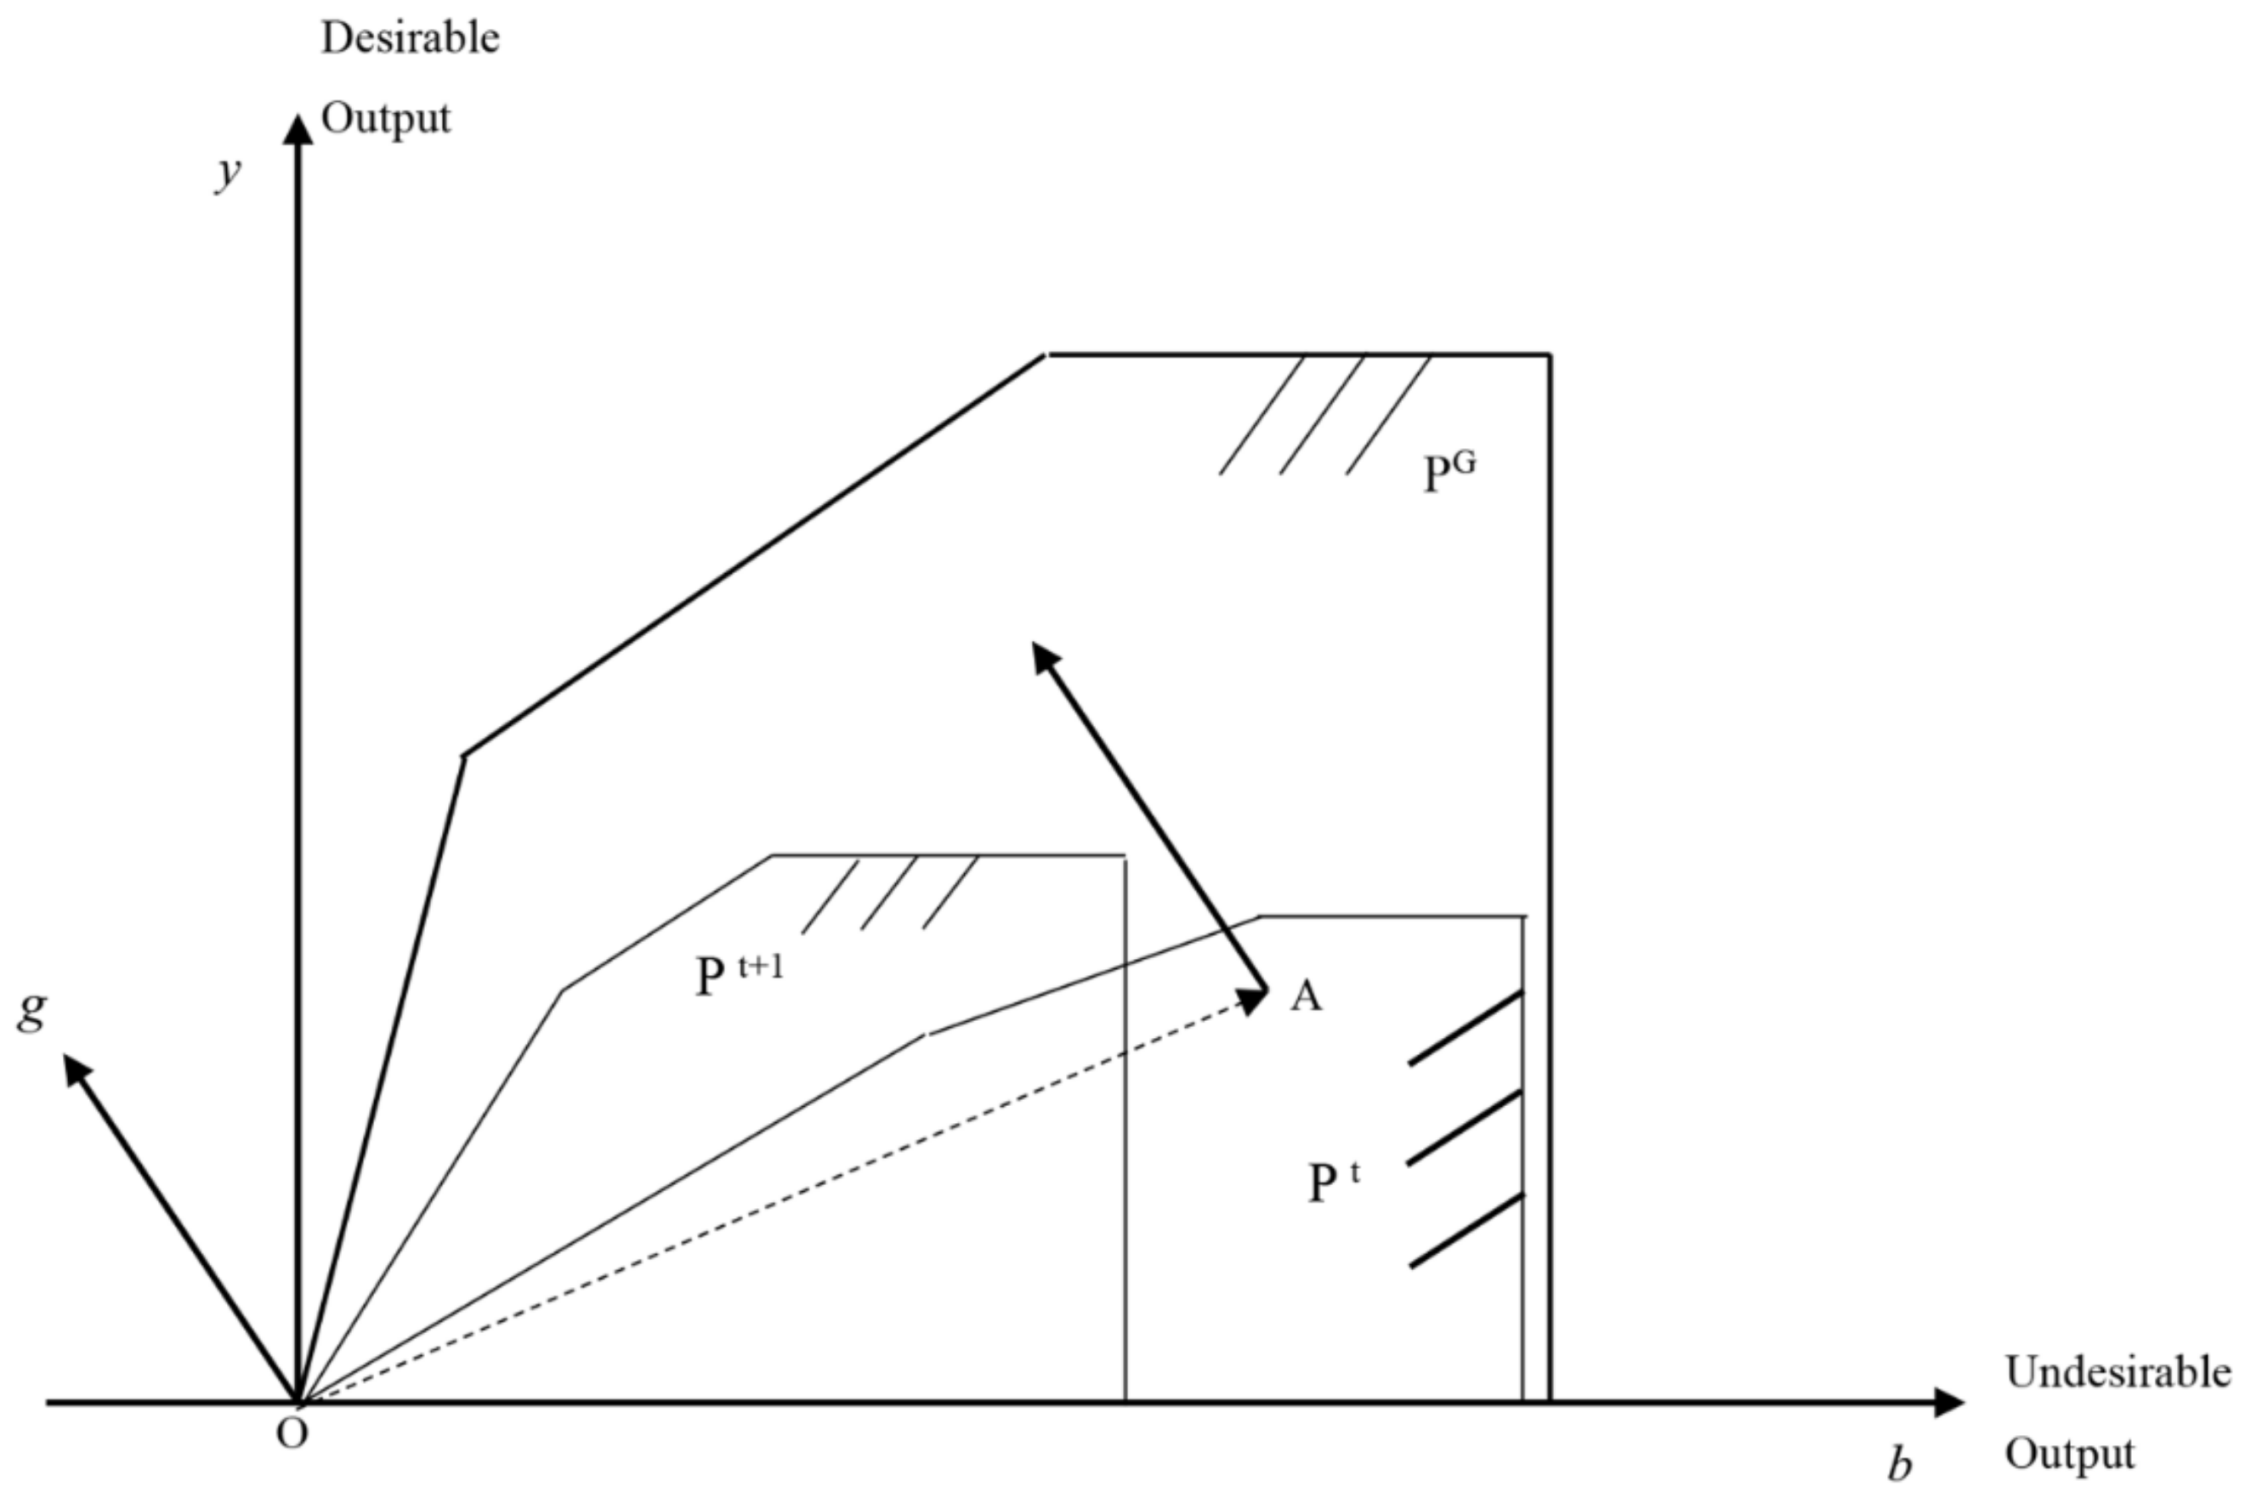
2.1. DDF and GML Productivity Index
2.2. Indices and Data
3. Measuring Results and Discussion
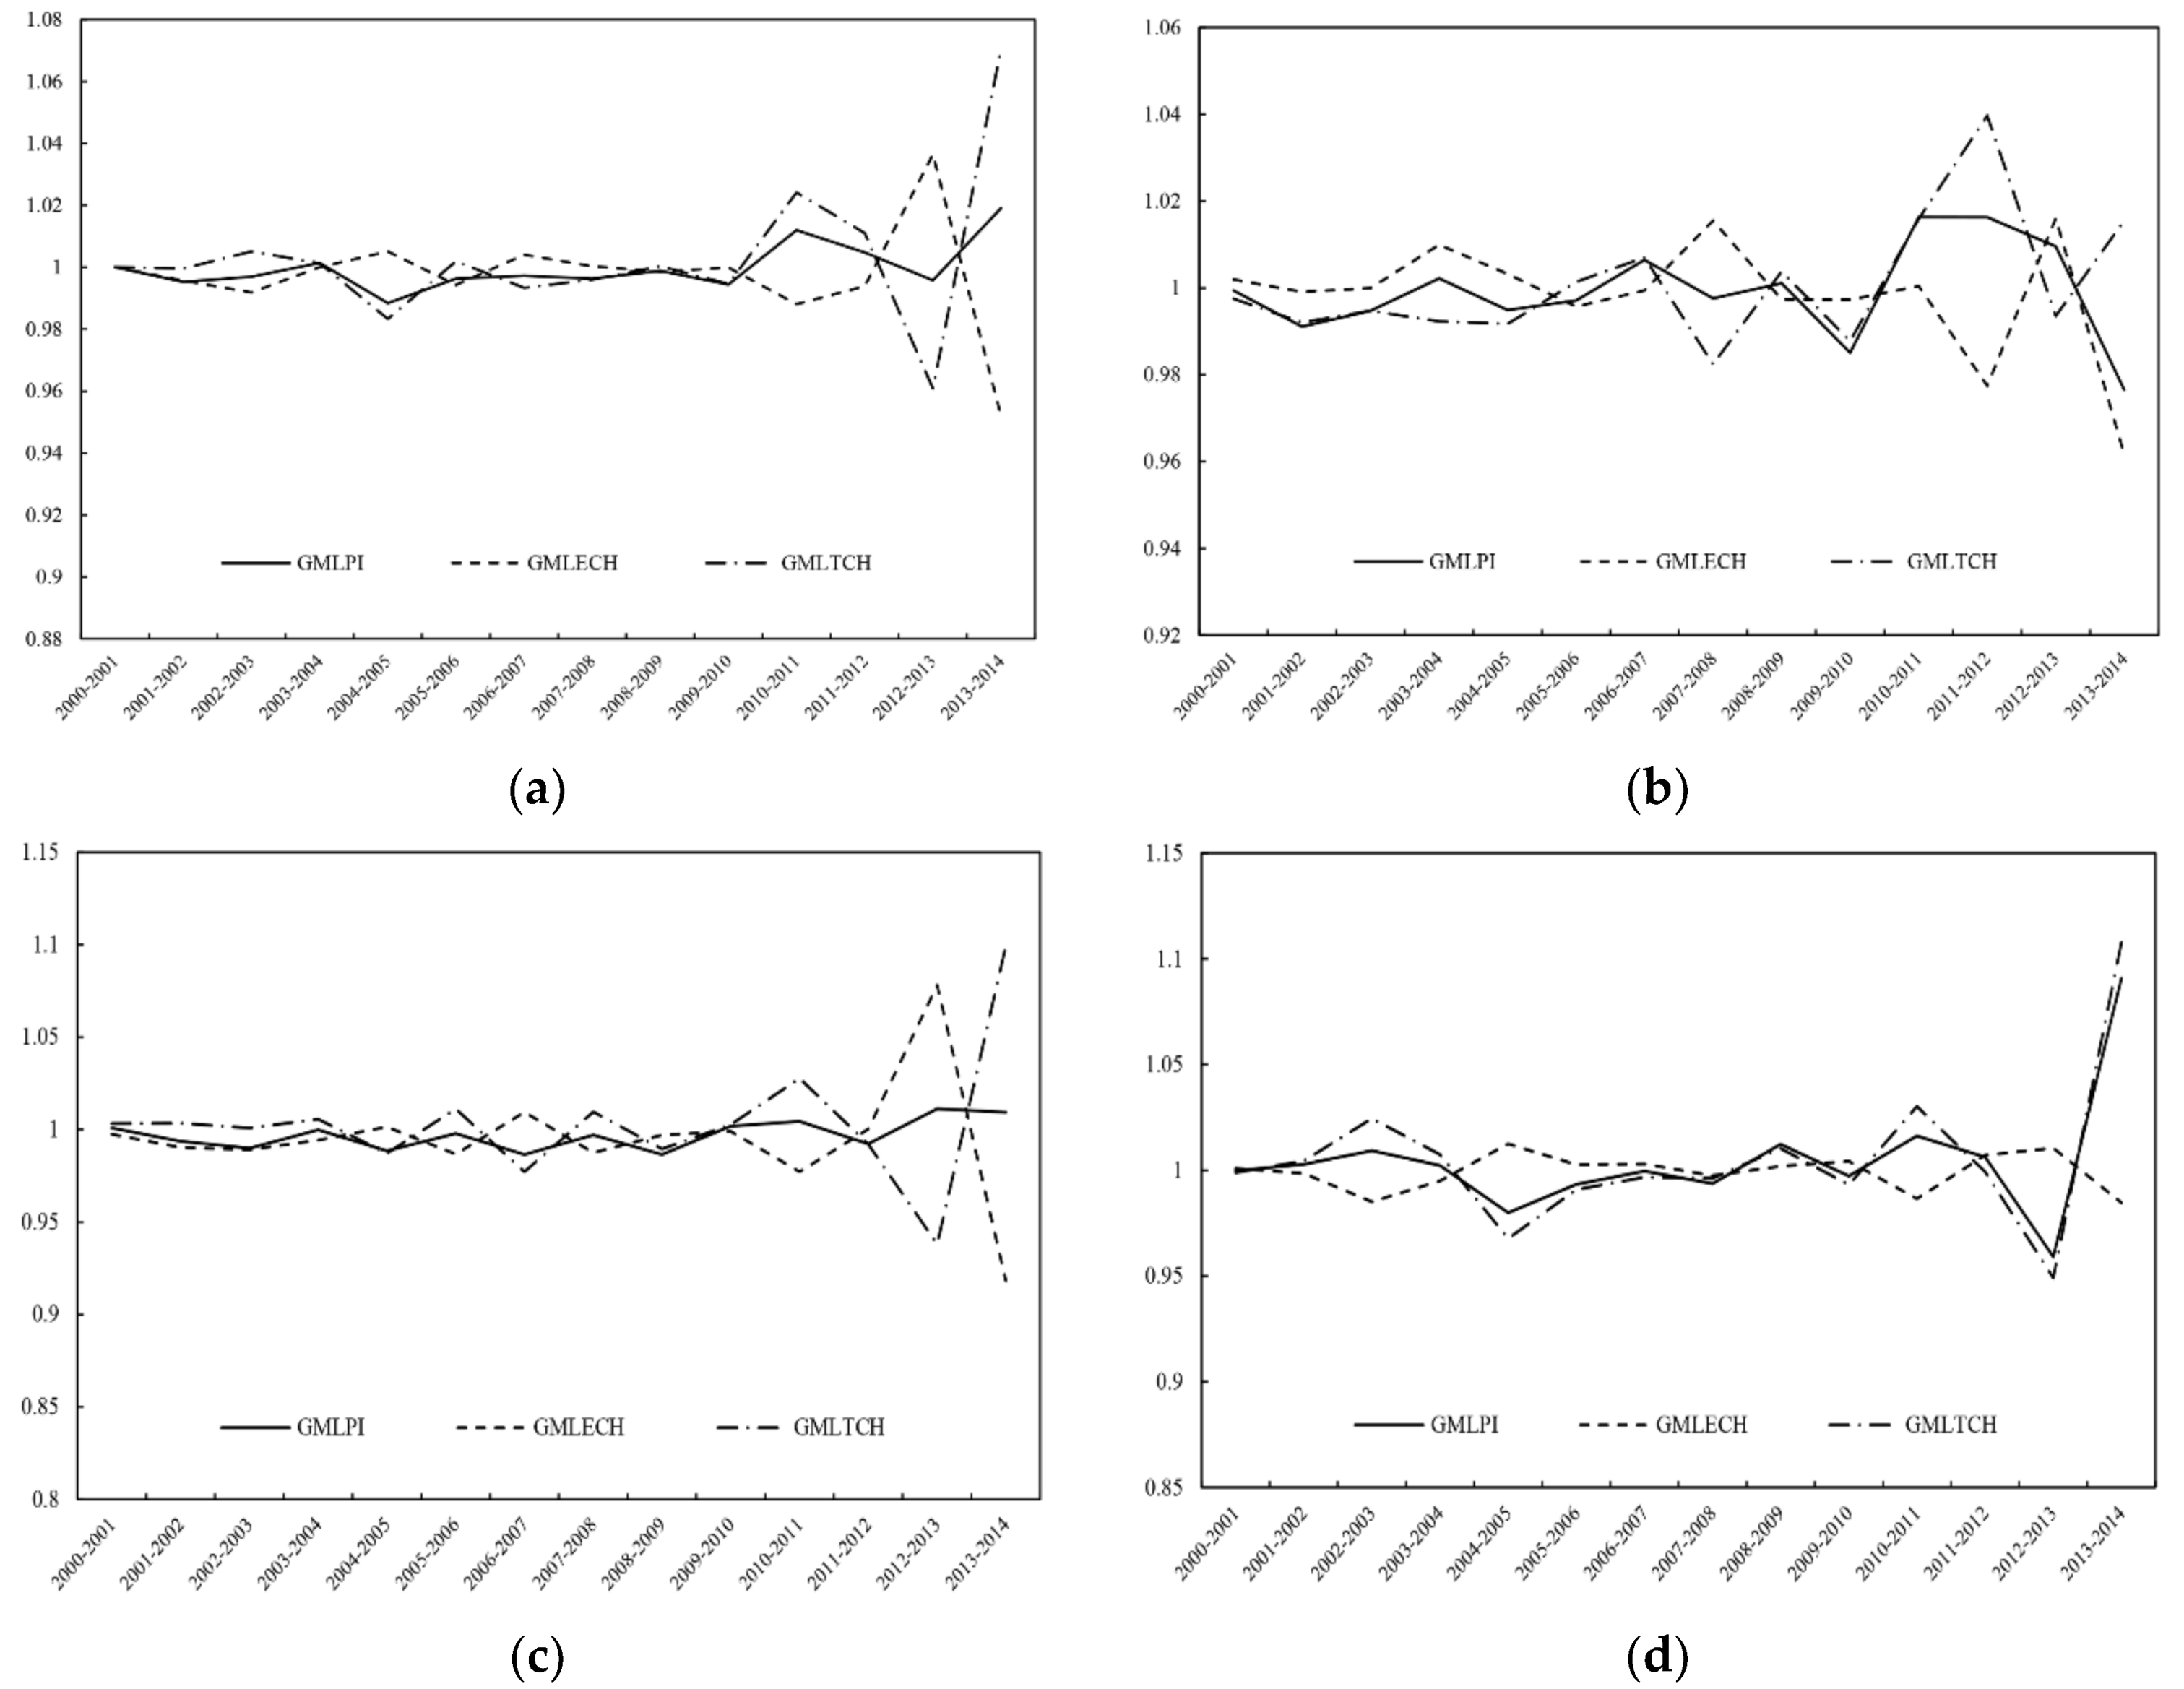
3.1. Green TFP Growth
3.2. Green Growth Accounting
4. The Determinants of Industrial GTFP
4.1. Model and Variables
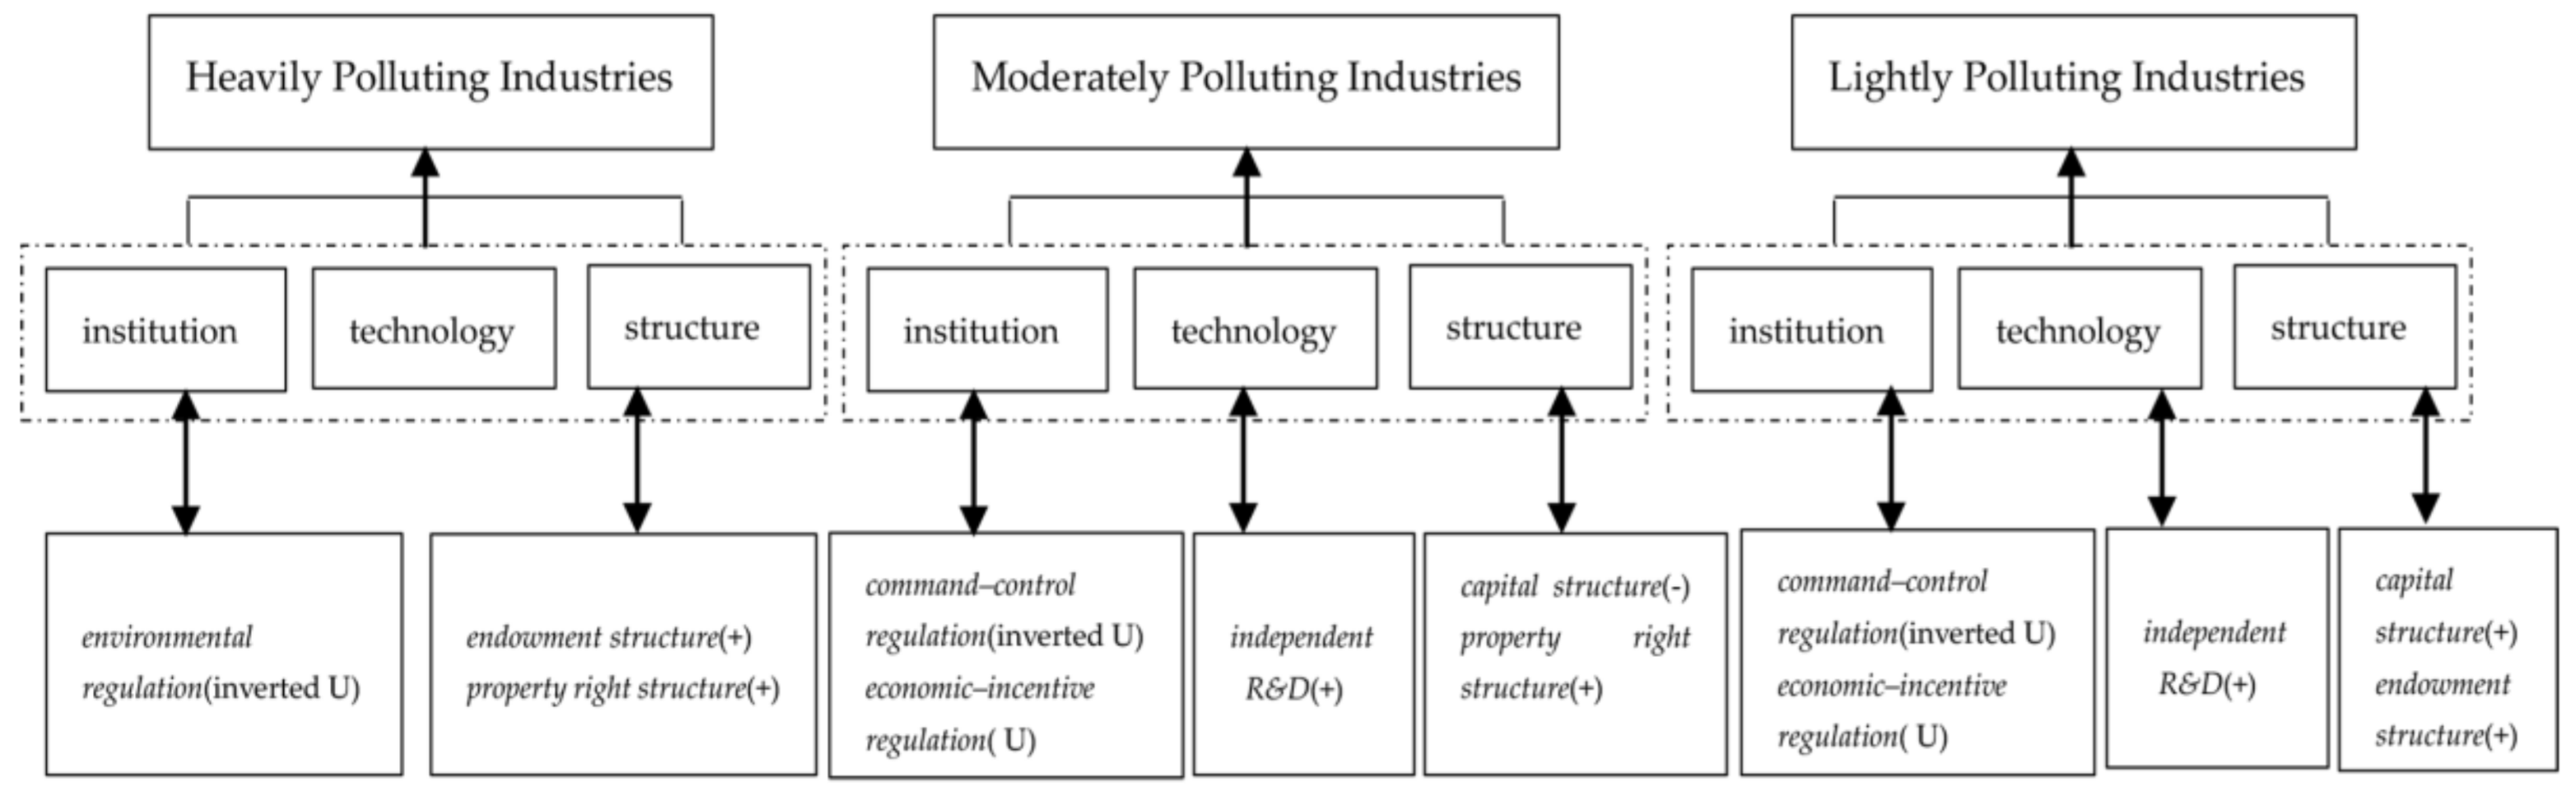
4.2. Results and Discussion
5. Conclusions
5.1. Main Conclusions and Limitations
5.2. Trajectory of Foreseen Investment
Supplementary Materials
Acknowledgments
Author Contributions
Conflicts of Interest
References
- National Bureau of Statistics of China. Available online: http://data.stats.gov.cn/easyquery.htm?cn=C01 (accessed on 17 November 2016).
- Yu, M. Create an upgrading version of Chinese industry under the new normal. Qiu Shi 2015, 1, 23–25. [Google Scholar]
- Mundaca, L.; Markandya, A. Assessing regional progress towards a “Green Energy Economy”. Appl. Energy 2016, 179, 1372–1394. [Google Scholar] [CrossRef]
- Organization for Economic Co-operation and Development (OECD). Green Growth Indicators 2017; OECD Publishing: Paris, France, 2017. [Google Scholar] [CrossRef]
- Chen, C.; Han, J.; Fan, P. Measuring the Level of Industrial Green Development and Exploring Its Influencing Factors: Empirical Evidence from China’s 30 Provinces. Sustainability 2016, 8, 153. [Google Scholar] [CrossRef]
- Solow, R.M. Technical change and the aggregate production function. Rev. Econ. Stat. 1957, 39, 312–320. [Google Scholar] [CrossRef]
- Kim, J.I.; Lau, L.J. The sources of economic growth of the East Asian newly industrialized countries. J. Jpn. Int. Econ. 1994, 8, 235–271. [Google Scholar] [CrossRef]
- Young, A. The tyranny of numbers: Confronting the statistical realities of the East Asian growth experience. Q. J. Econ. 1995, 110, 641–680. [Google Scholar] [CrossRef]
- Perkins, D.H.; Rawski, T.G. Forecasting China’s Economic Growth to 2025. China’s Great Economic Transformation; Loren, B., Thomas, G.R., Eds.; Cambridge University Press: New York, NY, USA, 2008; Chapter 20; pp. 829–887. [Google Scholar]
- Kuan, C.; Hongchang, W.; Yuxin, Z.; Jefferson, G.H.; Rawski, T.G. Productivity change in Chinese industry: 1953–1985. J. Comp. Econ. 1988, 12, 570–591. [Google Scholar] [CrossRef]
- Cao, J.; Ho, M.S.; Jorgenson, D.W. Industrial and aggregate measures of productivity growth in China, 1982–2000. Rev. Income Wealth 2009, 55, 485–513. [Google Scholar] [CrossRef]
- Chen, S.; Jefferson, G.H.; Zhang, J. Structural change, productivity growth and industrial transformation in China. China Econ. Rev. 2011, 22, 133–150. [Google Scholar] [CrossRef]
- Chen, S. Energy consumption, CO2 emission and sustainable development in Chinese industry. Econ. Res. J. 2009, 4, 41–55. [Google Scholar]
- Johnes, J. Data envelopment analysis and its application to the measurement of efficiency in higher education. Econ. Educ. Rev. 2006, 25, 273–288. [Google Scholar] [CrossRef]
- Färe, R.; Grosskopf, S.; Norris, M. Productivity growth, technical progress, and efficiency change in industrialized countries: Reply. Am. Econ. Rev. 1997, 87, 1040–1044. Available online: http://www.jstor.org/stable/2951341 (accessed on 5 December 2016).
- Chambers, R.G.; Chung, Y.; Färe, R. Benefit and distance functions. J. Econ. Theory 1996, 70, 407–419. [Google Scholar] [CrossRef]
- Chung, Y.H.; Färe, R.; Grosskopf, S. Productivity and undesirable outputs: A directional distance function approach. J. Environ. Manag. 1997, 51, 229–240. [Google Scholar] [CrossRef]
- Chen, S.; Golley, J. “Green” productivity growth in China’s industrial economy. Energy Econ. 2014, 44, 89–98. [Google Scholar] [CrossRef]
- Boyd, G.A.; Tolley, G.; Pang, J. Plant level productivity, efficiency, and environmental performance of the container glass industry. Environ. Resour. Econ. 2002, 23, 29–43. [Google Scholar] [CrossRef]
- Watanabe, M.; Tanaka, K. Efficiency analysis of Chinese industry: A directional distance function approach. Energy Policy 2007, 35, 6323–6331. [Google Scholar] [CrossRef]
- Wang, K.; Wei, Y.M.; Zhang, X. Energy and emissions efficiency patterns of Chinese regions: A multi-directional efficiency analysis. Appl. Energy 2013, 104, 105–116. [Google Scholar] [CrossRef]
- Li, K.; Lin, B. Measuring green productivity growth of Chinese industrial sectors during 1998–2011. China Econ. Rev. 2015, 36, 279–295. [Google Scholar] [CrossRef]
- Chen, C. China’s industrial green total factor productivity and its determinants: An empirical study based on ML index and dynamic panel data model. Stat. Res. 2016, 33, 53–62. [Google Scholar]
- Aghayi, N.; Maleki, B. Efficiency measurement of DMUs with undesirable outputs under uncertainty based on the directional distance function: Application on bank industry. Energy 2016, 112, 376–387. [Google Scholar] [CrossRef]
- Wang, Q.; Su, B.; Zhou, P.; Chiu, C.R. Measuring total-factor CO2 emission performance and technology gaps using a non-radial directional distance function: A modified approach. Energy Econ. 2016, 56, 475–482. [Google Scholar] [CrossRef]
- Tone, K. A slacks-based measure of efficiency in data envelopment analysis. Eur. J. Oper. Res. 2001, 130, 498–509. [Google Scholar] [CrossRef]
- Färe, R.; Grosskopf, S. Directional distance functions and slacks-based measures of efficiency. Eur. J. Oper. Res. 2010, 200, 320–322. [Google Scholar] [CrossRef]
- Arabi, B.; Munisamy, S.; Emrouznejad, A.; Shadman, F. Power industry restructuring and eco-efficiency changes: A new slacks-based model in Malmquist–Luenberger index measurement. Energy Policy 2014, 68, 132–145. [Google Scholar] [CrossRef]
- Oh, D. A metafrontier approach for measuring an environmentally sensitive productivity growth index. Energy Econ. 2010, 32, 146–157. [Google Scholar] [CrossRef]
- Munisamy, S.; Arabi, B. Eco-efficiency change in power plants: Using a slacks-based measure for the metafrontier Malmquist–Luenberger productivity index. J. Clean. Prod. 2015, 105, 218–232. [Google Scholar] [CrossRef]
- Chung, Y.; Heshmati, A. Measurement of environmentally sensitive productivity growth in Korean industries. J. Clean. Prod. 2015, 104, 380–391. [Google Scholar] [CrossRef]
- Oh, D.H. A global Malmquist–Luenberger productivity index. J. Prod. Anal. 2010, 34, 183–197. [Google Scholar] [CrossRef]
- Emrouznejad, A.; Yang, G. CO2 emissions reduction of Chinese light manufacturing industries: A novel RAM–based global Malmquist–Luenberger productivity index. Energy Policy 2016, 96, 397–410. [Google Scholar] [CrossRef]
- Ananda, J.; Hampf, B. Measuring environmentally sensitive productivity growth: An application to the urban water sector. Ecol. Econ. 2015, 116, 211–219. [Google Scholar] [CrossRef]
- Fan, M.; Shao, S.; Yang, L. Combining global Malmquist–Luenberger index and generalized method of moments to investigate industrial total factor CO2 emission performance: A case of Shanghai (China). Energy Policy 2015, 79, 189–201. [Google Scholar] [CrossRef]
- Tao, F.; Zhang, H.; Hu, J.; Xia, X.H. Dynamics of green productivity growth for major Chinese urban agglomerations. Appl. Energy 2017, 196, 170–179. [Google Scholar] [CrossRef]
- Li, L.; Tao, F. Green total factor productivity and influencing factors of pollution-intensive industries. Economists 2011, 12, 32–39. [Google Scholar]
- Li, B.; Peng, X.; Ouyang, M.K. Environmental regulation, green total factor productivity and the transformation of China’s industrial development mode. China Ind. Econ. 2013, 4, 56–68. [Google Scholar]
- Zhang, N.; Choi, Y. Total-factor carbon emission performance of fossil fuel power plants in China: A metafrontier non-radial Malmquist index analysis. Energy Econ. 2013, 40, 549–559. [Google Scholar] [CrossRef]
- Li, K.; Lin, B. Impact of energy conservation policies on the green productivity in China’s manufacturing sector: Evidence from a three-stage DEA model. Appl. Energy 2016, 168, 351–363. [Google Scholar] [CrossRef]
- Wang, Y.; Shen, N. Environmental regulation and environmental productivity: The case of China. Renew. Sustain. Energy Rev. 2016, 62, 758–766. [Google Scholar] [CrossRef]
- Zhu, X.; Chen, Y.; Feng, C. Green total factor productivity of China’s mining and quarrying industry: A global data envelopment analysis. Resour. Policy 2018. [Google Scholar] [CrossRef]
- Färe, R.; Grosskopf, S.; Pasurka, C.A. Environmental production functions and environmental directional distance functions. Energy 2007, 32, 1055–1066. [Google Scholar] [CrossRef]
- Aparicio, J.; Pastor, J.T.; Zofio, J.L. On the inconsistency of the Malmquist-Luenberger index. Eur. J. Oper. Res. 2013, 229, 738–742. [Google Scholar] [CrossRef]
- Pastor, J.T.; Lovell, C.A.K. A global Malmquist productivity index. Econ. Lett. 2005, 88, 266–271. [Google Scholar] [CrossRef]
- China Statistics Press. China Industrial Statistical Yearbook 2001–2015; China Statistics Press: Beijing, China, 2015.
- China Statistics Press. China Economic Census Yearbook 2004, 2008, 2013; China Statistics Press: Beijing, China, 2004, 2008, 2013.
- China Statistics Press. China Energy Statistical Yearbook 2001–2015; China Statistics Press: Beijing, China, 2015.
- Zhang, J.; Zhang, Y. Estimating the capital stock K of China. Econ. Res. J. 2003, 7, 35–43. [Google Scholar]
- Shan, H. Estimating the capital stock of China: 1952–2006. J. Quant. Tech. Econ. 2008, 25, 17–31. [Google Scholar]
- Chen, S. Estimates of sub-industrial statistical data in China (1980–2008). China Econ. Q. 2011, 10, 735–776. [Google Scholar]
- Li, L.; Tao, F. Selection of optimal environmental regulation intensity for Chinese manufacturing industry: Based on the green TFP perspective. China Ind. Econ. 2012, 5, 70–82. [Google Scholar]
- China Statistics Press. China Environmental Statistics Yearbook 2001–2015; China Statistics Press: Beijing, China, 2015.
- China Environment Yearbook Office Press. China Environment Yearbook 2001–2015; China Environment Yearbook Office Press: Beijing, China, 2015.
- China Environmental Science Press. Annual Statistic Report on Environment in China 2007–2015; China Environmental Science Press: Beijing, China, 2015.
- Intergovernmental Panel on Climate Change (IPCC). 2006 IPCC Guidelines for National Greenhousegas Inventories. Available online: http://www.ipcc-nggip.iges.or.jp/public/2006gl/pdf/2_Volume2/V2_6_Ch6_Reference_Approach.pdf (accessed on 20 November 2016).
- Wang, B.; Liu, G.T. Energy conservation and emission reduction and China’s green economic growth: Based on a total factor productivity perspective. China Ind. Econ. 2015, 5, 57–69. [Google Scholar]
- Qiu, B.; Yang, S.; Xin, P. Technology spillover of FDI and Chinese manufacturing productivity growth: Based on panel data. World Econ. 2008, 8, 20–31. [Google Scholar]
- Arellano, M.; Bond, S. Some tests of specification for panel data: Monte Carlo evidence and an application to employment equations. Rev. Econ. Stud. 1991, 58, 277–297. [Google Scholar] [CrossRef]
- Arellano, M.; Bover, O. Another look at the instrumental variable estimation of error-components models. J. Econom. 1995, 68, 29–51. [Google Scholar] [CrossRef]
- Blundell, R.; Bond, S. Initial conditions and moment restrictions in dynamic panel data models. J. Econom. 1998, 87, 115–143. [Google Scholar] [CrossRef]
- Cropper, M.L.; Oates, W.E. Environmental economics: A survey. J. Econ. Lit. 1992, 30, 675–740. Available online: http://www.jstor.org/stable/2727701 (accessed on 10 December 2016).
- Jaffe, A.B.; Palmer, K. Environmental regulation and innovation: A panel data study. Rev. Econ. Stat. 1997, 79, 610–619. Available online: http://www.jstor.org/stable/2951413 (accessed on 10 December 2016). [CrossRef]
- Porter, M.E. Towards a dynamic theory of strategy. Strateg. Manag. J. 1991, 12, 95–117. [Google Scholar] [CrossRef]
- Porter, M.E.; Van der Linde, C. Toward a new conception of the environment-competitiveness relationship. J. Econ. Perspect. 1995, 9, 97–118. [Google Scholar] [CrossRef]
- China Statistics Press. China Statistical Yearbook 2001–2015; China Statistics Press: Beijing, China, 2015.
- China Statistics Press. China Statistical Yearbook of Science and Technology 2001–2015; China Statistics Press: Beijing, China, 2015.
- Windmeijer, F. A finite sample correction for the variance of linear efficient two–step GMM estimators. J. Econom. 2005, 126, 25–51. [Google Scholar] [CrossRef]


| Literature | Methodology | Data and Period | GTFP Growth (%) | Growth Varied in Industries/Sectors (%) |
|---|---|---|---|---|
| Li and Tao [37] | SBM-DDF and L index | 19 pollution-intensive sectors; 2004–2008 | 2.85 | most pollution-intensive sectors showed negative growth rates |
| Li et al. [38] | SBM and ML index | 36 industrial sectors; 2001–2010 | −1.7 | Non-ferrous metal mining (0.8), Tobacco manuf. (0.3), etc. grew rapidly; Ferrous metals smelting (−3.3), Non-ferrous metals smelting (−3.5), etc. grew slowly |
| Zhang and Choi [39] | metafrontier non-radial M index | 93 fossil fuel power plants; 2005–2010 | 0.38 | 64 power plants showed an increase (the highest growth rate was 6.2), whereas 29 plants, a decrease (the lowest growth rate was −0.86) |
| Chen and Golley [18] | DDF and ML index | 38 industrial sectors; 1980–2010 | 1.8 | Electronic equip.(8.4), Measuring inst.(5.4), etc. grew rapidly; Non–metal mining(−0.1), Fuel processing(−2.4), etc. grew slowly |
| Li and Lin [22] | DDF and SS- ML index | 36 industrial sectors; 1998–2011 | 3.18 | growth rates range from 0.74 (gas prod.) to 10.53 (petroleum ext.); energy-intensive sectors have much higher growth rates |
| Li and Lin [40] | three-stage DEA and ML index | 28 manufacturing sectors; 2006–2010 | 2.7 | light and high-tech industry sectors have a high growth of 3.67 and 3.07; energy-intensive and emissions-intensive sectors have a low growth of 1.38 |
| Chen [23] | DDF and ML index | 36 industrial sectors; 2004–2013 | −0.1 | equipment manufacturing industries grew rapidly with the rate of 1.9 |
| Wang and Shen [41] | GML index | 36 industrial sectors; 2000–2012 | −22.8 | a notable difference between pollution-intensive and clean production industries: around −25.9 and −15 |
| Zhu et al. [42] | slacks-based global DEA and GM index. | 5 sectors of mining and quarrying industry; 1991–2014 | 71.7 | the mining and processing of ferrous metal ores, the mining and processing of non-ferrous metal ores, and the mining and processing of nonmetal ores grew rapidly |
| Energy | NCV | CEF | COF | Standard coal conversion factor | ||||
|---|---|---|---|---|---|---|---|---|
| Values | Unit | Values | Units | Values | Units | |||
| Coal | Bituminous coal | 20,908 | kJ/kg | 25.8 | kg/106 kJ | 0.99 | 0.7143 | kg standard coal/kg |
| anthracite | 26.8 | |||||||
| Weighted average | 26 | |||||||
| Crude oil | 41,816 | 20 | 1 | 1.4286 | ||||
| Natural gas | 38,931 | kJ/cubic meter | 15.3 | 1 | 1.3300 | kg standard coal/cubic meter | ||
| Intensity of Industrial Pollutant Emissions | Categories | Corresponding Industrial Sectors |
|---|---|---|
| 0.1109 < ϕ < 0.4727 | Heavily polluting industries (13) | Non-Ferrous Metal Mining, Electric Power and Heat Power, Paper Manuf., Ferrous Metal Mining, Non-metallic Mineral Products Manuf., Ferrous Metals Smelting/Pressing, Coal Mining, Raw Chemical Materials Manuf., Water Production and Supply, Chemical Fibres Manuf., Non-ferrous Metals Smelting/Pressing, Processing of Petroleum, Non-metal Mining |
| 0.0110 < ϕ < 0.0847 | Moderately polluting industries (13) | Beverages Manuf., Textile Manuf., Gas Production and Supply, Food Processing, Foods Manuf., Medicines Manuf., Petroleum Extraction, Rubber Manuf., Wood Processing, Leather Manuf., Metal Products Manuf., Measuring Instruments Manuf., Special Machinery Manuf. |
| 0.0030 < ϕ < 0.0099 | Lightly polluting industries (10) | Transport Equipment, Tobacco Manuf., Furniture Manuf., Apparel Manuf., General Machinery Manuf., Plastics Products Manuf., Printing, Electronic Equipment, Electrical Equipment, Cultural articles |
| Industrial sectors | GMPI | GMLPI | GMECH | GMLECH | GMTCH | GMLTCH |
|---|---|---|---|---|---|---|
| Coal Mining | 1.1050 | 0.9906 | 0.9627 | 0.9900 | 1.1478 | 1.0006 |
| Petroleum Extraction | 1.0068 | 0.9992 | 0.9012 | 0.9980 | 1.1171 | 1.0011 |
| Ferrous Metal Mining | 0.8817 | 0.9822 | 0.9071 | 0.9851 | 0.9719 | 0.9970 |
| Non-Ferrous Metal Mining | 1.0294 | 0.9874 | 0.9396 | 1.0000 | 1.0956 | 0.9874 |
| Non-metal Mining | 1.0847 | 1.0012 | 0.9857 | 0.9994 | 1.1004 | 1.0018 |
| Food Processing | 1.1006 | 0.9896 | 0.9671 | 0.9883 | 1.1381 | 1.0013 |
| Foods Manuf. | 1.1030 | 0.9952 | 0.9768 | 0.9936 | 1.1292 | 1.0015 |
| Beverages Manuf. | 1.1141 | 0.9919 | 0.9928 | 0.9902 | 1.1222 | 1.0017 |
| Tobacco Manuf. | 1.1442 | 1.0065 | 1.0000 | 1.0000 | 1.1442 | 1.0065 |
| Textile Manuf. | 1.1075 | 0.9903 | 0.9588 | 0.9890 | 1.1550 | 1.0013 |
| Apparel Manuf. | 1.0606 | 0.9950 | 0.9646 | 0.9895 | 1.0995 | 1.0056 |
| Leather Manuf. | 1.0410 | 0.9998 | 0.9813 | 0.9883 | 1.0609 | 1.0116 |
| Wood Processing | 1.0954 | 1.0007 | 1.0078 | 0.9980 | 1.0869 | 1.0026 |
| Furniture Manuf. | 0.9488 | 1.0000 | 0.9700 | 1.0000 | 0.9782 | 1.0000 |
| Paper Manuf. | 1.1453 | 0.9959 | 1.0079 | 0.9951 | 1.1364 | 1.0008 |
| Printing | 1.1009 | 1.0062 | 1.0188 | 1.0001 | 1.0806 | 1.0062 |
| Cultural articles | 1.0382 | 1.0000 | 0.9898 | 1.0000 | 1.0489 | 1.0000 |
| Processing of Petroleum | 1.0771 | 1.0022 | 0.9700 | 1.0000 | 1.1103 | 1.0022 |
| Raw Chemical Materials Manuf. | 1.1526 | 1.0014 | 0.9781 | 1.0007 | 1.1784 | 1.0007 |
| Medicines Manuf. | 1.1108 | 0.9957 | 0.9865 | 0.9939 | 1.1261 | 1.0018 |
| Chemical Fibres Manuf. | 1.1328 | 0.9925 | 1.0019 | 0.9914 | 1.1306 | 1.0011 |
| Rubber Manuf. | 1.0828 | 0.9969 | 0.9787 | 0.9946 | 1.1064 | 1.0023 |
| Plastics Products Manuf. | 1.0910 | 1.0020 | 0.9803 | 0.9965 | 1.1130 | 1.0055 |
| Non-metallic Mineral Products Manuf. | 1.1589 | 1.0019 | 0.9885 | 1.0012 | 1.1725 | 1.0008 |
| Ferrous Metals Smelting/Pressing | 1.1643 | 1.0004 | 0.9973 | 0.9998 | 1.1675 | 1.0006 |
| Non-ferrous Metals Smelting/Pressing | 1.1636 | 1.0087 | 1.0146 | 1.0078 | 1.1468 | 1.0010 |
| Metal Products Manuf. | 1.0949 | 0.9951 | 0.9639 | 0.9913 | 1.1358 | 1.0038 |
| General Machinery Manuf. | 1.1287 | 1.0037 | 0.9993 | 1.0008 | 1.1295 | 1.0029 |
| Special Machinery Manuf. | 1.1140 | 1.0035 | 0.9901 | 1.0009 | 1.1252 | 1.0026 |
| Transport Equipment | 1.1849 | 1.0057 | 1.0247 | 1.0032 | 1.1563 | 1.0025 |
| Electrical Equipment | 1.0911 | 1.0087 | 0.9799 | 1.0020 | 1.1135 | 1.0067 |
| Electronic Equipment | 1.1073 | 1.0130 | 1.0000 | 1.0000 | 1.1073 | 1.0130 |
| Measuring Instruments Manuf. | 1.0837 | 1.0035 | 1.0017 | 1.0000 | 1.0818 | 1.0035 |
| Electric Power and Heat Power | 1.1601 | 1.0179 | 1.0032 | 1.0000 | 1.1564 | 1.0179 |
| Gas Production and Supply | 1.0579 | 1.0012 | 0.9192 | 0.9994 | 1.1509 | 1.0018 |
| Water Production and Supply | 1.0747 | 1.0065 | 0.9509 | 1.0053 | 1.1302 | 1.0013 |
| Heavily Polluting Industries, AVG | 1.0994 | 0.9991 | 0.9771 | 0.9981 | 1.1253 | 1.0010 |
| Moderately Polluting Industries, AVG | 1.0851 | 0.9971 | 0.9708 | 0.9943 | 1.1178 | 1.0029 |
| Lightly Polluting Industries, AVG | 1.0878 | 1.0041 | 0.9926 | 0.9992 | 1.0959 | 1.0049 |
| Whole Industry, AVG | 1.0910 | 0.9998 | 0.9791 | 0.9970 | 1.1144 | 1.0027 |
| Periods | 2000–2005 | 2005–2010 | 2010–2014 | 2000–2014 | |
|---|---|---|---|---|---|
| Indices | GMPI | 1.1178 (11.78%) | 1.0761 (7.61%) | 1.0770 (7.70%) | 1.0910 (9.10%) |
| GMLPI | 0.9964 (−0.36%) | 0.9967 (−0.33%) | 1.0079 (0.79%) | 0.9998 (−0.02%) | |
| GMECH | 0.9822 (−1.78%) | 1.0111 (1.11%) | 0.9367 (−6.33%) | 0.9791 (−2.09%) | |
| GMLECH | 0.9986 (−0.14%) | 0.9994 (−0.06%) | 0.9922 (−0.78%) | 0.9970 (−0.30%) | |
| GMTCH | 1.1380 (13.80%) | 1.0643 (6.43%) | 1.1498 (14.98%) | 1.1144 (11.44%) | |
| GMLTCH | 0.9978 (−0.22%) | 0.9972 (−0.28%) | 1.0159 (1.59%) | 1.0027 (0.27%) | |
| Industrial sectors | Output | Capital | Labour | Energy | GTFP | Contribution rate of GTFP |
|---|---|---|---|---|---|---|
| Coal Mining | 1.1684 | 1.1075 | 1.0145 | 1.0669 | 0.9906 | −5.5701 |
| Petroleum Extraction | 1.0246 | 1.0757 | 1.0207 | 1.0052 | 0.9992 | −3.3406 |
| Ferrous Metal Mining | 1.2725 | 1.2027 | 1.0764 | 1.1337 | 0.9822 | −6.5342 |
| Non-Ferrous Metal Mining | 1.1455 | 1.1119 | 1.0074 | 1.0819 | 0.9874 | −8.6375 |
| Non-metal Mining | 1.2012 | 1.1028 | 1.0351 | 1.0507 | 1.0012 | 0.5826 |
| Food Processing | 1.1795 | 1.1010 | 1.0711 | 1.0645 | 0.9896 | −5.7724 |
| Foods Manuf. | 1.1827 | 1.0918 | 1.0596 | 1.0400 | 0.9952 | −2.6454 |
| Beverages Manuf. | 1.1650 | 1.0584 | 1.0336 | 1.0467 | 0.9919 | −4.9198 |
| Tobacco Manuf. | 1.1326 | 1.0027 | 0.9872 | 0.9827 | 1.0065 | 4.9122 |
| Textile Manuf. | 1.1423 | 1.0423 | 1.0011 | 1.0616 | 0.9903 | −6.7880 |
| Apparel Manuf. | 1.1664 | 1.0889 | 1.0560 | 1.0733 | 0.9950 | −2.9880 |
| Leather Manuf. | 1.1669 | 1.0918 | 1.0734 | 1.0825 | 0.9998 | −0.1428 |
| Wood Processing | 1.2289 | 1.0944 | 1.0775 | 1.1079 | 1.0007 | 0.2918 |
| Furniture Manuf. | 1.2284 | 1.1350 | 1.1123 | 1.0947 | 1.0000 | 0.0000 |
| Paper Manuf. | 1.1677 | 1.0641 | 1.0142 | 1.0421 | 0.9959 | −2.4650 |
| Printing | 1.1954 | 1.0608 | 1.0394 | 1.0606 | 1.0062 | 3.1990 |
| Cultural articles | 1.2484 | 1.1378 | 1.0934 | 1.0880 | 1.0000 | 0.0000 |
| Processing of Petroleum | 1.0985 | 1.0656 | 1.0304 | 1.0763 | 1.0022 | 2.2235 |
| Raw Chemical Materials Manuf. | 1.1889 | 1.0992 | 1.0264 | 1.0894 | 1.0014 | 0.7244 |
| Medicines Manuf. | 1.2003 | 1.1044 | 1.0591 | 1.0620 | 0.9957 | −2.1449 |
| Chemical Fibres Manuf. | 1.1403 | 1.0194 | 1.0066 | 0.9981 | 0.9925 | −5.3338 |
| Rubber Manuf. | 1.1768 | 1.0935 | 1.0192 | 1.0797 | 0.9969 | −1.7623 |
| Plastics Products Manuf. | 1.1781 | 1.0730 | 1.0610 | 1.0939 | 1.0020 | 1.0992 |
| Non-metallic Mineral Products Manuf. | 1.2163 | 1.0919 | 1.0269 | 1.0723 | 1.0019 | 0.8808 |
| Ferrous Metals Smelting/Pressing | 1.1947 | 1.0852 | 1.0316 | 1.0970 | 1.0004 | 0.2309 |
| Non-ferrous Metals Smelting/Pressing | 1.2074 | 1.1251 | 1.0499 | 1.1097 | 1.0087 | 4.2084 |
| Metal Products Manuf. | 1.1998 | 1.1297 | 1.0626 | 1.1036 | 0.9951 | −2.4480 |
| General Machinery Manuf. | 1.2134 | 1.0937 | 1.0394 | 1.0791 | 1.0037 | 1.7439 |
| Special Machinery Manuf. | 1.2151 | 1.1129 | 1.0394 | 1.0611 | 1.0035 | 1.6254 |
| Transport Equipment | 1.2714 | 1.1017 | 1.0576 | 1.0552 | 1.0057 | 2.1170 |
| Electrical Equipment | 1.2050 | 1.0994 | 1.0759 | 1.1040 | 1.0087 | 4.2594 |
| Electronic Equipment | 1.2365 | 1.0959 | 1.1155 | 1.1096 | 1.0130 | 5.4775 |
| Measuring Instruments Manuf. | 1.1903 | 1.0809 | 1.0470 | 1.0520 | 1.0035 | 1.8528 |
| Electric Power and Heat Power | 1.1731 | 1.0957 | 1.0142 | 1.0637 | 1.0179 | 10.3627 |
| Gas Production and Supply | 1.2226 | 1.1247 | 1.0350 | 1.0114 | 1.0012 | 0.5438 |
| Water Production and Supply | 1.0771 | 1.0640 | 0.9928 | 1.0504 | 1.0065 | 8.4681 |
| Dependent Variable | Determinants (Variables) | Determinant Factors (Variables) | Observations | Mean | Median | Maximum | Minimum | Standard Deviation |
|---|---|---|---|---|---|---|---|---|
| GTFP | / | / | 540 | 0.9861 | 0.9966 | 1.3316 | 0.7744 | 0.0636 |
| / | INS | CCR | 540 | 0.0278 | 0.0281 | 0.0329 | 0.0180 | 0.0023 |
| EIR | 540 | 0.0278 | 0.0263 | 0.0410 | 0.0246 | 0.0036 | ||
| ER | 540 | 0.0278 | 0.0275 | 0.0353 | 0.0223 | 0.0021 | ||
| / | TEC | RD | 540 | 0.0278 | 0.0265 | 0.0430 | 0.0211 | 0.0046 |
| FI | 540 | 0.0278 | 0.0263 | 0.0483 | 0.0217 | 0.0046 | ||
| / | STR | EN | 540 | 15.4175 | 8.3960 | 139.1191 | 1.6457 | 18.6247 |
| CA | 540 | 0.2587 | 0.2520 | 0.8414 | 0.0002 | 0.1751 | ||
| PR | 540 | 0.2985 | 0.1850 | 0.9947 | 0.0030 | 0.2857 | ||
| ES | 540 | 0.1652 | 0.1688 | 0.3394 | 0.0263 | 0.0665 |
| Variables and Tests | (1) | (2) | (3) | (4) | (5) | (6) |
|---|---|---|---|---|---|---|
| GTFPit−1 | 0.4163 *** (15.96) | 0.4219 *** (11.06) | 0.3069 *** (8.64) | −0.0068 (−0.19) | 0.0919 ** (2.21) | 0.0361 (0.94) |
| CCR | 6.4482 *** (3.83) | 5.4738 (0.93) | ||||
| CCR2 | −0.225 (−1.41) | |||||
| EIR | 4.5758 *** (3.57) | 0.9562 (0.13) | ||||
| EIR2 | −0.1121 (−0.48) | |||||
| ER | 12.0266 *** (4.94) | 2.9768 (0.27) | ||||
| ER2 | −0.0604 (−0.20) | |||||
| CCR·RD | −0.1489 (−1.48) | |||||
| CCR·FI | −0.1761 (−1.49) | |||||
| EIR·RD | −0.0184 (−0.19) | |||||
| EIR·FI | 0.0244 (0.11) | |||||
| ER·RD | −0.1849 * (−1.71) | |||||
| ER·FI | 0.0200 (0.08) | |||||
| RD | 6.6817 *** (5.34) | 5.3242 *** (3.90) | 4.7056 *** (3.61) | 5.1182 (1.48) | 1.1015 (0.34) | 6.4897 * (1.75) |
| FI | 0.9029 (0.62) | 2.5612 ** (2.39) | 0.6766 (0.46) | 5.5404 (1.45) | −0.6388 (−0.09) | −0.7132 (−0.09) |
| EN | 0.0001 (0.48) | 0.0002 (0.85) | 0.0004 ** (2.78) | 0.0016 *** (5.55) | 0.0019 *** (6.98) | 0.0016 *** (5.92) |
| CA | −0.1280 *** (−5.97) | −0.1569 (−6.07) | −0.1121 *** (−5.32) | −0.0456 (−1.37) | −0.0570 (−1.38) | −0.0721 ** (−1.90) |
| PR | 0.1595 *** (10.02) | 0.2028 *** (13.23) | 0.1986 *** (11.31) | 0.1816 *** (7.27) | 0.1311 *** (5.29) | 0.1742 *** (7.29) |
| ES | 0.4966 *** (14.17) | 0.5672 *** (8.59) | 0.5796 *** (11.24) | 0.0269 (0.38) | −0.1092 ** (−2.44) | −0.0176 (−0.31) |
| Sargan test | 0.9679 | 0.9903 | 0.9584 | 0.9856 | 0.9909 | 0.9935 |
| AR(1) | −2.8255 [0.0047] | −2.5922 [0.0095] | −2.7281 [0.0064] | −2.7147 [0.0066] | −2.8567 [0.0043] | −2.8183 [0.0048] |
| AR(2) | 1.6550 [0.0979] | 1.4543 [0.1459] | 1.6600 [0.0969] | 1.1984 [0.2307] | 1.3685 [0.1711] | 1.1267 [0.2599] |
| Wald-test-p | 0.0000 | 0.0000 | 0.0000 | 0.0000 | 0.0000 | 0.0000 |
| Variables and tests | Heavily Polluting Industries | Moderately Polluting Industries | Lightly Polluting Industries | ||||||
|---|---|---|---|---|---|---|---|---|---|
| (1) | (2) | (3) | (4) | (5) | (6) | (7) | (8) | (9) | |
| GTFPit−1 | −0.0423 | −0.0437 | −0.0366 | −0.0361 | 0.0134 | −0.0185 | 0.1038 | 0.1154 | 0.1003 |
| (−0.57) | (−0.58) | (−0.49) | (−0.37) | (0.13) | (−0.19) | (0.98) | (1.10) | (0.95) | |
| CCR | 6.9159 *** | 6.0988 *** | 2.0795 | ||||||
| (3.39) | (3.30) | (1.25) | |||||||
| CCR2 | −0.1024 *** | −0.0857 *** | −0.0892 *** | ||||||
| (−7.20) | (−6.76) | (−7.69) | |||||||
| EIR | 6.2152 ** | −2.4775 | −16.7271 | ||||||
| (2.33) | (−0.95) | (−1.55) | |||||||
| EIR2 | −0.1046 *** | 0.1256 *** | 0.1527 *** | ||||||
| (−6.89) | (7.55) | (3.94) | |||||||
| ER | 5.6514 * | 1.5355 | −1.4967 | ||||||
| (1.70) | (0.54) | (−0.49) | |||||||
| ER2 | −0.1065 *** | −0.1024 *** | 0.1022 *** | ||||||
| (−6.05) | (−6.63) | (6.73) | |||||||
| RD | 0.4023 | 0.5954 | 0.3920 | 3.1790 * | 2.8251 | 3.0567 * | 3.1664 ** | 3.0397 * | 3.0926 ** |
| (0.25) | (0.38) | (0.24) | (1.76) | (1.53) | (1.67) | (2.02) | (1.92) | (1.97) | |
| FI | −0.3904 | −0.4156 | −0.3960 | 0.4557 | 0.5375 | 0.7276 | 0.2500 | 0.5691 | 0.2479 |
| (−0.30) | (−0.32) | (−0.30) | (0.25) | (0.30) | (0.40) | (0.20) | (0.46) | (0.20) | |
| EN | 0.0017 *** | 0.0017 *** | 0.0018 *** | 0.0002 | 0.0001 | 0.0001 | 0.0081 *** | 0.0059 * | 0.0077 *** |
| (3.36) | (2.84) | (3.09) | (0.25) | (0.09) | (0.16) | (2.85) | (1.92) | (2.73) | |
| CA | −0.0480 | −0.0526 | −0.0667 | −0.2038 *** | −0.1043 * | −0.1795 *** | 0.0556 | 0.1198 * | 0.0712 |
| (−0.43) | (−0.43) | (−0.55) | (−4.34) | (−1.86) | (−3.63) | (1.03) | (1.80) | (1.29) | |
| PR | 0.0808 ** | 0.0761 ** | 0.0823 ** | 0.2310 *** | 0.1190 * | 0.2084 *** | −0.0363 | 0.0235 | −0.0244 |
| (2.15) | (2.05) | (2.14) | (4.38) | (1.87) | (3.72) | (−0.58) | (0.32) | (−0.38) | |
| ES | −0.0535 | −0.0350 | −0.0694 | −0.0085 | −0.2376 | −0.0194 | 0.2066 | 0.0702 | 0.1978 |
| (−0.25) | (−0.15) | (−0.29) | (−0.06) | (−1.52) | (−0.14) | (1.32) | (0.45) | (1.28) | |
| Sargan | 0.9132 | 0.9211 | 0.8766 | 0.9100 | 0.8661 | 0.9210 | 0.8562 | 0.9038 | 0.9010 |
| AR(2) | 0.0877 | 0.1123 | 0.0910 | 0.2313 | 0.1123 | 0.0980 | 0.1233 | 0.2538 | 0.1981 |
| Wald-test-p | 0.0000 | 0.0000 | 0.0000 | 0.0000 | 0.0000 | 0.0000 | 0.0000 | 0.0000 | 0.0000 |
© 2018 by the authors. Licensee MDPI, Basel, Switzerland. This article is an open access article distributed under the terms and conditions of the Creative Commons Attribution (CC BY) license (http://creativecommons.org/licenses/by/4.0/).
Share and Cite
Chen, C.; Lan, Q.; Gao, M.; Sun, Y. Green Total Factor Productivity Growth and Its Determinants in China’s Industrial Economy. Sustainability 2018, 10, 1052. https://doi.org/10.3390/su10041052
Chen C, Lan Q, Gao M, Sun Y. Green Total Factor Productivity Growth and Its Determinants in China’s Industrial Economy. Sustainability. 2018; 10(4):1052. https://doi.org/10.3390/su10041052
Chicago/Turabian StyleChen, Chaofan, Qingxin Lan, Ming Gao, and Yawen Sun. 2018. "Green Total Factor Productivity Growth and Its Determinants in China’s Industrial Economy" Sustainability 10, no. 4: 1052. https://doi.org/10.3390/su10041052
APA StyleChen, C., Lan, Q., Gao, M., & Sun, Y. (2018). Green Total Factor Productivity Growth and Its Determinants in China’s Industrial Economy. Sustainability, 10(4), 1052. https://doi.org/10.3390/su10041052