Abstract
This paper employs directional distance function (DDF) and the global Malmquist–Luenberger (GML) productivity index to measure the green total factor productivity (GTFP) growth of China’s 36 industrial sectors from 2000 to 2014. Based on this, this paper ascertains the determinants of GTFP from the perspectives of institution, technology, and structure, and the determinant factors that affect GTFP are empirically tested by a dynamic panel data (DPD) model. The research shows that, considering energy consumption and environmental undesirable outputs, the industrial GTFP goes backwards by 0.02% per year on average, and the contributions of GTFP to output growth are far from the target value of 50% in all industrial sectors, which indicates that the growth of industrial economy sacrifices resources and environment to a certain degree. In terms of the determinant factors of GTFP, environmental regulation does improve the GTFP, while environmental regulation is difficult to promote GTFP by the route of technological innovation. Compared with technology importation, the driving effect of independent research and development on GTFP is obvious, especially promoting the GTFP of moderately and lightly polluting industries, while the driving effect in heavily polluting industries is poor. Endowment structure and property right structure play a positive role in improving GTFP, but the impacts of capital structure and energy structure on GTFP are poor.
1. Introduction
As the largest developing country in the world, since reform and opening up, China has created phenomenal rates of growth with an average annual rate of 9.8% for 34 consecutive years [1]. It is well known that China’s growth is mainly driven by input and investment, and huge investment has entered into the industrial sectors, which makes the industrial economy become the engine of growth. In the past 40 years, the industrial added value to GDP remained 37–45%, and the contribution of industry to economic growth was over 40% [2]. However, the extensive expansion of industry has caused resources exhaustion and environmental deterioration. For instance, we estimated that as the main industry of energy consumption, industrial energy consumption accounts for more than 70% of China’s total energy consumption, and industrial CO2 emissions contributes more than 80% of all the CO2 emitted in China. The result is that China is becoming a big industrial country but still does not turn into an industrial power. At present, China’s economy has entered into the “New Normal”, which has three main characteristics: the economy has shifted gear from the previous high-speed to medium-to-high speed growth, the economic structure is constantly being improved and upgraded, and the economy is increasingly driven by innovation instead of input and investment. Against this background, China’s industrial economy is being confronted with internal and external constraints and challenges. Domestically, the carrying capacity of resources and environment has reached its limit. From abroad, China’s industry is facing new competition and challenges brought by the global green industrial revolution. Therefore, it is essential to develop a new growth pattern that can break the resources and environment constraints and improve sustainable industrial competitiveness. The “green growth”, a term rarely heard before 2008, has burst onto the international policy scene over recent years [3]. In fact, green growth comes from sustainable development which can be treated as a short-term or medium-term strategy or tool to achieve the goals of sustainability. Actively responding to the call for green growth by the United Nations, the OECD, the World Bank, etc., the Chinese government strongly promotes a low-carbon economy, green economy, and ecological civilization in recent years. The Chinese “13th Five-Year Plan”, which was released in 2016, listed “green development” as an explicit national strategy. In July 2016, China issued the “industrial green development plan (2016–2020)”, which is the first guiding document for industrial green development in the new period.
As the core issue in the age of sustainable development, there are many studies including qualitative and quantitative analysis on green growth. One of the most important aspects in the quantitative research is the assessment of sustainability, or more specifically, the measurement of green growth. An appropriate measure of green growth is essential for assessing the effect of the reform conducted by the government. The common approach to evaluate green growth is to establish an evaluation index system which has been widely adopted by international organizations and governments. For instance, OECD [4] established a green growth indicators system, which includes four first-class targets, 15 secondary indicators and a number of tertiary indicators to monitor the progress of green growth. The Chinese government constructed the green development index system and published the Chinese green development index of 31 provinces in 2017 for the first time. Within the assessment framework of green growth, scholars extended the relevant studies to the industry. Chen et al. [5] constructed an evaluation index system of China’s industrial green development, which criterion layer was made up of industrial green output, industrial green efficiency, industrial green innovation, and industrial green policy. On this basis, an evaluation system comprised of 12 secondary indices and 32 tertiary indices was developed.
Building a relatively perfect green growth index system involves the selection and quantification of numerous indices, and therefore in the academic field, the more frequently used approach to evaluate sustainable growth is measuring productivity. Because productivity is not directly observable, many researchers are interested in estimating the total factor productivity (TFP). Traditionally, a rising share of TFP in output growth was taken as the standard for judging whether the growth pattern had been transformed to a sustainable growth model; i.e., the extensive growth pattern based on the continued expansion of inputs was unsustainable and that only the intensive growth pattern, which relied on TFP growth, was sustainable in the long run [6,7,8,9]. Since Chen et al. [10] initiated the study of China’s industrial productivity, there was a big surge of TFP estimates in Chinese industry. The measuring methods included the Solow residual method, C-D production function, translog production function, stochastic frontier analysis (SFA), data envelopment analysis (DEA), etc. For example, Cao et al. [11] estimated productivity growth for 33 Chinese industries covering 1982–2000. The study showed that the main source of output growth was capital accumulation. TFP growth was 2.5% per year, and its growth was quite varied—many energy industrial sectors showed negative growth rates while the electrical machinery, paper and allied products, etc. had high growth rates exceeding 4% per year. Chen et al. [12] estimated the TFP growth of China’s 38 industrial sectors from 1981 to 2008 and found the aggregated growth rate of industrial productivity was 6.7%. Moreover, the light and high-tech industrial sectors such as the manufacturing of apparel, cultural articles, computers and electronic equipment, and transport equipment, grew rapidly in TFP with rates of 11.1%, 8.9%, 8.4%, 7.7%, respectively, while slowly growing sectors were mostly heavy industries.
Although it is reasonable to use TFP growth to explain the sustainable development of industry, traditional TFP usually cannot reflect the value of natural resources and the negative externality of environmental pollution (in the previous literature, most scholars estimated TFP based on labour, capital, and good outputs, and few of them considered the resources and environmental factors), which bring challenges for measuring TFP accurately and analysing sustainable development scientifically [13]. In fact, resources and environmental factors have vital impacts on outputs, and the rapid growth of China’s economy, especially its industrial economy, is at the expense of the high intensity of resource consumption and environmental pollution to a large extent. This means that using traditional TFP to guide the real economy might lead to policy failures. Superior to parametric methods, DEA methods do not require setting the functional form of the model in advance and can take various inputs and outputs into consideration [14]. Therefore, some researchers are beginning to consider resources and environmental factors on the basis of traditional production factors. Chen [13] pointed out that it was relatively easy to incorporate the resources into production function and that most literatures used energy consumption as a new input factor. However, it was more complicated to deal with environmental factors. The earlier studies only regarded environmental pollution as a by-product of the production process, which made the good outputs and bad outputs impossible to distinguish accurately [15]. Until Chambers et al. [16] and Chung et al. [17] put forward the directional distance function (DDF), environmental pollution was treated as a kind of undesirable output, so that the environmental factors that restricted the production process could be explained reasonably. This approach simultaneously credits reductions in bads and increases in goods in the estimation of a production frontier under the framework of DEA [18]. Correspondingly, Chung et al. [17] applied DDF into the Malmquist model and developed the Malmquist–Luenberger (ML) productivity index. The TFP growth measured by computing the change of the ML index could be called green total factor productivity (GTFP) growth (the concepts of green total factor productivity, GTFP, green productivity, and green TFP, are the same in this paper). The approach has been wide applied in the studies of efficiency and productivity [19,20,21,22,23,24].
However, the conventional DDF and ML index have some drawbacks, and thus various improved methods are being developed to meet the needs of research, such as the non-radial DDF [25], the slack-based measure (SBM) [26,27,28], the Metafrontier ML index [29,30,31], the global ML index [32,33], etc. Each improved method has their own advantages, and among them, the global ML (GML) productivity index proposed by Oh [32] is circular and can overcome the potential linear programming infeasibility problem in measuring cross-period DDFs, which has been widely used in the studies of productivity growth under the constraints of energy and environment in recent years. For example, Ananda and Hampf [34] applied the GML index, which accounted for undesirable outputs to evaluate the productivity trends in the Australian urban water sector. Fan et al. [35] used the GML index to estimate the total factor CO2 emission performance of 32 industrial sub-sectors in China’s Shanghai city over 1994–2011. Tao et al. [36] employed the GML index to measure and decompose green productivity growth for three major urban agglomerations in China. This paper aims at the productivity estimates of China’s industry, and for the past few years, there have been wide applications of DDF and its modified approaches to estimate the green productivity of China’s industry, including the aggregate level, sector level, firm level analysis, etc., and we survey some related literature in Table 1.

Table 1.
Green total factor productivity (GTFP) estimates for China’s industry in the literature. SBM: slack-based measure; DDF: directional distance function; ML: Malmquist–Luenberger; DEA: data envelopment analysis; GML: global ML.
Because GTFP represents the quality contribution of industrial growth, which is the important criterion of industrial green growth, the green productivity growth of China’s industry has attracted strong interest by researchers. This paper has some common ground with the above literature, such as focusing on the GTFP growth of Chinese industry, while our study improves the existing research in the following aspects: firstly, compared with the studies of Li and Tao [37], etc., this study analyses the GTFP growth covering China’s whole industrial sectors. The related studies based on the sub-industries cannot reflect the overall trends of industrial GTFP and this study fill in this gap. Secondly, as previously mentioned, the GML index based on DDF represents the development and improvement of the ML index. This paper extends the study of Chen and Golley [18] and adopts the GML index to measure the GTFP growth of China’s industry, which makes the GTFP circular and transitive, and avoids the problems of spurious technical regress and linear programming infeasibility. Thirdly, this paper better identifies the industry heterogeneity and constructs a more complete framework for analysing the determinants of GTFP. In relation to the extant literature, most studies adopt the assumption of homogenous industry, or simplify divide the industrial sectors based on the existing categories, such as Chen [23], which does not take a closer look at industry heterogeneity according to the feature of industrial pollutant emissions. This study insists on the concept of industry heterogeneity and adopts a new index to divide industrial sectors by calculating the intensity of industrial pollutant emissions which breaks the conventional categories of industrial sectors. Meanwhile, based on the measured green productivity, the existing studies on the determinants of GTFP are fragmented and lack systematic framework. This means different determinant factors cannot be classified reasonably. To our knowledge, this paper is the first attempt to construct the framework of the determinants of green productivity from the perspectives of institution, technology, and structure. Particularly, we investigate the role of structural factors based on the industrial-sector level, which makes up for the deficiency of the existing studies only examining the total structural effect but not examining the structural effect of each industrial sector.
In fact, the problems of resources and environment in the process of rapid growth not only appear in China, but also appear in many developing countries, which are now at a stage of accelerated industrialization. Until now, except Chinese scholars, researchers from developing countries seem insufficiently concern about the issues of green productivity, and thus the transformation of industry from traditional growth model to green growth model is not only important for China to achieve higher quality growth, but also provide reference for other developing countries. The aim of our study is to provide a quantitative reference for evaluating green growth level and designing effective green growth policies by using China’s industry as a case study. Here, we put the energy consumption and environmental undesirable outputs into the TFP measuring framework and adopt the DDF and GML productivity index to measure the GTFP growth of 36 China’s industrial sectors from 2000 to 2014. According to the measurement results, we analyse the characteristics of GTFP growth and investigate the industry heterogeneity. Furthermore, we ascertain and examine the determinant factors of GTFP based on the framework of institution, technology, and structure. The rest of this paper is organized as follows. Section 2 introduces the methods of DDF and GML index and discusses the data. Section 3 gives and analyses the measuring results. Section 4 explores and tests the determinants of industrial GTFP. Section 5 is the conclusion.
2. Method and Data
2.1. DDF and GML Productivity Index
Based on Fare et al. [43], the input–output technology structure, which includes the good outputs and the bad outputs, is constructed; we call it green production technology. The production possibility set (PPS) is shown as follows:
where the denotes the vector of inputs, the denotes the vector of desirable outputs, and the denotes the vector of undesirable outputs.
The green production technology provides the production possibility frontier when considering the undesirable outputs. On this basis, we can calculate the distance of each decision-making unit (DMU) to the production possibility frontier by DDF. The form of DDF proposed by Chung et al. [17] is expressed as:
where g is the direction vector, and the β is the maximum possible multiple of good outputs y increase and bad outputs b decrease. The DDF represents the maximum multiple of the expansion of the output vector (y, b) under the input vector x and the direction vector g.
The corresponding Malmquist–Luenberger productivity index (MLPI) developed by Chung et al. [17] can be used to measure the GTFP growth, which is measured by computing the change of the MLPI between time t and t + 1. From the view of output, MLPI from time t to t + 1 is constructed as:
However, the geometric mean form of the MLPI has some drawbacks: it is not circular or transitive and it may face problems of spurious technical regress and linear programming infeasibility when measuring cross-period DDFs [32,44]. Based on this, a global benchmark technology should be defined as , which is an improved version of the global Malmquist productivity index (GMPI). As shown in Figure 1, the envelopes all contemporaneous benchmark technologies by establishing a single reference PPS. Pastor and Lovell [45] first proposed the GMPI, and traditional TFP growth can be measured by computing the change of GMPI. Moreover, GMPI can be decomposed into technical efficiency change (GMECH) and technical progress change (GMTCH):
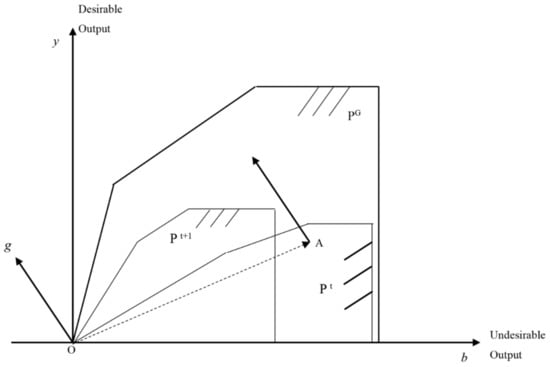
Figure 1.
The global Malmquist–Luenberger productivity index.
Due to the GMPI not incorporating the undesirable outputs, it is necessary to define a global DDF based on the global benchmark technology:
where N is the amount of input factors, M is the amount of desirable outputs, W is the amount of undesirable outputs, and is the weight of each cross-sectional observation.
Correspondingly, the global Malmquist–Luenberger productivity index (GMLPI) can be expressed as follows:
similar to the GMPI, the GMLPI can be decomposed into two parts: a technical efficiency change index (GMLECH), and a technical progress change index (GMLTCH), which can be calculated as
The GMLPI is circular and transitive and can overcome the infeasibility problem. In this paper, the GTFP growth is measured by computing the change of the GMLPI between time t and t + 1. In terms of economic connotation, the GMLECH can reflect the institution innovation, experience accumulation, scale economy, and other factors, and the GMLTCH can embody the innovation and improvement of production technology and other factors. The GMLPI being larger (smaller) than 1 indicates the growth (decline) of green total factor productivity. Similarly, the GMLECH being larger (smaller) than 1 indicates the improvement (deterioration) of green technical efficiency, and the GMLTCH being larger (smaller) than 1 indicates the progress (regression) of green technology.
2.2. Indices and Data
Measuring GTFP growth requires obtaining the indices of inputs, desirable outputs, and undesirable outputs. As this paper discusses the growth of GTFP and its decompositions from the industrial sector-level perspective, there is a special requirement for the availability of data and the consistency of statistical calibre. The 41 double-digit industrial sectors are selected according to the standard of Classification and Code Standard of National Economy Industry (GB/T4754-2011) issued by the China National Bureau of Statistics. It is noted that we delete four sectors, i.e., “Processing of Timber, Manuf. of Wood”, “Other Manuf.”, “Utilization of Waste Resources”, and “Repair Service of Metal Products, Machinery and Equipment” due to their incompleteness of data. Moreover, we merge and split some sectors to maintain the consistency of statistical calibre: the sectors of “Mining of Other Ores” and “Non-metal Mining” are merged into the new sector “Non-metal Mining”; the sectors of “Manuf. of Automobiles” and “Manuf. of Railway, Ship, Aerospace, and Other Transport Equipment” are merged into the sector “Transport Equipment”; the sector “Manuf. of Rubber and Plastics Products” is split into the sectors of “Rubber Manuf.” and “Plastics Products Manuf.”, and, finally, we set up the input-output panel data of 36 industrial sectors from 2000 to 2014 (see detailed data in Tables S1–S9).
Input factors: The annual average number of employees of each industrial sector is selected to represent the labour input, and the original data come from the 2001–2015 China Industrial Statistical Yearbook and China Economic Census Yearbook [46,47]. Considering that energy is the main resource of industrial production and energy consumption is the main source of undesirable outputs, the energy consumption of each industrial sector is selected to represent the resource input, and the original data come from the 2001–2015 China Energy Statistical Yearbook [48] and the China National Bureau of Statistics. It is reasonable to adopt the capital stock to reflect the capital input, but the data of the capital stock of each industrial sector are not available through China’s official statistics. Many scholars have done many studies on how to correctly estimate the industrial sector–level capital stock [49,50]. This paper uses the perpetual inventory method (PIM) to estimate the capital stock of China’s industrial sectors based on the relevant representative studies. The PIM is Kt =It + (1 − wt) Kt−1, where Kt and Kt−1 denotes the capital stock in time t and t − 1, respectively. It denotes the incremental fixed asset investment at 2000 constant price, wt denotes the depreciation rate. Firstly, industrial fixed asset investment in 2000 is used as the capital stock in the base period. Secondly, the net added value of the fixed assets of two adjacent years is used as the incremental fixed asset investment. On this basis, the price index of the investment of fixed assets is used as a deflator index to adjust the sequence of investment to the 2000 constant price. Finally, referring to the methods of Chen [51], Li and Tao [52], we determine the depreciation rate as follows:
(accumulated depreciation) t = (original value of fixed assets) t − (net value of fixed assets) t,
(depreciation in this year) t = (accumulated depreciation) t − (accumulated depreciation) t−1,
(depreciation rate) t = [(depreciation in this year) t]/[(original value of fixed assets) t−1].
Output factors: Output indices include desirable outputs and undesirable outputs. To measure the desirable outputs, given that we put the energy consumption, which has the property of intermediate input, into the framework of GTFP, we adopt total industrial output value, which also includes the cost of intermediate input, to represent the desirable output. The original data come from the 2001–2015 China Industrial Statistics Yearbook [46]. Moreover, the producer price index published by the China National Bureau of Statistics is used to deflate the total industrial output value to the 2000 constant price. Industrial emissions of carbon dioxide (CO2), industrial emissions of waste water, industrial emissions of waste gas, and industrial production of solid waste are used as the undesirable outputs. The original data of industrial pollutant emissions come from the China Environmental Statistics Yearbook, the China Environment Yearbook, and the Annual Statistic Report on Environment in China [53,54,55]. Due to the CO2 data not being available, we estimate the CO2 emissions of 36 industrial sectors. According to the method provided by Chapter 6, Volume 2 of the 2006 IPCC guidelines for national greenhouse gas inventories [56]:
where C represents the CO2 emissions (in units of 10,000 tons), and represents the consumption of three types of primary energy; i.e., coal (in units of 10,000 tons), crude oil (in units of 10,000 tons), and natural gas (in units of 100 million cubic meters). NCV represents the average lower heating value of the three energy sources released in the appendix of the 2015 China Energy Statistics Yearbook [48]. CEF represents the carbon emission factor provided by the 2006 IPCC guidelines for national greenhouse gas inventories [56]. It is noted that IPCC provides the carbon emission factor of bituminous coal and anthracite but does not directly provide the carbon emission factor of coal; thus, we set the weight of bituminous coal at 80% and the weight of anthracite at 20% to get the carbon emission factor of coal by the weighted average method. COF represents the carbon oxidation factor. The values of 44 and 12 are the molecular weights of carbon dioxide and carbon, respectively. The above method is used to estimate the CO2 emissions of China’s industrial sectors from 2000 to 2014, and the parameters of CO2 emissions estimation are listed in Table 2.
Table 2.
Parameters of CO2 emissions estimation.
Meanwhile, to further analyse the difference of GTFP growth among different types of industry, the 36 industrial sectors are classified into heavily polluting industries, moderately polluting industries, and lightly polluting industries. Specifically, first, we make the data of “waste water emissions of per industrial output”, “waste gas emissions of per industrial output”, and “solid waste production of per industrial output” dimensionless:
where i stands for the industrial sectors, n stands for the source of pollutants, t stands for the time, stands for the pollutant emissions and stands for the corresponding standardized values; and stands for the maximum and minimum values of pollutant emissions, respectively. Second, the analytic hierarchy process (AHP) method is used to determine the weight of each pollutant. The AHP method is a kind of qualitative and quantitative analysis of multiplicate objective decisions. Dividing the three types of industry is based on the intensity of industrial pollutant emissions, and the core is to determine the weights of the three indices, i.e., waste water, waste gas, and solid waste in the system of industrial pollutant emissions. Determining the weights requires not only data analysis, but also requires making reasonable qualitative comparison in line with the actual conditions of China’s industrial development. Therefore, AHP is suitable for our study. In reality, industrial pollutant emissions can be regarded as a decision target, and the waste water, waste gas, and solid waste can be seen as the elements of criterion layer. Based on this, an k × k(k = 3) order comparison matrix A = (anm) is developed according to the expert consultation. We invite experts in the field repeatedly answer questions in accordance with the anm evaluation rules, namely considering the decision target, pairwise comparisons on indices are made to determine which index is more important and to what degree. The comparison matrix meets the following conditions: anm > 0; ann = amm = 1; anm = 1/amn. For comparison matrix A, the maximum eigenvalue λmax and the corresponding eigenvector W of the eigenvalue can be solved by the root value method:
where wn is the n-th component of the eigenvector W, i.e., the weight. After the consistency test, we determine the weight of waste water as 0.40, the weight of waste gas as 0.37, and the weight of solid waste as 0.23. Based on this, the intensity of pollutant emissions of different industrial sectors in each time is calculated as
where is the intensity of pollutant emissions of i-th industrial sector in time t. Finally, by calculating the mean of the intensity of pollutant emissions from 2000 to 2014, we can get the categories of the three types of industry. Industrial demarcation is presented in Table 3.
Table 3.
Three types of industry and corresponding industrial sectors.
3. Measuring Results and Discussion
According to the data of inputs and outputs of China’s 36 industrial sectors during 2000–2014, we calculate the growth of GTFP and its decompositions. To compare the green TFP growth with the traditional TFP growth, the growth of traditional TFP and its decompositions are also measured. Traditional TFP growth is measured by GMPI, and the TFP measuring framework only includes two inputs, i.e., labor and capital, and one output that is the total industrial output value.
3.1. Green TFP Growth
The results of the growth of TFP and its decompositions (GMPI, GMECH, GMTCH) and the growth of GTFP and its decompositions (GMLPI, GMLECH, GMLTCH) are reported in Table 4. The GMLPI is the dynamic reflection of China’s industrial green growth; we can see that, during the whole study period, the average value of GMPI is 1.0910, while the average value of GMLPI is 0.9998, which means that China’s industrial TFP grows 9.1% per year on average, if we ignore resources and environmental factors. If we have considered energy consumption and the pollutant emissions correctly, the green TFP of China’s industry goes backwards by 0.02% per year on average, which means that energy consumption and pollutant emissions have caused a loss of performance of the industrial economy; i.e., China’s industrial growth is largely at the expense of energy consumption and environmental pollution, which further demonstrates that most studies have overestimated China’s industrial TFP growth. Furthermore, we divide the whole period into three periods, and calculate the GTFP growth in 2000–2005, 2005–2010 and 2010–2014, respectively. As shown in Table 5, we find that the average value of GMLPI in these three periods is 0.9964, 0.9967 and 1.0079, respectively. That means that during 2000–2014, the whole industry had not achieved green growth, while in the three separate periods, the GTFP presented an increasing trend, especially in 2010–2014, where industrial GTFP achieved the growth of 0.79%. This indicates that, in the promotion of green growth strategy, energy conservation and emission reduction policies have achieved positive results in the industrial sector, so that China’s industrial growth is beginning to transform from an extensive pattern to intensive pattern, and the GTFP growth has turned negative into positive. Comparing the traditional TFP growth in the three periods, interestingly, traditional TFP growth is 11.78%, 7.61% and 7.70%, respectively. It is found that traditional TFP achieved the fastest growth in 2000–2005, while in the same period the GTFP growth was slowest (in fact went backwards by 0.36% per year on average), which simply proves the emission growth of China’s industry is positive, and is therefore penalised in the “green” estimate. In reality, from 2002, China’s heavy industries are promoted once again, and after 2010, China’s industry gradually moves towards low-carbon and green growth. In terms of the decompositions, overall, the GMLECH is larger than GMECH, while the GMLTCH is smaller than GMTCH. Meanwhile, green TFP growth is mainly promoted by the improvement of GMLTCH, and the decline of green TFP is mainly affected by the regression of GMLTCH. During the study period, the GMLECH decreases by 0.3% per year on average, while the GMLTCH increases by 0.27% per year on average. During the periods of 2000–2005, 2005–2010 and 2010–2014, the GMLECH increased by −0.14%, −0.06% and −0.78%, respectively; while GMLTCH increased by −0.22%, −0.28% and 1.59%, respectively. Therefore, it was because of the promotion of green technical progress that the GTFP presented the growing trend from 2010–2014. We explain this trend further as follows.
Table 4.
The TFP (decompositions) and GTFP (decompositions) growth. GMPI: global Malmquist productivity index; GMLPI: global Malmquist–Luenberger productivity index; GMECH: GMPI technical efficiency change; GMLECH: GMPLI technical efficiency change; GMTCH: GMPI technical progress change; GMLTCH: GMLPI technical progress change.
Table 5.
The TFP (decompositions) and GTFP (decompositions) growth in different periods.
Figure 2a depicts green TFP growth in each period; overall, the GTFP has a rising trend with fluctuation, while there was an obvious drop of GTFP in 2010–2013. The GMLECH increased in this period but the GMLTCH declined; thus, the GTFP went backwards in this period and is affected by the regression of GMLTCH. The reason for this could be that, after the economic crisis, despite short-term policy stimulation, the industrial economy lacked motivation because the growth power had not been transformed from the old pattern to the new pattern, and, given the strong constraints of energy conservation and emission reduction, the industrial enterprises lacked the motivation for carrying out technological innovation, which made GMLTCH go into reverse. With the continuous industrial restructuring and transformation, the GTFP rebounded from 2013 to 2014, and the driving force of this rebound was the accumulation of green technical progress. Therefore, under the constraints of resources and environment, China’s industry should, on the one hand, improve the contribution of the green technical efficiency through institution innovation and organisation innovation and, on the other hand, strengthen the driving function of green technical progress and enhance research and development (R&D) intensity and technological innovation to improve the sustainable competitiveness of industry. In terms of the specific industrial sectors, from 2000 to 2014, on average, the traditional TFP growth was higher than the GTFP growth was in most industrial sectors; the GTFP of 19 industrial sectors had increased; the GTFP of two industrial sectors had not changed; and the GTFP of the other 15 industrial sectors had decreased. Although the detailed estimated results are different because of the various measuring approaches, studying periods, data selections, etc., our main findings are consistent with some relevant studies, such as Chen and Golley [18], which observed the trend of GTFP growth from 1980 to 2010. They found industrial TFP grew at an average annual rate of 5.5% compared with GTFP growth of 1.8%, and their findings also indicated that the rise and fall of GTFP growth was driven by the rise and fall in technical change. In terms of the trends of GTFP growth, our study is different from their findings: their research showed GTFP growth had declined since the peak of 4.2% in 2002 to 0.5% in 2010, and our research indicated that the growth of GTFP presented a rising trend with fluctuation since 2000, and before experiencing an obvious drop of GTFP in 2010–2013 to peak at 1.91% during 2013–2014. The trend we obtained is consistent with Wang and Liu [57], which showed that GTFP kept growing from 2004–2008, and expressed the trend of decreased first and then increased during 2009–2012.
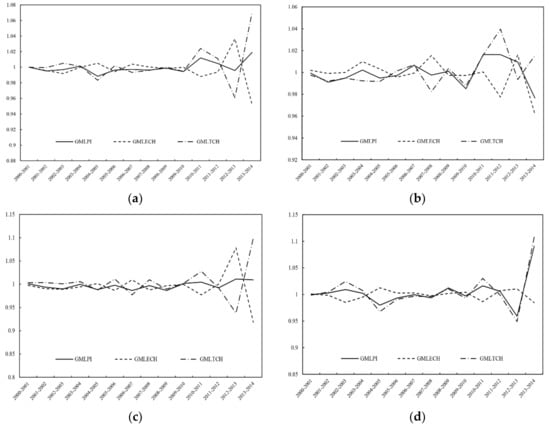
Figure 2.
Dynamic evolution of GTFP and its decompositions in whole industry and three types of industry. (a) Whole industry; (b) Heavily polluting industries; (c) Moderately polluting industries; (d) Lightly polluting industries.
In terms of the three types of industry, the GTFP only grew in lightly polluting industries, and the GTFP of the heavily and moderately polluting industries went backwards to a certain degree. From 2000 to 2014, the GTFP growth in heavily polluting industries, moderately polluting industries, and lightly polluting industries was −0.09%, 0.29%, and 0.41%, respectively, which means that the lightly polluting industries not only consumed less energy and produced less emissions but also achieved the coordinated development of economy, resources, and environment, while the growth pattern was not transformed in the other two types of industry. Meanwhile, in terms of the GMLECH, from 2000 to 2014, the three types of industry failed to achieve the improvement of technical efficiency, and, in terms of GMLTCH, the three types of industry achieved technical progress, with the rankings lightly polluting industries (0.49%), moderately polluting industries (0.29%), and heavily polluting industries (0.10%). Combined with Figure 2b–d for further analysis, the trend of the growth of GTFP and its decompositions in three types of industry was similar but exhibited differentiation since 2010. The GTFP growth in heavily polluting industries was relatively weak, and the GTFP obviously went backwards from 2012 to 2013 due to the decline of technical progress, which could be affected by the short-term strong constraints of energy conservation and emission reduction that occupied the R&D investment. The technical progress of moderately polluting industries achieved rapid growth between 2013 and 2014, but the technical efficiency went down dramatically because the catch-up effect was completely released which made GTFP go backwards at the end of the period. For lightly polluting industries, the improvement of technical efficiency and technical progress was in the leading position. Although the GTFP went backwards from 2011 to 2013 due to the decline of technical progress, the GTFP achieved the fastest growth at the end of the period after adjustment.
3.2. Green Growth Accounting
Table 6 reports the green growth accounting of 36 industrial sectors. We can see that there are obvious differences of green growth among industrial sectors. The majority of the top 10 industrial sectors with the fastest growth of output are the equipment manufacturing industrial sectors that have high technology levels (these sectors are concentrated in the lightly polluting industries), such as “Transport Equipment”, “Electronic Equipment”, “General Machinery Manuf.”, and “Special Machinery Manuf.”. The GTFP growth of these sectors is at the forefront and the contributions of their GTFP are relatively high, which demonstrates that the advanced manufacturing industry plays a critical role in industrial transformation and upgrading. The only imbalance between output growth and GTFP growth appears in the sector of “Ferrous Metal Mining”, which has the highest output growth but a contribution of GTFP of only −6.5342; thus, the output growth depends more on the inputs of labour, capital and energy. We can see that this sector has the highest growth of energy consumption, with 13.37% average growth rate per annum.
Table 6.
The green growth accounting (2000–2014).
The majority of the last 10 industrial sectors with the slowest growth of output are the resources sectors and the light & textile sectors (these sectors are concentrated in the heavily and moderately polluting industries). The output growth in resources sectors such as “Petroleum Extraction” and “Non-Ferrous Metal Mining” is slow, and the contributions of their GTFP are low, which shows the disadvantage of high energy consumption and high emissions and illustrates the necessity of improving the technological innovation level and enhancing the constraints of energy conservation and emission reduction. The output growth in light & textile sectors like “Chemical Fibres Manuf.” and “Beverages Manuf.” is slow, and the contributions of their GTFP are negative, which indicates that the energy consumption and pollutant emissions in these sectors are relatively low, while the technological innovation and capability of organisational management are relatively poor, so that the industrial development in these sectors lacks market competitiveness. The GTFP contributions of all industrial sectors are far from the target of 50%, despite some industrial sectors having achieved rapid GTFP growth, which means that the contributions of factors are higher than are the contributions of green productivity in all industrial sectors. Therefore, China’s industrial growth is mainly driven by factors and has not been driven by innovation. From the perspective of the growth of inputs, the speed of labour growth in each industrial sector is relatively slow, while the speed of growth of capital and energy in each industrial sector is still fast, which is not only the significant characteristic of China’s industrial growth but also illustrates the fact that most industrial sectors still use either a resource-oriented or a capital-oriented production pattern.
Based on this, this paper provides judgement of China’s industrial green growth: although the GTFP increased during 2010–2014, and the GTFP in some sectors has achieved fast growth since the beginning of the new century, we cannot make the conclusion that China’s industry has realised green growth, considering that the industrial GTFP is no more than 1, the obvious heterogeneity of GTFP among industrial sectors, and that the GTFP contributions to the output are relatively low. In fact, we believe that the real green growth of China’s industrial economy is just starting out, and the green growth in the new period still has great potential.
4. The Determinants of Industrial GTFP
China’s industry is still at the stage of transition from a traditional growth pattern to a green growth pattern. During this process, industrial green growth is facing a series of institutional obstacles, technological bottlenecks, and structural contradictions. Solving these problems can cultivate new driving forces of China’s industrial green growth. Based on the above measured industrial GTFP (it is necessary to adjust the measuring results to obtain the absolute value of GTFP: according to Qiu et al. [58], the absolute value of GTFP is obtained through multiplication by GMLPI), the determinants of industrial GTFP from the perspectives of institution, technology, and structure are determined, and the determinant factors that affect GTFP are empirically tested by a dynamic panel data (DPD) model based on GMM estimation.
4.1. Model and Variables
Panel data can be used to analyse individual dynamic behaviour through modelling. On the basis of a panel data model, if the lagged item of a dependent variable is used as an independent variable, it will be the DPD model. The independent variable is easily related to a random disturbance item in the DPD model that will result in an endogenous problem. If a traditional estimation method is used, biasness and nonconformity of parameter estimation will be generated. The differenced generalized method of moments (DIF–GMM), proposed by Arellano and Bond [59], and the system generalized method of moments (SYS–GMM), proposed by Arellano and Bover [60] and Blundell and Bond [61], can be used to solve the endogenous problem. Based on that, DPD models based on GMM estimation are established to test the determinants of GTFP, as follows:
where i denotes different industrial sector; t denotes the year; GTFP, INS, TEC, and STR denote the variables of green total factor productivity, institution, technology, and structure, respectively; denotes the individual effect and denotes the random error term. The aim of setting is to test whether there is a turning point between GTFP and institution, and the aim of setting is to test the indirect effect of institution on GTFP by the route of technology. Then, the determinant factors are explained, and the selection of proxy variables and the data sources are also explained.
The first determinant is institution, INS, which includes three variables: command-control environmental regulation (CCR), economic-incentive environmental regulation (EIR), and comprehensive environmental regulation (ER). Environmental regulation is the most important policy system in China’s formal environmental institution, while different scholars disagree about its effect. The traditional hypothesis supposed that environmental regulation would lead to higher costs and damage the productivity and competitiveness of enterprises [62,63]. However, Porter [64] and Porter and Van der Linde [65] thought that, from the point of a dynamic long-term stage, strict and appropriate environmental regulation would trigger an “innovation compensation effect”, which could make the regulated enterprises improve the level of resource allocation, stimulate technological innovation, and promote the environmental performance and productivity. In reality, the tools of environmental regulation are abundant, and they can be roughly divided into three types: command-control environmental regulation, economic-incentive environmental regulation, and public-participant environmental regulation. Considering that the study object of this paper is industrial sectors, the command-control environmental regulation and the economic-incentive environmental regulation are studied. Specifically, the proxy variables of CCR are “emission standard-meeting rate of industrial wastewaters”, “emission standard-meeting rate of industrial sulphur dioxide”, “emission standard-meeting rate of industrial soot”, “emission standard-meeting rate of industrial dust”, and “comprehensive utilisation rate of industrial solid wastes”. Moreover, the entropy method is used to combine the five variables into one. The proxy variable of EIR is the emission charges of industrial waste water and waste gas, and the entropy method is used to combine the two variables into one. Finally, the entropy method is used to further combine CCR and EIR into ER.
The second determinant is technology, TEC, which includes two variables: independent R&D (RD) and technology importation (FI). Independent R&D is one important route for technological innovation. In addition, under economic globalisation, technology importation is the other important route for technological innovation. For developing countries, introducing new knowledge, new inventions, and new creations from abroad is an important way of narrowing the gap. Technological innovation is not only an important driving force for traditional productivity growth but is also the key to promoting growth of green productivity. Technological innovation plays an important role in optimising energy structure, promoting resources conservation and recycling, and reducing pollution, etc. Based on the industrial characteristics and the availability of data, “R&D expenditure” and “expenditure for assimilation of technology” are used as the proxy variables of RD, and “expenditure for importing foreign technology” and “expenditure for purchase domestic technology” are used as the proxy variables of FI. Furthermore, we use entropy method to get the index of RD and FI.
The third determinant is structure, STR, which includes four variables: endowment structure (EN), capital structure (CA), property right structure (PR), and energy structure (ES). Optimising structure is an important way to realise the rational flow and optimal allocation of production factors, stimulate industrial growth potential, and promote industrial innovation. Scholars seldom consider the industrial internal structural factors when studying structural adjustment. Therefore, we study the structural factors that impact GTFP from the perspectives of endowment structure, capital structure, property right structure, and energy structure. EN is expressed by the ratio of capital to labour. The capital refers to the capital stock, which has been estimated above, and the labour is expressed by the annual average number of employees. CA is expressed by the total industrial output value by foreign direct investment accounting for the total industrial output value. PR is expressed by the total industrial output value of state-owned and state-holding enterprise accounting for the total industrial output value. ES is expressed by the proportion of total electricity consumption in the total energy consumption.
On this basis, China’s industrial panel data, which is composed of the above variables from 2000 to 2014 is constructed; the original data come from the China Statistical Yearbook [66], the China Industrial Statistical Yearbook [46], the China Economic Census Yearbook [47], the China Energy Statistical Yearbook [48], the China Statistical Yearbook of Science and Technology [67], the China Environmental Statistics Yearbook [53], and the China National Bureau of Statistics. The statistical description of variables is shown in Table 7 (see detailed data in Tables S10–S17).
Table 7.
Statistical description of variables. INS: institution; CCR: command-control environmental regulation; EIR: economic-incentive environmental regulation; ER: environmental regulation; TEC: technology; STR: structure; RD: independent R&D; FI: technology importation; EN: endowment structure; CA: capital structure; PR: property right structure; ES: energy structure.
4.2. Results and Discussion
The Monte Carlo simulation experiment indicates that DIF–GMM is easily affected by weak instrumental variables, while this problem is effectively solved by SYS–GMM through adding the quantity of instrumental variables. As the endogenous problem can be better controlled, the biasedness of estimation by SYS–GMM is less and its estimation value is more effective; thus, SYS–GMM is adopted in this paper. For the DPD model, Windmeijer [68] modified the standard deviation of two-stage estimation to make two-stage robust estimation better than one-stage robust estimation; thus, two-stage estimation is adopted for equations to conduct iteration, and estimation results under robust standard error are selected. The regression results in Table 8 are based on the full sample size, and the regression results in Table 9 are based on the sample of three types of industry. From the regression results of 15 equations set by the DPD model in Table 8 and Table 9, the p values corresponding to the Sargan statistic of all equations are above 0.05, i.e., the selected instrumental variables of each equation are effective. The serial correlation test of the residual second-order indicates that the original hypothesis “the disturbance term does not have autocorrelation” can be accepted. p values of the coefficient joint test are all zero, indicating that the model is highly significant.
Table 8.
SYS–GMM estimation results of the determinants of GTFP.
Table 9.
SYS–GMM estimation results of the determinants of GTFP in three types of industry.
In terms of the institution, the coefficients of CCR, EIR, and ER in the first three equations of Table 8 are significantly positive at the 1% level, which indicates that environmental regulation can improve GTFP to a certain extent. Meanwhile, the coefficient of CCR is greater than is the coefficient of EIR, which illustrates that the more favoured means by which industrial enterprises are required to deal with environmental pollution is command-control environmental regulation; thus, the intensity of economic-incentive environmental regulation needs to be strengthened. In the last three equations in Table 8, which consider the quadratic terms, the monomial coefficients of CCR, EIR, and ER are positive, and the quadratic terms are negative but not significant under SYS–GMM estimation, which shows that there is no obvious turning point between environmental regulation and GTFP. The interaction items are almost not significant, which means that environmental regulation is difficult to promote GTFP by the route of technological innovation. That is to say, the driving effect of China’s industrial environmental regulation is more embodied in the terminal treatment that improves environmental performance.
In terms of the technology, the coefficients of RD are almost significantly positive, which indicates that strengthening the ability of industrial independent R&D can improve the GTFP obviously, which is related to China has increased investment in science and technology and made breakthroughs in key technologies, such as green manufacturing, in recent years. The coefficients of FI are either almost not significant or even negative, which shows that, compared with independent R&D, the driving effect of technology importation on industrial green growth is weak. The possible reason for this is that, the exporting countries or regions are reluctant to transfer their core technologies because they want to obtain the competitive advantage and keep the monopoly position; in this case, expensive technology importation cannot bring profitable growth. Meanwhile, it is easy to introduce some backward technologies if the countries or regions cannot identify the advanced technologies that will have some negative effects on resources and environment.
In terms of the structure, the EN plays a positive role in improving GTFP. On the one hand, capital deepening tends to be synchronous with heavy industrialization, and heavy industry tends to be synonymous with high energy consumption and high emission levels. On the other hand, capital deepening can improve productivity, and, as the structure of capital and labour becomes more reasonable, the positive effects of capital deepening may offset its negative environmental effect. The coefficients of CA are negative, which shows that the FDI has an adverse impact on GTFP and indirectly confirms that China might be the “pollution haven” in international industry specialisation, so the FDI quality in China’s industrial sectors remains to be improved. The coefficients of the PR are significantly positive, which means the reform of property right structure can improve the coordination between industrial growth and the environment. The optimisation of property right promotes the flow of factors, market competition, and resource allocation, and the joint development of state-owned and other ownership enterprises is conducive to promoting GTFP. The coefficients of ES are not stable, which may be associated with the structure of industrial energy consumption. In the past 15 years, the proportion of electricity consumption has been relatively low compared with fossil fuel consumption, and the thermal power related to high energy consumption and high pollution has made up the largest proportion of the electricity consumption.
From the view of industry heterogeneity, the determinant factors of industrial green growth in three types of industry are examined in Table 9. Seen from the perspective of the driving effect of environmental regulation, for the heavily polluting industries, ER has an inverted “U” relationship with GTFP. The strict environmental regulation has a direct impact on pollutant emissions and, thus, can improve GTFP in the short-term. However, with the intensity of environmental regulation continually increasing, the management space and operating space of enterprises are limited, which will constrain the GTFP. For moderately and lightly polluting industries, CCR has an inverted “U” relationship with GTFP, while EIR has an “U” relationship with GTFP. The green driving effect of CCR rises first and falls later, meaning that the standard of “one size fits all” is difficult to motivate technological innovation for enterprises with low pollutant emissions in the long-term. The effect of EIR on GTFP is the opposite; enterprises may increase costs at first, while making full use of market mechanisms can effectively allocate the emission reduction costs in the long term, which gives enterprises a strong internal motivation to conduct technological innovation and has a positive role in improving GTFP. Seen from the perspective of the technology, although the coefficients of RD are positive, they are not significant in heavily polluting industries. Heavily polluting industries are mainly composed of resources-oriented enterprises, which may ignore the pushing effect of technological innovation on GTFP. The moderately and lightly polluting industries are mainly composed of high-tech and cleaner production enterprises, so the driving effect of RD on industrial green growth is stronger. Meanwhile, the coefficients of FI in three types of industry are not significant. Seen from the perspective of the structure, the coefficients of EN are significantly positive in heavily and lightly polluting industries, while they are not significant in moderately polluting industries. The positive effect of EN in heavily polluting industries may arise from the positive effect of productivity growth that offset the negative effect of pollutant emissions, and the positive effect of EN in lightly polluting industries may arise from the inflow of high-tech capital. The coefficients of CA are negative in heavily and moderately polluting industries, while they are positive in lightly polluting industries. This means that the environmental standard in heavily and moderately polluting industries is relatively low and, to maintain international competitiveness, some enterprises are engaged in the production of polluting industries. The coefficients of PR are significantly positive in heavily and moderately polluting industries while they are not significant in lightly polluting industries, which is consistent with the reform focus of state-owned enterprises. In China, most state-owned enterprises are concentrated in heavily and moderately polluting industries, so the optimisation effect of property right structure is more prominent in these two types of industry. The coefficients of ES are not significant in every type of industry. This means that industrial energy structure is not reasonable, and that fossil fuels account for a large share of electricity consumption and that low electricity consumption cannot effectively improve the energy structure. In heavily and moderately polluting industries, thermal power occupies the largest proportion of electricity consumption, which directly contributes to substantial coal-fired pollutant emissions. In the long run, adjusting energy structure still has a long way to go.
Figure 3 summarizes the determinant factors of GTFP in three types of industry, which can provide empirical evidence for the three groups to promote green productivity from the aspects of institution, technology, and structure. It shows that, for heavily polluting industries, the key determinants of green productivity lie in the institution and structure; in particular, designing reasonable environmental regulation systems, avoiding blindly increasing the strength of regulations, and optimizing the endowment structure and property structure correctly is important for promoting GTFP. However, it does not mean that the technology factors are not important. Instead, the heavily polluting industries should pay more attention to the innovation of green technology, increase investment in energy conservation and emission reduction, and promote the technology spillover. For moderately polluting industries, institution, technology and structure are all the key factors influencing green productivity; in particular, it is significant to reasonably use the two types of regulations, i.e., command-control regulation and economic–incentive regulation, promote the independent innovation, and optimize capital structure and property right structure. Moreover, in the introduction of foreign capital, the moderately polluting industries should strengthen the identification of the advanced technologies. For lightly polluting industries, institution, technology, and structure are also the determinants of green productivity. Specifically, the key point of designing environmental regulation should focus on adopting the various economic-incentive regulation tools, promote the independent green technology innovation, and attract more high-tech technological capital in order to improve GTFP. Last but not least, the importance of optimizing energy structure should not be neglected by the three types of industries, that means we should pay more attention to the unsatisfactory result of the driving effect of energy structure for GTFP. Although in recent years, China’s investment scale in cleaner energy is the largest and fastest in the world, its overall utilization and efficiency are still relatively low. Therefore, it is it is crucial to develop new energy and renewable energy while reducing the consumption of fossil energy for Chinese industry in the future.
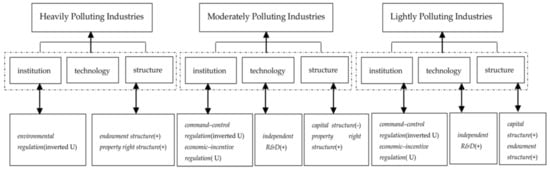
Figure 3.
The determinant factors of industrial GTFP in three groups.
5. Conclusions
5.1. Main Conclusions and Limitations
This paper incorporates energy consumption and environmental pollution into the calculation of TFP growth. The directional distance function (DDF) and the global Malmquist–Luenberger (GML) productivity index are used to measure the green total factor productivity (GTFP) growth of 36 of China’s industrial sectors from 2000 to 2014. Based on this, the paper ascertains the determinants of GTFP from the views of institution, technology, and structure, and the determinant factors that affect GTFP are empirically tested by a GMM dynamic panel data model. The main conclusions are as follows:
During the study period, China’s traditional industrial TFP grew by 9.1% while the GTFP went backwards by 0.02% per year on average, which demonstrates that the prospect of industrial growth is not optimistic when we add the resources and environment costs. GTFP growth is mainly promoted by technical progress, and the decline of GTFP is mainly affected by the regression of technology. From the perspective of heterogeneity, the GTFP of lightly polluting industries increases, while the GTFP in the heavily and moderately polluting industries declines. In specific industrial sectors, the GTFP of 19 industrial sectors increases, the GTFP of two industrial sectors does not change, and the GTFP of the other 15 industrial sectors decreases. In terms of green productivity contribution, the GTFP contributions of all industrial sectors are far from the target of 50%.
Environmental regulation improves GTFP to a certain extent; however, it is difficult to promote GTFP by the route of technological innovation. Independent R&D improves the GTFP, especially promoting the GTFP of moderately and lightly polluting industries, while it performs poorly in heavily polluting industries. The driving effect of technology importation on industrial green growth is weak, which may be related to the exporting countries monopolize core technologies and China’s industry lacks identification of advanced technologies. The endowment structure plays a positive role in improving GTFP, which features in the heavily and lightly polluting industries. The negative effect of capital structure on industrial green growth implies the hypothesis of a “pollution haven”, which features in heavily and moderately polluting industries. The green driving effect of property right structure is obvious. With the proportion of state-owned enterprises declining and the pace of structural reform of state-owned enterprises accelerating, property structure optimisation promotes industrial green growth. The impact of energy structure on industrial green growth is poor, which indicates the process of adjusting and optimising energy structure still has a long way to go.
Although the study has obtained some valuable results, there still exist some limitations. First, due to the data limits, this study only explores GTFP from the macro perspective, namely we have obtained some conclusions that reflecting the overall trend of industrial green productivity growth but we cannot analyse the internal performance of a specific sector. After gathering sufficient data, we can research the GTFP of some specific industrial sectors or industrial enterprises combining with the overall industrial research, which will help to get more micro conclusions. Second, regional analysis might be overlooked in this study. Future research can combine industrial analysis with regional analysis, due to China’s industry, in which such aspects as output level, innovation ability, energy conservation and emissions reduction, etc. have significant regional heterogeneity. Third, this study ascertains the determinants of GTFP from the dimensions of institution, technology, and structure. In each dimension, the consideration for the determinant factors is not quite comprehensive, especially in the aspect of institution. Since it is difficult to measure institution objectively, this study only investigates the different types of environmental regulation, while other institutional factors like resource and environmental pricing mechanism, etc. have not been reflected in the empirical analysis. Therefore, it is necessary to improve the research in developing and quantifying the determinants of industrial GTFP.
5.2. Trajectory of Foreseen Investment
At the end of the paper, we want to briefly review and prospect the investment trajectory of Chinese industry in recent years. Since the new century, the investment priorities of Chinese industry have been concentrated on traditional heavy industries, such as the sectors of steel, petroleum, coal, chemical industry, etc. In the last 10 years, the investment priorities have gradually transformed, especially in the recent 5 years, in which the transformation and upgrading trend of Chinese industry is obvious and new growth drivers are taking the place of old ones. On the one hand, Chinese industry has further addressed overcapacity, so the investments in traditional raw materials sectors, such as coal, steel, non-ferrous metals, etc. has fallen back. On the other hand, under the guidance of a series of national plans and policies such as “Made in China 2025” and the “Guideline on Emerging Sectors of Strategic Importance”, there is a big surge of the new technologies, new industries, new formats, and new market bodies in Chinese industry, which has a profound impact on the investments. First, high-tech industries and equipment manufacturing industries, such as the new generation of information technology (internet, big data, artificial intelligence, etc.), railway transportation equipment, additive manufacturing, and general aviation, etc. have become the new investment highlights. Second, green industries have expanded rapidly, and the investments in the sectors of energy conservation and environmental protection, resource recycling, new materials, new energy and new energy vehicles has grown rapidly. Third, in the new round of technological revolution and green revolution, new technologies have accelerated penetration to traditional sectors such as machinery, electronics, chemical, food, textile, etc. With the further integration of intelligent manufacturing and green manufacturing, the related industrial investments will have a huge potential market.
Supplementary Materials
The following are available online at http://www.mdpi.com/2071-1050/10/4/1052/s1, Tables S1–S17: The panel data for measuring the green total factor productivity growth of 36 of China’s industrial sectors and conducting the empirical test of the determinant factors of GTFP.
Acknowledgments
This work was supported by the China Postdoctoral Science Foundation Funded Project (2017M620026); the China Fundamental Research Funds for the Central Universities (310422107); the Project of Humanities and Social Sciences of Ministry of Education of China (17YJA790025); the Science and Technology Strategy Research Beijing Key Laboratory of Urban Green Development (160151101).
Author Contributions
Chaofan Chen is the main writer of this paper and contributed to the data collection, empirical modeling and results analysis. Qingxin Lan assisted in developing the overall research framework, evaluated the research findings, and conducted the discussion with the experts. Ming Gao contributed to the theoretical analysis and language editing. Yawen Sun sorted the empirical results, designed the figures and tables, and also made a contribution to the language revisions.
Conflicts of Interest
The authors declare no conflict of interest.
References
- National Bureau of Statistics of China. Available online: http://data.stats.gov.cn/easyquery.htm?cn=C01 (accessed on 17 November 2016).
- Yu, M. Create an upgrading version of Chinese industry under the new normal. Qiu Shi 2015, 1, 23–25. [Google Scholar]
- Mundaca, L.; Markandya, A. Assessing regional progress towards a “Green Energy Economy”. Appl. Energy 2016, 179, 1372–1394. [Google Scholar] [CrossRef]
- Organization for Economic Co-operation and Development (OECD). Green Growth Indicators 2017; OECD Publishing: Paris, France, 2017. [Google Scholar] [CrossRef]
- Chen, C.; Han, J.; Fan, P. Measuring the Level of Industrial Green Development and Exploring Its Influencing Factors: Empirical Evidence from China’s 30 Provinces. Sustainability 2016, 8, 153. [Google Scholar] [CrossRef]
- Solow, R.M. Technical change and the aggregate production function. Rev. Econ. Stat. 1957, 39, 312–320. [Google Scholar] [CrossRef]
- Kim, J.I.; Lau, L.J. The sources of economic growth of the East Asian newly industrialized countries. J. Jpn. Int. Econ. 1994, 8, 235–271. [Google Scholar] [CrossRef]
- Young, A. The tyranny of numbers: Confronting the statistical realities of the East Asian growth experience. Q. J. Econ. 1995, 110, 641–680. [Google Scholar] [CrossRef]
- Perkins, D.H.; Rawski, T.G. Forecasting China’s Economic Growth to 2025. China’s Great Economic Transformation; Loren, B., Thomas, G.R., Eds.; Cambridge University Press: New York, NY, USA, 2008; Chapter 20; pp. 829–887. [Google Scholar]
- Kuan, C.; Hongchang, W.; Yuxin, Z.; Jefferson, G.H.; Rawski, T.G. Productivity change in Chinese industry: 1953–1985. J. Comp. Econ. 1988, 12, 570–591. [Google Scholar] [CrossRef]
- Cao, J.; Ho, M.S.; Jorgenson, D.W. Industrial and aggregate measures of productivity growth in China, 1982–2000. Rev. Income Wealth 2009, 55, 485–513. [Google Scholar] [CrossRef]
- Chen, S.; Jefferson, G.H.; Zhang, J. Structural change, productivity growth and industrial transformation in China. China Econ. Rev. 2011, 22, 133–150. [Google Scholar] [CrossRef]
- Chen, S. Energy consumption, CO2 emission and sustainable development in Chinese industry. Econ. Res. J. 2009, 4, 41–55. [Google Scholar]
- Johnes, J. Data envelopment analysis and its application to the measurement of efficiency in higher education. Econ. Educ. Rev. 2006, 25, 273–288. [Google Scholar] [CrossRef]
- Färe, R.; Grosskopf, S.; Norris, M. Productivity growth, technical progress, and efficiency change in industrialized countries: Reply. Am. Econ. Rev. 1997, 87, 1040–1044. Available online: http://www.jstor.org/stable/2951341 (accessed on 5 December 2016).
- Chambers, R.G.; Chung, Y.; Färe, R. Benefit and distance functions. J. Econ. Theory 1996, 70, 407–419. [Google Scholar] [CrossRef]
- Chung, Y.H.; Färe, R.; Grosskopf, S. Productivity and undesirable outputs: A directional distance function approach. J. Environ. Manag. 1997, 51, 229–240. [Google Scholar] [CrossRef]
- Chen, S.; Golley, J. “Green” productivity growth in China’s industrial economy. Energy Econ. 2014, 44, 89–98. [Google Scholar] [CrossRef]
- Boyd, G.A.; Tolley, G.; Pang, J. Plant level productivity, efficiency, and environmental performance of the container glass industry. Environ. Resour. Econ. 2002, 23, 29–43. [Google Scholar] [CrossRef]
- Watanabe, M.; Tanaka, K. Efficiency analysis of Chinese industry: A directional distance function approach. Energy Policy 2007, 35, 6323–6331. [Google Scholar] [CrossRef]
- Wang, K.; Wei, Y.M.; Zhang, X. Energy and emissions efficiency patterns of Chinese regions: A multi-directional efficiency analysis. Appl. Energy 2013, 104, 105–116. [Google Scholar] [CrossRef]
- Li, K.; Lin, B. Measuring green productivity growth of Chinese industrial sectors during 1998–2011. China Econ. Rev. 2015, 36, 279–295. [Google Scholar] [CrossRef]
- Chen, C. China’s industrial green total factor productivity and its determinants: An empirical study based on ML index and dynamic panel data model. Stat. Res. 2016, 33, 53–62. [Google Scholar]
- Aghayi, N.; Maleki, B. Efficiency measurement of DMUs with undesirable outputs under uncertainty based on the directional distance function: Application on bank industry. Energy 2016, 112, 376–387. [Google Scholar] [CrossRef]
- Wang, Q.; Su, B.; Zhou, P.; Chiu, C.R. Measuring total-factor CO2 emission performance and technology gaps using a non-radial directional distance function: A modified approach. Energy Econ. 2016, 56, 475–482. [Google Scholar] [CrossRef]
- Tone, K. A slacks-based measure of efficiency in data envelopment analysis. Eur. J. Oper. Res. 2001, 130, 498–509. [Google Scholar] [CrossRef]
- Färe, R.; Grosskopf, S. Directional distance functions and slacks-based measures of efficiency. Eur. J. Oper. Res. 2010, 200, 320–322. [Google Scholar] [CrossRef]
- Arabi, B.; Munisamy, S.; Emrouznejad, A.; Shadman, F. Power industry restructuring and eco-efficiency changes: A new slacks-based model in Malmquist–Luenberger index measurement. Energy Policy 2014, 68, 132–145. [Google Scholar] [CrossRef]
- Oh, D. A metafrontier approach for measuring an environmentally sensitive productivity growth index. Energy Econ. 2010, 32, 146–157. [Google Scholar] [CrossRef]
- Munisamy, S.; Arabi, B. Eco-efficiency change in power plants: Using a slacks-based measure for the metafrontier Malmquist–Luenberger productivity index. J. Clean. Prod. 2015, 105, 218–232. [Google Scholar] [CrossRef]
- Chung, Y.; Heshmati, A. Measurement of environmentally sensitive productivity growth in Korean industries. J. Clean. Prod. 2015, 104, 380–391. [Google Scholar] [CrossRef]
- Oh, D.H. A global Malmquist–Luenberger productivity index. J. Prod. Anal. 2010, 34, 183–197. [Google Scholar] [CrossRef]
- Emrouznejad, A.; Yang, G. CO2 emissions reduction of Chinese light manufacturing industries: A novel RAM–based global Malmquist–Luenberger productivity index. Energy Policy 2016, 96, 397–410. [Google Scholar] [CrossRef]
- Ananda, J.; Hampf, B. Measuring environmentally sensitive productivity growth: An application to the urban water sector. Ecol. Econ. 2015, 116, 211–219. [Google Scholar] [CrossRef]
- Fan, M.; Shao, S.; Yang, L. Combining global Malmquist–Luenberger index and generalized method of moments to investigate industrial total factor CO2 emission performance: A case of Shanghai (China). Energy Policy 2015, 79, 189–201. [Google Scholar] [CrossRef]
- Tao, F.; Zhang, H.; Hu, J.; Xia, X.H. Dynamics of green productivity growth for major Chinese urban agglomerations. Appl. Energy 2017, 196, 170–179. [Google Scholar] [CrossRef]
- Li, L.; Tao, F. Green total factor productivity and influencing factors of pollution-intensive industries. Economists 2011, 12, 32–39. [Google Scholar]
- Li, B.; Peng, X.; Ouyang, M.K. Environmental regulation, green total factor productivity and the transformation of China’s industrial development mode. China Ind. Econ. 2013, 4, 56–68. [Google Scholar]
- Zhang, N.; Choi, Y. Total-factor carbon emission performance of fossil fuel power plants in China: A metafrontier non-radial Malmquist index analysis. Energy Econ. 2013, 40, 549–559. [Google Scholar] [CrossRef]
- Li, K.; Lin, B. Impact of energy conservation policies on the green productivity in China’s manufacturing sector: Evidence from a three-stage DEA model. Appl. Energy 2016, 168, 351–363. [Google Scholar] [CrossRef]
- Wang, Y.; Shen, N. Environmental regulation and environmental productivity: The case of China. Renew. Sustain. Energy Rev. 2016, 62, 758–766. [Google Scholar] [CrossRef]
- Zhu, X.; Chen, Y.; Feng, C. Green total factor productivity of China’s mining and quarrying industry: A global data envelopment analysis. Resour. Policy 2018. [Google Scholar] [CrossRef]
- Färe, R.; Grosskopf, S.; Pasurka, C.A. Environmental production functions and environmental directional distance functions. Energy 2007, 32, 1055–1066. [Google Scholar] [CrossRef]
- Aparicio, J.; Pastor, J.T.; Zofio, J.L. On the inconsistency of the Malmquist-Luenberger index. Eur. J. Oper. Res. 2013, 229, 738–742. [Google Scholar] [CrossRef]
- Pastor, J.T.; Lovell, C.A.K. A global Malmquist productivity index. Econ. Lett. 2005, 88, 266–271. [Google Scholar] [CrossRef]
- China Statistics Press. China Industrial Statistical Yearbook 2001–2015; China Statistics Press: Beijing, China, 2015.
- China Statistics Press. China Economic Census Yearbook 2004, 2008, 2013; China Statistics Press: Beijing, China, 2004, 2008, 2013.
- China Statistics Press. China Energy Statistical Yearbook 2001–2015; China Statistics Press: Beijing, China, 2015.
- Zhang, J.; Zhang, Y. Estimating the capital stock K of China. Econ. Res. J. 2003, 7, 35–43. [Google Scholar]
- Shan, H. Estimating the capital stock of China: 1952–2006. J. Quant. Tech. Econ. 2008, 25, 17–31. [Google Scholar]
- Chen, S. Estimates of sub-industrial statistical data in China (1980–2008). China Econ. Q. 2011, 10, 735–776. [Google Scholar]
- Li, L.; Tao, F. Selection of optimal environmental regulation intensity for Chinese manufacturing industry: Based on the green TFP perspective. China Ind. Econ. 2012, 5, 70–82. [Google Scholar]
- China Statistics Press. China Environmental Statistics Yearbook 2001–2015; China Statistics Press: Beijing, China, 2015.
- China Environment Yearbook Office Press. China Environment Yearbook 2001–2015; China Environment Yearbook Office Press: Beijing, China, 2015.
- China Environmental Science Press. Annual Statistic Report on Environment in China 2007–2015; China Environmental Science Press: Beijing, China, 2015.
- Intergovernmental Panel on Climate Change (IPCC). 2006 IPCC Guidelines for National Greenhousegas Inventories. Available online: http://www.ipcc-nggip.iges.or.jp/public/2006gl/pdf/2_Volume2/V2_6_Ch6_Reference_Approach.pdf (accessed on 20 November 2016).
- Wang, B.; Liu, G.T. Energy conservation and emission reduction and China’s green economic growth: Based on a total factor productivity perspective. China Ind. Econ. 2015, 5, 57–69. [Google Scholar]
- Qiu, B.; Yang, S.; Xin, P. Technology spillover of FDI and Chinese manufacturing productivity growth: Based on panel data. World Econ. 2008, 8, 20–31. [Google Scholar]
- Arellano, M.; Bond, S. Some tests of specification for panel data: Monte Carlo evidence and an application to employment equations. Rev. Econ. Stud. 1991, 58, 277–297. [Google Scholar] [CrossRef]
- Arellano, M.; Bover, O. Another look at the instrumental variable estimation of error-components models. J. Econom. 1995, 68, 29–51. [Google Scholar] [CrossRef]
- Blundell, R.; Bond, S. Initial conditions and moment restrictions in dynamic panel data models. J. Econom. 1998, 87, 115–143. [Google Scholar] [CrossRef]
- Cropper, M.L.; Oates, W.E. Environmental economics: A survey. J. Econ. Lit. 1992, 30, 675–740. Available online: http://www.jstor.org/stable/2727701 (accessed on 10 December 2016).
- Jaffe, A.B.; Palmer, K. Environmental regulation and innovation: A panel data study. Rev. Econ. Stat. 1997, 79, 610–619. Available online: http://www.jstor.org/stable/2951413 (accessed on 10 December 2016). [CrossRef]
- Porter, M.E. Towards a dynamic theory of strategy. Strateg. Manag. J. 1991, 12, 95–117. [Google Scholar] [CrossRef]
- Porter, M.E.; Van der Linde, C. Toward a new conception of the environment-competitiveness relationship. J. Econ. Perspect. 1995, 9, 97–118. [Google Scholar] [CrossRef]
- China Statistics Press. China Statistical Yearbook 2001–2015; China Statistics Press: Beijing, China, 2015.
- China Statistics Press. China Statistical Yearbook of Science and Technology 2001–2015; China Statistics Press: Beijing, China, 2015.
- Windmeijer, F. A finite sample correction for the variance of linear efficient two–step GMM estimators. J. Econom. 2005, 126, 25–51. [Google Scholar] [CrossRef]
© 2018 by the authors. Licensee MDPI, Basel, Switzerland. This article is an open access article distributed under the terms and conditions of the Creative Commons Attribution (CC BY) license (http://creativecommons.org/licenses/by/4.0/).