1. Introduction
The advancement of productivity and the progress of society bring plentiful products, meanwhile result in a lot of end of life (EOL) products, especially waste electrical and electronic equipment (WEEE). From the perspective of quantity and environmental impact, WEEE becomes the world’s fastest growing waste stream [
1]. According to statistics, the amount of WEEE around the world reached 41.8 million tons in 2014 [
2]. It is growing at a rate of 3–5% each year and it is estimated to reach 50 million tons in 2018 [
2]. The treatment of EOL products has become a major problem that troubles the sustainable development in the world. Thus, it is worth to study how to reduce EOL products as much as possible, transfer the landfill and incineration of EOL products, and improve the economic and environmental benefits.
Classic supply chain, also called forward supply chain, only focuses on optimizing the production, transport, sale of products but does not assume any liability for EOL products [
3]. To achieve the better environmental benefit, more and more governments promulgate environmental regulations to force manufacturers to collect EOL products. Therefore, the closed-loop supply chain (CLSC) that combines the forward and the reverse supply chain has attracted people’s attention. Guide and Van Wassenhove [
4] point out that CLSC is a revenue opportunity for manufacturers, and is defined as “the design, control and operation of a system to maximize value creation over the entire life cycle of a product and recover dynamic value from different types and volumes of returns over time” from the business perspective. Based on the framework of CLSC, the manufacturer not only sells products through the forward supply chain, but also collects EOL products through the reverse supply chain [
5].
The collected EOL products can recover their value through repairing, disassembling, recycling and remanufacturing. Remanufacturing is considered as the most effective and environmentally friendly way of recovering the value [
6]. When compared with manufacturing new pump, the remanufactured equipment brings a reduction of 60% in energy consumption, 75% in waste and 70% in carbon emissions [
7]. More and more enterprises, such as BMW, IBM, DEC and Xerox, gain profits by remanufacturing EOL products [
8]. But, Orsdemir et al. [
9] point out that many enterprises still do not choose to remanufacture, mainly because of internal cannibalization and cost. Internal cannibalization means the market demand for new products is encroached by remanufactured products. Thus, our first main research objective is how to weaken the cannibalization effect of remanufactured products.
Although remanufactured product has the same quality and function as new product does, consumers do not have enough recognitions of remanufactured product [
10]. Ferguson and Toktay [
11] point out that the reason for the lower relative willingness-to-pay to remanufactured products is either due to customer concerns about quality or because of a ‘fair price’ perspective—if it costs less for the manufacturer to remanufacture the product than to make it, then the customer wants that reflected in the price. Thus, fair price and loss aversion hinder the increase in demand for remanufactured products [
12,
13]. Thus, our second main research objective is to how to expand the demand for remanufactured products.
In a global business world, corporate social responsibility (CSR) requires enterprises not only to achieve profits but also to assume corresponding social responsibility. CSR largely affects consumers’ decisions and consumers are willing to pay higher prices for products manufactured by corporates implementing CSR [
14]. Charitable giving is a kind of pro-social behavior and is considered as an important part of CSR [
15]. But in essence, it is a kind of strategic gift that is related to business profits. Enterprises can build good images and improve brand reputations, forming an intangible competence [
16]. According to a survey report by the Conference Board, a New York business research think tank, more than half of all the charitable contributions by United States (U.S.) companies were merchandise, including pharmaceuticals, medical supplies, clothing, printers, and computers [
17]. Hewlett-Packard Co. (Palo Alto, CA, USA), in its 2004 fiscal year, donated
$45 million in products [
17]. When compared with new products, remanufactured products have the same qualities and functions, but their prices are lower than 30~40% of that of new products and their costs are only 40~65% of costs of new products [
18]. Therefore, low-cost and high-quality remanufactured products are more suitable for donations. In September 2013, National Development and Reform Commission (NDRC) hosted “Beijing-Tibet trip” with respect to remanufacturing, and some enterprises, such as China National Heavy Duty Truck Group Co. Ltd. (Jinan, China) and China Shandong Forever Co. Ltd. (Jinan, China), gave publicity to remanufacturing and donated remanufactured products to Tibet Autonomous Region, winning the support and recognition from the society (
http://hzs.ndrc.gov.cn/newjsjyxsh/201310/t20131010_561716.html). Hence, this paper takes charitable donation as another strategy of realizing the value of remanufactured products.
The charitable donation improves social welfare and eases the pressure on governments, thus all the governments around the world encourage enterprises to implement charitable donations [
19]. Governmental efforts to direct business behavior toward certain socially desirable outcomes take a variety of forms [
20]. One common motivation is to provide subsidies, including direct or indirect subsidies, for activities that are consistent with policy objectives. In the United States, the 1976 tax provision by Congress allows big companies to avail up to twice the tax deduction they normally receive if they donate goods to charity instead of discarding them [
20]. Recently, Chapter IX of China’s new Charity Law allows for charitable donations to be deducted from taxable income (
http://www.chinalawtranslate.com/2016charitylaw/?lang=en). Arya and Mitterndorf [
20] put forward a direct subsidy for product donation and demonstrate that it has the same legislative efficiency as the indirect subsidy (the tax deduction) does. It is necessary to design an incentive policy that incorporates the donation to realize the value of remanufactured products. The government can/must play in the promotion of remanufactured products [
21]. Thus, our last main research objective is to explore the effect of donation subsidy on the economy and environment.
Our aforesaid objectives translate into the following research questions: (1) under the upgraded remanufacturing strategy, what is the effective condition where both the donation and sale of remanufactured products coexist? (2) Under the upgraded remanufacturing strategy, how does the donation subsidy affect the production decision of the original equipment manufacturer (OEM)? (3) Compared with the strategy without remanufacturing, how are the environmental and economic benefits of the OEM under the upgraded remanufacturing strategy? Are there any Pareto improvements of win-win of economic and environment?
To solve these questions, we introduce the donation of remanufactured products with government subsidy and develop a two-period model of internal competition between new and remanufactured products to analyze a monopolist’s production decisions. In line with the technology roadmap (see
Figure 1), we explore two different strategies of the monopolist: (1) the absence of remanufacturing; and (2) the presence of remanufacturing. The former is a benchmark, where the OEM only produces and sells new products in two periods. For the latter, the OEM produces and sells new products in the first period. In the second period, the OEM collects and remanufactures the cores besides producing and selling new products. As the government provides the donation subsidy for remanufactured products, the OEM simultaneously sells and donates them. For the latter, we compare the different cases: (1) the donation subsidy is effective; and, (2) the donation subsidy is invalid, and analyze the effect of the subsidy on expanding the demand for remanufactured products and weakening internal cannibalization. Then we compare production decision, economic profit and environmental impact of two different strategies and analyze the impact of incorporating upgraded remanufacturing strategy on production decision, economic profit, and environmental impact.
The remainder of this paper is organized as follows.
Section 2 reviews the related literature.
Section 3 summarizes research questions, research hypotheses, and symbols description in detail.
Section 4 presents two stylized models to describe research questions and solves the optimal solution of the OEM.
Section 5 compares and analyzes the effect of introducing upgraded remanufacturing strategy on production decision, economic profit, and environmental impact.
Section 6 presents some numerical examples to verify the findings and discovers new results.
Section 7 summarizes the main conclusions. All of the proofs are provided in
Appendix A.
2. Literature Review
Studies that are related to this paper mainly focus on five aspects: sustainable supply chain, closed-loop supply chain, remanufacturing, corporate social responsibility, and government incentive.
Manufacturing industry has fundamentally changed and OEM focuses on core competences, supply chain configurations and environmental benefits in the supply chain [
22,
23]. Increasing resource scarcity, which leads to rising resource prices and price volatility, has a negative impact on firms and supply chain [
24]. Thus, the interdisciplinary research on supply chains and sustainability, namely sustainable supply chain, has received extensive attention [
25]. Centobelli et al. [
26] review 122 papers with respect to energy-efficient and sustainable supply chain management using descriptive content analysis and present that more than 50% of literature use quantitative methodologies. Pourhejazy and Kwon [
27] summarize quantitative methodologies with respect to supply chain network, in particular integrated mathematical modeling and simulation-optimization frameworks. Centobelli et al. [
28] identify a taxonomy that is used by logistics service providers to achieve their environmental sustainability strategies from the perspectives of green aims, green practices and technological tools. Masi et al. [
24] show that the circular economy creates synergies between environmental and economic development goals and reshapes competitive priorities for firms and supply chains. As an OEM manufacturing strategy, sustainable supply chain must be integrated into the overall corporate strategy and has a profound impact on corporate performance [
29].
The pressure from environment deterioration and resource shortage emphasizes the importance of the closed-loop supply chain management. Guide and Van Wassenhove [
30] provide a basic framework for CLSC and classify its strategies, tactics, and operations. Many scholars focus on the sale and collection of CLSC. Savaskan et al. [
31] regard it the most effective that retailers are responsible for collecting EOL products. Atasu et al. [
32] investigate the impact of collection cost structures on manufacturers’ decision making of the best reverse channel. Many researchers study the pricing decisions of new products and remanufactured products in CLSC management. Ferrer and Swaminathan [
33] study the optimal prices and quantities for monopolist and oligopolist in two-period, multi-periods, and infinite periods. Changes in the structure of supply chain also influence the operating efficiency of EPR system. Maiti and Giri [
34] study three different Stackelberg game models led by the manufacturer, the retailer and the third party in centralized, decentralized, and Nash scenarios. This paper regards CLSC as the framework and assumes that the integrated monopolist is responsible for selling new and remanufactured products and collecting EOL products in two periods simultaneously.
Remanufacturing, as a market competition, has attracted more and more enterprises’ attention. Many scholars especially emphasize the competitive remanufacturing and cannibalization of remanufacturing. Atasu et al. [
35] consider that remanufacturing can be used to deal with market competition. Ferguson and Toktay [
11] consider two-period and remanufacturing constraints and investigate the effect of introducing remanufacturing strategy on operations management. Yenipazarli [
36] characterizes the condition where the manufacturer achieves an economic and environmental ‘win-win’ situation by remanufacturing under emissions regulation. The above literature reviews only take resale as the way of realizing the value of remanufactured products and do not take the donation of remanufactured products into account. Also, cannibalization has not been paid much attention.
There have been a lot of literature reviews about the application of CSR in the supply chain in the past ten years. Ni et al. [
37] investigate the allocation of social responsibility in the two-echelon supply chain and design the coordination mechanism of the wholesale price to share the responsibility cost among members. Ni and Li [
38] explore the interaction of CSR between a supplier and a manufacturer and emphasize the impact of individual CSR cost on the channel members. This paper investigates the interdisciplinary research on the charitable donation of CSR and CLSC. The charitable donation is an important embodiment of CSR [
39]. Wang et al. [
40] investigate the relationships of CSR, brand equity, and firm performance and find that brand equity and CSR have significant positive correlations with the firm performance. Long and Hu [
41] present that non-monetary asset donations are important as they bring goods and materials to areas where they are desperately needed. Jia and Zhang [
16] find that the firm that takes active participation in charitable donations can acquire more bank loans and government subsidy. Particularly, enterprises in China are used to establish a good political relationship with the government by charitable donations. Arya and Mittendorf [
20] explore the interactions with suppliers, manufacturers and retailers when manufacturers implement charitable donations and analyze the significant impact of the government subsidy on the channel members. The above literature reviews only take the donation of new product into account. We focus on the interdisciplinary research on remanufactured product and the charitable donation.
It is important for the government to encourage and support the remanufacturing of enterprises. The current main forms of government incentive are subsidy and tax rebate. Shu et al. [
42] compare remanufacturing subsidy and carbon tax rebate and find that rebate has more influence on pricing. Liu et al. [
43] investigate the trade-off between remanufacturing and recycling EOL products with the government subsidy. The above literature reviews only study the resale of remanufactured products with subsidy and do not take the donation of remanufactured products into account. Zhu et al. [
44] put forward two incentive policies to subsidize the resale and donation of remanufactured products respectively and provide the basis for choosing the government subsidy policy from the perspective of social welfare. Although Zhu et al. [
44] consider the donation of remanufactured products, they do not take the remanufacturing constraints and multiple periods into account. Arya and Mittendorf [
20] study the impacts of the donation subsidy on suppliers, manufacturers, and retailers, and suggest that direct donation subsidy and indirect tax breaks have the same incentive effects. Instead, this paper incorporates the donation of remanufactured products into CLSC and considers the two-period and remanufacturing constraints.
Table 1 shows that the comparison between related literature and our paper by research content and methodology. 10 papers selected focus on life cycle including six papers concern single-period, three papers concern multi-period, and one paper concerns single-period and multi-period; 10 papers selected focus on remanufacturing. Four papers selected focus on product donation under government subsidy, including three papers concern donation of new products and one paper concerns donation of remanufactured products. Seven papers selected focus on environment, including three review papers that provide a comprehensive overview on sustainable supply chain and four papers which concern environmental impact by quantitative methods. 13 papers selected focus on economic performance, including 11 papers that concern profits by game theory.
Our work differs from the above studies for the following reasons: (1) This paper emphasizes a new way to realize the value of remanufactured products, namely charitable giving. The donation of remanufactured products is driven by donation subsidy. We design a direct subsidy mechanism instead of tax breaks, which expands the demand for remanufactured products and weakens the internal cannibalization. Meanwhile, we take the supply constraint of EOL products in account. Remanufactured products in second period can be used not only for sales, but also donations, namely upgraded remanufacturing strategy. (2) Because the manufacturer first determines the first-period production decision, then determines the second-period production decision. We model a two-period model to capture the dynamic aspects of the CLSC and donation subsidy, which is dynamic programming problem. Unlike the game theory, optimization involves just one decision maker, who chooses what to do at each point of time. (3) Besides analyzing the economic profit, we particularly underline the environmental impact of the manufacturer after adopting the upgraded remanufacturing strategy. We selected total carbon emissions as the environmental assessment indicator, which is recognized worldwide as a measure of environmental impact.
3. Problem Description and Symbols
This section mainly introduces relevant assumptions and symbols of two-period production decisions of the manufacturer with or without remanufacturing. The strategy without remanufacturing is the benchmark model, which is denoted by superscript . The strategy with remanufacturing is denoted by superscript .
With respect to two periods, a new product purchased in the first period cannot provide positive utility for the customers in the second period. Thus, the product has a useful life time of only one sale period. This assumption means that the consumers’ purchasing behaviors across the two periods are independent [
33,
36,
45]. Under the strategy
, the manufacturer only produces new products in the first and second periods, and the decisions of two periods are independent. Under the strategy
, the manufacturer assumes the responsibility for collecting and remanufacturing used products, and the value of remanufactured products can be realized by resale and donation. At the moment, the manufacturer produces new products in the first period. The used products must be remanufactured at the end of their life and then reused. Only fraction of used products at the end of the first period can be collected and remanufactured. Thus, the collection rate is denoted as
,
[
9]. In the second period, new products and remanufactured products are sold simultaneously. The price and production quantity of new products in the first period are
and
, and the inverse demand function of the new product in the first period is
[
36]. The price and production quantity of new products in the second period are
and
, respectively. In addition, the price and production quantity of the remanufactured product are
and
, respectively. Similar to the established marketing literature [
35,
36], this paper assumes that the willingness-to-pay
of heterogeneous consumers is uniformly distributed in
. The market size is normalized to 1. The consumer with willingness-to-pay
gets a net utility
from buying a new product. As consumer does not view remanufactured products as perfect substitutes, the consumer with willingness-to-pay
gets a net utility
from buying a new product.
denotes the consumer value discount for the remanufactured product [
11,
13]. If
and
, consumers choose to buy new products in the second period. If
and
, consumers choose to buy remanufactured products in the second period. In order to ensure that there are remanufactured products sold in the second period, that is
, we adopt the low-pricing strategy for remanufactured products, that is
[
35,
36]. Thus, when
and
, consumers buy new products in the second period and the demand function is
, otherwise,
and
, consumers buy remanufactured products in the second period and the demand function is
. Referring to Yenipazarli [
36], the inverse demand functions of new and remanufactured products in the second period are
and
. When the price of remanufactured products is too high, namely
, there are only new products in the second period. Thus, we do not emphasize this situation in this paper.
denotes the unit production cost of the new product.
denotes total recycling and remanufacturing costs of
units remanufactured products, which means that remanufacturing more used products needs more efforts [
36].
and
represent the donation quantity and sale quantity of remanufactured products, respectively. Then
denotes the total recycling and reprocessing costs to remanufacture
units remanufactured products.
denotes the fixed cost to recycle and reprocess used products. In order to encourage enterprises to implement charitable donations, the government provides a direct subsidy for the manufacturer based on the donation quantity of remanufactured products, which is established in the literature.
denotes the unit subsidy on the donation of remanufactured products. The donation of remanufactured products can improve the reputation and bring the value addition of the brand. To simplify the calculation, assume that
. This corresponds to the assumption that the donation of the manufacturer occurs only when the government subsidy is effective.
There are many criteria for environmental impact, such as the use of raw materials, energy consumption, and greenhouse gas emissions. Total carbon emissions is recognized worldwide as a measure of environmental impact [
35]. When compared with new product, remanufactured product is considered more environmental friendly. Thus, we assume that the unit carbon emission of new product is 1, and then the unit carbon emission of remanufactured product is
.
represents the emissions intensity of remanufactured products. The smaller
, the smaller environmental impact of remanufactured products. Moreover, the total carbon emissions depend on the production quantity of new and remanufactured products. Hence, under the strategy without remanufacturing, the environmental impact of OEM is
, and under the strategy with remanufacturing, the environmental impact of OEM is
.
We construct and solve the two-period dynamic programming model in two stages, since the second-period decisions depend on the first-period sales quantity of new products. As is seen in
Figure 1, the decision-making sequence is presented as follows: (1) the OEM first determines the first-period production decisions; and, (2) then the OEM determines the second-period production decisions. The mathematical optimization involves just one decision maker, who chooses what to do at each point of time. Thus, the backward introduction is used to solving mathematical optimization of dynamic programming [
46]. The solving order is presented as follows: we begin with the second stage where the optimal quantities of the new and remanufactured products are determined, and then solve for the firm’s optimal first-period production decisions.
Relevant symbols are summarized in
Table 2.
4. Model Formulation and Solution
4.1. OEM Profits without Remanufacturing ()
Under the strategy without remanufacturing, the manufacturer provides new products for customers both in the first and second period. Because the manufacturer does not collect the used products to remanufacture, the decision-making of OEM in the first period and that in the second period is independent. The function of profit maximization in the first period is , and the optimal quantity and price are and , respectively. The decision-making in the second period is the same as that in the first period, that is, and . Therefore, without remanufacturing, the total profit of the manufacturer in the two periods is , and the total carbon emissions in the two periods is .
4.2. OEM Profits with Remanufacturing ()
Under the strategy with remanufacturing, new products exist in both first and second period, but remanufactured products exist only in the second period. Differently, besides for resale, remanufactured products can be used for donation with the motivation of government subsidy. As the decision-making of OEM in the second period is dependent on that in the first period, we solve this optimization problem in two stages. According to backward induction, we start with the second period.
Second-Period Analysis. The quantities of resale and donation of remanufactured products in the second period are restricted by the quantity of new products in the first period. The function of manufacturer’s profit maximization in the second period is:
According to the Karush–Kuhn–Tucker (KKT) optimization conditions, we solve the equilibrium of the profit maximization in the second period. Let denote the threshold amount of EOL products that can be collected at the end of the first period.
Proposition 1. The optimal solution of OEM under the strategy in the second period is summarized in Table 3.
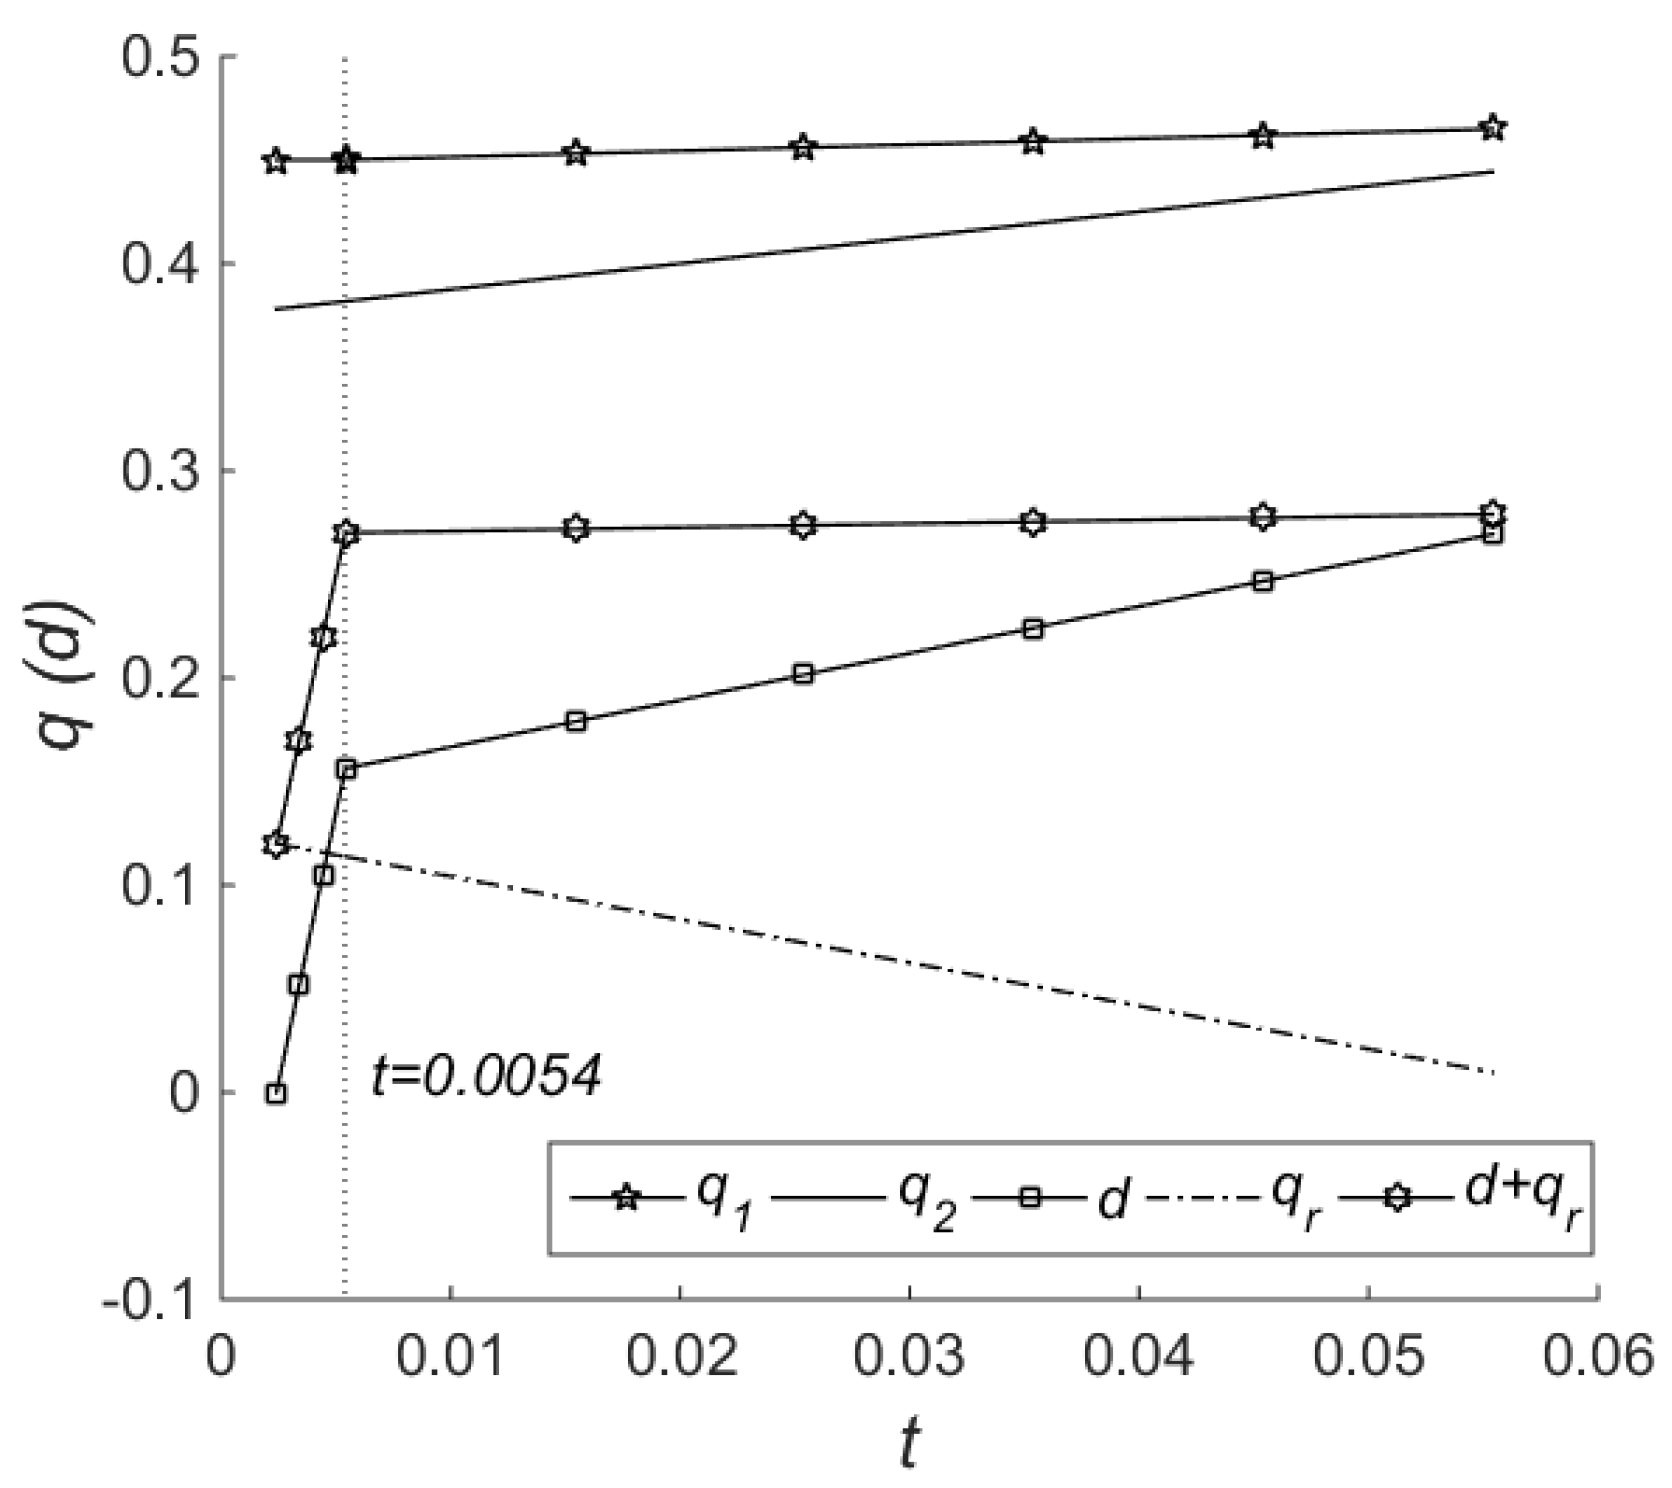
Proposition 1 shows that threshold is the function of and , and has nothing to do with and . As the remanufacturing cost increases, then the threshold of the collected EOL product decreases. With the increase in the government subsidy , the threshold also increases. When the supply of EOL products is limited by the threshold , manufacturers prefer to collect all available EOL products to remanufacture. When the supply of used products is not limited by , the manufacturer can collect and remanufacture the threshold amount of used products. Some of the remanufactured products are used for donation and the rest of them are used for resale. To be noteworthy, after introducing upgraded remanufacturing strategy, regardless that the remanufacturing is constrained, the functional expressions of remanufactured products for resale and new products in the second period remain the same. According to the functional expression of donation quantity, the supply of the collected used products largely influences the quantity of donation of remanufactured products.
First-Period Analysis. Based on the optimal decision in the second period of OEM, we can maximize the total two-period profit . Let denote the subsidy threshold of government.
Proposition 2. The optimal solution of OEM under the strategy in two periods is summarized in Table 4.
Proposition 2 demonstrates that government subsidy has a threshold , which is negatively related to the cost of new products , positively related to remanufacturing costs and the collection rate , and has nothing to do with the customer value discount . When the donation subsidy is lower than , the decision-making in the first period and that in the second period are totally independent. At the moment, the first-period optimal solution under strategy is same as that under strategy . When the donation subsidy is higher than , the manufacturer decreases the price of new products and thus increases the sale of new products in the first period, in order to ensure that enough used products in the second period.
According to Propositions 1 and 2, with the increase in the government subsidy, the sales quantity of remanufactured products decreases, the donation quantity of remanufactured products increases and the quantities of new products in two periods continuously increase.
Corollary 1. When both the sale and donation of remanufactured products exist, the effective subsidy is . Here, , and .
Corollary 1 shows that the sale and the donation of remanufactured products are closely related to the donation subsidy and the cost of new products. From the perspective of cost, the whole subsidy region is continuous. The higher the cost of new products, the more difficult the donation of remanufactured products is to occur. The rationale is that the higher the cost of new products, the more profits from the sale of remanufactured products, and the more opportunity cost of donation of remanufactured products. Thus, a higher government subsidy is needed to make up for the opportunity costs of donation of remanufactured products. When the cost of new products is relatively low, the manufacturer donates remanufactured products with a relatively low government subsidy incentive. It is noteworthy that, when , that is, the subsidy is invalid, the manufacturer does not donate remanufactured products. When , that is, the subsidy is too high, the manufacturer does not sell remanufactured products. This paper focuses on the case where sale and donation of remanufactured products both exist, therefore does not consider these two special conditions.
5. Comparisons of Different Strategies
Introducing upgraded remanufacturing strategy, including resale and donation, has different impacts on production decision, economic profit, and environmental impact of OEM. In this section, taking the strategy as a benchmark, we analyze the changes in production, economic, and environmental benefits of OEM under the strategy .
5.1. Comparisons of Production Quantity and Price
First, we compare production quantities and prices of new and remanufactured products between the strategy and the strategy . Let represent the difference of parameter under the two different strategies. Here, denotes , and .
Proposition 3. After introducing upgraded remanufacturing strategy including resale and donation, the changes in production quantities and prices of two periods are shown in Table 5.
According to Proposition 3, when the government subsidy is high enough, that is, when or , the manufacturer will collect used products to remanufacture as many as possible, although the supply of used products is limited by the collection rate and the first-period quantity of new products. Thus, and mean that the manufacturer decreases the price of new products in the first period to increase the demand for them, and, as the subsidy increases, the production of new products in the first period continuously increases and the price decreases correspondingly. When the government subsidy is not large enough, that is , the supply of the cores is not be restricted by the threshold . Thus, and demonstrate that the production quantity and price of new products in the first period under two strategies are the same. Regardless of the government subsidy, means that new products in the second period will be eroded by remanufactured products. Note that the cannibalization effect of remanufactured products gradually becomes weaker with the increase in the government subsidy. The rationale is that the quantity of donation of remanufactured products squeezes that of the sale of remanufactured products. Thereby, the donation of remanufactured products weakens the cannibalization effect on the new products from the sale of remanufactured products. The donation subsidy does not affect the price of new products in the second period. Affected by the subsidy, the donation of remanufactured products increases gradually, whereas the sale of remanufactured products decreases gradually, resulting in a premium effect of the sale of remanufactured products.
According to Propositions 2 and 3, we can find that, when compared with the strategy , the quantities of new and remanufactured products increase as the subsidy increases under the strategy . It demonstrates that the donation subsidy can expand the demand for new and remanufactured products, transfer the landfill and incineration of EOL products, and weaken the cannibalization of remanufactured product.
5.2. Comparisons of Economic and Environmental Benefits
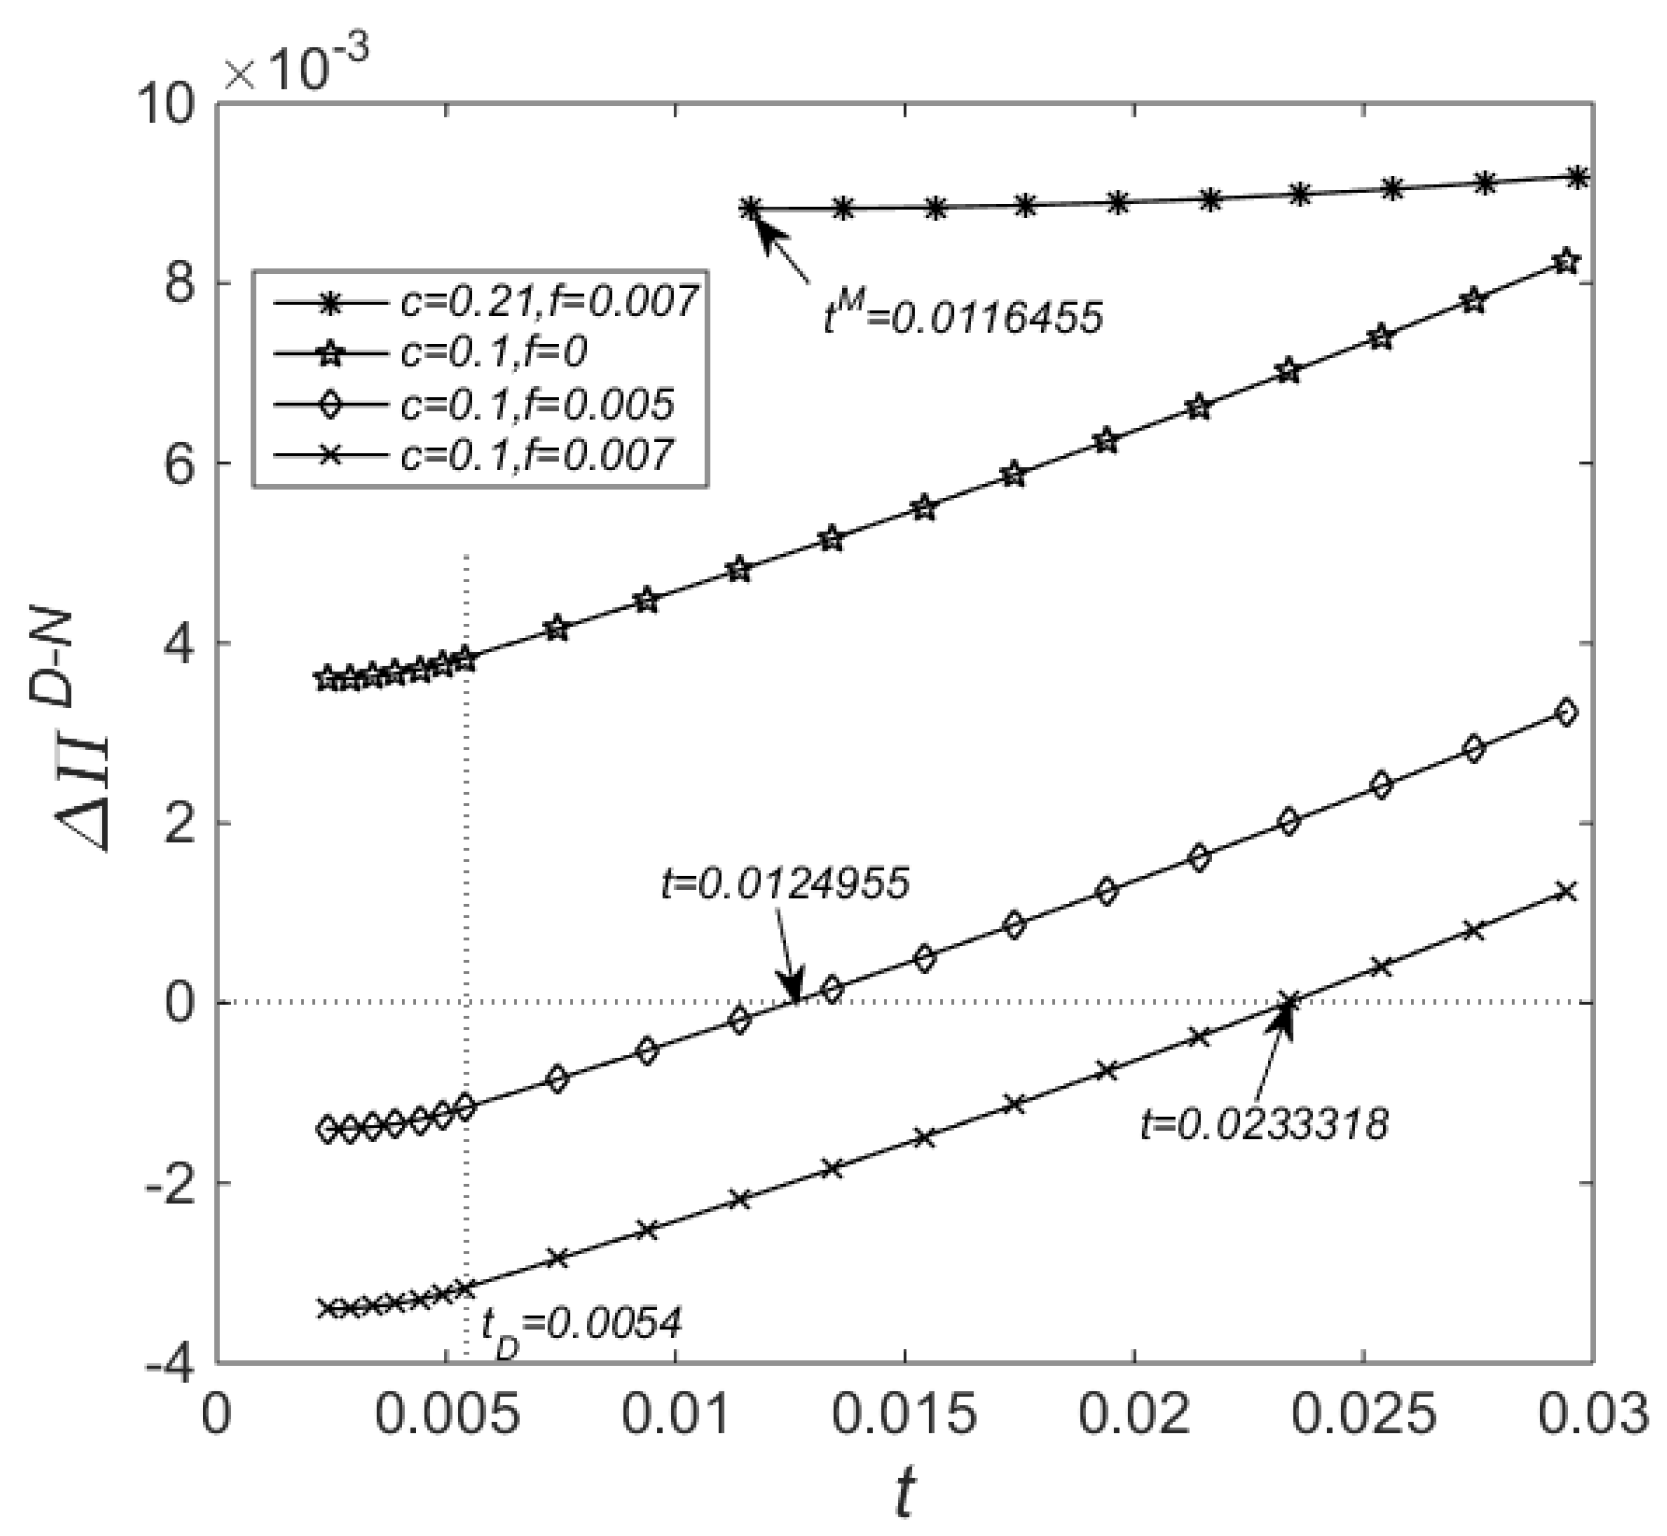
We compare economic profit and environmental impact between the strategy and the strategy , respectively. Because the fixed cost of remanufacturing is constant, we set to calculate conveniently. Let represent the differences of economic profit without the fixed cost between the strategy and the strategy . Let represent the differences of environmental impact between the strategy and the strategy .
Proposition 4. When ,
- (1)
is a continuous convex function of and increases in or . when , always exists in or . Therefore, or , if , introducing upgraded remanufacturing strategy, including resale and donation leads to better economic profit.
- (2)
is a continuous increasing function of .
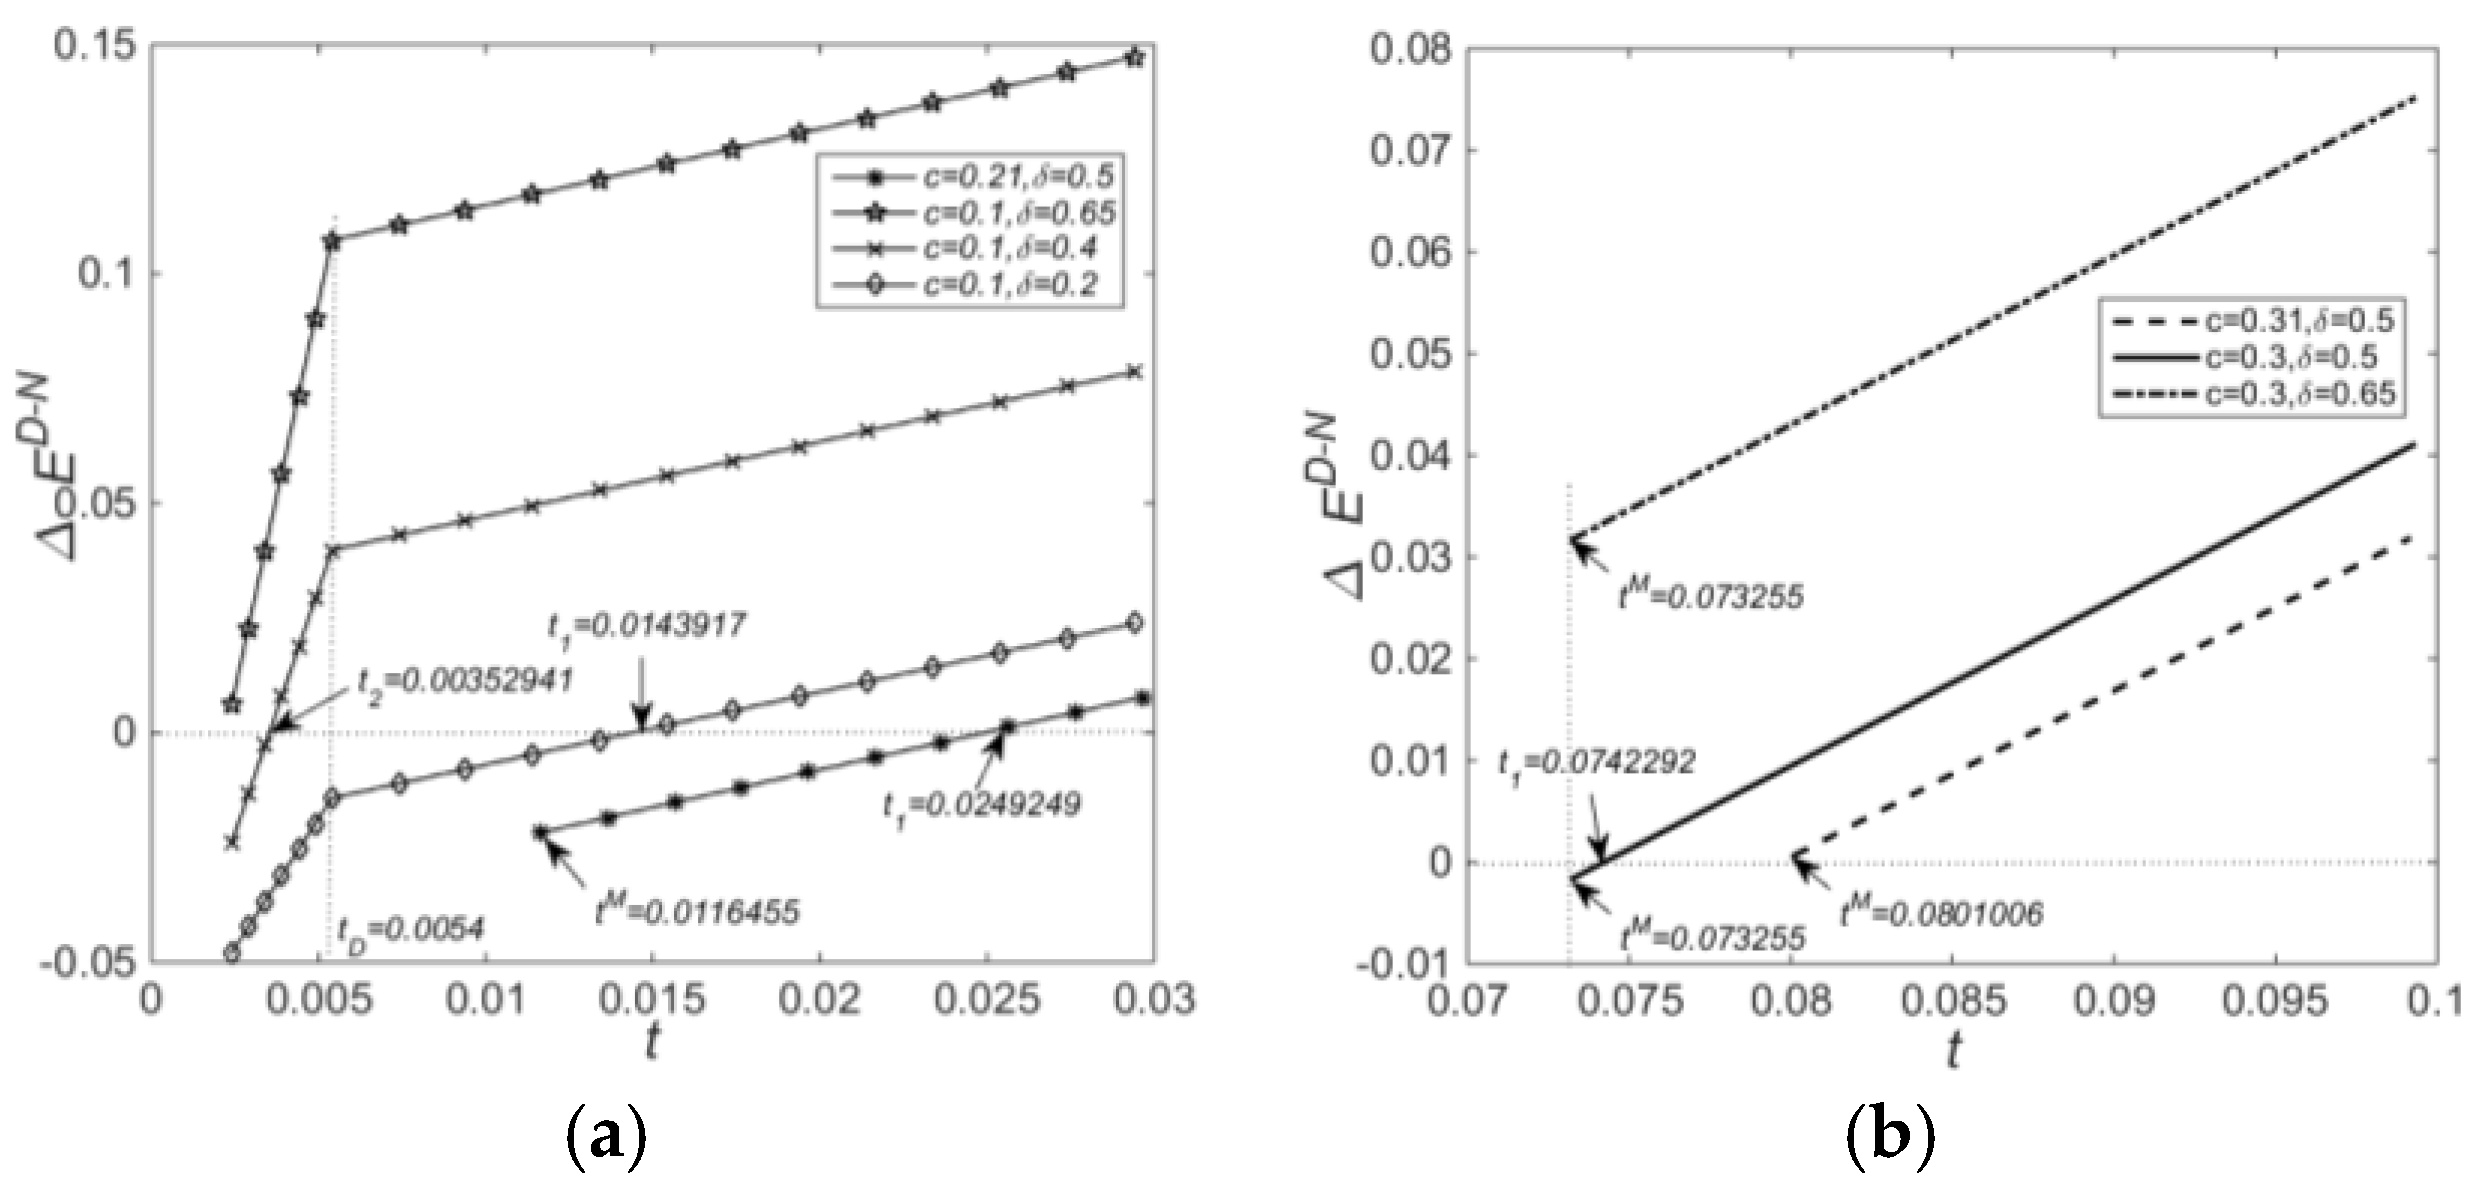
is affected by the cost of new products , the emissions intensity of remanufactured products and customer value discount . The specific changes are shown as in Table 6.
Proposition 4 analyzes the changes of economic and environmental benefits after introducing upgraded remanufacturing strategy, including resale and donation.
From an economic point of view, when the additional profit obtained from sale and donation of remanufactured products can make up for the fixed cost , introducing remanufacturing is profitable, otherwise, no remanufacturing is more effective. The economic advantage resulted from the donation of remanufactured products will increase as the subsidy increases. In other words, the government can help the manufacturer to increase the additional profit that was obtained from subsidy and remanufacturing and overcome the high fixed cost.
From the perspective of environment, when customers consider the remanufactured products not environmentally friendly, that is , regardless of the cost of new products, introducing remanufacturing leads to a worse environmental impact. On the contrary, when customers consider the remanufactured products to be environmentally friendly, that is , if the cost of new products is relatively low, that is , the subsidy interval where environmental impact gets improved depends on the emissions intensity of remanufactured products . It is not difficult to see that when the environmental impact of remanufactured products is relatively low, namely , the subsidy interval where environmental impact gets improved is . However, when the environmental impact is relatively high, namely , the subsidy interval where environmental impact gets improved is . Note that the relationship demonstrates that the subsidy interval where environmental impact gets improved becomes larger if is smaller. This is because, the more environmentally friendly the remanufactured products, the smaller the environmental impact of remanufactured products, and the larger the increment of remanufactured products that can be adjusted by the government subsidy.
When customers consider the remanufactured products environmentally friendly, that is , if the cost of new products is relatively high, that is, , a higher subsidy is needed to motivate the manufacturer to donate the remanufactured products. At this time, if customers consider the remanufactured products environmentally friendly, introducing upgraded remanufacturing strategy, including resale and donation, brings improved environmental impact in .
When the cost of new products is very high, that is , regardless that whether consumers consider the remanufactured products environmentally friendly, introducing upgraded remanufacturing strategy results in the worse environmental impact.
It is noted that the government can realize a win-win situation of OEM where economic and environmental benefits get improved by adjusting the donation subsidy. Relatively, the low-cost and environmentally friendly manufacturer is easier to realize a win-win situation by donation subsidy.
7. Conclusions
Remanufacturing has great economic and environmental potential. Currently, resale is the main way of realizing the value of remanufactured products. Although remanufactured product has the same quality and function as new product does, lack of consumer acceptance of remanufactured products prevents OEM from realizing the full potential value by remanufacturing. Although remanufacturing is proved to be profitable, many enterprises still do not choose to remanufacture, mainly because of internal cannibalization. In order to expand the demand for remanufactured products and weaken the internal cannibalization, this paper introduces the donation of remanufactured products with government subsidy and presents upgraded remanufacturing strategy, including resale and donation of remanufactured products. To better understand the effect of upgraded remanufacturing strategy on the production decision, economic and environmental benefits, we construct a two-period production decision model and examine two different strategies: (1) the absence of remanufacturing; and, (2) the presence of remanufacturing. At first, we solve and analyze the optimal solution under two strategies. Then taking the absence of remanufacturing as a benchmark, we explore the effect of introducing upgraded remanufacturing on production decision, economic profit, and environmental impact.
The findings can be summarized as follows: (1) The donation of remanufactured products is influenced by the government subsidy and the cost of new products. The manufacturer needs to consider the opportunity cost of donating remanufactured products when making decisions about the donation. When the cost of new products is relatively high, the remanufactured products can achieve more profits by sale and more subsidies are needed to stimulate the donation of remanufactured products. (2) From the perspective of subsidy incentive, after introducing upgraded remanufacturing strategy, the quantities of new and remanufactured products both increase. The donation of remanufactured products weakens the cannibalization effect of remanufactured products on new products. At some extreme conditions, namely the subsidy is high enough, all of the remanufactured products are used for donation and the cannibalization effect of remanufactured products will disappear. (3) From the perspective of constraint condition, the quantity of donation of remanufactured products is affected by the quantity of used products that can be collected in the second period. When the subsidy is high enough, the supply of used products will be restricted by the collection rate. In order to collect EOL products as many as possible to meet the requirement of the donation, the manufacturer will increase the production of new products in the first period. (4) From the economic point of view, when compared with the benchmark, whether the upgraded remanufacturing strategy is profitable depends on the fixed cost of the remanufacturing. When the fixed cost is relatively high, the government can ease the pressure of OEM from remanufacturing investment by donation subsidy incentive, thereby guiding manufacturer to remanufacture more EOL products. (5) From the environmental point of view, after introducing upgraded remanufacturing, the environmental impact depends on consumer value discount for the remanufactured product. When consumers consider remanufactured products not environmentally friendly, introducing upgraded remanufacturing will make the environment worse. (6) From an economic and environmental win-win point of view, when consumers consider remanufactured products to be environmentally friendly, the government can realize an OEM’s win-win situation where the economic and environmental benefits get improved by adjusting the donation subsidy. Comparatively speaking, low-cost and environmentally friendly manufacturers are easier to achieve the win-win situation through donation subsidy.
With respect to the limitation of this paper, we focus on complete rationality of the manufacturer, which is common in literature [
11,
35,
36]. Some scholars focus on incomplete rationality, which affects manufacturer’s decision. In addition, we consider the government subsidy to be exogenous. In fact, the subsidy is determined by the government. At last, this paper only focuses on the monopoly market structure where there is merely one intergrated manufacturer with remanufacturing capability. However, there are also situations where the manufacturer gives up remanufacturing and the third remanufacturer collects EOL products and remanufactures as a competitor.
In future research, empirical research on the donation of remanufactured products needs to be supplemented and perfected. Because the government determines the donation subsidy, the subsidy is endogenous. It is worth studying that how the government determines donation subsidy with the goal of maximizing the social welfare. We can also consider that the reputation brought by donation is private information and incomplete information will result in a more complex analysis.


