1. Introduction
Many countries have experienced rural settlement expansion that outpaces the growth of population in recent decades [
1,
2,
3,
4,
5]. This has attracted the attention of policy-makers and researchers as an inefficient use of natural resources [
2]. For example, in China, from 1980–2012, rural settlements have been expanding by 1.21% per year [
6]. By 2011, rural homesteads in China occupied 13.7 million hectares of land, ten-times as large as urban residential land [
7]. This scale of expansion does not just outpace the growth of population, but is, in fact, accompanied by fast urbanization and large waves of rural-to-urban migration. From 1997–2005, rural residents in China decreased by 97 million, while rural homesteads expanded for another 117.5 thousand hectares [
8].
This happens for three reasons. First, while the rural population decreases, villages rarely take back allocated rural homesteads, even if they have been abandoned for years. Second, some residents, though no longer living in villages, still obtain rural homesteads and build houses in villages. Third, per capita residential land in rural China is increasing as families become smaller in size and a significant share of rural households obtains more than one dwelling.
The rural settlement expansion in China takes two forms: standard sprawl, i.e., the outward expansion and sprinkling, i.e., fragmented development [
9,
10]. The outward expansion is attested by the numbers cited in the previous paragraphs, and the fragmented development is caused by the tradition of rural households living in a low density and scattered fashion. These types of rapid rural settlement expansions raise several concerns of sustainability: they lower land use efficiency, inhibit agricultural land preservation, cause habitat degradation and threaten water quality and environmental diversity [
1,
11,
12,
13]. Aware of these, China’s central government has launched a series of regulations since the 1980s to curb the trend of fast rural residential expansion. These regulations include construction land quotas, homestead size control and the homestead withdrawal system [
14,
15,
16]. The land quota system requires the minimum hectares of farmland preservation and the maximum hectares of urban and rural construction land for every province, city and county during a particular time frame, usually five, ten or fifteen years. The homestead size control system sets size limits to the homestead plots allocated to rural households. The homestead withdraw system requires households to withdraw from their vacant homesteads or to give up their occupied homesteads and houses voluntarily and move into high-rise buildings with compensation. These regulations, however, turned out to be ineffective. Farmland keeps decreasing, while rural homesteads and houses continue to expand [
14,
17].
Aside from the control of settlement expansion, China’s central government also hopes to achieve two additional goals with rural homesteads. It wants to ensure rural households have free access to homesteads as a welfare benefit to them and to encourage rural households to obtain monetary benefits from homesteads as a way to boost rural income. Researchers have found that obtaining homesteads, even a small plot, can secure poor rural households with income and status [
18]. Therefore, rural homesteads have long been considered a merit good in China and allocated free of charge to rural households. In 2013, the China Ministry of Land and Resources emphasized that the free access should and will be secured [
19]. In implementation, to make sure that eligible households obtain homesteads, the Ministry requires at least 5% construction land quotas to be used for new homesteads. The free access, nonetheless, is paired with size limits since 1982 to curtail settlement expansion. According to the literature [
17] and official reports [
20], however, the size limits are loosely enforced. This is also consistent with our data: 36% of surveyed households live on homesteads obtained after 1982, but exceed size limits.
At the same time, policies were initiated to encourage accruing incomes from homesteads. In 2013, the Third Plenary Session of the 18th Central Committee of the Communist Party of China decided to encourage rural housing transfer and allow rural households to use housing as formal collateral. These policies aim to boost the capital assets and income of rural households. They opened the gate for capitalization and marketization of rural homesteads.
As mentioned above, China’s central government seeks to simultaneously achieve three goals with the rural homestead management policies. It wishes to: (1) contain rural settlements to preserve farmland; (2) entitle rural households to free homesteads; and (3) encourage rural residents to accrue monetary income from homesteads. This paper argues that, though warranted on their own, these three policy goals have some conflicts. In fact, the combination of the latter two policies, free access and marketization, encourages settlement expansion. As mentioned above, with free access and insufficient enforcement of size limits, it is not uncommon for homesteads to exceed the regulated size ceilings. In fact, if not for these reasons, rapid expansion would have never occurred in the first place. Marketization increases the value of homesteads and reveals that value to rural households, both of which incentivize households to obtain larger homesteads, and on the aggregate level, exacerbate the expansion.
This paper empirically tests the above hypothesis, using survey data of 1134 households in 2011. Although homestead marketization was by law limited to housing transactions within villages before 2013, we still observed a sufficient amount of (both legal and illegal) homestead transactions in our interviews. Therefore, using these data, we are able to explore the effect of marketization on settlement expansion, with free access as a background. We find the effect sizeable: the presence of homestead markets at the village level increases the size of a household’s primary homestead, the one it builds being the main dwelling, by 60 square meters. It also leads to the primary homestead being 10% more likely to exceed the size limits. Worse still, village cadres obtain 103-square meter larger primary homesteads than other community members in villages with markets, while the difference is only 31 in villages without this. This indicates serious rent-seeking behaviors, which threaten social equality within rural communities. On the bright side, stricter village-level homestead regulations effectively mitigate settlement expansion; they also stop village cadres from obtaining larger homesteads.
This paper makes three contributions. First, it speaks to the policy design of China’s rural homestead management. It shows that the side effects of well-intended policies may be quite harmful, and it is impossible to achieve too many goals with a single good: rural homestead in this case. Second, it also contributes to studies of determinants of rural expansion [
2,
15,
21,
22,
23,
24]. To the best of our knowledge, it is the first to point out that the combination of free access and marketization leads to expansion. Third, this paper provides an additional piece of evidence, following [
25], that rural cadres use their power to obtain large homesteads; such effects are further magnified with marketization.
The paper proceeds by introducing China’s rural homestead policies in
Section 2 and presenting the data and methodology in
Section 3.
Section 4 shows the results.
Section 5 discusses the limitation and generalizability of the results, and
Section 6 concludes.
2. China’s Rural Homestead Policies
The current rural homestead management system in China was initiated in 1962, when previously privately-owned homesteads were changed into collectively-owned and allocated (the use rights only) to rural households free of charge as a merit good. Transfer of homesteads was prohibited. This became law in the 1975 and 1982 Constitutions. The system made an impressive achievement: 99% of rural households in China were ensured homeownership. However, it has also been criticized for its lack of efficiency.
To improve the efficiency of homestead use, the Land Management Law in 1986 allowed the transfer of homestead use rights, and urban residents, under certain conditions, can buy rural homesteads. However, such policies were soon abolished. The Land Management Law in 1998 again prohibited homestead transactions between urban and rural residents. Until now, urban residents are not allowed to buy rural homesteads, while such transactions are legal between rural households. The very recent policies, as mentioned above, even started to encourage rural homesteads to obtain monetary incomes from their homesteads, through either market transactions or capitalization.
Initially in the 1960s, rural homesteads were allocated based on the needs of the rural households without size regulations. However, with the increase of population and income, rural homesteads started to expand rapidly, occupying a significant amount of farmland and threatening farmland preservation and food security. To curb the trend, from 1982–1998, a set of regulations was implemented. The development of new homesteads needs permission from township governments, and new homesteads can never occupy farmland unless approved by county governments. New homesteads also have to respect size limits set by provinces. In our three surveyed provinces, after 1994, the size limits for a plot of homestead are 140 square meters in Zhejiang, 150 in Hubei and 200 in Shaanxi. Moreover, one rural household can only be allocated one plot of homestead, according to the 1998 Land Management Law. However, it may legally obtain multiple homesteads by heritage, within-village housing transactions or splitting itself into several smaller core families. Villages also initiated their own homestead regulations: for example, some villages forbid attached houses, while others do not. Since attached houses typically occupy additional homesteads, forbidding them implies stricter controls of homesteads. In 50 villages that we surveyed with available data, 19 forbid attached houses. As mentioned above, despite these regulations, rural settlement expansion in China has not been effectively curbed. The size limits are not fully enforced, and a significant share of rural households hold multiple homesteads (17% in our data).
To summarize, two main problems exist in rural China that lead to rapid settlement expansion. First, two loopholes exist in the legal system that allocates rural homesteads free of charge as a merit good to rural households. One is that rural residents are recognized through their legal status, not their actual residential locations; as a result, the younger generation who has left the villages may still obtain rural homesteads. The other is that what constitutes a rural household is subject to local interpretation. In some villages, one of the adult children has to live with their parents, while in others, every adult child can obtain a separate homestead. Naturally, rural settlements expand faster in the latter. Second, as shown in our data, homestead regulations are not sufficiently enforced: 24% of households occupied homesteads beyond the size limits, and 17% of households obtained multiple homesteads.
3. Data and Methodology
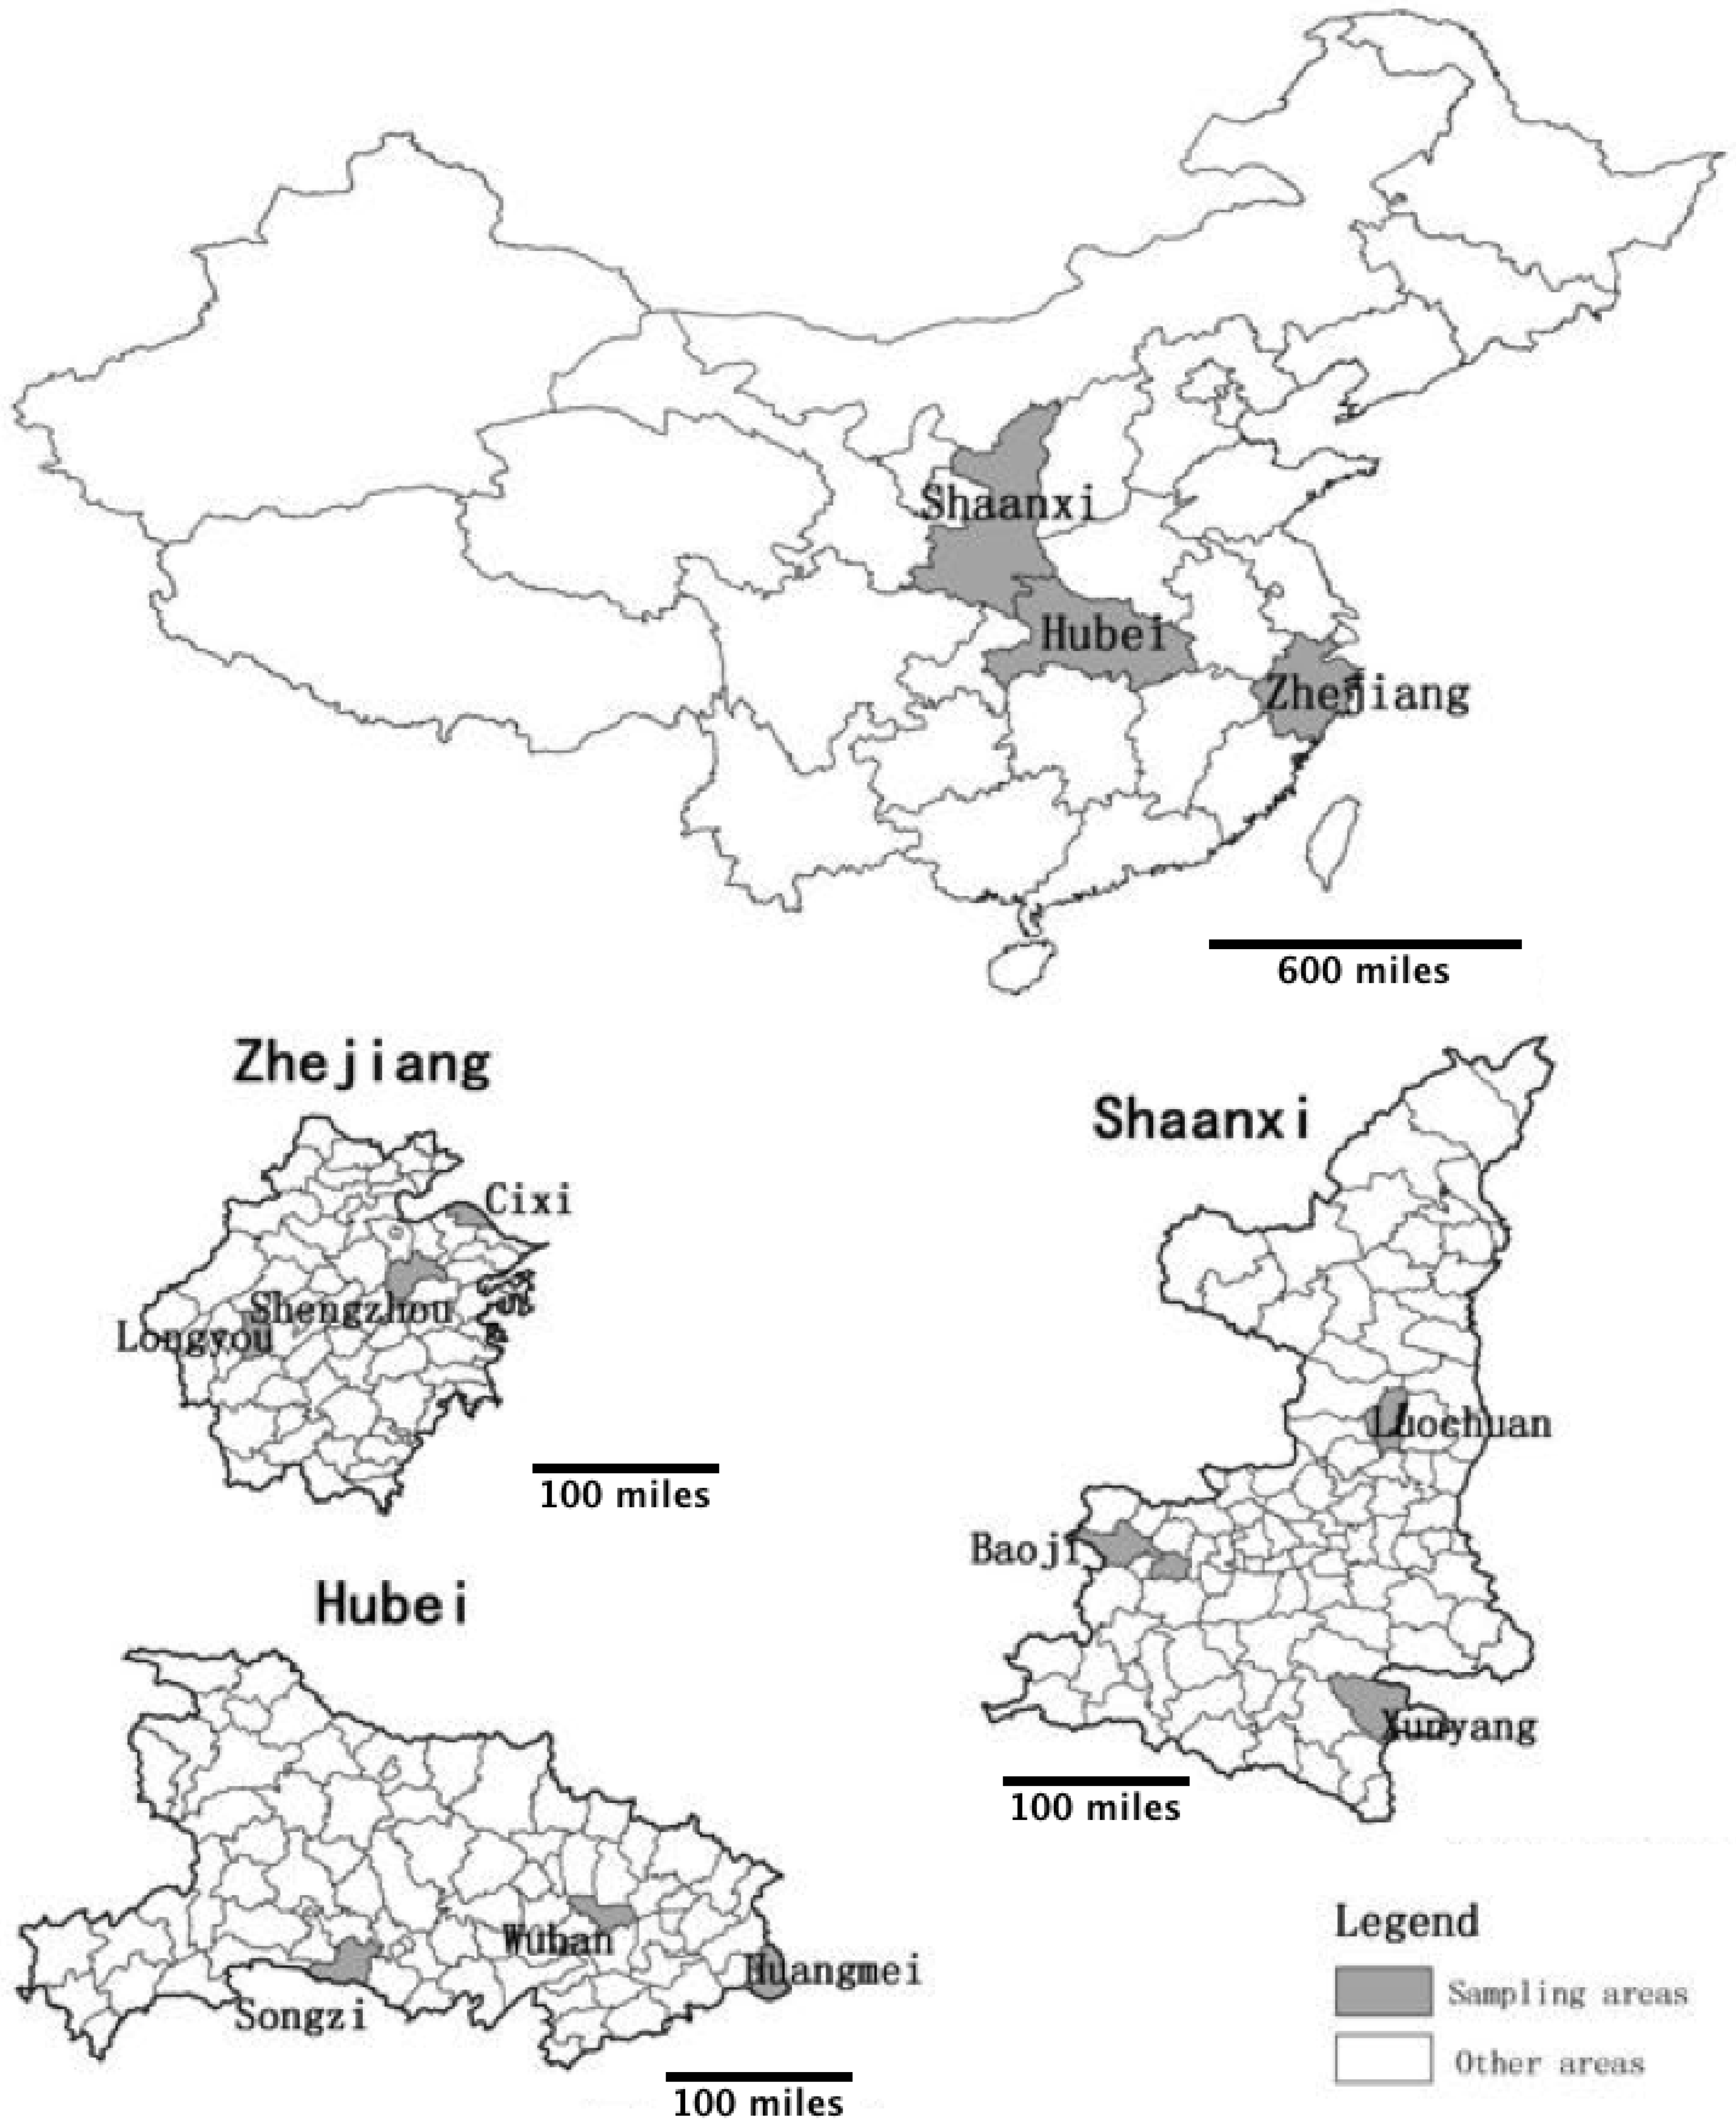
The data were obtained from our own surveys in 54 villages from Zhejiang, Hubei and Shaanxi provinces in China, conducted in June and July 2011. Sample villages were chosen by the stratified random sampling technique. In each province, we picked three counties that encompass variations in their geographical locations, economic development and demographic characteristics. In each county, we picked two towns and, in each town, two villages by the same method. The locations of sample counties and their economic and demographic characteristics are shown in
Figure 1 and
Table 1. Finally, in each village, 18–24 households and a cadre were interviewed face-to-face by a team of 15 interviewers we recruited. In most villages, the interviewed households included two households wealthier than average and two poorer than average, selected by village cadres. Other households were randomly chosen by interviewers. However, in a few villages, all respondents were picked by village cadres, which may cause an upward bias in estimating households’ homestead sizes on the aggregate level because village cadres have a tendency to pick economically above-average households. These interviewers are undergraduate and graduate students from Zhejiang University, who have been trained to ask questions in a uniform fashion and tested in a small-scale pilot survey in Zhejiang Province. In the household survey, household heads or their spouses were asked about their homesteads (e.g., size, age, usage, how they obtained it, etc.), household demographics (e.g., family size and the age, gender, occupation and years of education of each member, etc.) and economic characteristics (e.g., income, expenditure, economic status within the village, etc.). In the interview with village cadres, we asked about village- and regional-level policies on homestead management (e.g., eligibility for free homestead, homestead size limits, regulations on attached houses, etc.) and village characteristics (e.g., per capita income, the amount of farmland, total residents, etc.). Relevant parts of the questionnaires are provided in
Appendix A. Fifty four village-level observations and 1134 household-level observations (over 95% of the total collected data) are considered valid after data cleaning. In the data cleaning process, records with incompatible information (e.g., sons older than the father) or missing more than half of the key variables are excluded.
Since all rural residents have free access to homesteads in China, the identification of the combination effect of free access and marketization collapses to quantifying the effect of marketization, with free access as a background. The following regression is specified accordingly.
denotes the size of household
i’s homestead, measured in four different ways: the size of the primary homestead, defined as the homestead under its primary living house; the size of all homesteads, including the homesteads under primary, secondary and attached houses; whether the primary homestead exceeds the size limits; and by how much the primary homestead exceeds the size limits.
denotes whether household
i is exposed to a homestead market, measured in four ways, including whether there were homestead transactions in the village where household
i resides, the percentage of households experiencing such transactions, whether such transactions exist before household
i obtains its primary homestead and the frequencies of transactions during 2008–2010. We expect
, since homestead markets encourage the expansion of homesteads.
denotes whether a member of household
i works as a village or higher-level cadre.
equals one if so, and zero otherwise. We expect
, as previous studies suggest that cadres may exploit their power to increase living spaces [
25,
26,
27].
is a vector of dummy variables indicating the economic status of household
i within the village, measured in five categories with one being the lowest status and five the highest. We expect households with higher status to have larger homesteads.
denotes the size of household
i.
denotes the share of male members of household
i.
denotes whether the village within which household
i resides forbids attached houses. This is a measurement of the strictness of village-level homestead regulations.
equals one if attached houses are forbidden, and zero otherwise. We expect
.
denotes farmland per capita in the village, measured in mu (1 mu = 1/15 hectare).
denotes net income per capita in the village, measured in RMB yuan.
and
are vectors of dummy variables, indicating the year in which household i obtains the primary homestead and the province in which household
i resides, respectively.
denotes the error term. The description of variables is also summarized in
Table 2.
To test whether village cadres and economically well-off households occupy larger homesteads under marketization, we further include the interactions between and and and in the regression. Both interaction terms should have positive signs, but for different reasons. One the one hand, we expect wealthier households to obtain larger homesteads in the market because their budget constraints allow them to consume more living spaces. On the other hand, cadres may also obtain larger homesteads under marketization because they can exploit their political powers to have larger homesteads allocated to their families.
4. Results
4.1. Rural Homesteads
Table 3 presents the average size of sampling households’ homesteads. The sizes of the primary homestead and total homesteads, on average, are 198.82 and 234.13 square meters, respectively. Households in Shaanxi hold the largest homesteads, followed by households in Zhejiang. Among households that obtain primary homesteads after the official implementation of size limits, over one-third exceeds the size ceilings. Seventeen percent households have multiple homesteads, with 25% in Zhejiang. These show that the efforts to curb rural residential expansion did not pay off. At the same time, rural households do engage in homestead markets, as shown in the last column. The markets are relatively active in Zhejiang, with over 10% of households experiencing transactions.
Table 4 shows the sizes of primary homesteads and houses over time. The size of the primary house becomes larger and larger, which is natural given the growth of income. The size of the primary homestead, however, does not follow the same pattern. It keeps stable before 1995 and then decreases. A plausible explanation is, although homesteads are also normal goods, the size is regulated. As mentioned in
Section 2, by 1994, all three surveyed provinces had implemented officially-documented size limits on homesteads. These results, together with those in
Table 3, show that the regulations are neither fully enforced, nor completely disregarded. They may be uniformly partially effective in all villages, or work reasonably well in a subset of villages.
4.2. Effect of Marketization
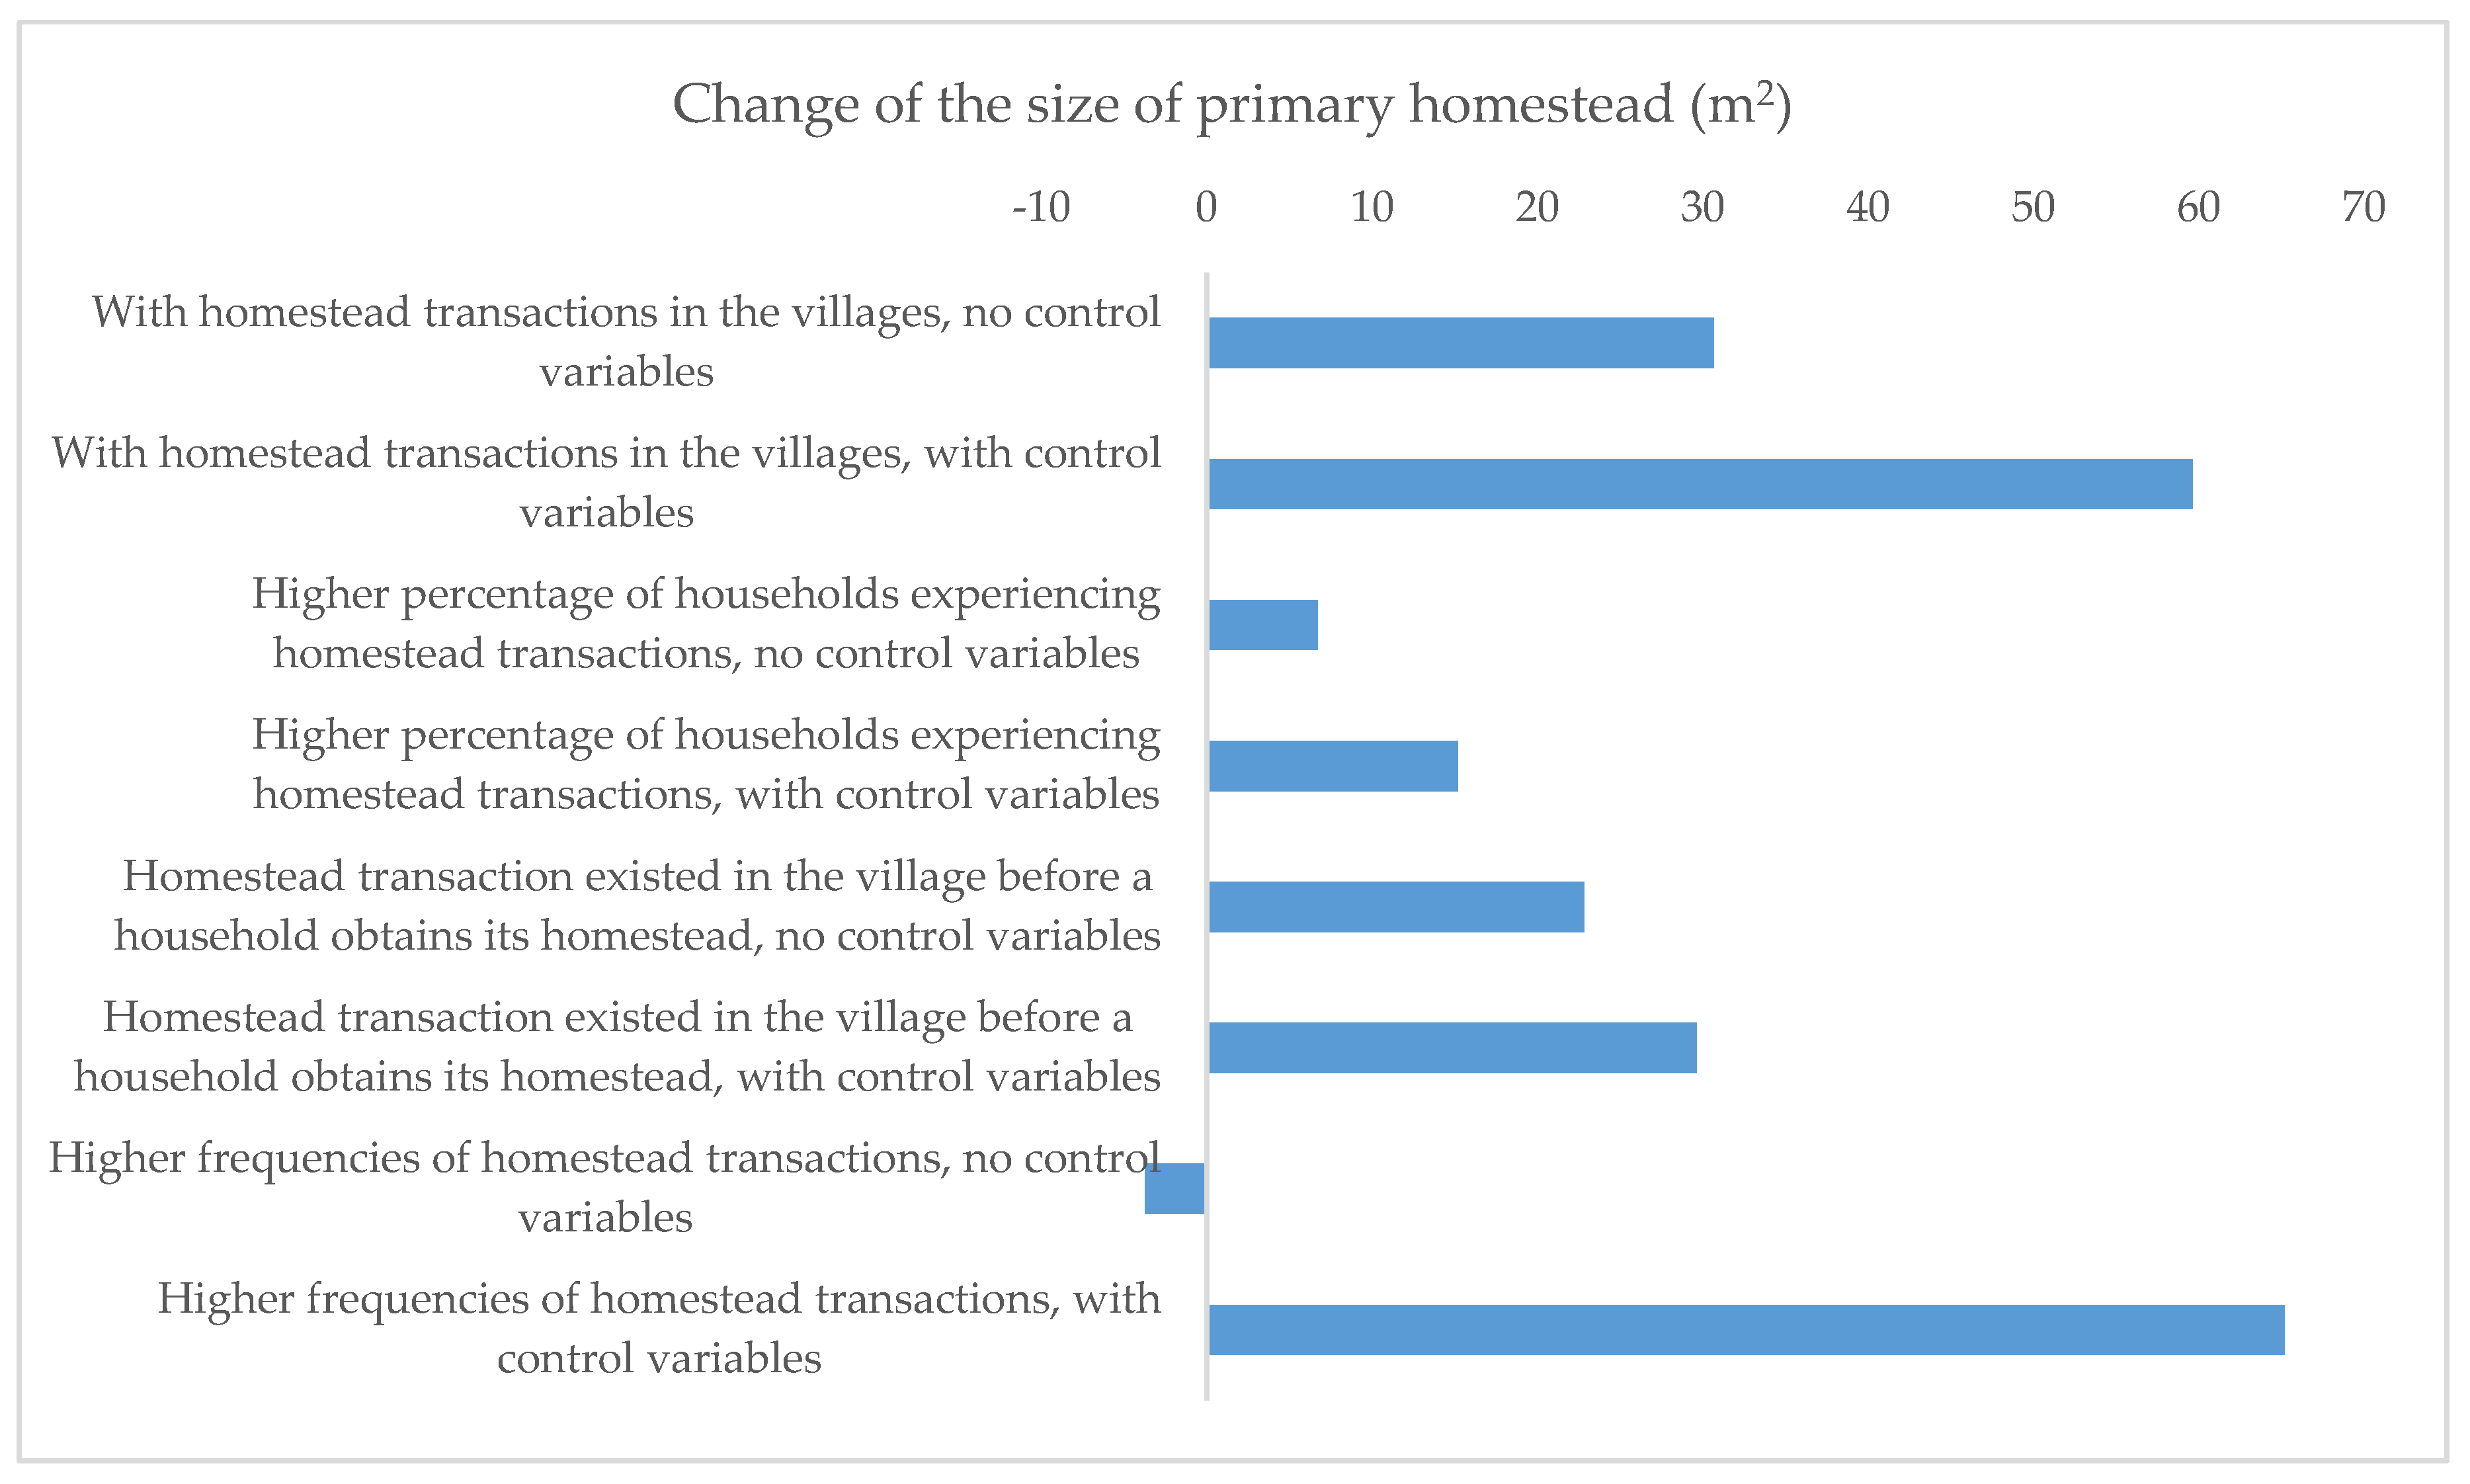
Table 5 shows the main regression results with the size of the primary homestead as the dependent variable;
Table 2 shows the descriptive statistics.
Figure 2 visualizes the key coefficients across columns. The first two columns measure marketization with a dummy variable indicating whether there ever were homestead transactions in the village. The presence of transactions increases the size of the primary homestead by 31 square meters, statistically significant at the 1% level, and the effect almost doubles with covariates controlled. While this result per se only shows that marketization encourages homestead expansion, it is actually with free access working in the background. We interpret the result as the combination effect of both marketization and free access due to the following reasons. On the one hand, marketization alone does not encourage expansion, because households would simply shift from paying for homesteads to rural collectives (when there are no peer transactions) to buying from fellow households (where peer transactions exist). On the other, the pairing-up of marketization and free access sufficiently explains this result, as the gap between the high value of homesteads in the market and the low cost of obtaining it from the rural collectives fuels the desire for expansion. Columns (3) and (4) measure marketization by the percentage of households experiencing homestead transactions in the village. The primary homestead expands by 6.7 square meters, but not statistically significantly so in Column (3), with one percentage increase in the share of transactions. The effect more than doubles and turns significant at the 1% level in Column (4), with covariates added. Columns (7) and (8) measure marketization by the frequencies of transactions during 2008–2010, reported by village cadres. The point estimate in Column (7) is small, negative and insignificant, while the estimate in Column (8) is sizable, but still insignificant.
If a household obtains its primary homestead before any homestead transaction takes place, subsequent transactions could not have affected the size of its homestead. In this sprit, Columns (5) and (6) measure marketization for each household by a dummy variable indicating whether such transactions exist before the household obtains its primary homestead. The effect of marketization is found smaller; it only increases homestead size by 23 square meters and 30 square meters with control variables.
As expected,
Table 5 also shows that village cadres obtain homesteads at least 62 square meters larger in size, and households with low economic status hold homesteads at least 55 square meters smaller. Village-level regulations decrease the size of primary homesteads by over 30 square meters.
Table 6 shows the regression results with the size of all homesteads as the dependent variable. The columns, as those before, measure marketization in different ways. The results are qualitatively consistent with
Table 5, while most of the point estimates become larger. This is sensible to the extent that other homesteads expand simultaneously with the primary homestead. Moreover, the effects of village-level regulations double (results not shown). This is because the regulations are measured by whether the village prohibits attached houses and therefore should have direct and the strongest effects on the homesteads under attached houses.
Table 7 studies the impact of marketization on the probability of the primary homestead exceeding provincial size limits. The size limits are 140 square meters in Zhejiang, 150 in Hubei and 200 in Shaanxi after 1994, and the limits during 1982–1994 are undocumented and therefore cannot be quantified. Thus, we include only households obtaining their primary homesteads after 1994 when we know exactly about their size limits and before 1982 when there were no size limits nationwide. The columns again measure marketization in various ways. The presence of homestead transactions increases the probability of exceeding size limits by 6.4 percentage points, and statistically significantly so at the 5% level. With covariates controlled, the effect almost doubles in Column (2). The probability of exceeding size limits increases by 2.3 percentage points with one percentage point increase in the share of households experiencing transactions. The estimate remains similar in Column (4), with covariates controlled. These effects are not statistically significant at the 10% level, though, indicating that the presence of homestead market matters more than how active it is. In Columns (5) and (6), the point estimates become much larger; the presence of market increases the probability of exceeding limits by over 20% and statistically significant at the 1% level. The point estimates in Columns (7) and (8) are similar to those in Columns (5) and (6), both sizeable and statistically significant at the 10% level.
Table 8 studies by how much marketization encourages the primary homestead to expand beyond limits. The results indicate that with the market, the primary homestead exceeds size limits by over 100 square meters; the effects are statistically significant in most specifications at the 10% level. In sum, the presence of a homestead market, together with free access to homesteads, incentivizes rural households to obtain larger homesteads, and they are able to do so despite the size limits. This is a demonstration of rural residential expansion at the micro level.
4.3. Heterogeneous Effect across Households
Table 9 explores the heterogeneous effect by the cadre status of a household. The columns again measure marketization in different ways. Column (1) shows that cadre households obtain 37-square meter larger primary homesteads than non-cadre households in the absence of markets. With markets, every household obtain homesteads 23 square meters larger, while cadre households, on top of that, get 68 additional square meters. This shows that marketization in general gives households extra incentives to occupy larger homesteads, and cadre households, with their political power, can better fulfill such incentives. This reflects the fact that rural homesteads are in fact largely managed at the village level, and cadres can bend rules to reap additionally benefits. When benefits are enlarged (due to the presence of the market), they do so more aggressively. Column (2), with covariates controlled, replicates the results. Cadres’ primary homesteads are 104 square meters larger than those of others, with homestead markets. The difference is only 31 square meters without markets. Same qualitative results are reported in Columns (3)–(8).
Table 10 explores the heterogeneous effects across households with different economic statuses, as wealthier households may buy homesteads from poorer ones and lead to an uneven distribution of homesteads. The results show that in four out of eight specifications, households with a high economic status obtain significantly larger primary homesteads, compared to households with lower status. In other cases, while households with a high economic status still in general obtain larger homesteads, the confidence intervals are relatively wide.
Table 11 pools the two interactions together. All the above conclusions remain robust. Cadre households obtain significantly larger primary homesteads with the presence of homestead markets. Economically better-off households are found to do the same in a subset of specifications.
5. Discussion
The results of this paper add to our knowledge about rural settlement expansion. This paper is consistent with previous literature in showing that: (1) rural homesteads take up a significant amount of land, and their expansion has not been effectively curbed by the regulations [
17,
24]; and (2) village cadres obtain larger homesteads [
25,
26,
27]. Adding to the literature, this paper further shows that rural settlement expansion may even be exacerbated with the marketization of rural homesteads. The coefficients associated with the Market variable in
Table 5,
Table 6,
Table 7,
Table 8,
Table 9 and
Table 10 show that marketization on average leads to larger homesteads for rural households. This micro-level evidence cannot exist without overall rural residential expansion in these villages. Moreover, this paper also points to the potential inequality problem of homestead marketization: With marketization, the difference in homestead size between cadres and non-cadres would be further enlarged. Policymakers should be aware of this potential drawback and the social unrest it may induce.
We caution towards over-generalization of these results. This paper empirically demonstrates rural residential expansion at the micro level, which does not directly aggregate to the upper levels. The feasibility of aggregation depends on how well the household samples represent the whole village and how well the village samples represent the provinces. While we have some confidence in the former as we strictly followed the stratified random sampling procedure in villages, our confidence in the latter is limited. We interviewed 18–24 households in both large and small villages, due to our small teams of interviewers and tight schedule; as a result, aggregation (without proper re-weighting) beyond the village level would be biased against more populous villages. While the general pattern and conclusion hold across rural China, the specific numbers estimated in this paper do not hold universally. Other provinces, towns and villages have different homestead regulations, and their enforcement of these regulations may be stronger. Nonetheless, in the three surveyed provinces, according to our conversations with provincial-level land use officials, loose enforcement is quite prevalent even among unsurveyed towns and villages.
In general, if rural homestead regulations are strictly enforced, rural settlement expansion would be better curbed. In many Chinese villages, the younger generation is no longer interested in staying in rural regions. As a result, rural homesteads should in fact shrink under strict regulations. Moreover, with fully-enforced homestead regulations, the market transactions of homesteads would have a smaller impact on the average size of household homestead. While larger and wealthier households are likely to obtain larger homesteads in the market, smaller and poorer households are more inclined to sell. These will cancel out, and on average, a household’s homestead will stay largely at the same size, while the coefficients associated with the Market variables in
Table 5,
Table 6,
Table 7,
Table 8,
Table 9 and
Table 10 should be essentially zero. Strict enforcement, of course, is a highly unrealistic scenario. Taking into consideration the interests of village cadres and the limited resources available for regulation enforcement at the township and village levels, strict enforcement is hardly achievable. However, with the increasing tension between rural homestead expansion and farmland preservation and urban expansion, we did witness stricter and stricter enforcement, especially in villages along the east coast of China. Thus, we have reasons to expect the slow-down of rural settlement expansion among eastern China as land resources become more and more scarce.
6. Conclusions
This paper shows that despite the will of the central government to curb rural settlement expansion, the three policy goals—free access to homesteads, homestead marketization and the control of expansion—have some conflicts. In fact, the combination of the former two encourages expansion. We are faced with and must confront such trade-offs.
Using survey data from three provinces in China, this paper finds that households in villages with homestead markets on average obtain primary homesteads 60 square meters larger and 10% more likely to exceed the provincial size limits. This shows that the presence of markets makes the (free) homesteads more lucrative, and households strive to obtain larger homesteads. Worse still, since homesteads are managed largely at the village level, we find that village cadres obtain 103-square meter larger homesteads than other community members in villages with markets, more than tripling the difference in villages without markets. This indicates serious rent-seeking behaviors, which jeopardize social equality. In sum, a trade-off ought to be made among the three policy goals, and the evidence shows that sustaining free access while nurturing a homestead market would lead to an exploitation of land resources and threaten rural sustainability.
This paper conveys a clear message to policymakers. That is, strict enforcement of homestead size regulations is a pre-requite for homestead markets to improve land use efficiency, and it is the key to slowing down rural settlement expansion while maintaining the other two objectives, free homestead access and homestead marketization. Thus, governments must make a commitment to increase resources available for village-level regulation enforcement, including public funds, staff, infrastructure and educational efforts. An effective monitoring system at the village level, assisted by GIS technologies and village- and upper-level officials, should also be put into place. In addition, anti-corruption efforts could also be of help in trimming down over-sized homesteads occupied by cadres. It is worth mentioning that multiple provinces in China have experimented with policies that encourage rural households to withdraw from their homesteads and live more compactly, in middle- and high-rise buildings [
28,
29,
30]. These policies increased land use efficiency and sized down rural settlements, but were accompanied by many drawbacks at the same time [
31]. A more detailed discussion of the benefits and costs of such policies is beyond the scope of this paper; we leave it to future research.
The trade-offs of the three objectives should also be tailored to local conditions. In suburban regions where homesteads are more marketable and settlement expansion are quite rapid, the policy emphasis should be placed on marketization and containment, while free access can be replaced by use right fees. In contrast, in rural areas far away from cities, where homesteads are rarely marketable, the emphasis can be placed on securing free access and preserving farmland with stricter enforcement of homestead regulations. Of course, the trade-offs should be fluid with the change of local situations.
It is worth noting that these policy recommendations serve to achieve the goals in the United Nations’ 2030 Agenda for Sustainable Development, especially Goals No. 2 and No. 11 [
32]. Goal No. 2 aims to “end hunger, achieve food security and improved nutrition and promote sustainable agriculture”. The above policy recommendations help contain rural settlements and protect agricultural land, which secure food sustainability and lay the foundation for rural productivity. Goal No. 11 aims to “make cities and human settlements inclusive, safe, resilient and sustainable”. By strengthening rural planning, these policies can help build more efficient rural residential settlements and induce economic, social and environmental harmony in rural China. These efforts are also a part of soil sealing control [
33].
As mentioned at the beginning of this paper, in 2013, the central government of China emphasized both free access to rural homesteads and encouragement of rural housing transfer. This paper used past experiences to shed light on the potential outcome of such a policy combination in exacerbating rural settlement expansion. We acknowledge that while extending past trends into the future can be informative, it cannot replace the direct analysis based on data collected after the implementation of the 2013 policies. Since the effects of these young policies are yet to be revealed, we leave it to future research.


