Article

Adjustable Model of Renewable Energy Projects for Sustainable Development: A Case Study of the Nišava District in Serbia

1
High school of Electrical Engineering “Nikola Tesla”, Aleksandra Medvedeva 18, 18000 Nis, Serbia
2
Department of Civil Engineering, Faculty of Construction Management, University “Union-Nikola Tesla”, Cara Dušana 62-64, 11000 Belgrade, Serbia
3
Department of Mathematics, Faculty of Electronic Engineering, University of Niš, Aleksandra Medvedeva 14, 18000 Nis, Serbia
4
Department of Construction Management, Faculty of Technical Science, University of Priština, Knjaza Miloša 7, 38220 Kosovska Mitrovica, Serbia
*
Author to whom correspondence should be addressed.
Sustainability 2018, 10(3), 775; https://doi.org/10.3390/su10030775
Submission received: 15 January 2018 / Revised: 1 March 2018 / Accepted: 3 March 2018 / Published: 12 March 2018

Abstract

:
This paper explores and ranks the key performance indicators of multi-criteria decision-making in the process of selecting renewable energy sources (RES). Different categories of factors (e.g., political, legal, technological, economic and financial, sociocultural, and physical) are crucial for the analysis of such projects. In this paper, we apply the fuzzy analytic hierarchy process (fuzzy AHP) method—a mathematical method—in order to analyze the main criteria for such projects, which include the environment, the organizational management structure, project participants, and participants’ relationship with the performance indicators. In order of ranking, the indicators are the following: time, costs, quality, monitoring the project’s sustainability, user feedback, and users’ health and safety. The aim of this paper is to point out the necessity of creating an adjustable model for renewable energy projects in order to proceed with the sustainable development of the southeast part of Serbia. This model should lead the creation process for such a project, with the aim of increasing its energy efficiency.

1. Introduction

Renewable energy sources (RESs) and the new technologies that are using these sources are becoming increasingly important in all areas of life, especially those that impact the environment. Through the use of RES, the consumption of non-renewable energy resources is reduced, which is very significant from the perspective of protecting the environment. The replacement of fossil fuels with renewable energy contributes to the successful solution of global environmental problems, and leads to the efficient exploitation of resources that are available in the relevant territory. Stopping climate change is the one of the most serious global problems at present, and all countries should participate. Serbia has a large amount of renewable energy, but its greatest potential is in biomass, which makes up 61% of its total renewable energy. Wind energy is estimated at 2.3 billion kWh per year, which is 7% of the annual production of electricity [1].
Furthermore, Serbia has significant hydropower potential, which is estimated at 25 TWh per year, and of which 17.5 TWh is annually recognized as economically viable to use. Based on the currently available capacities of the electric power system of the Republic of Serbia for the provision of tertiary reserves, it was adopted that the maximum technically usable capacity of solar power plants is 450 MW; i.e., their technically usable potential is 540 GWh/per year (0.046 million ton of oil equivalent per year). By 2020, Serbia should have reached the goal of drawing 27% of its total final energy consumption from renewable sources, and renewable energy plants with a total capacity of 1.058 MW should be built. According to the National Action Plan for renewable energy, plans for the future division of energy include 36% renewable power, 30% heating and cooling, and 10% transport [2]. It is important to point out that the implementation of energy efficiency has a significant impact on reaching sustainability goals. Energy efficiency and renewable energy are two tools by which energy sustainability in the community can be achieved.
In Serbia, the organizations that construct, modify, and maintain the different objects that are formed through projects using renewable energy are poorly integrated. A comparison of the commitments that Serbia and the European Union (EU) member states have made toward renewable energy sources (RES) are shown in Figure 1 [3]. Joining the EU and adopting the legal norms of the EU in the future—particularly those relating to energy and the environment—will be the main drivers for reducing greenhouse gas emissions in the energy sector in Serbia. However, future international opportunities and obligations will have significantly less influence than domestic momentum, due to delays in international negotiations. Decisions that will be made in the energy sector in the near future can lead to potentially high costs over a long period of time, as exists for carbon [4]. For this reason, it is important to create a strategic framework for energy policy in Serbia that will adequately take the issues of climate change and environmental protection into account. It is considered that in the area of climate change, a policy can be successful only if it is designed to account for account economic and social realities as well as goals. At present, very few applicable legal and strategic documents in the field of energy are related to climate change. The most important documents that need to be adopted and implemented are a comprehensive strategy concerning climate change, and an action plan. Additionally, Serbia needs to create a legal framework for considering climate change goals within sectoral policies. However, current administrative and executive capacities concerning climate change are insufficiently developed in Serbia. There is a certain base of knowledge, but it is limited and disorganized. The plan of development for low greenhouse gas emissions is in the earliest stages of development, both in Serbia and in the Nišava District. The development of the energy sector must be socially tolerable; i.e., possible sudden changes in the energy market cannot have much serious social impact on the majority of the population. Possibilities given by the dynamic development of the energy sector in terms of rational cost allocation and benefits at the regional level should be considered. The key positive social consequences of such energy sector development will include employment, an increase in living standards, improvements in the status of human rights, and improvements in the possibility of using public goods. New technological solutions that are based on market stimulations must guarantee that a more efficient, cleaner, and more renewable energy sector will be socially sustainable as well [5,6].

2. Research Methodology

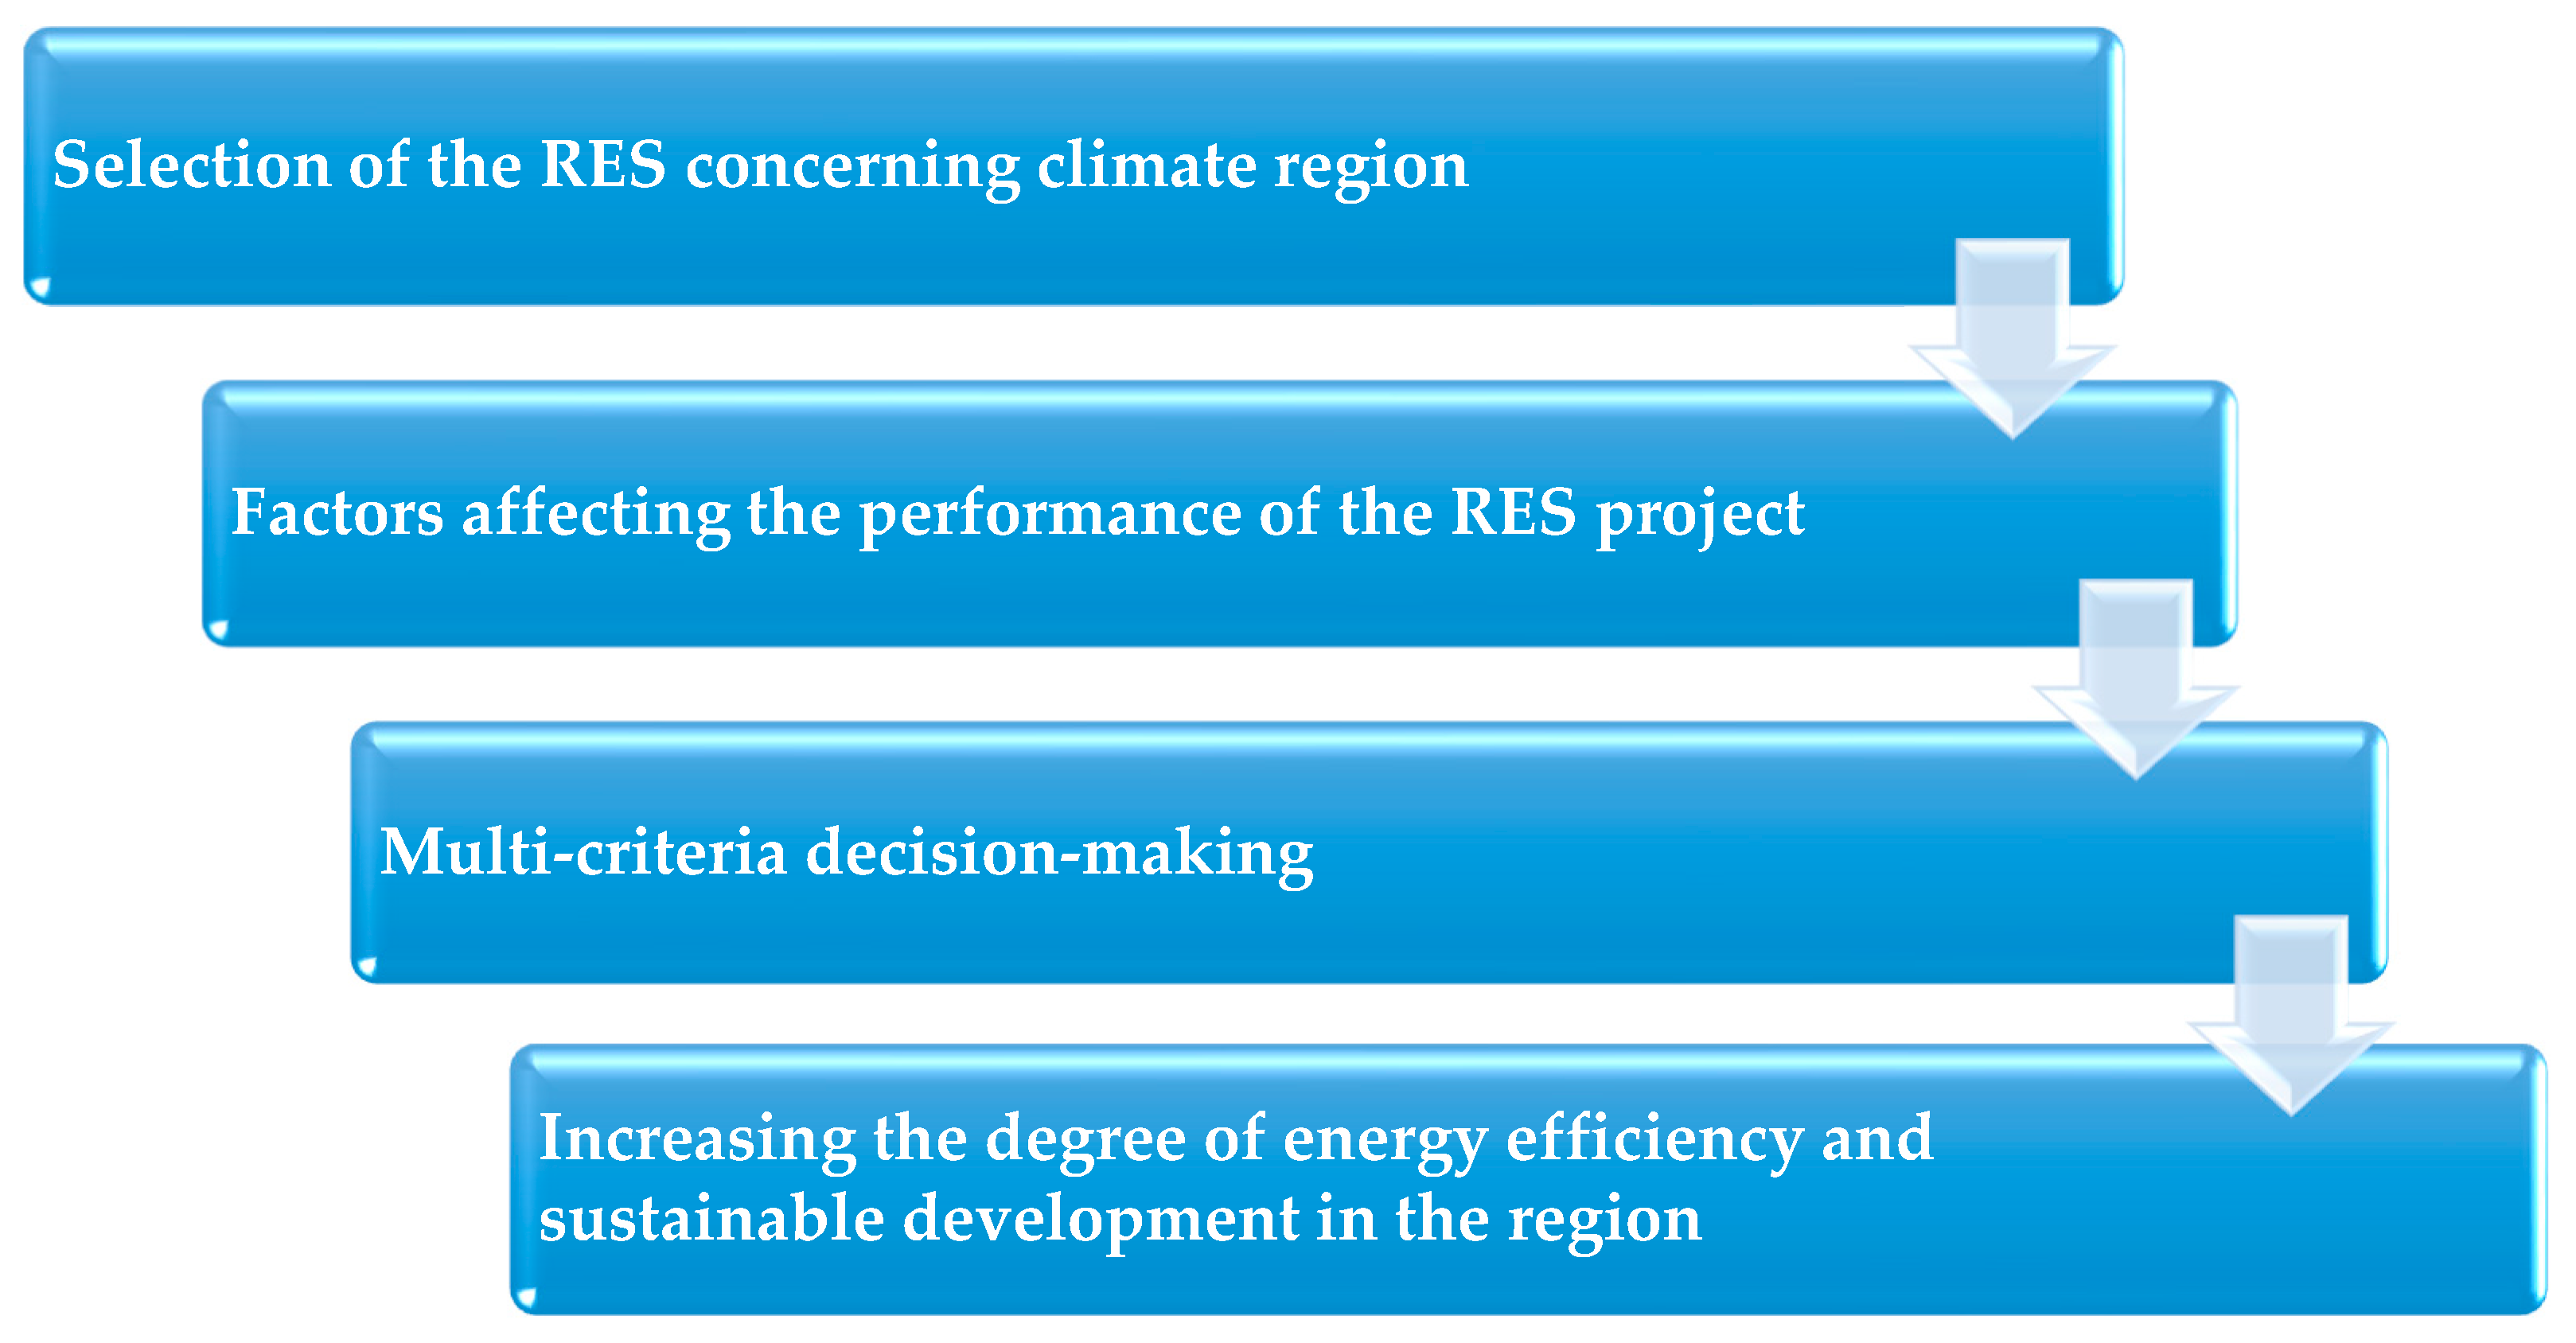
Our research methodology is based on the four phases of RES project development, which are mutually interdependent, and are represented by phases through the specific modules shown in Figure 2. For our research, the phase 1 RES type is the one that makes sense for project concepts concerning a climatic region. In phase 2, the different factors that impact the performance of the RES project are considered [7]. Phase 3 examines how to define an adjustable model by fuzzy multi-criteria analysis concepts through a set of criteria and sub-criteria that rank the proposed factors and performance indicators. In order to reduce energy consumption, new energy-efficient facilities and the sustainable project of the RES in the Nišava District are designed in phase 4.

2.1. Case Study: Select RES for the Development of Projects in the Nišava District

Due to the limited amount of fossil fuels that are available, as well as their effects on the environment, there is increased interest in using renewable forms of energy and developing technologies to increase their efficiency. As a result, using renewable energy sources such as solar energy, wind energy, biomass energy, geothermal energy, hydropower, and cogenerated energy has intensified [8].
For the production of electricity from geothermal sources, the temperature must be 100 °C, while the temperature of geothermal sources in Serbia is frequently around 40 °C. Geothermal water is used in the “Niška Banja” Spa for balneotherapy and hotel heating using heat pumps. Geothermal water in the “Sićevo” gorge has a temperature of 22 °C and a flow of about 10 L/s [9]. The quality of the water is good, so it can be bottled. In the valley of the “Toponička reka” river, there are the villages “Kravlje” and “Miljkovac”. In the locality of “Kravlje”, the flow rate of the water is 10 L/s, and the temperature is 30 °C. The use of its water should be modernized, with the construction of facilities for tourist purposes and balneotherapy under the open sky or in nature. At “Miljkovac”, there are geothermal springs, and the water temperature is 36 °C. According to our assessment, at the current location, the exploitation of geothermal water is possible in the quantity of 50 L/s, with a temperature of 40–45 °C. On site at “Jelašnica”, about 5 L/s of the rare mineral water with chemical composition and temperatures around 20 °C can be exploited. The area of the “Suva Planina” mountain, and north of the courts of “Niška Banja” Spa, are ecologically of good quality (i.e., are not inhabited and have favorable hydrogeological characteristics). Geothermal heat energy can first be drawn from geothermal water, and when it has cooled, it can be bottled. Natural sources of water have temperature of 35–40 °C, and a flow of around 100 L/s. Small hydropower plants (i.e., energy facilities that can be built with a strength of up to 10 MW and fall into the category of soft energy producers) can be larger depending on the rainfall. From the water-carrying sandy gravel of Nišava alluvium directly above the city of Niš—which goes into the revitalized water intake system—today, 600 L/s of water must be pre-treated with chlorine (coagulation, fluctuation, filtrating) in order to get high-quality drinking water.
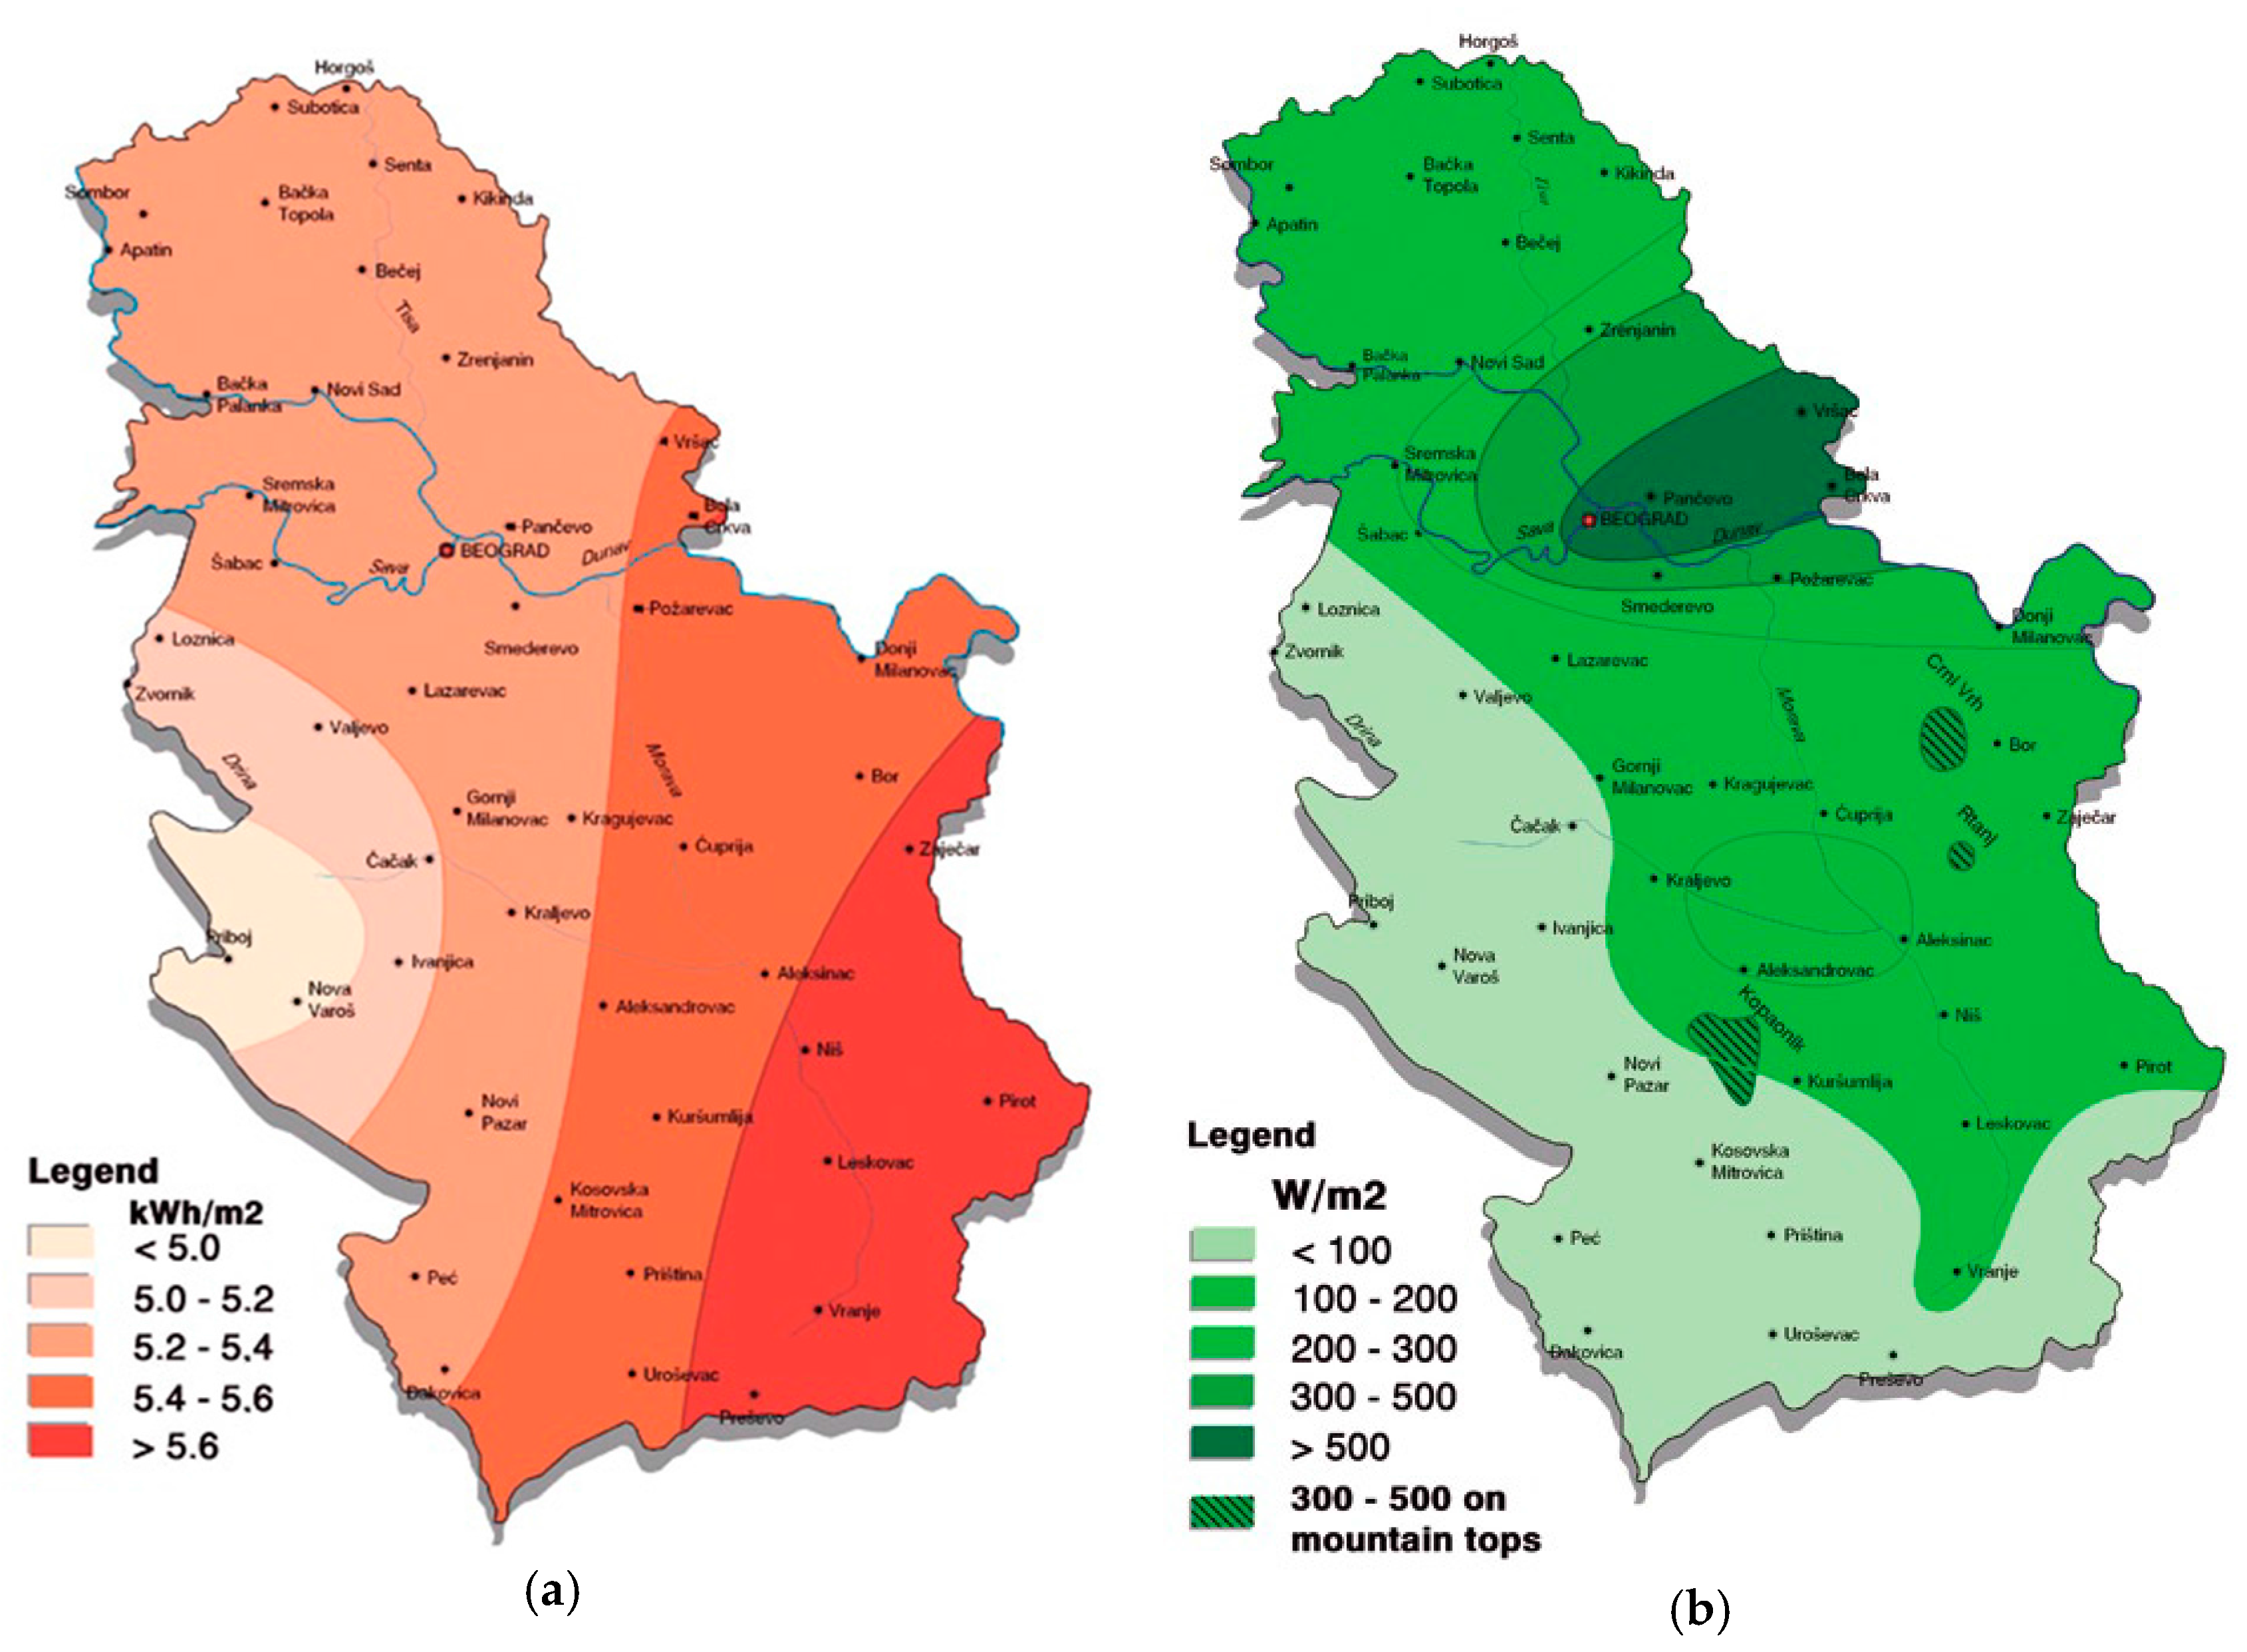
It is necessary for the wind to blow at least 2800 h per year with an average speed of over 6 m/s (one year has 8760 h) over certain locations in order to use the wind as an RES and consider the location for the construction of a wind park. Only the location at the top of the old mountain “Midžor”, which has an annual average of 7.6 m/s, qualifies; it has a degree of efficiency of about 28%. Finally, the greatest potential for the use of solar energy is in the south of Serbia, and the cities with the highest potential are the cities of “Niš”, “Vranje”, and “Kuršumlija”. The average intensity of solar radiation in this territory is 1.7 kWh/m2/day in January, and between 5.9–6.6 kWh/m2/day in July. Year-on-year, the average annual value of the radiation energy of the territory of Serbia is of 1200 kWh/m2/year in northwestern Serbia to 1550 kWh/m2 in southeastern Serbia, while it is about 1400 kWh/m2 in central Serbia. It is important to note that the availability of solar energy is excellent in most months of the year when the number of solar hours is great and solar radiation is strong, as shown in Figure 3 [1].
From an environmental point of view, technology should be considered in the development of strategic plans. Appropriate technology is selected based on the availability of local energy resources and equipment, trained human resources, the degree of material resources, and the degree of the local construction resources. However, for the development of the project in the Nišava District, the construction of the renewable energy technologies and resources of developed countries is required [10,11].

2.2. External Factors, Internal Factors, and Quality Indicators of an RES Project

The success of a construction project mainly depends on the success of its performance. One of the main causes of poor performance in the construction industry has been attributed to the inadequate selection system of public procurement [12]. Performance issues in the construction industry in the southeast part of Serbia can be classified as problems that emerge from inadequate infrastructure in the industry (mainly the supply of resources), or a lack of infrastructure altogether. Problems often result from clients, consultants, and contractors due to their incompetence/inadequacy [13]. Common problems include those related to poor budget and time management [14]. Problems are most common with large construction projects for a variety of reasons, such as incompetent designers/artists, poor assessment, management changes, social and technological issues, issues related to the place, and the improper handling techniques and tools. The main problems regarding performance can be divided into two groups: (a) unrealistic goals (e.g., planning) or (b) problems during construction (which in many cases are the reasons for the variance from both sources). Traditional systems for performance measurement have problems due to the large and complex amount of information, which should be accessible to the decision maker. The decision maker also ought to be able to understand, organize, and use this information to organize the construction project and manage the performance of the contractors [15]. Traditional performance control projects are usually generic (for example, cost control techniques). They rely on manual data collection, which means that it takes longer (normally once a month), evaluation sometimes takes place after the event occurred (i.e., not in real time), and of course, the data that is returned is of low quality. Architectural and engineering firms may have difficulties in project management if they are not familiar with this new working environment. The performance of international construction projects involves complex factors and dynamic systems, unlike domestic projects, which are often exposed to external factors of uncertainty related to political, legal, institutional, economic, financial, social, and cultural risks, as well as challenges related to inadequate physical infrastructure [16].
The main performance criteria for projects include their financial stability, progress, quality standards, health and safety, resources, requirements, contractual disputes, reputation, agreements, and relationships with customers, consultants, and subcontractors [17]. The timing of building is of extreme importance, because it often serves as a key factor in assessing the performance of the project and the efficiency of the project’s organization [18]. Categories of operation that are taken into consideration include the people, cost, time, quality, health and safety, environment, customer satisfaction, and communication. The control system is an important element that identifies the factors that affect the project [19]. For each of the project goals—whether there are one or more—there are essential performance indicators. Planners play an important role in determining the performance of the project, and of course, the quality of the contractors and suppliers affect the time that it takes to minimize the costs, problems, and requirements that arise as a result of delays [20]. The most important part is the contract quality control document, which provides quality answers to any changes in the contract.
The construction environment is the aggregate of the surrounding conditions or influence, so it is important to consider the environment—as well as all additional external influences—in the building process [21]. So, the environment includes the whole project, including the production technology, the nature of the products, customers, and competitors, the geographical region, and economic, political, and climatic factors.
A review of the hundreds of project results provided by the World Bank indicates that success or failure often depend on factors in the global environment that are beyond the control of the project head [22]. In project management, it is important to understand the different characteristics and factors in the environment that can have an effect on the project. This can be the basis of an analysis that enables a manager to overcome or mitigate their effects on the performance of the project. In addition to their traditional functions, managers of the project need to participate in the process of testing environments in order to identify potential problems, and try to establish a balance between criteria and sub-criteria, since successful implementation depends on such a balance. Some internal factors are more challenging for projects than external factors, such as management and organizational structures [23]. These factors should be the main focus of project management. The analysis of the key elements of the environment does not necessarily resolve all of the problems; some of them are indeed structural. However, it may enable the establishment of realistic goals and a timely project alert to possible problems.
On the basis of requests, clients have established the proper organizational management structure and procedures to overcome the effects of the environment. A concept development project is based on observed environmental factors such as political, legal, institutional, cultural, sociological, economic, financial, technological, and physical resources (infrastructure) [4,24].

2.3. Multi-Criteria Decision Making—Fuzzy Analysis

Project concepts for renewable energy systems involve many factors. The use of multi-criteria decision-making methods should help decision-makers solve problems in the case of a large variety of alternatives. Generally, in the processes of decision-making and solution optimization during the development of an RES project concept, the factors and indicators have often been mutually opposite. In the original analytic hierarchy process (AHP) method, human judgments are represented as crisp values. However, in many practical cases, the human preference model is uncertain, and decision-makers cannot assign crisp values to comparison judgments [25].
The fuzzy logic is tested under decisions that are based on multiple rules and consider multiple sets of information. The method in the fuzzy inference process, and the method of the center of gravity in the defuzzification process, were applied by using the original software. The number of linguistic terms in each fuzzy set determines the number of rules. In most applications, certain states can be neglected—either because they are impossible, or because a control action would not be helpful. It is therefore sufficient to write rules that cover only parts of the state space. Besides, an appropriate priority classification of the criteria is essential in order to corroborate the outcome of the fuzzy methodology [26].
The use of fuzzy set theory allows decision-makers to incorporate unquantifiable information, incomplete information, unobtainable information, and partially-unknown facts into the decision model [27,28,29]. The fuzzy AHP method is an extension of the crisp AHP method, in which human judgments are represented as fuzzy values. Using fuzzy numbers to evaluate external and internal factors and performance indicators helps to represent the actual problem of the project concept more realistically [30]. Criteria and sub-criteria might be defined in different ways [12], but the proposed list has been shown in Table 1.
The use of fuzzy AHP for multiple criteria decision-making requires scientific weight derivation from fuzzy pairwise comparison matrices. Existing approaches for deriving fuzzy weights from fuzzy pairwise comparison matrices are too sophisticated and rare to be applied, while the approaches for deriving crisp weights from fuzzy pairwise comparison matrices are either invalid or are subject to significant drawbacks, such as producing multiple (even conflicting) priority vectors for a fuzzy pairwise comparison matrix, leading to distinct conclusions. To address these drawbacks and provide a valid yet practical priority method for fuzzy AHP, we have proposed a logarithmic fuzzy preference programming-based methodology for fuzzy AHP priority derivation in this paper. It formulates the priorities of a fuzzy pairwise comparison matrix as a logarithmic nonlinear program, and derives crisp priorities from fuzzy pairwise comparison matrices. Theoretical analysis has revealed that this methodology can produce a unique optimal priority vector for any fuzzy pairwise comparison matrix [31].
The mathematical basis for the fuzzy AHP method consists of matrix theory and fuzzy arithmetic. In this paper, we use triangular fuzzy numbers [32]. A fuzzy number is a special fuzzy set F = {(x, µF(x)), xR}, where x ∈ (−∞, +∞), and µF(x): (−∞, +∞) → [0, 1] is a continuous function. A triangular fuzzy number can be denoted as M = (l, m, u), and the membership function is:
μ F ( x ) = { x l m l ,   x { l , m } u x u m ,   x { m , u } 0 ,   o t h e r w i s e ,
where lmu, l and u stand for the lower and upper value of the support of M, respectively, and m is the modal value. When l = m = u, it is a “normal” crisp number.
The main laws for operations for the two triangular fuzzy numbers M1 and M2 are:
M1M2 = (l1, m1, u1) ⨁ (l2, m2, u2) = (l1 + l2, m1 + m2, u1 + u2),
λM1= λ⋅(l1, m1, u1) = (λl1, λm1, λu1), ∀λ > 0,
M1M2 = (l1, m1, u1) ⊗ (l2, m2, u2) = (l1l2, m1m2, u1u2), l1, l2 > 0,
M 1 1 = ( l 1 ,   m 1 ,   u 1 ) 1 = ( 1 u 1 , 1 m 1 . 1 l 1 ) .
According to Chang’s extent analysis method [33], the value of the fuzzy synthetic extent is defined as:
S i = j = 1 m M g i j [ i = 1 n j = 1 m M g i j ] 1 ,   i = 1 ,   2 , ,   n ,  
where M g i j is a triangular fuzzy number representing the extent analysis value for the decision element i with respect to goal j, and ⨂ is the fuzzy multiplication operator.
Triangular fuzzy numbers are ranked by applying several methods. These include the center of gravity method, the dominance measure method, the α-cut with interval synthesis method, and the total integral value method. The total integral value method presented by Kulak, Durmusoglu, and Kahraman in [34] is used in this paper. For the given triangular fuzzy number M = (l, m, u), the total integral value is defined as follows:
I T λ ( M ) = 0.5 ( λ u + m + ( 1   λ ) l ) ,   λ [ 0 , 1 ] ,
where λ represents an optimism index. It describes the decision-maker’s attitude toward risk: the smaller value of λ indicates a higher degree of risk (a lower degree of optimism). Values 0, 0.5, and 1 are used to represent the pessimistic, moderate, and optimistic views of the decision-maker, respectively. If I T λ ( M 1 ) < I T λ ( M 2 ) , then M1 < M2; if I T λ ( M 1 ) = I T λ ( M 2 ) , then M1M2; if I T λ ( M 1 ) > I T λ ( M 2 ) , then M1 > M2.

2.4. Increasing the Degree of Energy Efficiency and Sustainable Development

The key performance indicators of the energy sector in Serbia include its low energy efficiency (both in production and in consumption), outdated technology in the production sector, low level of investment, unrealistically low price of electricity, low share of renewable energy sources, and irrational consumption of practically all forms of energy. Reducing energy consumption with renewable energy would allow the further development of certain forms of energy while maintaining a healthy environment through the sustainable development of the Nišava District.
Sustainable development means a balance between satisfying basic needs, achieving a certain standard of living with available natural resources, and preserving the environment. The implementation of renewable energy technologies can be monitored from different directions depending on the needs of existing economic and financial policies and the choice of socio-technological resources, such as in the other study cases [35]. This is very useful to those who make the decisions to set up renewable energy sources through projects, encourage sustainable development by creating new markets, or adapt the existing facilities. Existing facilities can be identified as relatively large energy consumers. Education and training programs should be established in order to strengthen local knowledge of renewable energy technologies. Raising the level of energy efficiency in the field of renewable energy would require the efficient use of energy by applying optimal measures aimed at: reducing energy consumption with financial savings, increasing the flexibility of the energy systems, improving the quality of local production facilities, reducing maintenance costs, and extending the lifespan of the facility. All of these would contribute to protecting the environment and reducing global climate change [36]. The measurement of energy consumption in existing facilities and the presentation of the energy performance of facilities during the analysis of the project concept both aim to permanently reduce energy needs when designing, constructing, and using new facilities or repairing and reconstructing existing ones. Energy consumption in existing facilities represents the maximum percentage of total energy consumption, which averages at about 39–42%. Today, national action plans for energy efficiency and the need for reducing energy consumption in existing facilities are the center of attention. As a result, they have been subject to numerous research and development initiatives and demonstrations, strategic regulatory programs and measures, financial incentives, regulatory development, and authoritative standards.
The ultimate goal of our efforts to increase energy efficiency is the development of facilities with net-zero energy consumption. A facility with zero-level total energy consumption annually receives no more energy than it produces—this means construction without heating and cooling from conventional energy sources. The sustainability of building activity and the implementation of renewable energy in the life cycle through projects are essential factors for success—especially considering the turbulence and rapid growth of competition in the energy efficiency market [37]. In times of crisis and general economic uncertainty, the promotion of sustainable development and energy efficiency through renewable energy sources is an essential factor for the long-term review of successful business companies.

3. Results Based on Performances Ranking for RES Projects

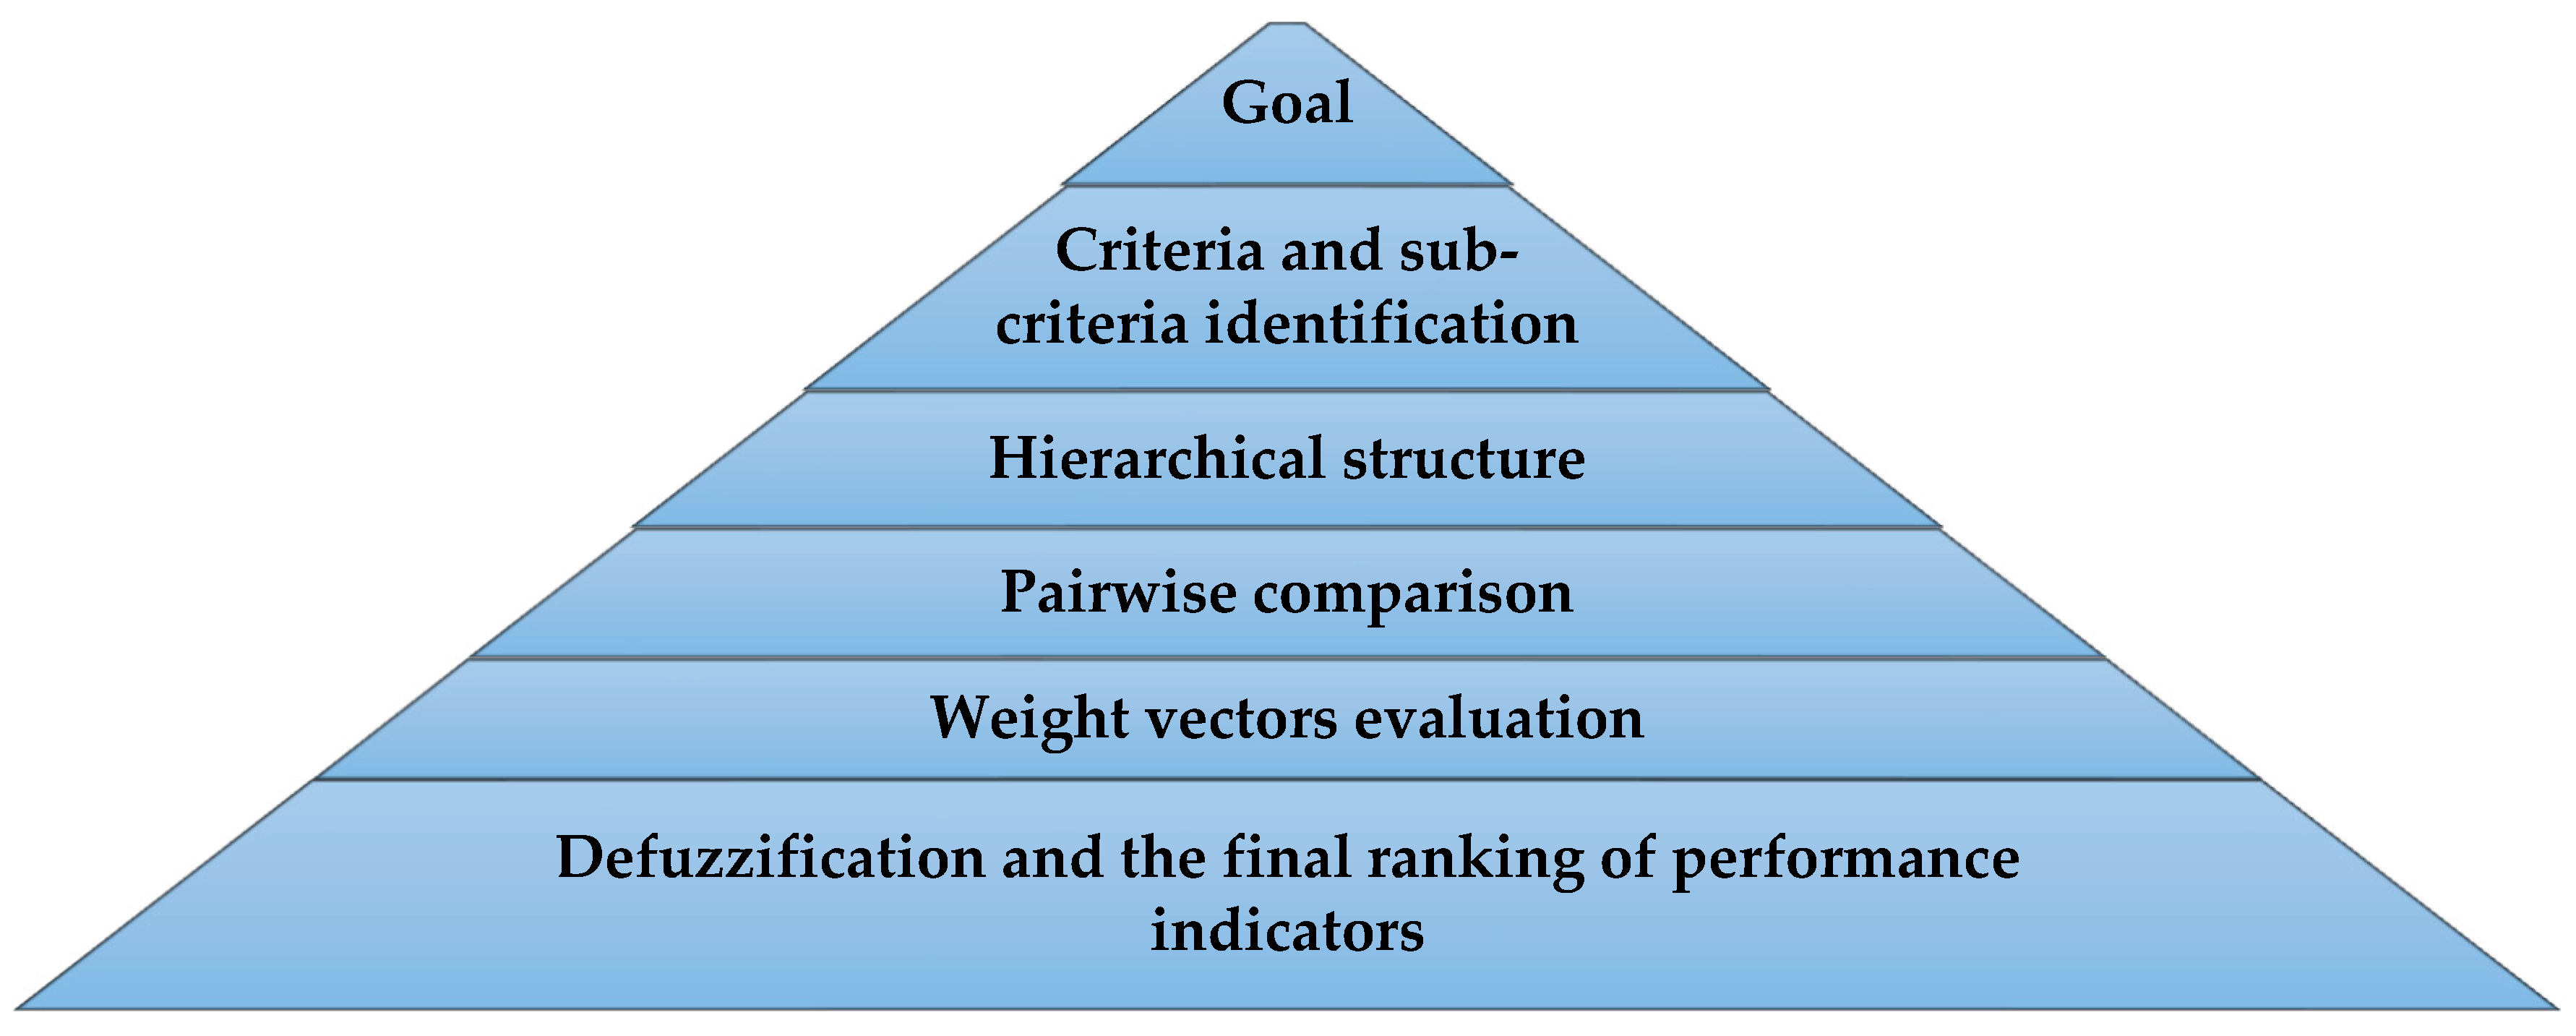
Fuzzy AHP involves the following steps:
  • the overall goal is identified and clearly defined
  • the criteria and sub-criteria that contribute to the overall goal are identified
  • the hierarchical structure is formed
  • pairwise comparison is made using a fuzzified Saaty’s evaluation scale
  • the priority weighting vectors are evaluated using the eigenvalue method, the fuzzy extent analysis, and the aggregation principle
  • the defuzzification and the final ranking of performances are conducted.
The fuzzy AHP method is applied to the ranking of criteria/sub-criteria for RES projects, as presented below in Figure 4. Figure 4 presents a review of all of the steps of the fuzzy AHP algorithm.
The goal is to rank the key performance indicators of the project. Basic requirements, on which RES project is based, are identified as criteria and sub-criteria. Key performances of the project are determined by expert assessment using the fuzzy sets that characterized each criteria and sub-criteria.
The highest rank goes to the factor that—in the opinion of the expert—is the most significant, and the lowest rank goes to the least significant factor. If some factors are equally important, they are assigned the same ranks. Ranking that does not include the same ranks applied to varying factors is called strict ranking (total order); otherwise, it is free ranking (weak order). During the ranking of performance indicators, the sum of ranks assigned to the elements should be equal to the sum of a series of integers from 1 to n, where n is the number of ranked elements. In order to meet this requirement, even when the ranking is free, standard ranks are also applied. They are determined as the arithmetic mean of the ordinal numbers of elements in the ranked series of the same rank.
The fuzzy AHP was developed in order to solve the hierarchical fuzzy problems.
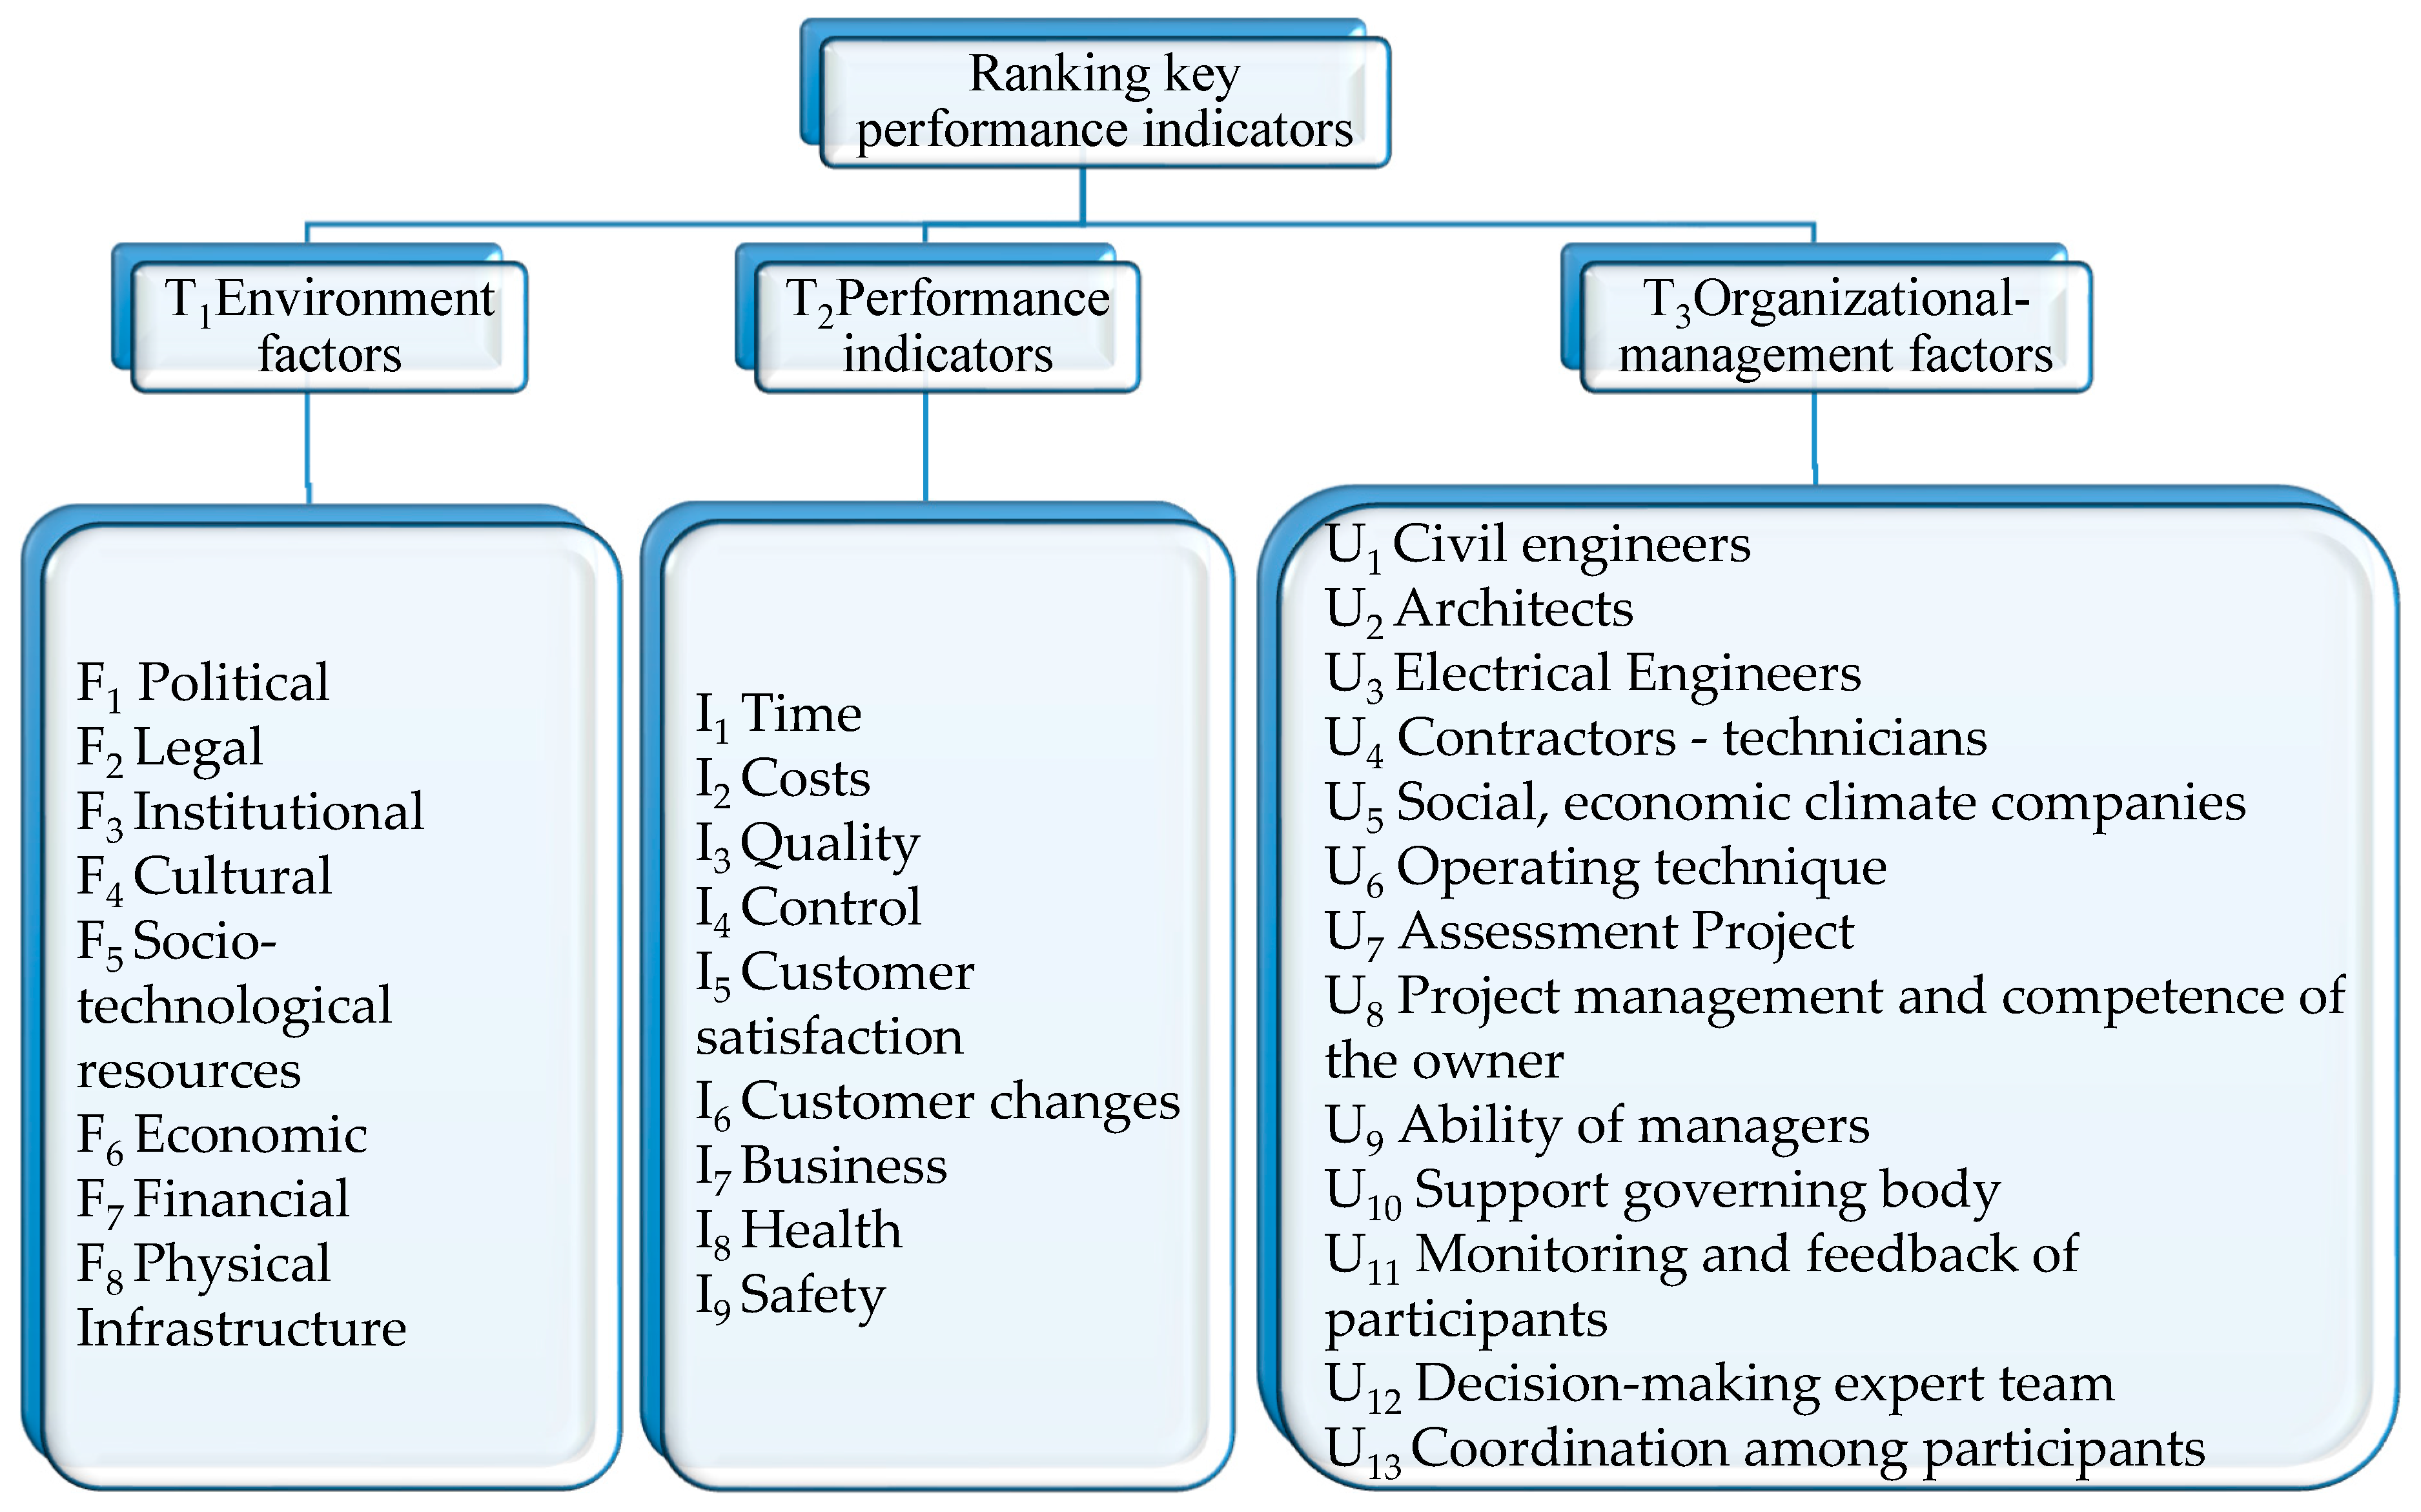
Generally, a hierarchy is structured from the top level—which includes the goal—through intermediate levels (the criteria), to the lowest level (the sub-criteria). In order to rank key indicators for an RES project, it is important to define the hierarchical structure, which has the following levels. The first (top) level represents the ranking of the key performance indicators of the project; the second level considers relevant criteria; the third level defines the sub-criteria. Based on the proposed list of factors and indicators in Table 1, a hierarchical scheme for ranking key performance indicators is presented in Figure 5.
Pairs of elements at each level are compared according to their relative contribution to the elements at the hierarchical level directly above. The experts group is divided into architecture and civil engineering, and ecological and electrical engineering; this group has agreed on the obtained estimation and the selected fuzzy AHP method.
The decision-maker or expert group estimates the relative contribution of each pair using a 1–9 comparison scale, as shown in Table 2. The fuzzified scale for pairwise comparisons is defined by means of fuzzy distance δ, which has values 0.5 ≤ δ ≤ 2.
This paper describes the design and implementation of the fuzzification stage for triangular fuzzy numbers. The value of fuzzy distance of 2 is used; on boundaries, (1, 1, 3) is used for 1, and (7, 9, 9) is used for 9. A fuzzy distance of 2 is used for the odds (3, 5, 7), and a fuzzy distance of 1 is used for the pairs (2, 4, 6, 8) as recommended by Liou and Wang in [38], where the most consistent results were obtained.
Pairwise comparisons at each level—starting from the top of the hierarchy—are presented in the square matrix form   A = | a ˜ i j | i , j = 1 , n ¯ , where a ˜ i j is the fuzzy value regarding the relative importance of the alternative i over alternative j, where a i j = 1 for i = j, and a i j = 1 / a j i for i ≠ j.
The corresponding weights of the criteria/sub-criteria, with respect to (6), are determined as the synthetic triangle number:
S i = j = 1 n a ˜ i j [ i = 1 n j = 1 n a ˜ i j ] 1 ,   i =   1 ,   2 , , n .
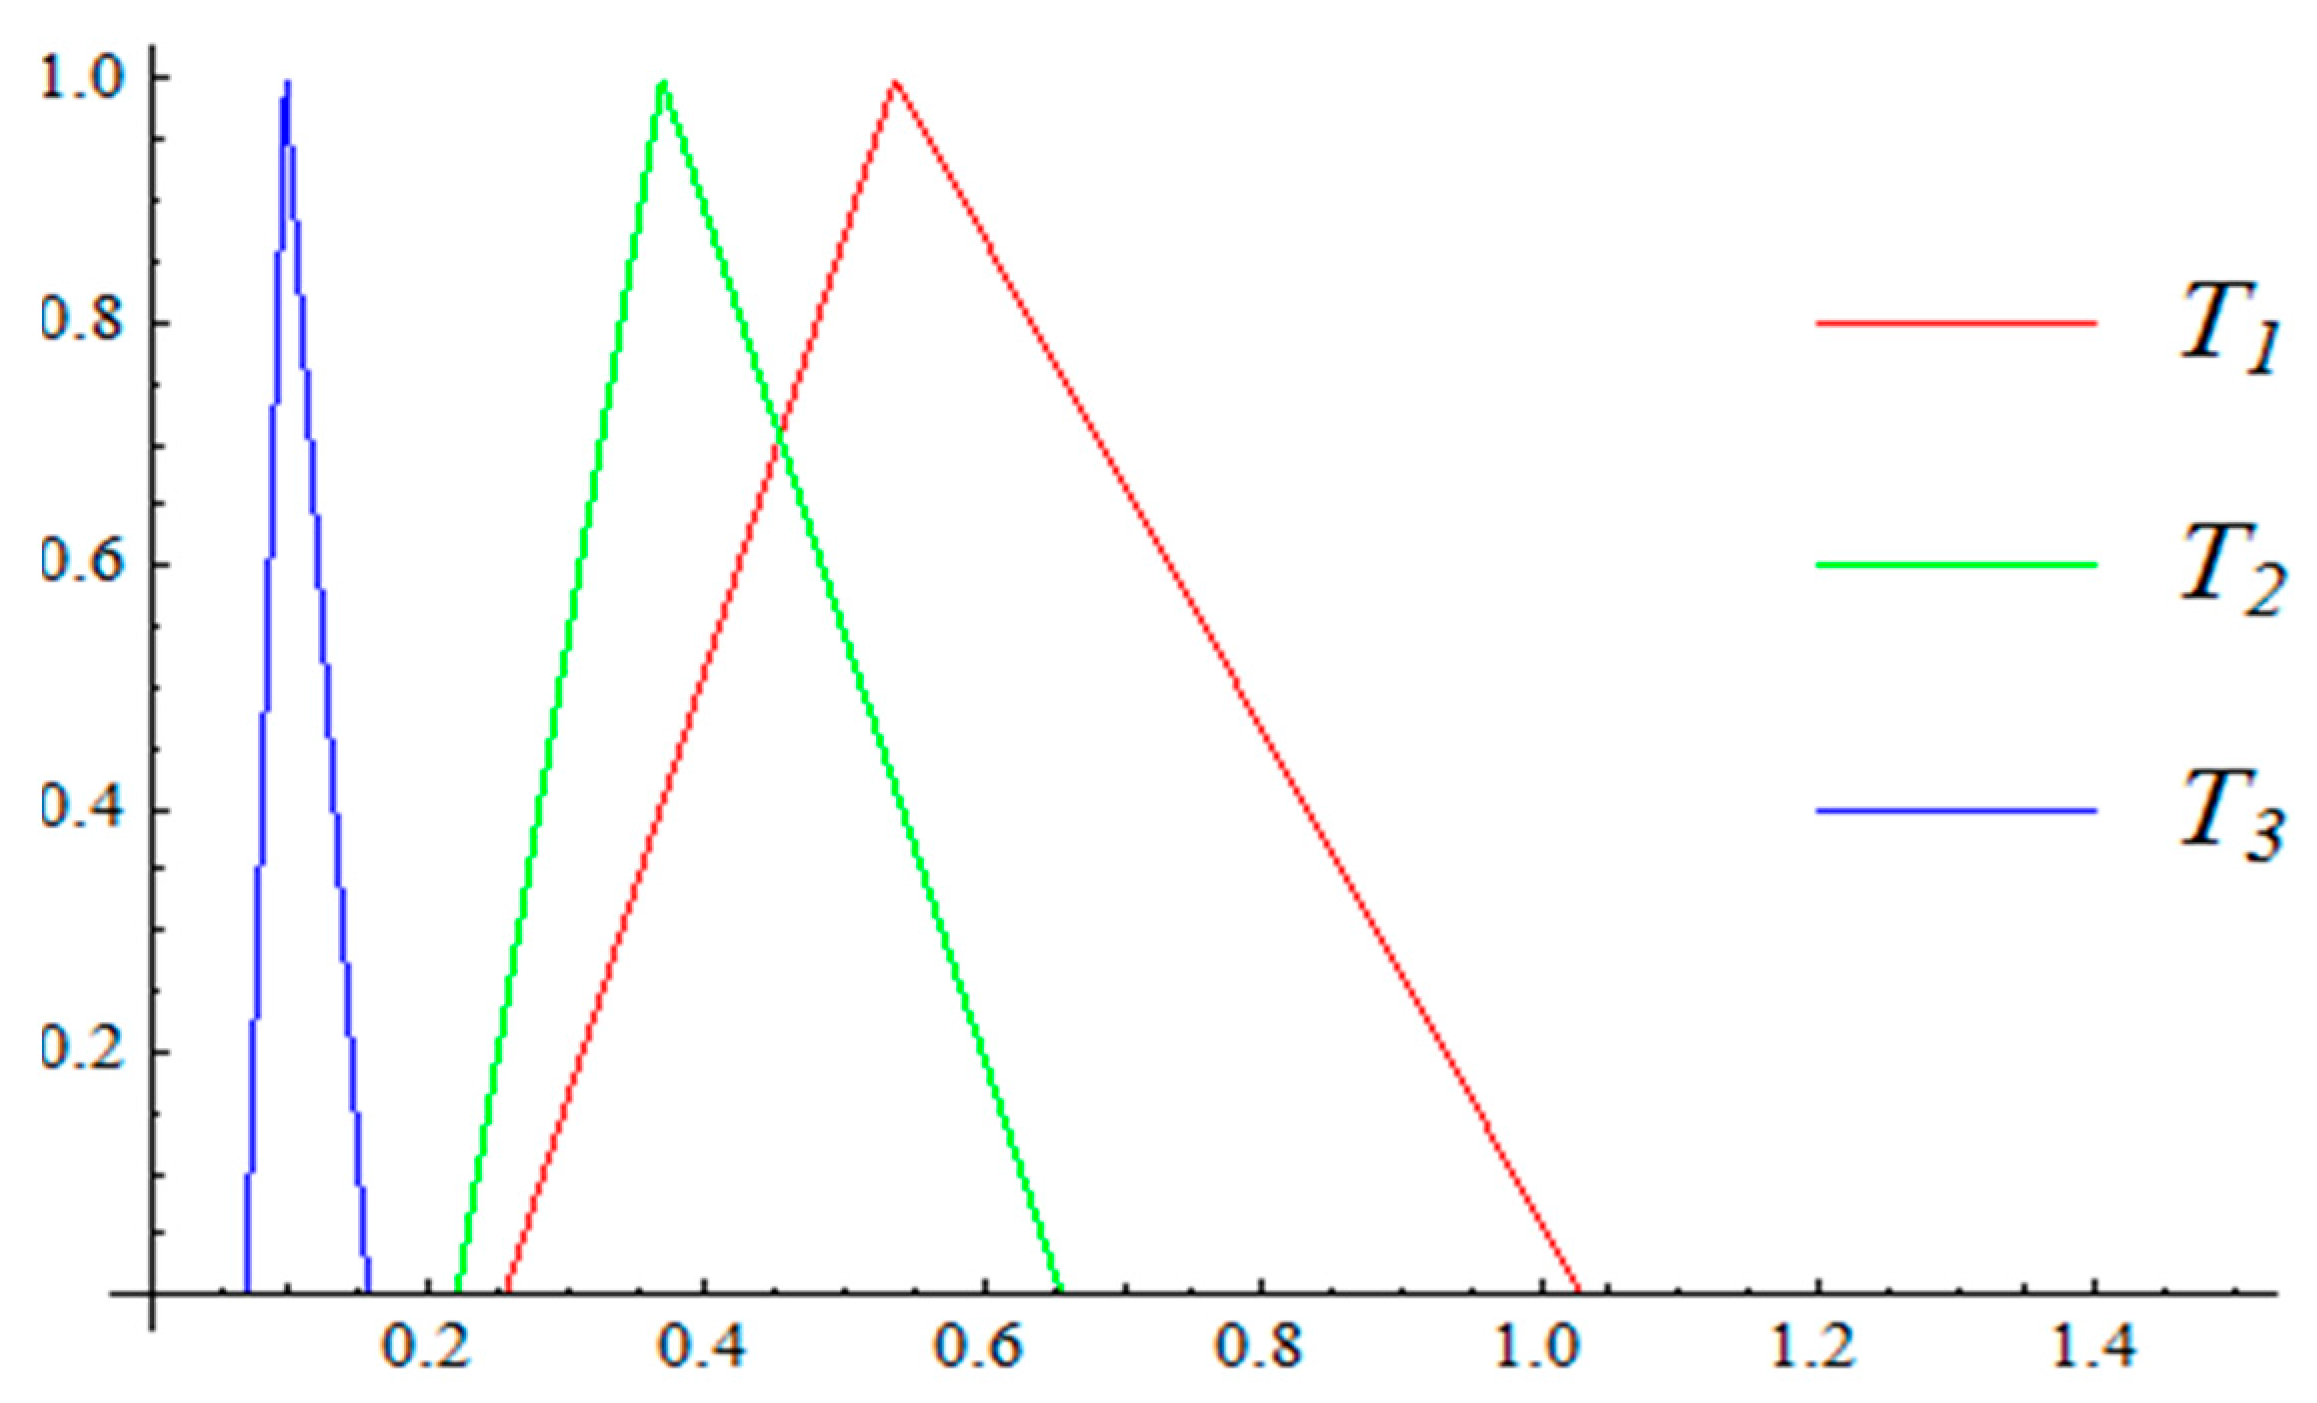
Obtained triangular fuzzy numbers are ranked by their total integral value method. This method is used for the ranking of performance indicators according to the pessimistic, moderate, and optimistic attitudes toward risk [39]. Values a ˜ i j are presented for the main criteria in Table 3, while the synthetic triangle numbers Si are presented in Table 3 and displayed in Figure 6.
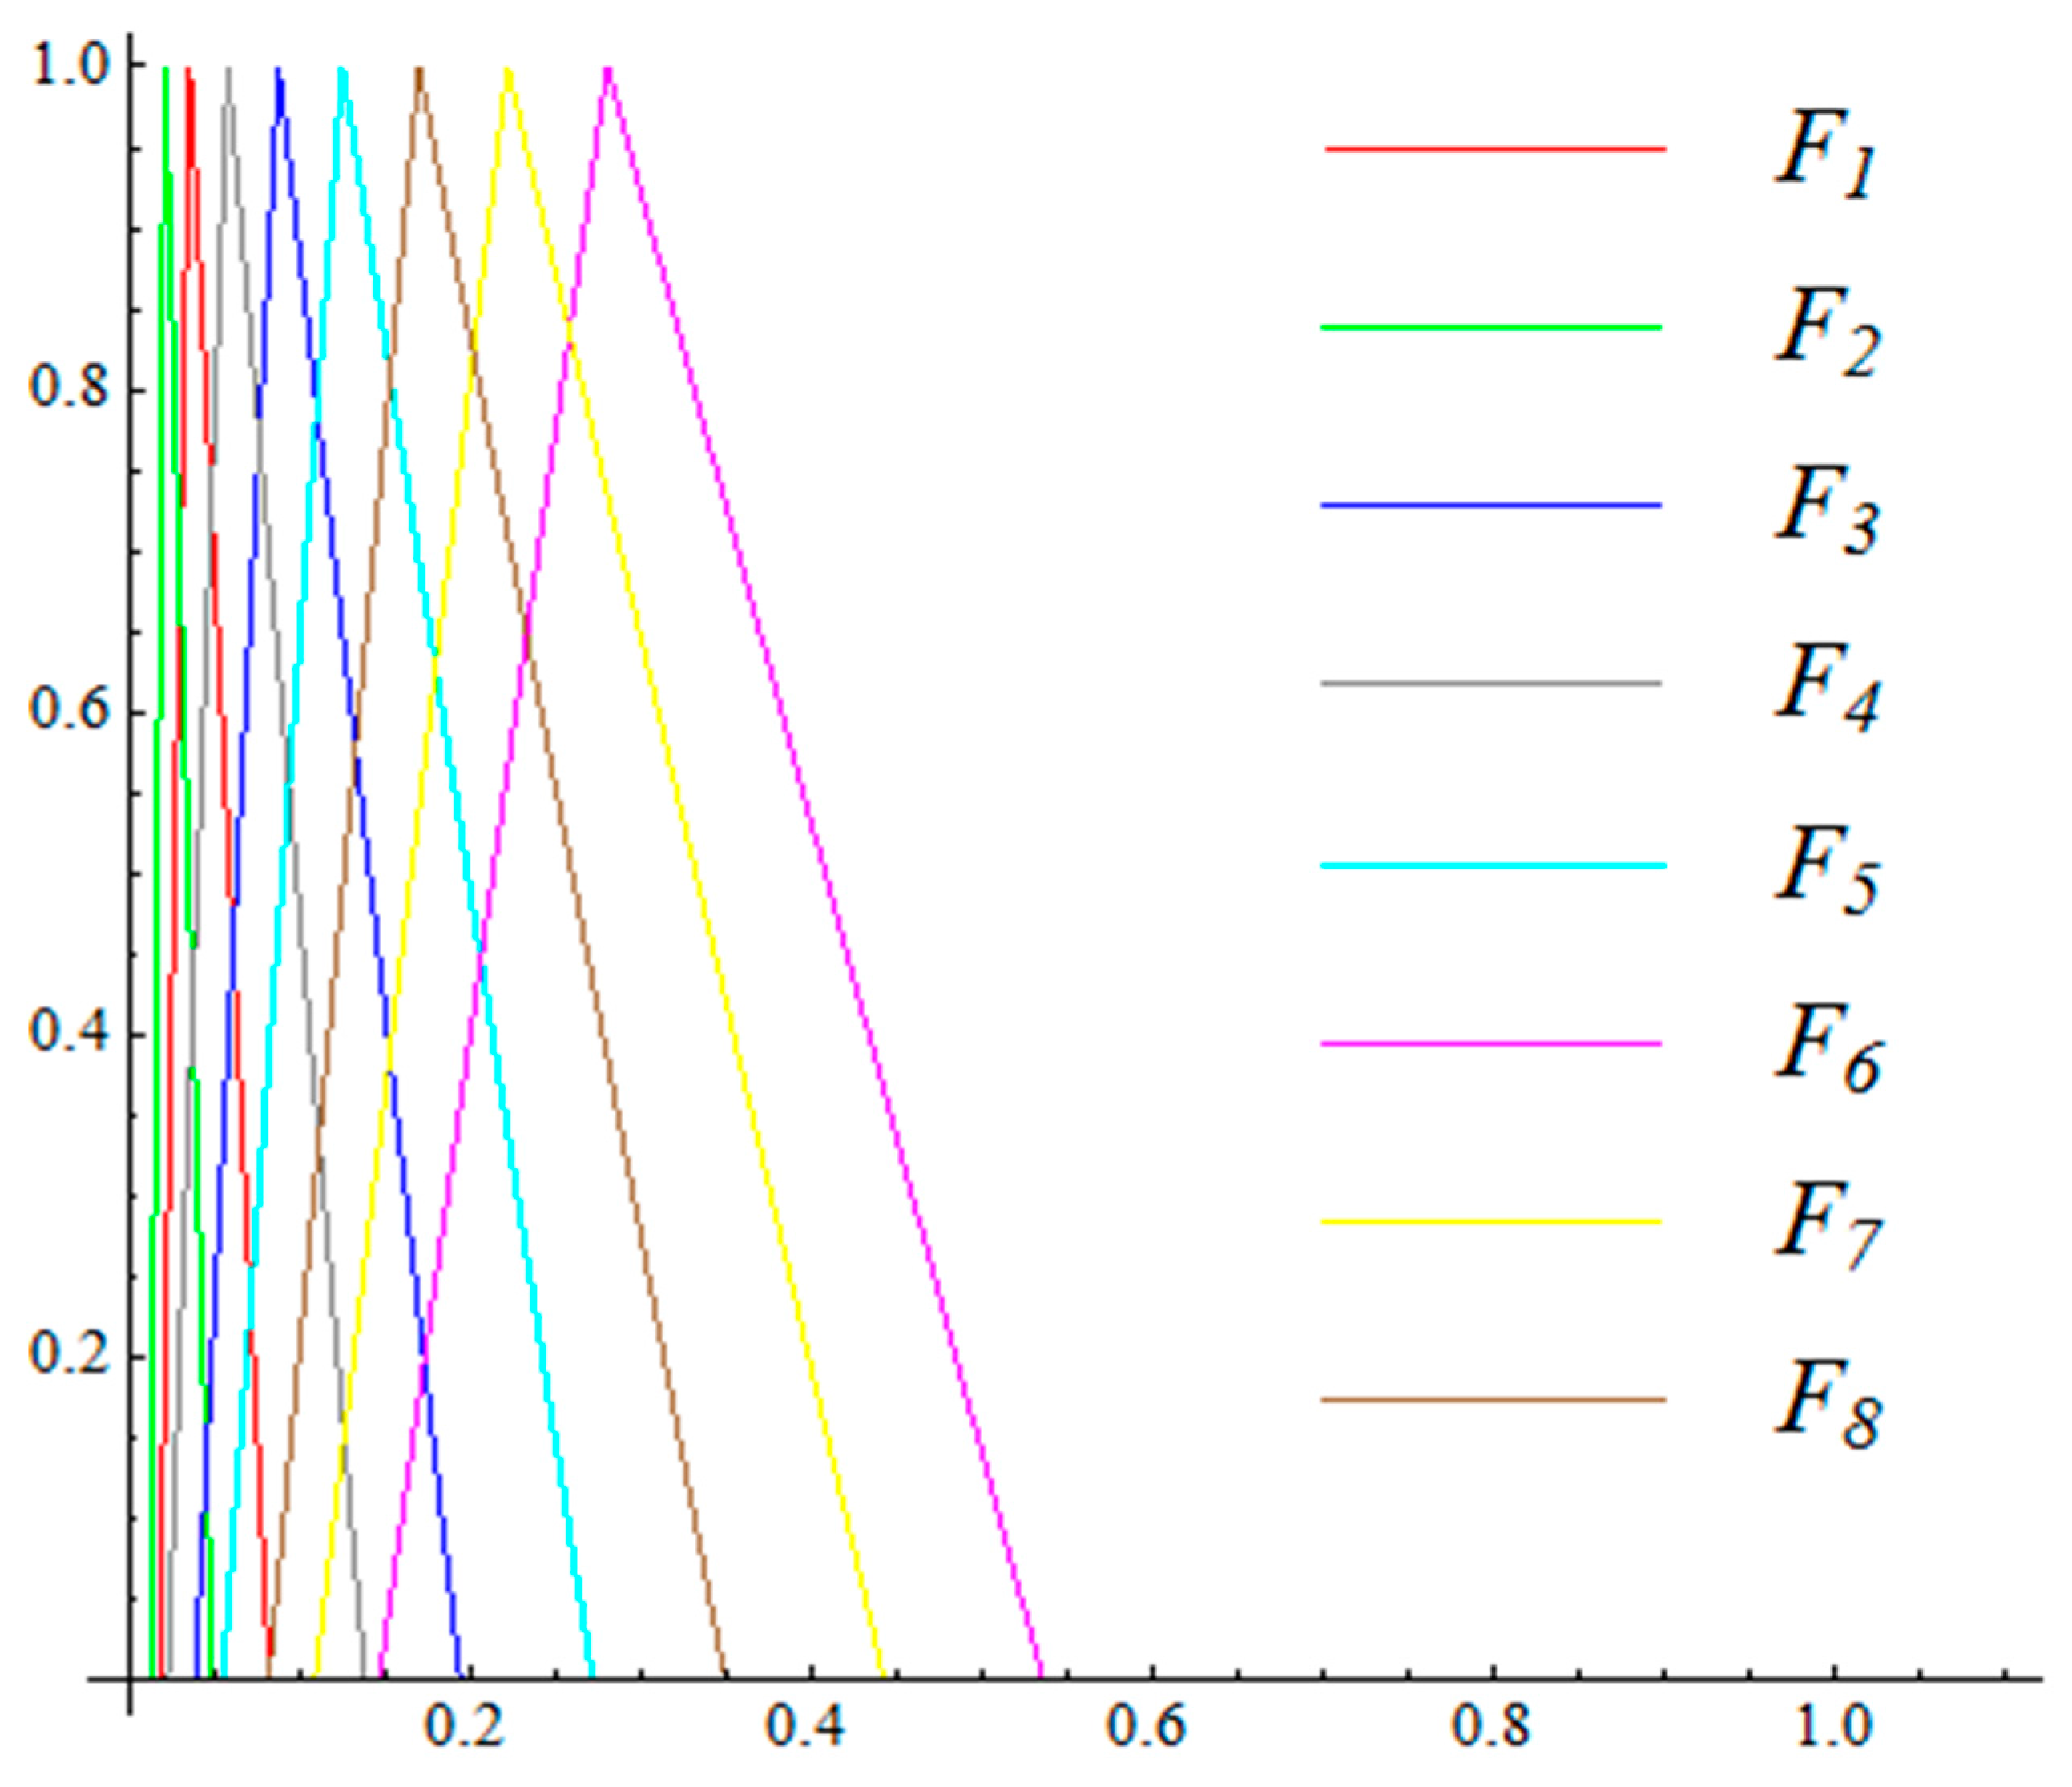
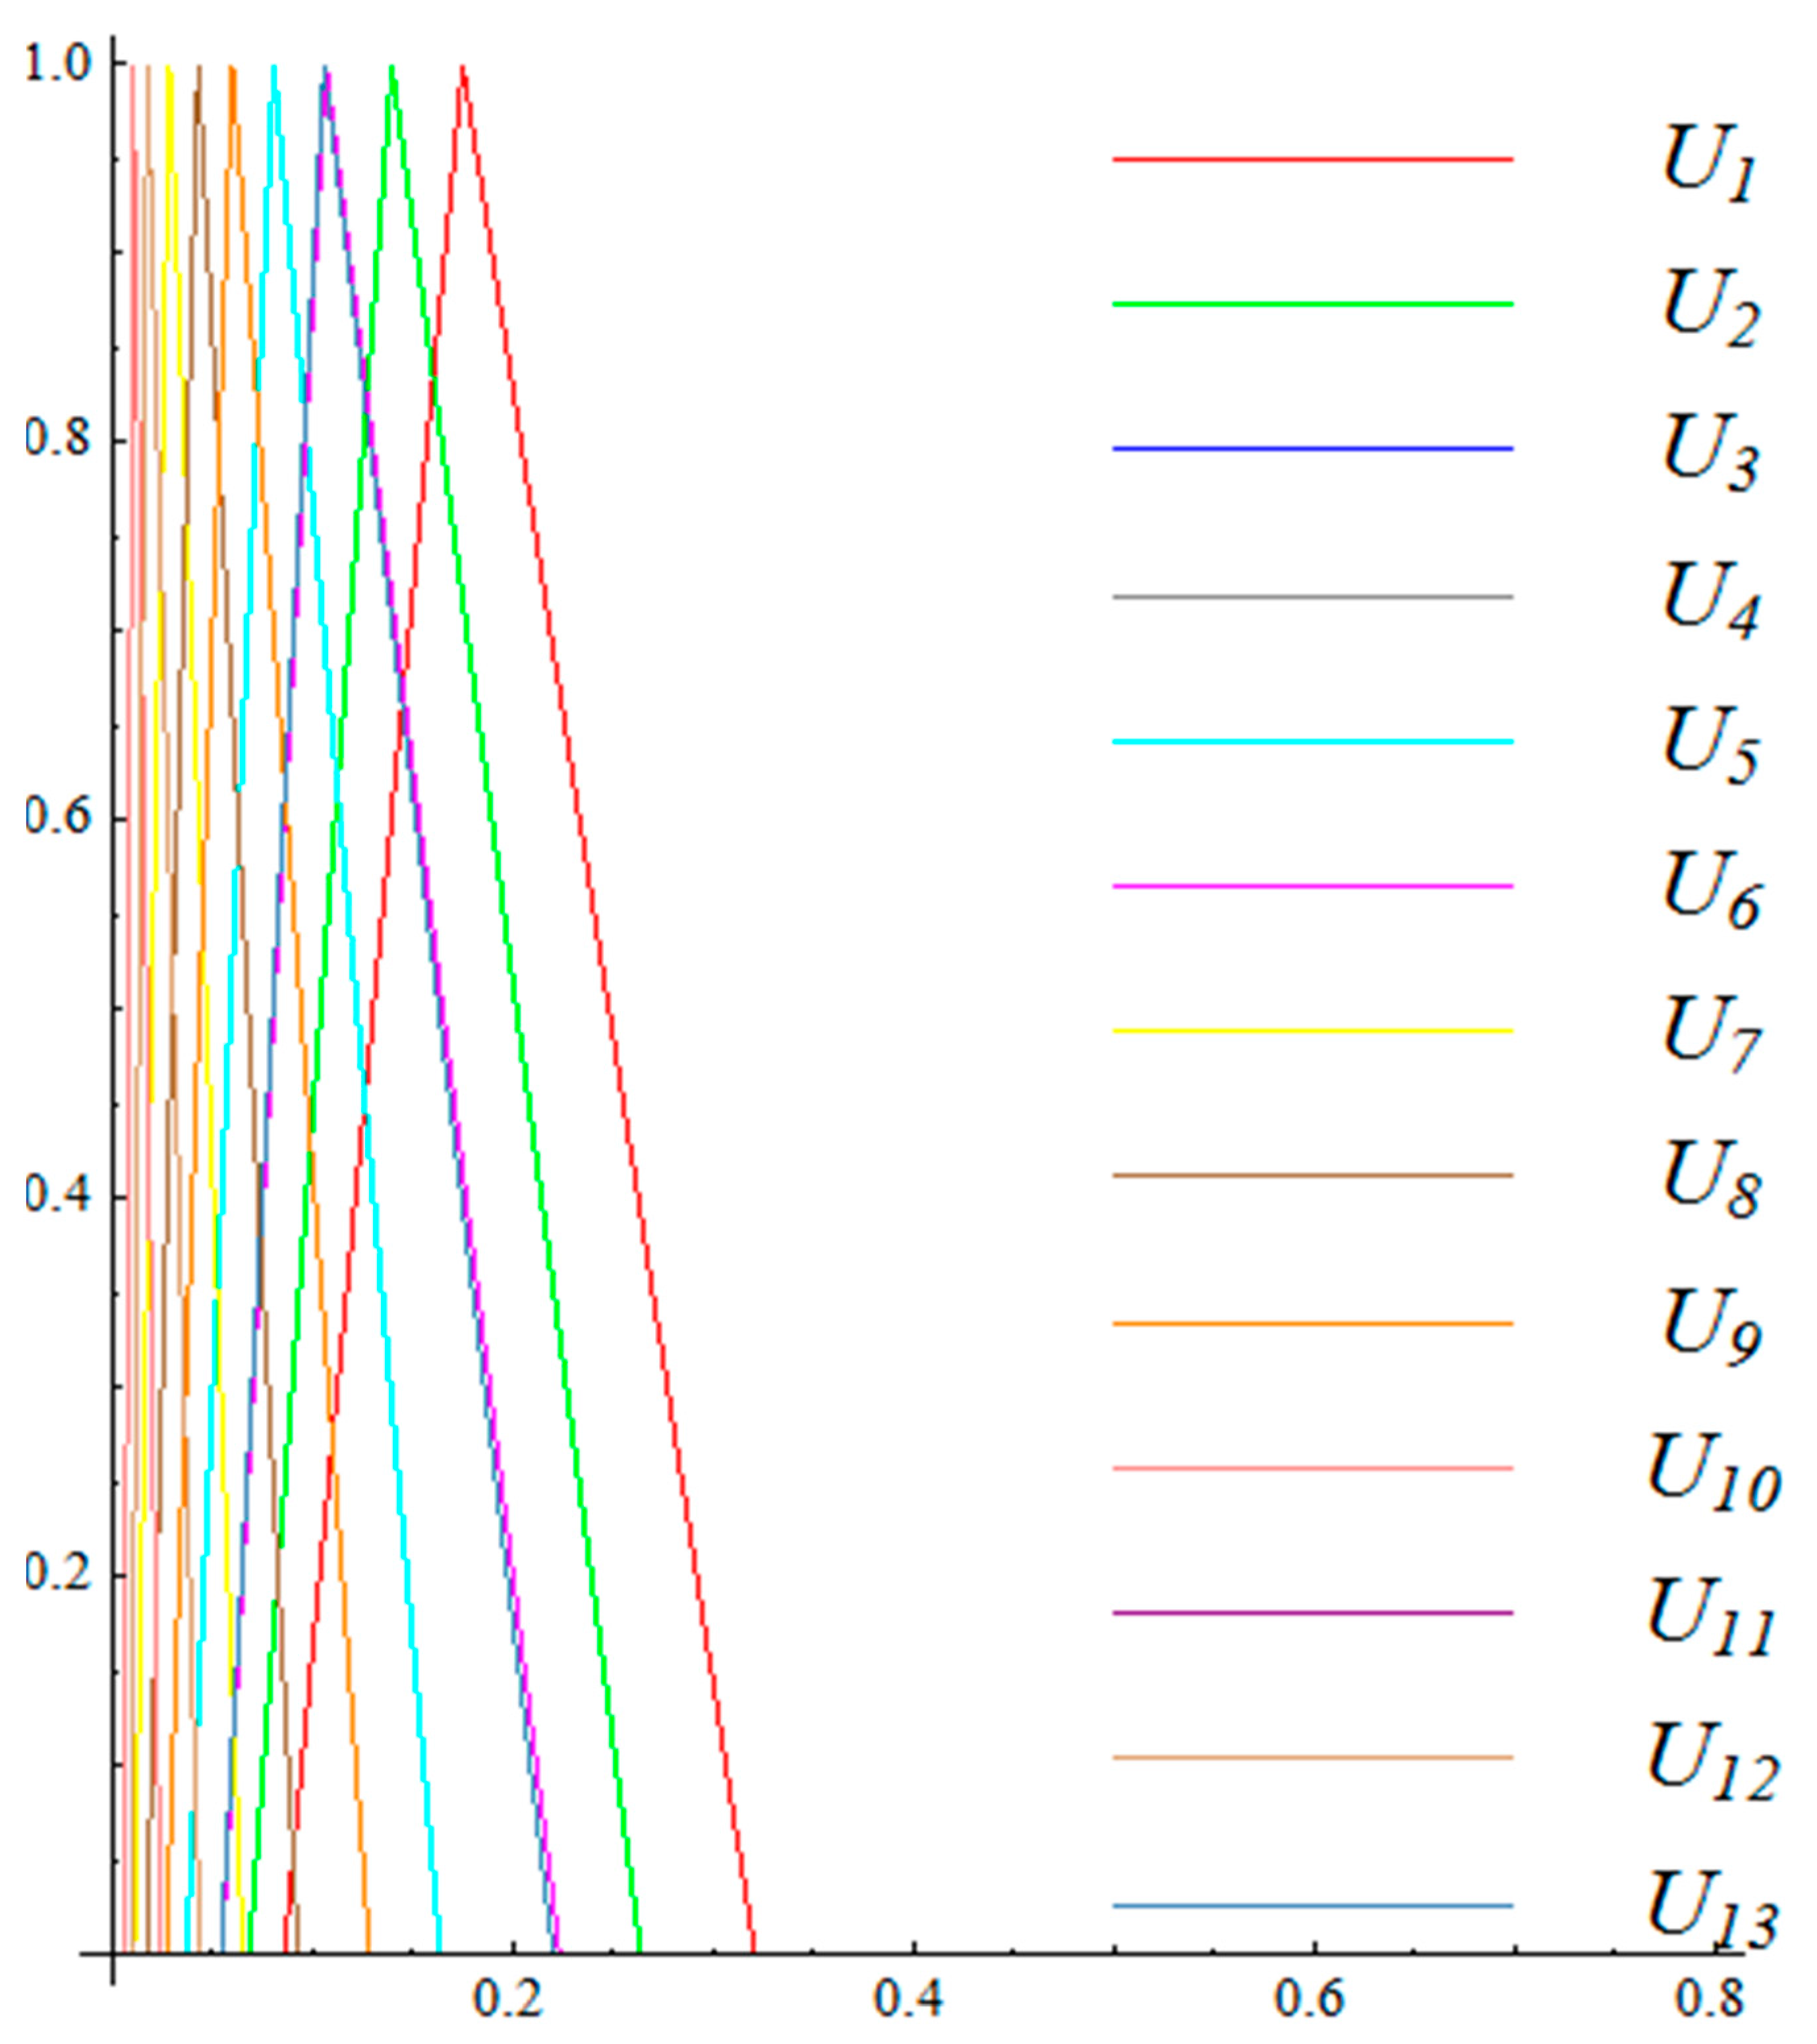
Corresponding values a ˜ i j for the sub-criteria are given in Table 4, Table 5 and Table 6, while the values of the synthetic triangle numbers Si are displayed in Figure 7, Figure 8 and Figure 9.
The total integral values obtained by Equation (7) for criteria I T 0 ( M 1 ) , sub-criteria I T 0 ( M 2 ) , and values I T 0 ( M ) = I T 0 ( M 1 ) × I T 0 ( M 2 )   are presented in Table 7. We followed the factors, which depend on the participants of the project, the environment, and the performance indicators of the project, and made the ranking performance indicators in order to formulate alternative strategies based on a multi-criteria decision-making analysis and analysis results, and highlight the aspects that are of great importance for reaching a compromise in the regional RES project.
The proposed method performs the ranking criteria, using all of the available information with the aim of finding an optimal approach in drafting the concept of the project. Precise implementation procedures in applying the fuzzy AHP method of ranking performance indicators have been made, with the suggestion of the dominant importance of F6, F7, and F8 when choosing the factors that affect the RES project and its performance. The decision-maker and the developer need to adopt a resolution to create the project based on the analysis of the impact of F6 and F7, as well as the views of their respective ranks.

4. Discussion

When it comes to the use of energy resources, a number of technical solutions are now implemented that contribute to the efficient combustion of fossil fuels, reducing losses and increasing the level of usefulness. Of all of the renewable sources in the eastern and southern parts of Serbia, the largest contribution can be expected from solar energy. Interest in using natural resources in conditions of intense technical and economic development is on the rise, and the goal is the sustainable development of renewable energy, without prejudice to the possibility of the threat of future generations to meet their own energy needs.
A case study of the Nišava District in Serbia has shown that there is a need to improve its top performance indicators and techniques, which can be adapted to the adjustable model of the renewable energy project outlined in this paper. Environmental factors that have a major impact on the development concept of the project for the construction of the RES include socio-technological resources and physical infrastructure, as well as economic, financial, institutional, and cultural factors [40]. This study clarified that these environment factors are the most important, because economics has to do with the deployment of resources, whereas financial limitations are strictly related to money. Projects take into consideration external factors that are influenced by political decisions, such as an unadjusted physical infrastructure, an underdeveloped economy, and financial instability. The socio-technological resources, as well as institutional and cultural factors, consist of the way of life and values that are characterized by technical solutions. The latter two take the population, levels of education, norms and values, language, and attitudes toward social responsibility into consideration.
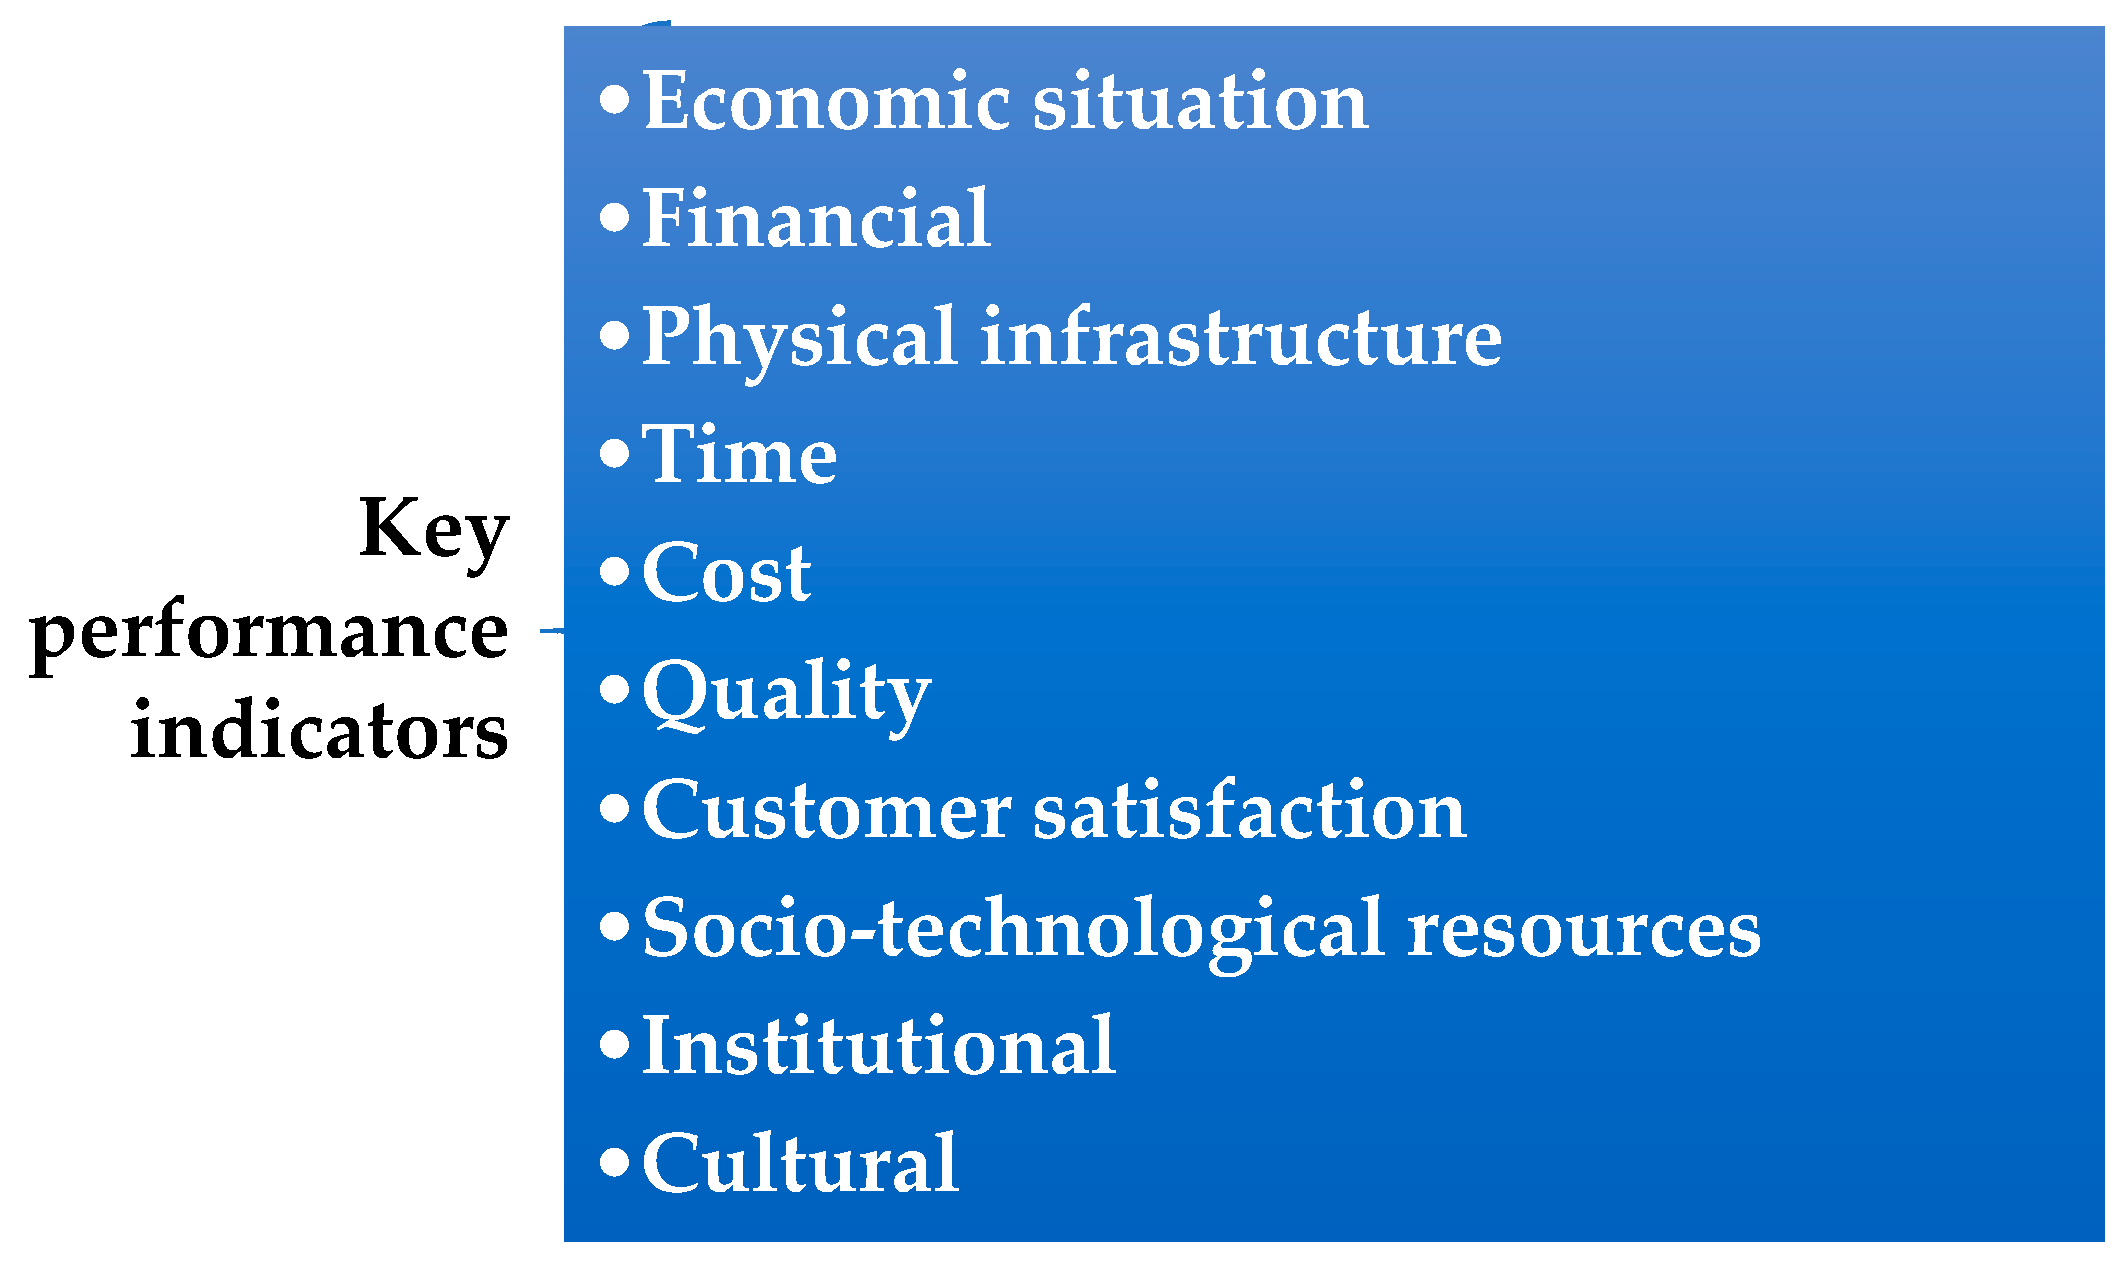
A large number of performance indicators could be measured and assessed, but the most important are time, cost, quality, and customer satisfaction. The performance relationship between a project’s time and cost has indicated that cost is a poor predictor of time performance [41]. The aforementioned factors and indicators are shown in Figure 10. These have the greatest impact on the project’s performance, but they also have a lesser influence on many other factors, such as the ability of managers, top management support, a project manager’s coordinating and leadership skills, monitoring and feedback by the participants, decision-making, and coordination among project participants [42]. Customer changes are presented through factors such as security, planning in accordance with law and building regulations, and contracts within projects.
The use of the fuzzy AHP method is appropriated for designing the concept of a proposed project, as well as some similar projects [43]. The sensitivity analysis is included at the criteria level by increasing the importance of the weight of In in relation to Un and Fn, and the weight for Un in relation to In and Fn. Upon increasing the significance of In for values less than 0.1, the order of the first 10 criteria is not changed. However, upon increasing the importance of U1 for 0.1 (which is the first in the ranking of the Un criteria), it jumps to the 10th place. At the same time, for 0.17, it jumps to the 8th place, which indicates the stability of the ranking in relation to the factors Un. On the other hand, by increasing the importance of weight of In in relation to the other two criteria, for 0.05, it has no changes, while for 0.06, I3 goes from 7th to 6th place. When I2 is changed for 0.16, it goes from 3rd to 2nd place, but I5 from 7th to 6th place. The sensitivity analysis indicates that there are no significant changes in ranking.
In project management theory, the less predictable the environment, the greater its potential effects. This means that environment must be taken into account more in managing the development of construction projects [44,45]. The Nišava District seems to have some environmental parameters that are different from other geopolitical regions in Serbia; therefore, it is important to assess the impact of these variables in the project.

5. Conclusions

In this paper, we explored the research methodology by ranking the criteria for key indicators of an RES project. The development of renewable energy generation can contribute to addressing many of the short-term challenges that developing countries face. From the perspective of energy access from renewable sources, it is important to monitor leading indicators, since they indicate the quality of activities contributing to the development of southeastern Serbia as an appropriate climate region. It is one of the most important decisions that a country can make regarding its long-term policies. In order to increase the sustainability of the development of southeastern Serbia and enable energy security and greater prosperity in the future, we point to the need to create a flexible model of the RES project. Bearing in mind that a large number of factors influence the definition of projects, three basic groups of criteria and 30 different sub-criteria were considered in the ranking. Economic and financial indicators are the dominant sub-criteria. There is a conclusion that investments from the private sector are necessary in order to develop the capacities for the generation and use of RES, because financing from public sources will never be enough to ensure the sources on a large scale. Finally, consumer financing is an accepted but complex source of funding, which should guide the design of the project. As the next indicator, interested parties in the development of the RES project must take into account the physical infrastructure with the proper management of costs and time. Quality social and technological resources, customer satisfaction, respect for cultural differences, the support of the institutional organization, and proper control are further prerequisites for creating a desirable project.
The case study shows that environmental factors are the first-ranked indicators in the RES project management in Serbia. In this paper, the ranking of project performance indicators are based on the fuzzy AHP method. Ranked results have also been obtained by using the AHP method, where the top-ranked sub-criteria are the same in both applied methods. Selecting the proper performance indicators, ranking them by applying the fuzzy AHP method, and monitoring the value of the highest-ranking indicators all help to improve the quality of the project concept, and accordingly determine the adjustable model of the renewable energy projects. Furthermore, the research will be focused on quantifying the impact of RES on the efficiency of the building construction companies, and the design and development of different decision-making procedures for the adjustable model. The project performance indicators quantitatively and qualitatively present the contributions and results achieved in the research methodology. The results of the key performance indicators analysis are the basis for sustainable development in the Nišava District.
Finally, in order to develop the business and the appropriate health environment, it is necessary to develop a strong political framework. The government can choose to implement policies that enable quick implementation (short-term activities), such as setting national objectives, simplifying legislation, and allocating subsidies. Investment in renewable energy sources is best fostered by the use of well-defined projects that create robust and transparent regulatory frameworks, give incentives for investment, and set long-term goals for the production of RES. Therefore, they should be meaningful, informative, and measurable, and should reflect the opinion of the experts according to the clear goal of enabling the development of such projects.

Acknowledgments

This research was supported by the Serbian Ministry of Education and Science under grant number 174022

Author Contributions

The conception, design and analysis are made by Violeta Dimić and Mimica Milošević. The mathematical methods are applied by Mimica Milošević and Dušan Milošević. The creation of software used in the work and interpretation of data are made by Dušan Milošević. The acquisition and interpretation of data are made by Dragan Stević and Violeta Dimić. All authors read and approved the final manuscript.

Conflicts of Interest

The authors declare no conflict of interest.

References

  1. Golusin, M.; Tešić, Z.; Ostojić, A. The analysis of the renewable energy production sector in Serbia. Renew. Sustain. Energy Rev. 2010, 14, 1477–1483. [Google Scholar] [CrossRef]
  2. Energy Sector Development Strategy of the Republic of Serbia for the Period by 2025 with Projections by 2030; Republic of Serbia, Ministry of Mining and Energy: Belgrade, Serbia, 2016; pp. 7–58.
  3. Ristanović, M.; Banjac, M. Case study of Serbia. In Proceedings of the 7th International Forum on Energy for Sustainable Development International Conference on Renewable Energy, Regional Seminar, Baku, Azerbaijan, 18–21 October 2016; Available online: https://www.unece.org/.../energy/se/pp/...invest/CS_Serbia.pdf (accessed on 28 November 2017).
  4. Misak, S.; Prokop, L. Green Energy and Technology. In Operation Characteristics of Renewable Energy Sources; Chakraborty, S., Simoes, M.G., Kramer, W.E., Eds.; Springer International Publishing: Basel, Switzerland, 2017; ISBN 978-1-4471-5103-6. [Google Scholar]
  5. Pucar, M. Energy development aspects of settlements and climate change—Strategies and laws in Serbia. In Climate Change and the Built Environment: Policies and Practice in Scotland and Serbia, Monograph, 2013, Special 70th ed.; Pucar, M., Dimitrijević, B., Marić, I., Eds.; Institute for Architecture and Urban Planning of Serbia (IAUS): Belgrade, Serbian, 2013; pp. 57–109. ISBN 978-86-80329-72-7. (In Serbian) [Google Scholar]
  6. Leković, V. Institutional aspects of economic and social modernization: sustainable development strategies of the Republic of Serbia. In Economic and Social Aspects of Serbia Joining the EU; Jakšić, M., Stojanović Aleksić, V., Mimović, P., Eds.; Faculty of Economics, University of Kragujevac: Kragujevac, Serbia, 2015; pp. 49–64. ISBN 978-86-6091-059-4. (In Serbian) [Google Scholar]
  7. Vasić, M. The life cycle of the construction project. In Proceedings of the X Meeting of Businessmen and Scientists SPIN’15: Innovative Solutions for the Operational Management, Belgrade, Serbia, 5–6 November 2015; pp. 662–669. (In Serbian). [Google Scholar]
  8. Evans, A.; Strezov, V.; Evans, J.T. Assessment of sustainability indicators for renewable energy technologies. Renew. Sustain. Energy Rev. 2009, 13, 1082–1088. [Google Scholar] [CrossRef]
  9. Cvetković, V.; Prelević, D.; Schmid, S. Geology of South-Eastern Europe. In Mineral and Thermal Waters of Southeastern Europe; Papić, P., Ed.; Springer International Publishing: Zürich, Switzerland, 2016; ISBN 978-3-319-25377-0. [Google Scholar]
  10. Mihajlov, A. Fundamentals of Analytical Instruments in the Environmental Field. Ph.D. Thesis, Univerzitet Educons, Sremska Kamenica, Serbian, 2011. (In Serbian). [Google Scholar]
  11. Chaichana, C.; Wongsapai, W.; Damrongsak, D.; Ishihara, N.K.; Luangchosiri, N. Promoting Community Renewable Energy as a tool for Sustainable Development in Rural Areas of Thailand. In Proceedings of the 4th International Conference on Power and Energy Systems Engineering, CPESE 2017, Berlin, Germany, 25–29 September 2017. [Google Scholar]
  12. Obalola, T.F. Evaluation of the Effects of Project Environment on Project Performance in Lagos and Abuja. Ph.D. Thesis, Federal University Technology, Akure, Nigeria, 2006. [Google Scholar]
  13. Iyer, K.C.; Jha, K.N. Factors affecting cost performance: Evidence from Indian construction projects. Int. J. Project Manag. 2005, 23, 283–285. [Google Scholar] [CrossRef]
  14. Love, P.E.D.; Tse, R.Y.C.; Edwards, D.J. Time-cost relationship in Australian building construction projects. J. Constr. Eng. Manag. 2005, 131, 187–194. [Google Scholar] [CrossRef]
  15. Vuletić, G. The project management specifics in construction works. Monten. J. Econ. 2010, 6, 161–172. (In Serbian) [Google Scholar]
  16. Jaramillo-Nieves, L.; del Río, P. Contribution of Renewable Energy Sources to the Sustainable Development of Islands: An Overview of the Literature and a Research Agenda. Sustainability 2010, 2, 783–811. [Google Scholar] [CrossRef]
  17. Thomas, S.N.; Palaneeswaran, E.; Kumaraswamy, M.M. A dynamic e-reporting system for contractor’s performance appraisal. Adv. Eng. Softw. 2002, 33, 339–349. [Google Scholar]
  18. Vuković, M. Managing Energy Efficiency Projects. Tech. Manag. 2014, 64, 1450–9911. (In Serbian) [Google Scholar]
  19. Navon, R. Automated Project Performance Control (APPC) of construction resources. Autom. Constr. 2003, 78–81. [Google Scholar] [CrossRef]
  20. Ugwu, O.O.; Haupt, T.C. Key performance indicators and assessment methods for infrastructure sustainability—A South African construction industry perspective. Build. Environ. 2007, 42, 665–680. [Google Scholar] [CrossRef]
  21. Al-Hazim, N.; Salem, Z.A.; Ahmad, H. Delay and Cost Overrun in Infrastructure Projects in Jordan. Procedia Eng. 2017, 182, 18–24. [Google Scholar] [CrossRef]
  22. Del Rıo, P.; Burguillo, M. An empirical analysis of the impact of renewable energy deployment on local sustainability. Renew. Sustain. Energy Rev. 2009, 13, 1314–1325. [Google Scholar] [CrossRef]
  23. Ali Elhaniash, F.E.; Stevović, S. Measurement the efficiency of building project management. Economics 2016, 62, 129–140. [Google Scholar] [CrossRef]
  24. Samson, M.; Lema, N. Development of construction contractors performance measurement framework. In Proceedings of the First International Conference of Creating a Sustainable, Johannesburg, South Africa, 26 August–4 September 2002. [Google Scholar]
  25. Waas, T.; Hugé, J.; Block, T.; Wright, T.; Benitez-Capistros, F.; Verbruggen, A. Sustainability Assessment and Indicators: Tools in a Decision-Making Strategy for Sustainable Development. Sustainability 2014, 6, 5512–5534. [Google Scholar] [CrossRef] [Green Version]
  26. Matteo, U.D.; Pezzimenti, P.M.; Garcia, D.A. Methodological Proposal for Optimal Location of Emergency Operation Centers through Multi-Criteria Approach. Sustainability 2016, 8, 50. [Google Scholar] [CrossRef]
  27. Rossi, R.; Gastaldi, M.; Gecchele, G. Comparison of fuzzy-based and AHP methods in sustainability evaluation: A case of traffic pollution-reducing policies. Eur. Transp. Res. Rev. 2013, 5, 11–26. [Google Scholar] [CrossRef]
  28. Mohagheghi, V.; Mousavi, M.S.; Vahdani, B. A new multi-objective optimization approach for sustainable project portfolio selection: A real-world application under interval-valued fuzzy environment. Iran. J. Fuzzy Syst. 2016, 13, 41–68. [Google Scholar]
  29. Lamastra, L.; Balderacchi, M.; Di Guardo, A.; Monchiero, M.; Trevisan, M. A novel fuzzy expert system to assess the sustainability of the viticulture at the wine-estate scale. Middle-East J. Sci. Res. 2014, 22, 1411–1421. [Google Scholar] [CrossRef] [PubMed]
  30. Milosević, A.; Milošević, M.; Milošević, D.; Selimi, A. Ahp multi—Criteria method for sustainable development in construction. In Proceedings of the 4th International Conference, Contemporary Achievements in Civil Engineering, Subotica, Serbia, 22 April 2016; pp. 929–938. [Google Scholar] [CrossRef]
  31. Milošević, M.; Stanojević, A.; Milošević, A.; Milošević, D. Multi-criteria analysis of energy efficiency by AHP method in planning and architectural design. In Proceedings of the STEPGRAD2016, Banja Luka, Bosnia and Herzegovina, 18 February 2016; pp. 295–302. [Google Scholar]
  32. Milošević, M.; Milošević, A.; Milošević, D.; Stanojević, A.; Dimić, V. Multicriteria analysis of contemporary materials for energy-efficient buildings. In Proceedings of the SFERA2016, Mostar, Bosnia and Herzegovina, 2 October 2016; pp. 46–51. [Google Scholar]
  33. Milošević, M.; Milošević, D.; Dimić, V.; Stević, D.; Stanojević, A. The analysis of energy efficiency indicators and renewable energy sources for existing buildings. KOIEE 2017, 5, 205–212. [Google Scholar]
  34. Kulak, O.; Durmusoglu, B.; Kahraman, C. Fuzzy multi-attribute equipment selection based on information axiom. J. Mater. Process. Technol. 2005, 169, 337–345. [Google Scholar] [CrossRef]
  35. Vidadili, N.; Suleymanov, E.; Bulut, C.; Mahmudlu, C. Transition to renewable energy and sustainable energy development in Azerbaijan. Renew. Sustain. Energy Rev. 2017, 80, 1153–1161. [Google Scholar] [CrossRef]
  36. Srdjević, B.; Medeiros, Y. Fuzzy AHP assessment of water management plans. Water Resour. Manag. 2008, 22, 877–894. [Google Scholar] [CrossRef]
  37. Jilcha, K.; Berhan, E.; Kitaw, D. Occupational Safety and Health Improvement Factors Prioritization Using Fuzzy AHP for Manufacturing Industries; Geremew, S., Krishnan, V.S.R., Babu, R., Havinal, V., Eds.; ICAST2017; Faculty of Mechanical and Industrial Engineering, Bahir Dar Institute of Technology, Bahir Dar University: Bahir Dar, Ethiopia, May 2017; pp. 17–45. [Google Scholar]
  38. Liou, T.S.; Wang, M.J. Ranking fuzzy numbers with integral value. Fuzzy Sets Syst. 1992, 50, 247–256. [Google Scholar] [CrossRef]
  39. Chang, D.Y. Applications of the extent analysis method on fuzzy AHP. Eur. J. Oper. Res. 1996, 95, 649–655. [Google Scholar] [CrossRef]
  40. Zadeh, L.A. Fuzzy sets. Inf. Control 1965, 8, 338–353. [Google Scholar] [CrossRef]
  41. Youker, R. Managing the International Project Environment. Int. J. Project Manag. 1992, 10, 219–226. [Google Scholar] [CrossRef]
  42. Akinsola, A.O.; Potts, K.F.; Harris, F.C. Identification and evaluation of factors influencing variations on building project. Int. J. Project Manag. 1997, 15, 263–267. [Google Scholar] [CrossRef]
  43. Bai, L.; Li, Y.; Du, Q.; Xu, Y. A Fuzzy Comprehensive Evaluation Model for Sustainability Risk Evaluation of PPP Projects. Sustainability 2017, 9, 1890. [Google Scholar] [CrossRef]
  44. Pheng, L.S.; Chuan, Q.T. Environmental factors and work performance of project managers in the construction industry. Int. J. Project Manag. 2006, 24, 24–37. [Google Scholar] [CrossRef]
  45. Guo, R.; Wu, T. Mathematical Model for System Planning on Campus: A Case Study in Harbin Institute of Technology in China. In Mediterranean Green Buildings & Renewable Energy Selected Papers; Sayigh, A., Ed.; Springer International Publishing: Cham, Switzerland, 2015; pp. 589–599. ISBN 978-3-319-30746-6. [Google Scholar]
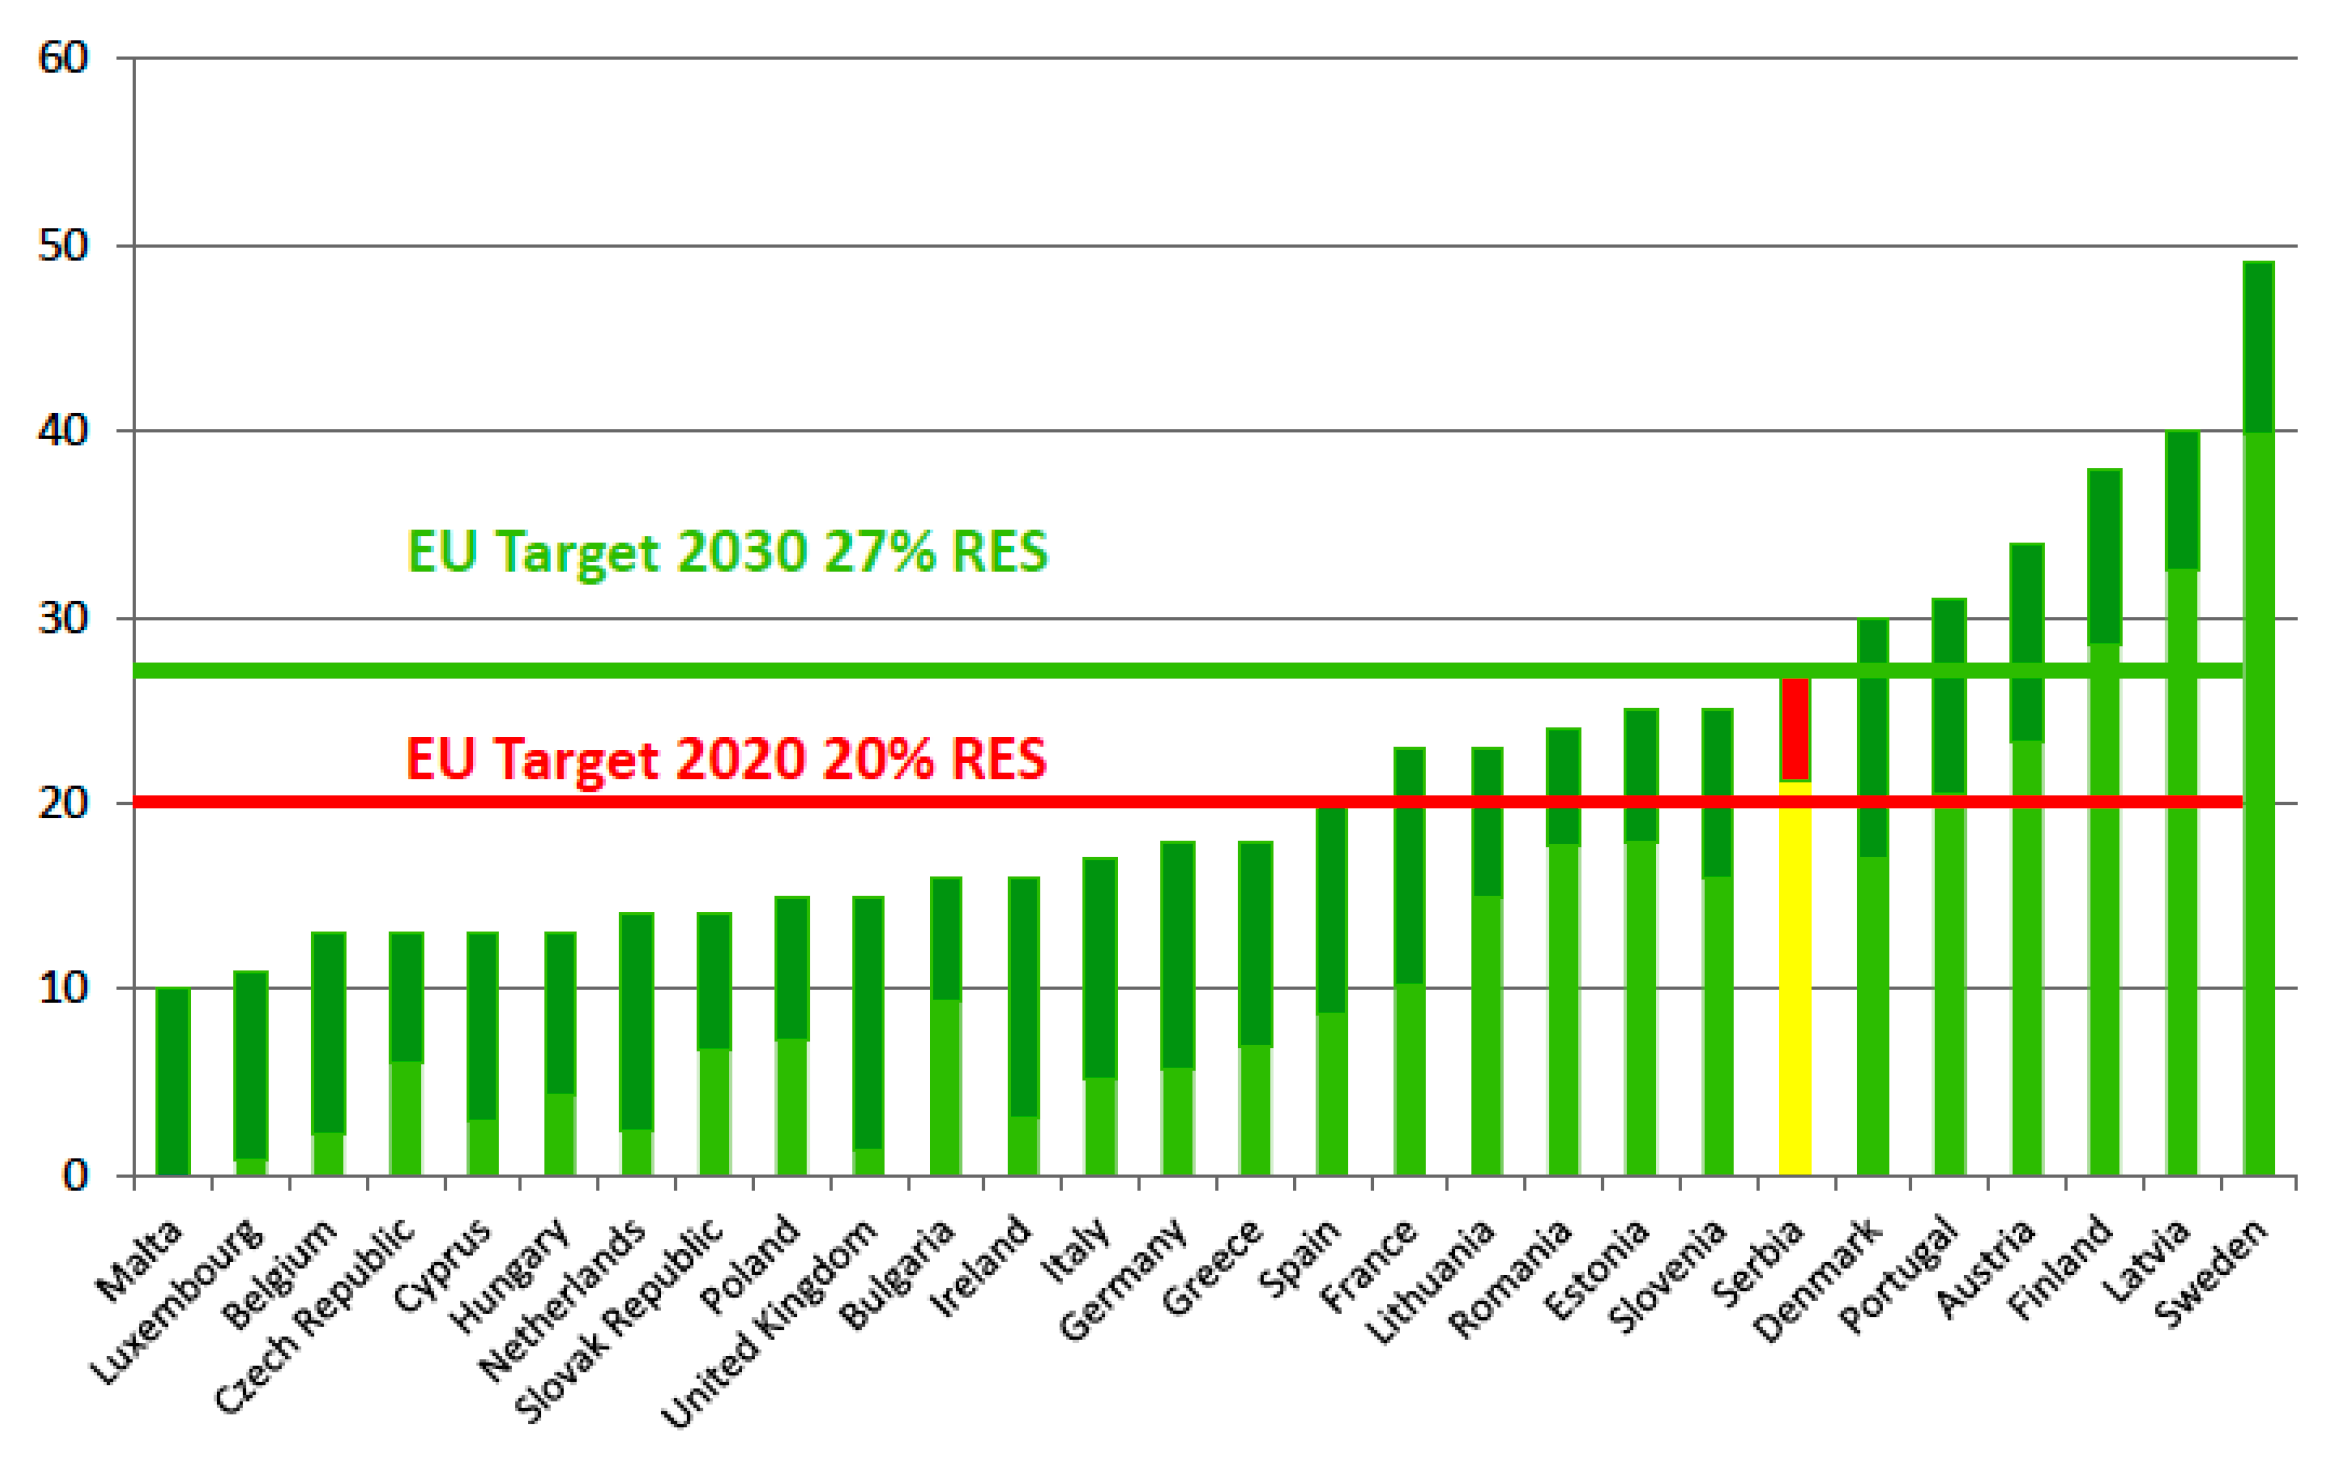
Figure 1. Commitments for renewable energy sources (RES): comparison of RES% Serbia with European Union (EU) Member States.
Sustainability 10 00775 g001
Figure 2. Four steps of research methodology.
Sustainability 10 00775 g002
Figure 3. Observed potential of solar energy in the Nišava District: (a) Map of daily average global solar energy on the horizontal plane in Serbia for the vegetation period; (b) Map of average wind power at the height of 100 m in Serbia for the heating period.
Sustainability 10 00775 g003
Figure 4. Steps in the fuzzy analytic hierarchy process (AHP) algorithm.
Sustainability 10 00775 g004
Figure 5. Hierarchy scheme for ranking key performance of an RES project.
Sustainability 10 00775 g005
Figure 6. Triangular fuzzy numbers for sub-criteria Tn.
Sustainability 10 00775 g006
Figure 7. Triangular fuzzy numbers for sub-criteria Fn.
Sustainability 10 00775 g007
Figure 8. Triangular fuzzy numbers for sub-criteria In.
Sustainability 10 00775 g008
Figure 9. Triangular fuzzy numbers for sub-criteria Un.
Sustainability 10 00775 g009
Figure 10. Factors affecting the RES project and its performance in Nišava District.
Sustainability 10 00775 g010
Table 1. Criteria and sub-criteria.
Environmental Factors (T1):Quality Indicators (T2):Factors of Organizational Management (T3):
Political—F1
Legal—F2
Institutional—F3
Cultural—F4
Socio-technological resources—F5
Economic—F6
Financial—F7
Physical infrastructure—F8
Time—I1
Costs—I2
Quality—I3
Control—I4
Customer satisfaction—I5
Customer changes—I6
Business—I7
Health—I8
Safety—I9
Civil engineers—U1
Architects—U2
Electrical Engineers—U3
Contractors—technicians—U4
Social, economic climate companies—U5
Operating technique—U6
Assessment project—U7
Project management and competence of the owner—U8
Ability of managers—U9
Support governing body—U10
Monitoring and feedback—U11
Decision-making expert team—U12
Coordination among participants—U13
Table 2. Crisp and fuzzified Saaty’s scale for pairwise comparisons.
Crisp Values (x)DescriptionFuzzy Values
1Equal importance(1, 1, 1 + δ)
3Weak dominance(3 − δ, 3, 3 + δ)
5Strong dominance(5 − δ, 5, 5 + δ)
7Demonstrated dominance(7 − δ, 7, 7 + δ)
9Absolute dominance(9 − δ, 9, 9)
2, 4, 6, 8Intermediate values(x − 1, x, x + 1)
Table 3. The main criteria.
Main CriteriaT1T2T3Si
T1{1,1,1}{1,2,3}{3,5,7}{0.254237,0.535117,1.03033}
T2{1/3,1/2,1}{1,1,1}{3,4,5}{0.220339,0.367893,0.655665}
T3{1/7,1/5,1/3}{1/5,1/4,1/3}{1,1,1}{0.0682809,0.09699,0.156111}
Table 4. Environmental factors.
F1F2F3F4F5F6F7F8Si
F1{1, 1, 1}{1, 2, 3}{ 1 5 , 1 3 , 1}{ 1 3 , 1 2 , 1}{ 1 5 , 1 4 , 1 3 }{ 1 9 , 1 7 , 1 5 }{ 1 7 , 1 6 , 1 5 }{ 1 7 , 1 5 , 1 3 }S1
F2{ 1 3 , 1 2 , 1}{1, 1, 1}{ 1 5 , 1 4 , 1 3 }{ 1 5 , 1 3 , 1}{ 1 7 , 1 5 , 1 3 }{ 1 9 , 1 8 , 1 7 }{ 1 9 , 1 7 , 1 5 }{ 1 7 , 1 6 , 1 5 }S2
F3{1, 3, 5}{3, 4, 5}{1, 1, 1}{1, 2, 3}{ 1 3 , 1 2 , 1}{ 1 7 , 1 5 , 1 3 }{ 1 5 , 1 4 , 1 3 }{ 1 5 , 1 3 , 1}S3
F4{1, 2, 3}{1, 3, 5}{ 1 3 , 1 2 , 1}{1, 1, 1}{ 1 5 , 1 3 , 1}{ 1 7 , 1 6 , 1 5 }{ 1 7 , 1 5 , 1 3 }{ 1 5 , 1 4 , 1 3 }S4
F5{3, 4, 5}{3, 5, 7}{1, 2, 3}{1, 3, 5}{1, 1, 1}{ 1 5 , 1 4 , 1 3 }{ 1 5 , 1 3 , 1}{ 1 3 , 1 2 , 1}S5
F6{5, 7, 9}{7, 8, 9}{3, 5, 7}{5, 6, 7}{3, 4, 5}{1, 1, 1}{1, 2, 3}{1, 3, 5}S6
F7{5, 6, 7}{5, 7, 9}{3, 4, 5}{3, 5, 7}{1, 3, 5}{ 1 3 , 1 2 , 1}{1, 1, 1}{1, 2, 3}S7
F8{3, 5, 7}{5, 6, 7}{1, 3, 5}{3, 4, 5}{1, 2, 3}{ 1 5 , 1 3 , 1}{ 1 3 , 1 2 , 1}{1, 1, 1}S8
S1 = {0.0176703, 0.035753, 0.0822981}, S2 = {0.0126523, 0.0211571, 0.049024}, S3 = {0.0388172, 0.0878349, 0.194099}, S4 = {0.0226882, 0.0579944, 0.138199}, S5 = {0.0549462, 0.1252, 0.271739}, S6 = {0.146774, 0.280241, 0.535714}, S7 = {0.10914, 0.221858, 0.442547}, S8 = {0.082043, 0.169961, 0.349379}
Table 5. Quality performance indicators.
I1I2I3I4I5I6I7I8I9Si
I1{1, 1, 1}{1, 1, 3}{1, 2, 3}{3, 4, 5}{1, 2, 3}{3, 5, 7}{3, 4, 5}{3, 4, 5}{3, 4, 5}S1
I2{ 1 3 , 1, 1}{1, 1, 1}{1, 2, 3}{3, 4, 5}{1, 2, 3}{3, 5, 7}{3, 4, 5}{3, 4, 5}{3, 4, 5}S2
I3{ 1 3 , 1 2 , 1}{ 1 3 , 1 2 , 1}{1, 1, 1}{1, 3, 5}{1, 1, 3}{3, 4, 5}{1, 3, 5}{1, 3, 5}{1, 3, 5}S3
I4{ 1 5 , 1 4 , 1 3 }{ 1 5 , 1 4 , 1 3 }{ 1 5 , 1 3 , 1}{1, 1, 1}{ 1 5 , 1 3 , 1}{1, 2, 3}{1, 1, 3}{1, 1, 3}{1, 1, 3}S4
I5{ 1 3 , 1/2, 1}{ 1 3 , 1/2, 1}{ 1 3 , 1, 1}{1, 3, 5}{1, 1, 1}{3, 4, 5}{1, 3, 5}{1, 3, 5}{1, 3, 5}S5
I6{ 1 7 , 1 5 , 1 3 }{ 1 7 , 1 5 , 1 3 }{ 1 5 , 1 4 , 1 3 }{ 1 3 , 1 2 , 1}{ 1 5 , 1 4 , 1 3 }{1, 1, 1}{ 1 3 , 1 2 , 1}{ 1 3 , 1 2 , 1}{ 1 3 , 1 2 , 1}S6
I7{ 1 5 , 1 4 , 1 3 }{ 1 5 , 1 4 , 1 3 }{ 1 5 , 1 3 , 1}{ 1 3 , 1, 1}{ 1 5 , 1 3 , 1}{1, 2, 3}{1, 1, 1}{1, 1, 3}{1, 1, 3}S7
I8{ 1 5 , 1 4 , 1 3 }{ 1 5 , 1 4 , 1 3 }{ 1 5 , 1 3 , 1}{ 1 3 , 1, 1}{ 1 5 , 1 3 , 1}{1, 2, 3}{ 1 3 , 1, 1}{1, 1, 1}{1, 1, 3}S8
I9{ 1 5 , 1 4 , 1 3 }{ 1 5 , 1 4 , 1 3 }{ 1 5 , 1 3 , 1}{ 1 3 , 1, 1}{ 1 5 , 1 3 , 1}{1, 2, 3}{ 1 3 , 1, 1}{ 1 3 , 1, 1}{1, 1, 1}S9
S1 = {0.100529, 0.216751, 0.473031}, S2 = {0.0970018, 0.216751, 0.447461}, S3 = {0.0511464, 0.152529, 0.396323}, S4 = {0.0306878, 0.0575328, 0.200292}, S5 = {0.047619, 0.152529, 0.370754}, S6 = {0.0159738, 0.0313085, 0.0809692}, S7 = {0.0271605, 0.0575328, 0.174723}, S8 = {0.0236332, 0.0575328, 0.149154}, S9 = {0.0201058, 0.0575328, 0.123585}
Table 6. Organizational management structure.
U1U2U3U4U5U6U7U8U9U10U11U12U13Si
U1{1, 1, 1}{1, 2, 3}{1, 3, 5}{1, 3, 5}{3, 4, 5}{1, 3, 5}{5, 7, 9}{5, 6, 7}{3, 5, 7}{7, 9, 9}{7, 8, 9}{7, 8, 9}{1, 3, 5}S1
U2{ 1 3 , 1 2 , 1}{1, 1, 1}{1, 2, 3}{1, 2, 3}{1, 3, 5}{1, 2, 3}{5, 6, 7}{3, 5, 7}{3, 4, 5}{7, 8, 9}{5, 7, 9}{5, 7, 9}{1, 2, 3}S2
U3{ 1 5 , 1 3 , 1}{ 1 3 , 1 2 , 1}{1, 1, 1}{1, 1, 3}{1, 2, 3}{1, 1, 3}{3, 5, 7}{3, 4, 5}{1, 3, 5}{5, 7, 9}{5, 6, 7}{5, 6, 7}{1, 1, 3}S3
U4{ 1 5 , 1 3 , 1}{ 1 3 , 1 2 , 1}{1, 1, 1}{1, 1, 3}{1, 2, 3}{1, 1, 3}{3, 5, 7}{3, 4, 5}{1, 3, 5}{5, 7, 9}{5, 6, 7}{5, 6, 7}{1, 1, 3}S4
U5{ 1 5 , 1 4 , 1 3 }{ 1 5 , 1 3 , 1}{ 1 3 , 1 2 , 1}{ 1 3 , 1 2 , 1}{1, 1, 1}{ 1 3 , 1 2 , 1}{3, 4, 5}{1, 3, 5}{1, 2, 3}{5, 6, 7}{3, 5, 7}{3, 5, 7}{ 1 3 , 1 2 , 1}S5
U6{ 1 5 , 1 3 , 1}{ 1 3 , 1 2 , 1}{1, 1, 3}{1, 1, 3}{1, 2, 3}{1, 1, 1}{3, 5, 7}{3, 4, 5}{1, 3, 5}{5, 7, 9}{5, 6, 7}{5, 6, 7}{1, 1, 3}S6
U7{ 1 9 , 1 7 , 1 5 }{ 1 7 , 1 6 , 1 5 }{ 1 7 , 1 5 , 1 3 }{ 1 7 , 1 5 , 1 3 }{ 1 5 , 1 4 , 1 3 }{ 1 7 , 1 5 , 1 3 }{1, 1, 1}{ 1 3 , 1 2 , 1}{ 1 5 , 1 3 , 1}{1, 3, 5}{1, 2, 3}{1, 2, 3}{ 1 7 , 1 5 , 1 3 }S7
U8{ 1 7 , 1 6 , 1 5 }{ 1 7 , 1 5 , 1 3 }{ 1 5 , 1 4 , 1 3 }{ 1 5 , 1 4 , 1 3 }{ 1 5 , 1 3 , 1}{ 1 5 , 1 4 , 1 3 }{1, 2, 3}{1, 1, 1}{ 1 3 , 1 2 , 1}{3, 4, 5}{1, 3, 5}{1, 3, 5}{ 1 5 , 1 4 , 1 3 }S8
U9{ 1 7 , 1 5 , 1 3 }{ 1 5 , 1 4 , 1 3 }{ 1 5 , 1 3 , 1}{ 1 5 , 1 3 , 1}{ 1 3 , 1 2 , 1}{ 1 5 , 1 3 , 1}{1, 3, 5}{1, 2, 3}{1, 1, 1}{3, 5, 7}{3, 4, 5}{3, 4, 5}{ 1 5 , 1 3 , 1}S9
U10{ 1 9 , 1 9 , 1 7 }{ 1 9 , 1 8 , 1 7 }{ 1 9 , 1 7 , 1 5 }{ 1 9 , 1 7 , 1 5 }{ 1 7 , 1 6 , 1 5 }{ 1 9 , 1 7 , 1 5 }{ 1 5 , 1 3 , 1}{ 1 5 , 1 4 , 1 3 }{ 1 7 , 1 5 , 1 3 }{1, 1, 1}{ 1 3 , 1 2 , 1}{ 1 3 , 1 2 , 1}{ 1 9 , 1 7 , 1 5 }S10
U11{ 1 9 , 1 8 , 1 7 }{ 1 9 , 1 7 , 1 5 }{ 1 7 , 1 6 , 1 5 }{ 1 7 , 1 6 , 1 5 }{ 1 7 , 1 5 , 1 3 }{ 1 7 , 1 6 , 1 5 }{ 1 3 , 1 2 , 1}{ 1 5 , 1 3 , 1}{ 1 5 , 1 4 , 1 3 }{1, 2, 3}{1, 1, 1}{1, 1, 3}{ 1 7 , 1 6 , 1 5 }S11
U12{ 1 9 , 1 8 , 1 7 }{ 1 9 , 1 7 , 1 5 }{ 1 7 , 1 6 , 1 5 }{ 1 7 , 1 6 , 1 5 }{ 1 7 , 1 5 , 1 3 }{ 1 7 , 1 6 , 1 5 }{ 1 3 , 1 2 , 1}{ 1 5 , 1 3 , 1}{ 1 5 , 1 4 , 1 3 }{1, 2, 3}{1, 1, 3}{1, 1, 1}{ 1 7 , 1 6 , 1 5 }S12
U13{ 1 5 , 1 3 , 1}{ 1 9 , 1 7 , 1 5 }{1, 1, 3}{1, 1, 3}{1, 2, 3}{1, 1, 3}{3, 5, 7}{3, 4, 5}{1, 3, 5}{5, 7, 9}{5, 6, 7}{5, 6, 7}{1, 1, 1}S13
S1 = {0.0857078, 0.175176, 0.321151}, S2 = {0.0684333, 0.139859, 0.264238}, S3 = {0.0548796, 0.106895, 0.223586}, S4 = {0.0548796, 0.106895, 0.223586}, S5 = {0.0373394, 0.0807601, 0.163963}, S6 = {0.0548796, 0.106895, 0.223586}, S7 = {0.0110797, 0.0287992, 0.0653142}, S8 = {0.0171795, 0.0429465, 0.0929575}, S9 = {0.0268608, 0.0601345, 0.128731}, S10 = {0.0060176, 0.0106166, 0.0241976}, S11 = {0.009308, 0.0175681, 0.0439429}, S12 = {0.009308, 0.0175681, 0.0439429}, S13 = {0.0544366, 0.105886, 0.220334}
Table 7. Final weights for RES project performance.
Rank of Sub-Criteria for
λ = 1
λ = 0λ = ½λ = 1
I T 0 ( M 1 ) I T 0 ( M 2 ) I T 0 ( M ) I T 1 2 ( M 1 ) I T 1 2 ( M 2 ) I T 1 2 ( M ) I T 1 ( M 1 ) I T 1 ( M 2 ) I T 1 ( M )
1 Economic F60.52090.28460.14830.53640.27540.14770.54670.26980.1475
2 Financial F70.52090.22250.11590.53640.21980.11790.54670.21810.1193
3 Physical infrastructure F80.52090.16980.08850.53640.16970.09100.54670.16970.0928
4 Time I10.37600.22120.08320.36770.21090.07750.36220.20530.0743
5 Costs I20.37600.21980.08260.36770.20670.07600.36220.19950.0722
6 Socio-technological res. F50.52090.12290.06400.53640.12640.06780.54670.12850.0703
7 Quality I30.37600.14760.05550.36770.15480.05690.36220.15880.0575
8 Customer satisfaction I50.37600.14610.05490.36770.15060.05540.36220.15300.0554
9 Institutional F30.52090.08630.04500.53640.08920.04790.54670.09100.0498
10 Cultural F40.52090.05580.02910.53640.06000.03220.54670.06260.0342
11 Control I40.37600.06040.02270.36770.06750.02480.36220.07140.0259
12 Business I70.37600.05890.02220.36770.06330.02330.36220.06560.0238
13 Health I80.37600.05750.02160.36770.05900.02170.36220.05980.0217
14 Political F10.52090.03590.01870.53640.03710.01990.54670.03790.0207
15 Safety I90.37600.05600.02110.36770.05470.02010.36220.05400.0196
16 Civil engineers U10.10310.17510.01810.09590.16960.01630.09110.16620.0151
17 Legal F20.52090.02210.01150.53640.02230.01200.54670.02250.0123
18 Architectures U20.10310.13980.01440.09590.13660.01310.09110.13470.0123
19 Customer changes I60.37600.03260.01220.36770.03250.01200.36220.03250.0118
20 Electrical engineers U30.10310.10790.01110.09590.10810.01040.09110.10830.0099
21 Contractors–technicians U40.10310.10790.01110.09590.10810.01040.09110.10830.0099
22 Operating technique U60.10310.10790.01110.09590.10810.01040.09110.10830.0099
23 Project participants U130.10310.10690.01100.09590.10690.01030.09110.10700.0097
24 Social, economic climate companies U50.10310.07990.00820.09590.08030.00770.09110.08060.0073
25 Ability of managers U90.10310.05910.00610.09590.06070.00580.09110.06160.0056
26 Project management and owner’s competence U80.10310.04140.00430.09590.04320.00410.09110.04430.0040
27 Assessment Project U70.10310.02760.00280.09590.02930.00280.09110.03040.0028
28 Monitoring—feedback U110.10310.01780.00180.09590.01890.00180.09110.01960.0018
29 Decision-making team U120.10310.01780.00180.09590.01890.00180.09110.01960.0018
30 Support governing body U100.10310.01090.00110.09590.01110.00110.09110.01120.0010