1.1. Background
With continuous improvement in productivity levels accompanied by rapid industrialization and urbanization processes, people’s standard of living is continually improving and their disposable incomes are rising. At the same time, the fact that people have more leisure time and improvements to public transportation systems are allowing an increasing amount of people to discover the joys of tourism. According to an estimation by the World Travel & Tourism Council (WTTC), the overall contribution of the tourism industry to global GDP (Gross Domestic Product) was 8.2 trillion USD in 2016, or 11% of global GDP. Furthermore, the tourism industry has generated 290 million jobs, or 10% of total jobs worldwide. Although the tourism industry in China was behind that of other countries, the fast-growing economy and a supportive environment, i.e., the country’s reforms and opening-up policies, have led to the rapid development of the tourism industry in this country [
1]. According to official statistics released by China’s National Tourism Administration, the number of domestic tourists in China reached 4.44 billion, with tourism revenue amounting to 4 trillion RMB in 2016. At the same time, the number of outbound tourists reached 122 million, and outbound tourism expenditure was 220 billion US Dollars, with both categories ranking 1st worldwide. Tourism has become one of the important pillar industries of China’s economic development, and it is a new growth point of consumption, investment and export function [
2,
3]. However, due to lagging legislation within the tourism industry, and many blind spots in its laws and regulations, the rapid development of tourism’s economic benefits in some regions is at the expense of the quality of the ecological environment. As a result, the disruption of the regional ecological balance will not only interfere with the natural cycle of the ecosystem, but also reduce the attractiveness of tourist destinations. Additionally, this disruption will prevent tourists from gaining a good perception of the benefits of tourism, constrain the development of the regional tourism industry, and to a certain extent slow down the pace of regional economic development. Therefore, in order to enhance regional development, it is necessary to study the interactive and evolutionary relationships between these three factors to promote a balanced and coordinated development.
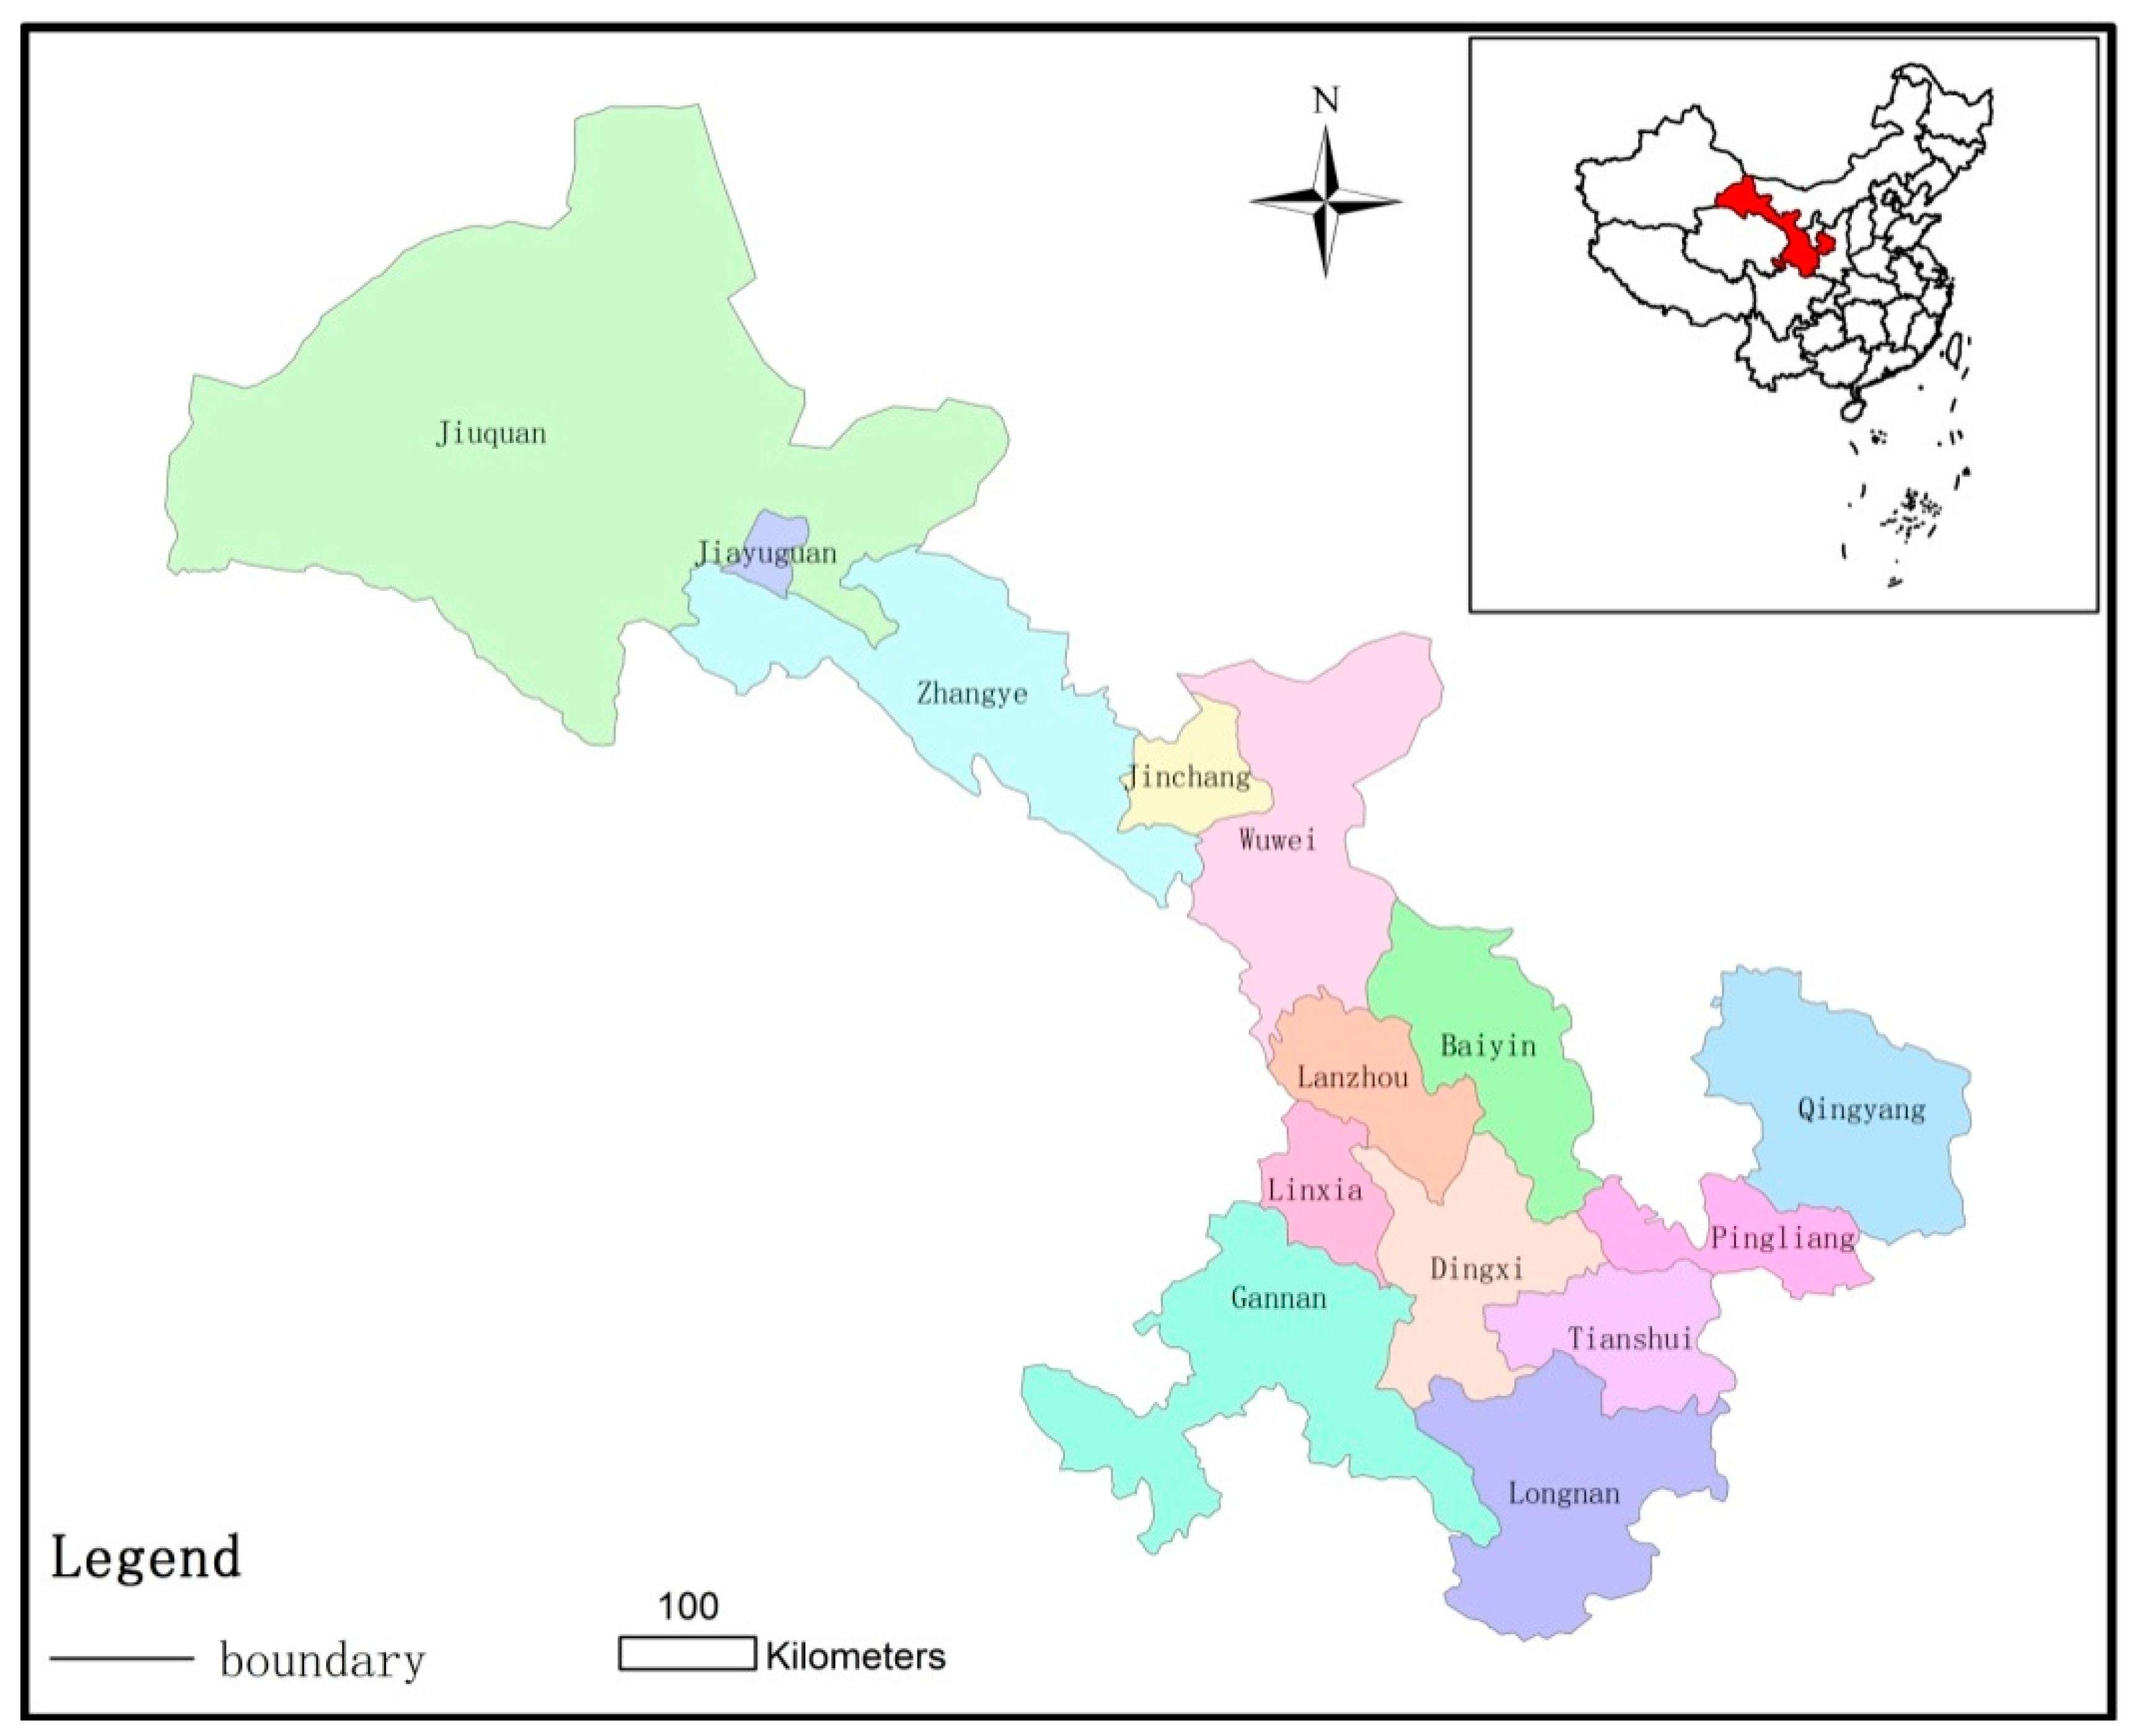
Gansu Province consists of 14 cities (12 cities and 2 city-level prefectures), located in northwest China, endowed with various resources that are attractive to tourists. Gansu needs to grasp the great opportunities that have arisen due to the implementation phase of the Western Development Strategy and take full advantages of the area’s rich tourism resources, promote both special interest tourism and refined tourism so that its tourism industry can develop more rapidly. For instance, during 2000 and 2016, the average annual growth rate of the total number of tourists was up to 51.8% and the total tourism revenue was up to 44.5%, which increased from 2.31 billion RMB to 121.9 billion RMB. The proportion of tourism revenue has grown to 10% of GDP and 25% of the tertiary industry in 2016. Therefore, tourism has become one of the important pillar industries in Gansu Province. However, Gansu Province is located in the heart of the northwest inland known for its arid climate, limited precipitation and fragile ecological environment. At the same time, the overexploitation of coal, oil, natural gas and other energy resources has considerably exacerbated the situation. Therefore, if the development and utilization of tourism resources lack effective protection measures, the ecological environment will be overwhelmed, which would further constrain the sustainable development of the tourism industry, economic growth and ecological environment in Gansu Province [
4]. Therefore, it is necessary for Gansu Province to improve its tourism development and pay more attention to scientific planning and the rational exploitation of tourism resources in the tourism development. On the one hand, the development of tourism in Gansu Province is in line with the background, trajectory and process of rapid tourism development in China. On the other hand, the ecological environment in Gansu Province is fragile. Therefore, it is typical and representative to choose Gansu Province and its subordinate cities and prefectures as the case study areas in the present study.
1.2. The Review of Literatures
According to foreign academics, research into the coordinated development of regional tourism industries and economic growth focuses on three major research directions: the impact of the regional tourism industry on an economy, the impact of the regional economy on the tourism industry, and the interactive relationship between a region’s economy and the tourism industry. For example, Milman [
5] studied the impact of the tourism industry on the regional economy, and concluded that tourist consumption could, to a certain extent, promote the economic development of tourist destinations. Furthermore, Oh [
6] studied the impact of the regional economy on the tourism industry in South Korea using co-integration theory and the Granger causality test, and found out that regional economic growth could accelerate the development of the tourism industry. Finally, Lee [
7] used panel data to study the relationship between the national tourism industry and economic growth in non-OECD (Organization for Economic Co-operation and Development) and Latin America countries, and found out that the development of the tourism industry could promote regional economic development. Domestic scholars also have kept up with international research to study the interactive relationship between the regional economy and tourism industry. For example, Cao [
8] used a qualitative analysis to study the interactive relationship between the regional economy and leisure sports industry in the Yangtze River Delta; the study was based on relevant theoretical methods developed by scientists from Europe and the United States, with the core ideas of “regional planning” and characteristics of economic development taken fully into account. With regard to quantitative analysis, by utilizing relevant theories and methods developed in different disciplines, domestic scholars have established co-integration models, coupling models and gear models to study the interactive relationship between the regional economy and tourism industry. For example, Liu [
9] analyzed data collected from 31 provinces, autonomous regions and municipalities in China, and analyzed the interactive and interdependent relationship between the regional economy and tourism industry by using an established coupling coordination degree model.
Foreign researchers began to address the question of how the tourism industry, and ecological environment interact with one another earlier than domestic researchers. Indeed, they began to observe and describe the impact of the tourism industry on the ecological environment as far back as 1920s. Since then, as the contradiction between the tourism industry and ecological environment became increasingly prominent, academics from Europe, the United States and other developed countries have continued to conduct follow-up or in-depth research covering three major areas of research. The first area focuses on the impact of regional tourism on the ecological environment. In this relationship between the two, that is, the change of ecological environment is the result of tourism development. For example, based on the concept of resource utilization intensity, Gossling [
10] concluded that the heavy resource consumption in tourism activities made the ecological environment increasingly fragile. Through empirical research, Karim [
11] concluded that tourism activities were the main cause of quality deterioration of water and air. The second area focuses on the impact of the regional ecological environment on the tourism industry. In this relationship between the two, that is, the tourism development is the result of ecological environment. For example, by exploring the impact of the ecological environment on the tourism industry in Spain, Hein [
12] concluded that the former imposed a constraining impact on the latter. The third area focuses on the interactive relationship between the regional tourism industry and ecological environment. In this relationship between the two, that is, the ecological environment and tourism interact as both cause and effect. For example, Day [
13] used the United States and China as case studies to explore the interactive relationship between the regional tourism industry and ecological environment, and their findings showed that the former imposed substantial pressure on the latter, and the latter restricted the development of the former. An [
14] studied the relationship between tourism development and ecological environment and concluded that the tourism activities led to the deterioration of the ecological environment, and the ecological environment had a certain reaction to the tourism as well. In recent years, domestic researchers have paid a great deal of attention to the interactive relationship between the regional tourism industry and ecological environment, with a specific focus on how to more scientifically and quantitatively determine a potentially coordinated relationship between the two, and how to conduct research at different spatial scales. For example, based on the model of coordinated development degree, Zhang [
15] analyzed the coupling coordinated development between tourism and ecological environment in Jiangxi Province. Based on the model of coupling coordination degree, Han [
16] measured the coupling coordination degree between tourism and ecological environment in the Yangtze river delta and analyzed the spatial and temporal evolution of coupling coordination degree.
Therefore, gaining an understanding of the relationship between economic growth and the ecological environment, and formulating countermeasures for the sake of sustainable development remains a topic of great interest in the academic world [
17,
18,
19]; however, foreign researchers have put a different focus on the interactive relationship between the two due to different stages of economic and social development. In the late 1980s, the development of the dynamic analysis of the eco-economic system led to the rise of ecological economics. In the early 1990s, foreign academics started to use the environmental Kuznets curve to conduct a quantitative analysis on the subject of coordinated development between economic growth and the ecological environment. For example, Grossman [
20] and Caviglia-Harris [
21] used the environmental Kuznets curve to conduct an empirical study on the coordinated relationship between economic development and the ecological environment across different regions. Due to continuous economic and social development, these researchers switched to measurement models to analyze the coordinated relationship. For example, Bithas [
22] developed coordination models to study the relationship between economic growth and the ecological environment based on the Expert Knowledge System due to uncertain or unknown information. Since the beginning of the 21st century, with the development of related disciplines theory, diverse analytical methods and mathematical models have become available due to the development of multiple theories and methods from different disciplines. For example, Stave [
23] and Oliveira [
24] analyzed the interactive relationship between economic growth and the ecological environment through the use of the multi-objective linear programming evaluation model, with input-output analysis as its essential principle. Domestic researchers however, only began to study the interactive relationship between the regional economy’s development and the ecological environment in the 1980s. Having taken the actual situation of the study area fully into account, and with a combination of different analytical methods, multiple evaluation models were developed to quantitatively analyze the coordinated relationship between the regional economy and ecological environment across different spatial scales. For example, Yang [
25], Cai [
26], Ren [
27] and Zhang [
28] applied the barometer of sustainability, polygon synthetic indicator evaluation method and principal component analysis to conduct an empirical study regarding the coordinated relationship between economic growth and the ecological environment at a provincial level.
An area of great interest in current research is to ascertain how the regional economy, tourism industry and ecological environment interact with one another, and how to accurately measure the level of coordination among these three subsystems. Foreign academics generally tend to focus on the coordinated relationship in paired subsystems with all possible combinations. For example, Petrosillo [
29] and Lacitignola [
30] established a model that could reflect the relationship between the economic society and environmental quality on the basis of the tourism industry’s development. Moreover, Wei [
31] applied concepts and tools adapted from mathematical theories to analyze the sustainable relationship between regional tourism development and the social-ecological system. Compared with foreign researchers, domestic scholars have made some substantial gains regarding the coordinated relationship between the regional economy, tourism industry and ecological environment, with a focus on a temporal evolution analysis across different spatial scales; however, less attention has been paid to spatial evolution analysis. Several academics conducted their research at the provincial or regional level. For example, Zhou [
32] analyzed the coupling coordination level of provinces along the Yangtze Economic Zone from temporal and spatial dimension based on the coupling model. Other studies were conducted at the city level. For example, Xiong [
33] introduced the coordinated development degree model to study the level of coordinated development between the regional economy, tourism industry and ecological environment in Zhangjiajie City between 1996 and 2010.
Overall, foreign and domestic researchers have done some excellent work in exploring topics such as how to evaluate the level of coordinated development between the regional economy, tourism industry and ecological environment, both qualitatively and quantitatively, from a variety of different angles and perspectives. Nevertheless, although they have achieved a great deal, certain problems still exist. First, a large number of studies have focused on the development of coordination degree models and subsequent evaluations between subsystems, but the level of coordination within subsystems has received less attention. Furthermore, available literature that explicitly considers the degree of coordination within and between subsystems in a systematic manner is very limited. Second, a large number of studies have focused on the provincial level or prefectural-level cities singly, and temporal or spatial dimension singly. The integrated research from both provincial level and prefectural-level cities is very limited. Therefore, the current study uses 14 cities and prefectures in Gansu Province as the study object, strives to develop a comprehensive measurement model that integrates within- and between-system levels of coordination between the regional economy, tourism industry and ecological environment, as well as the coordinated development degree, and applies the model to conduct a temporal-spatial evolution analysis of the coordinated development of our study object between 2000 and 2016, with the aim, as far as possible, of providing some elements of complementarity.
1.3. Structure and Contribution
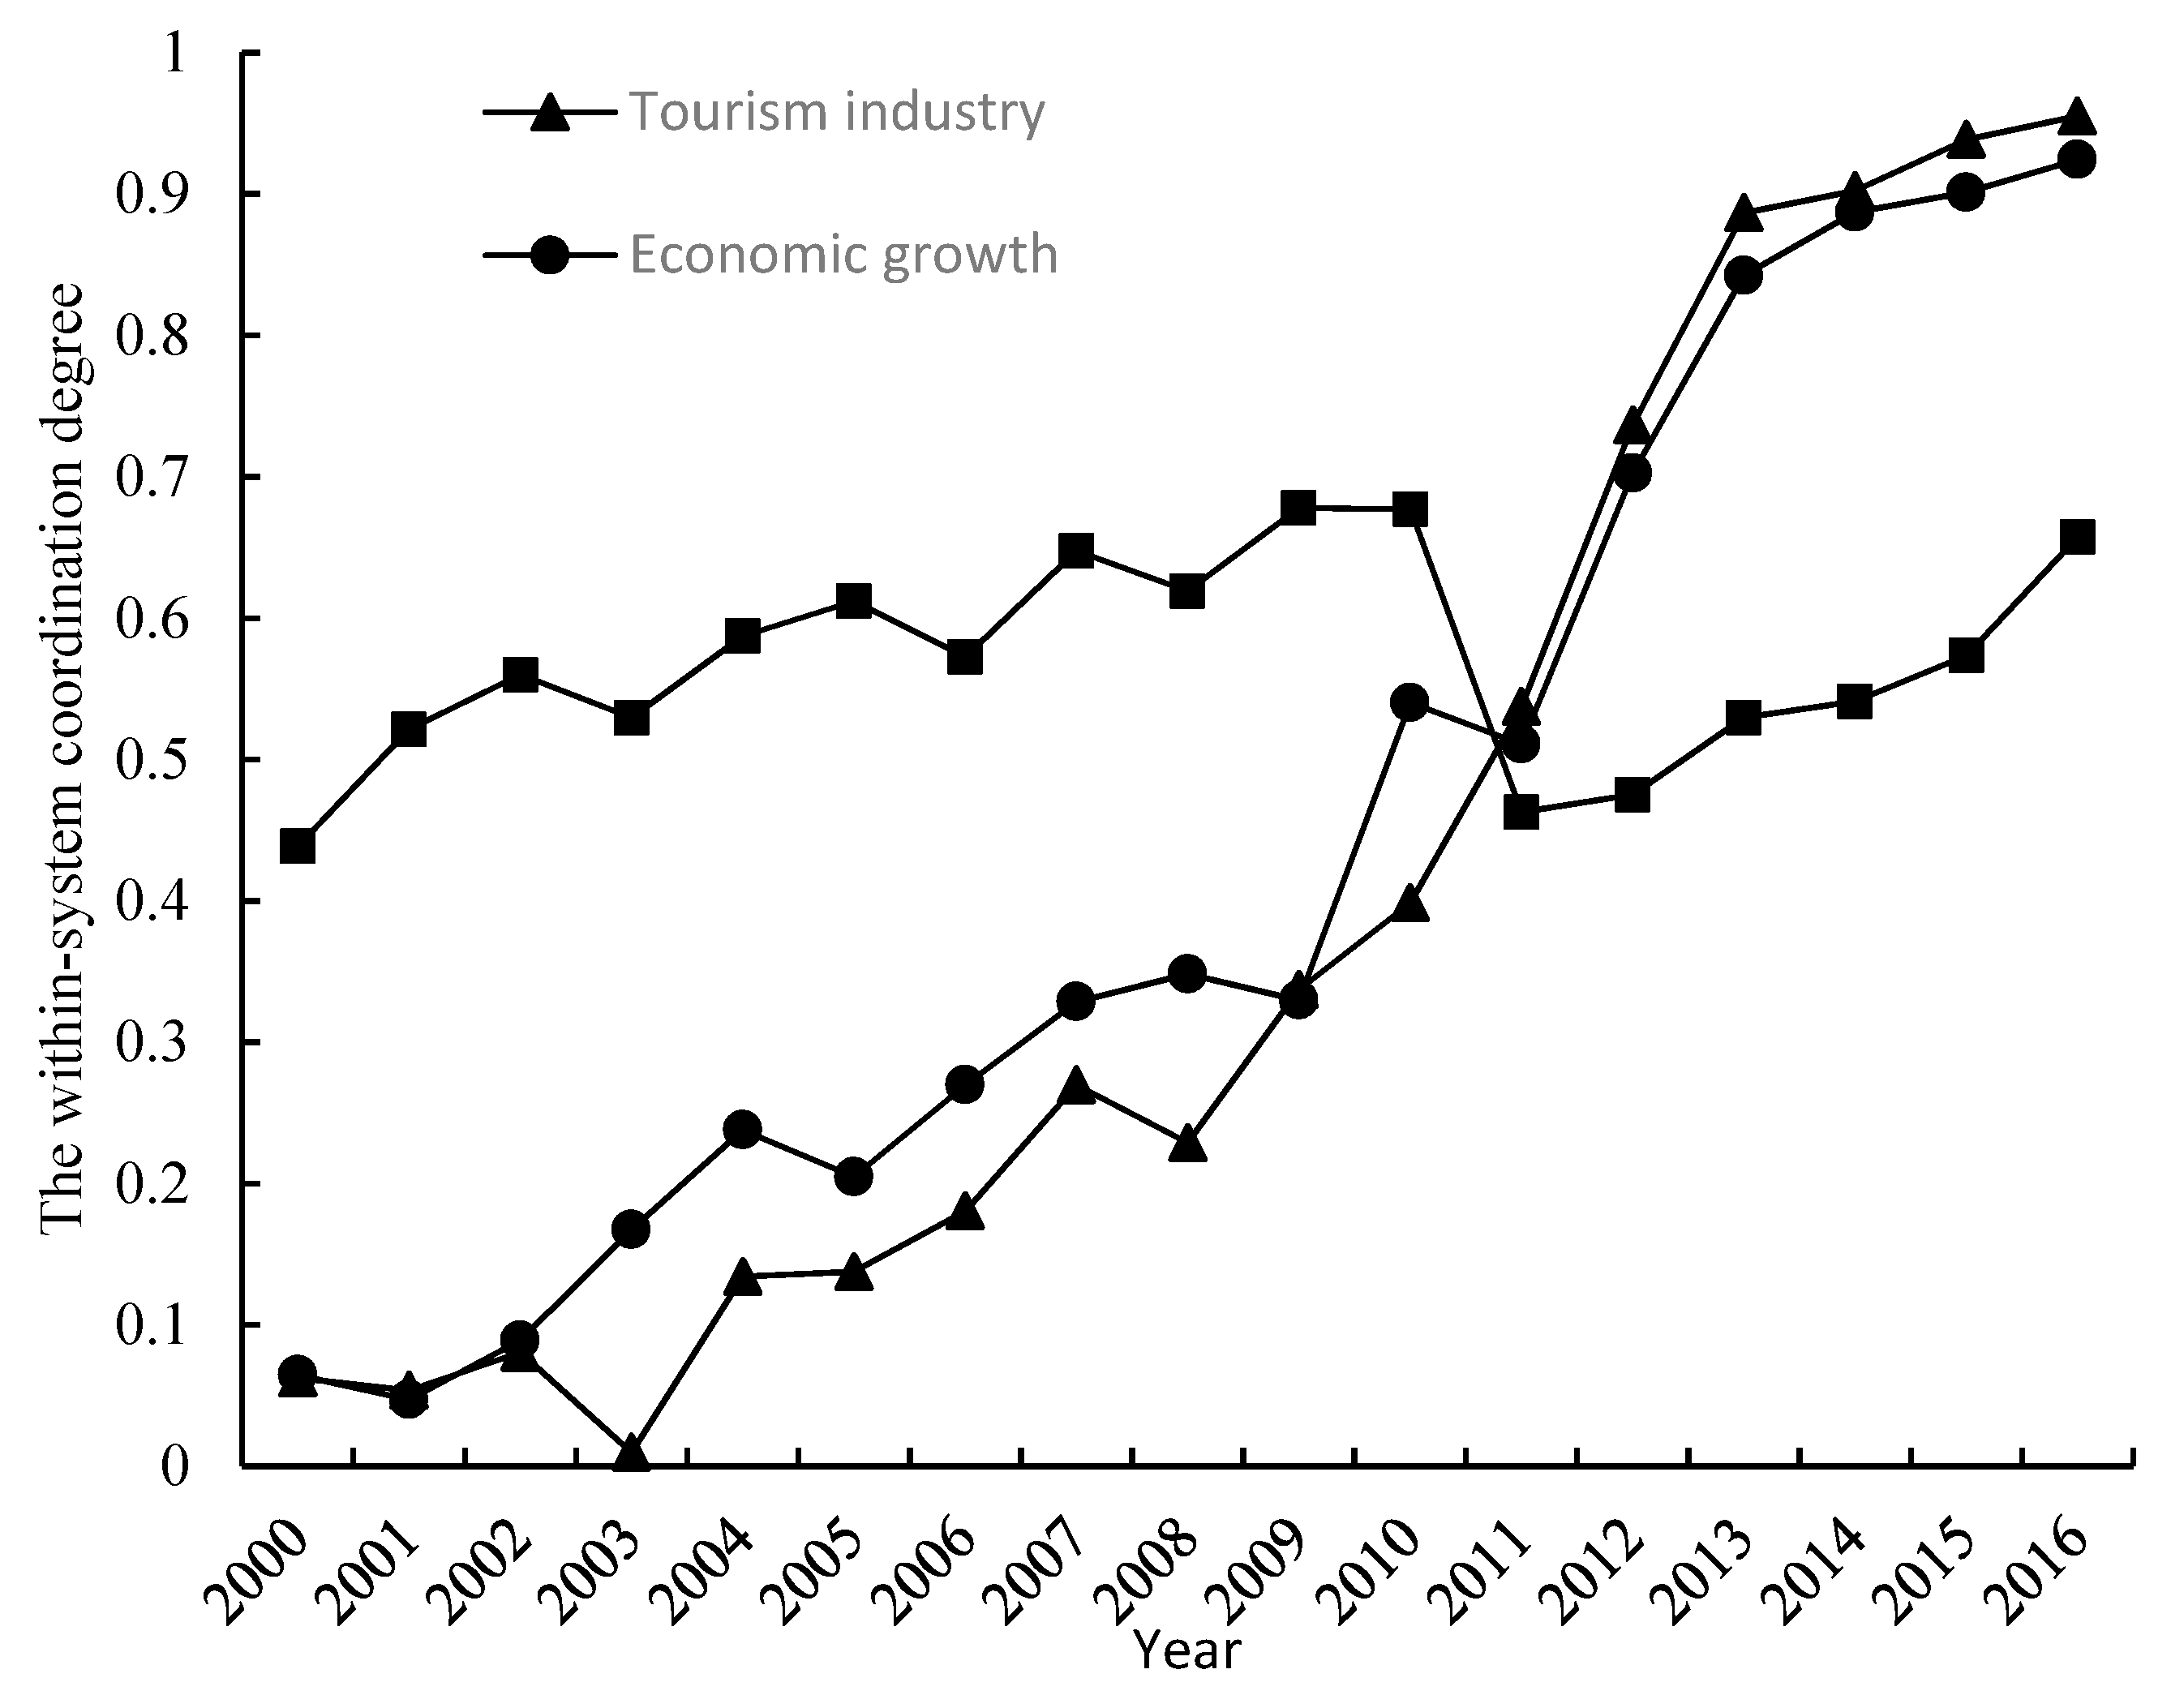
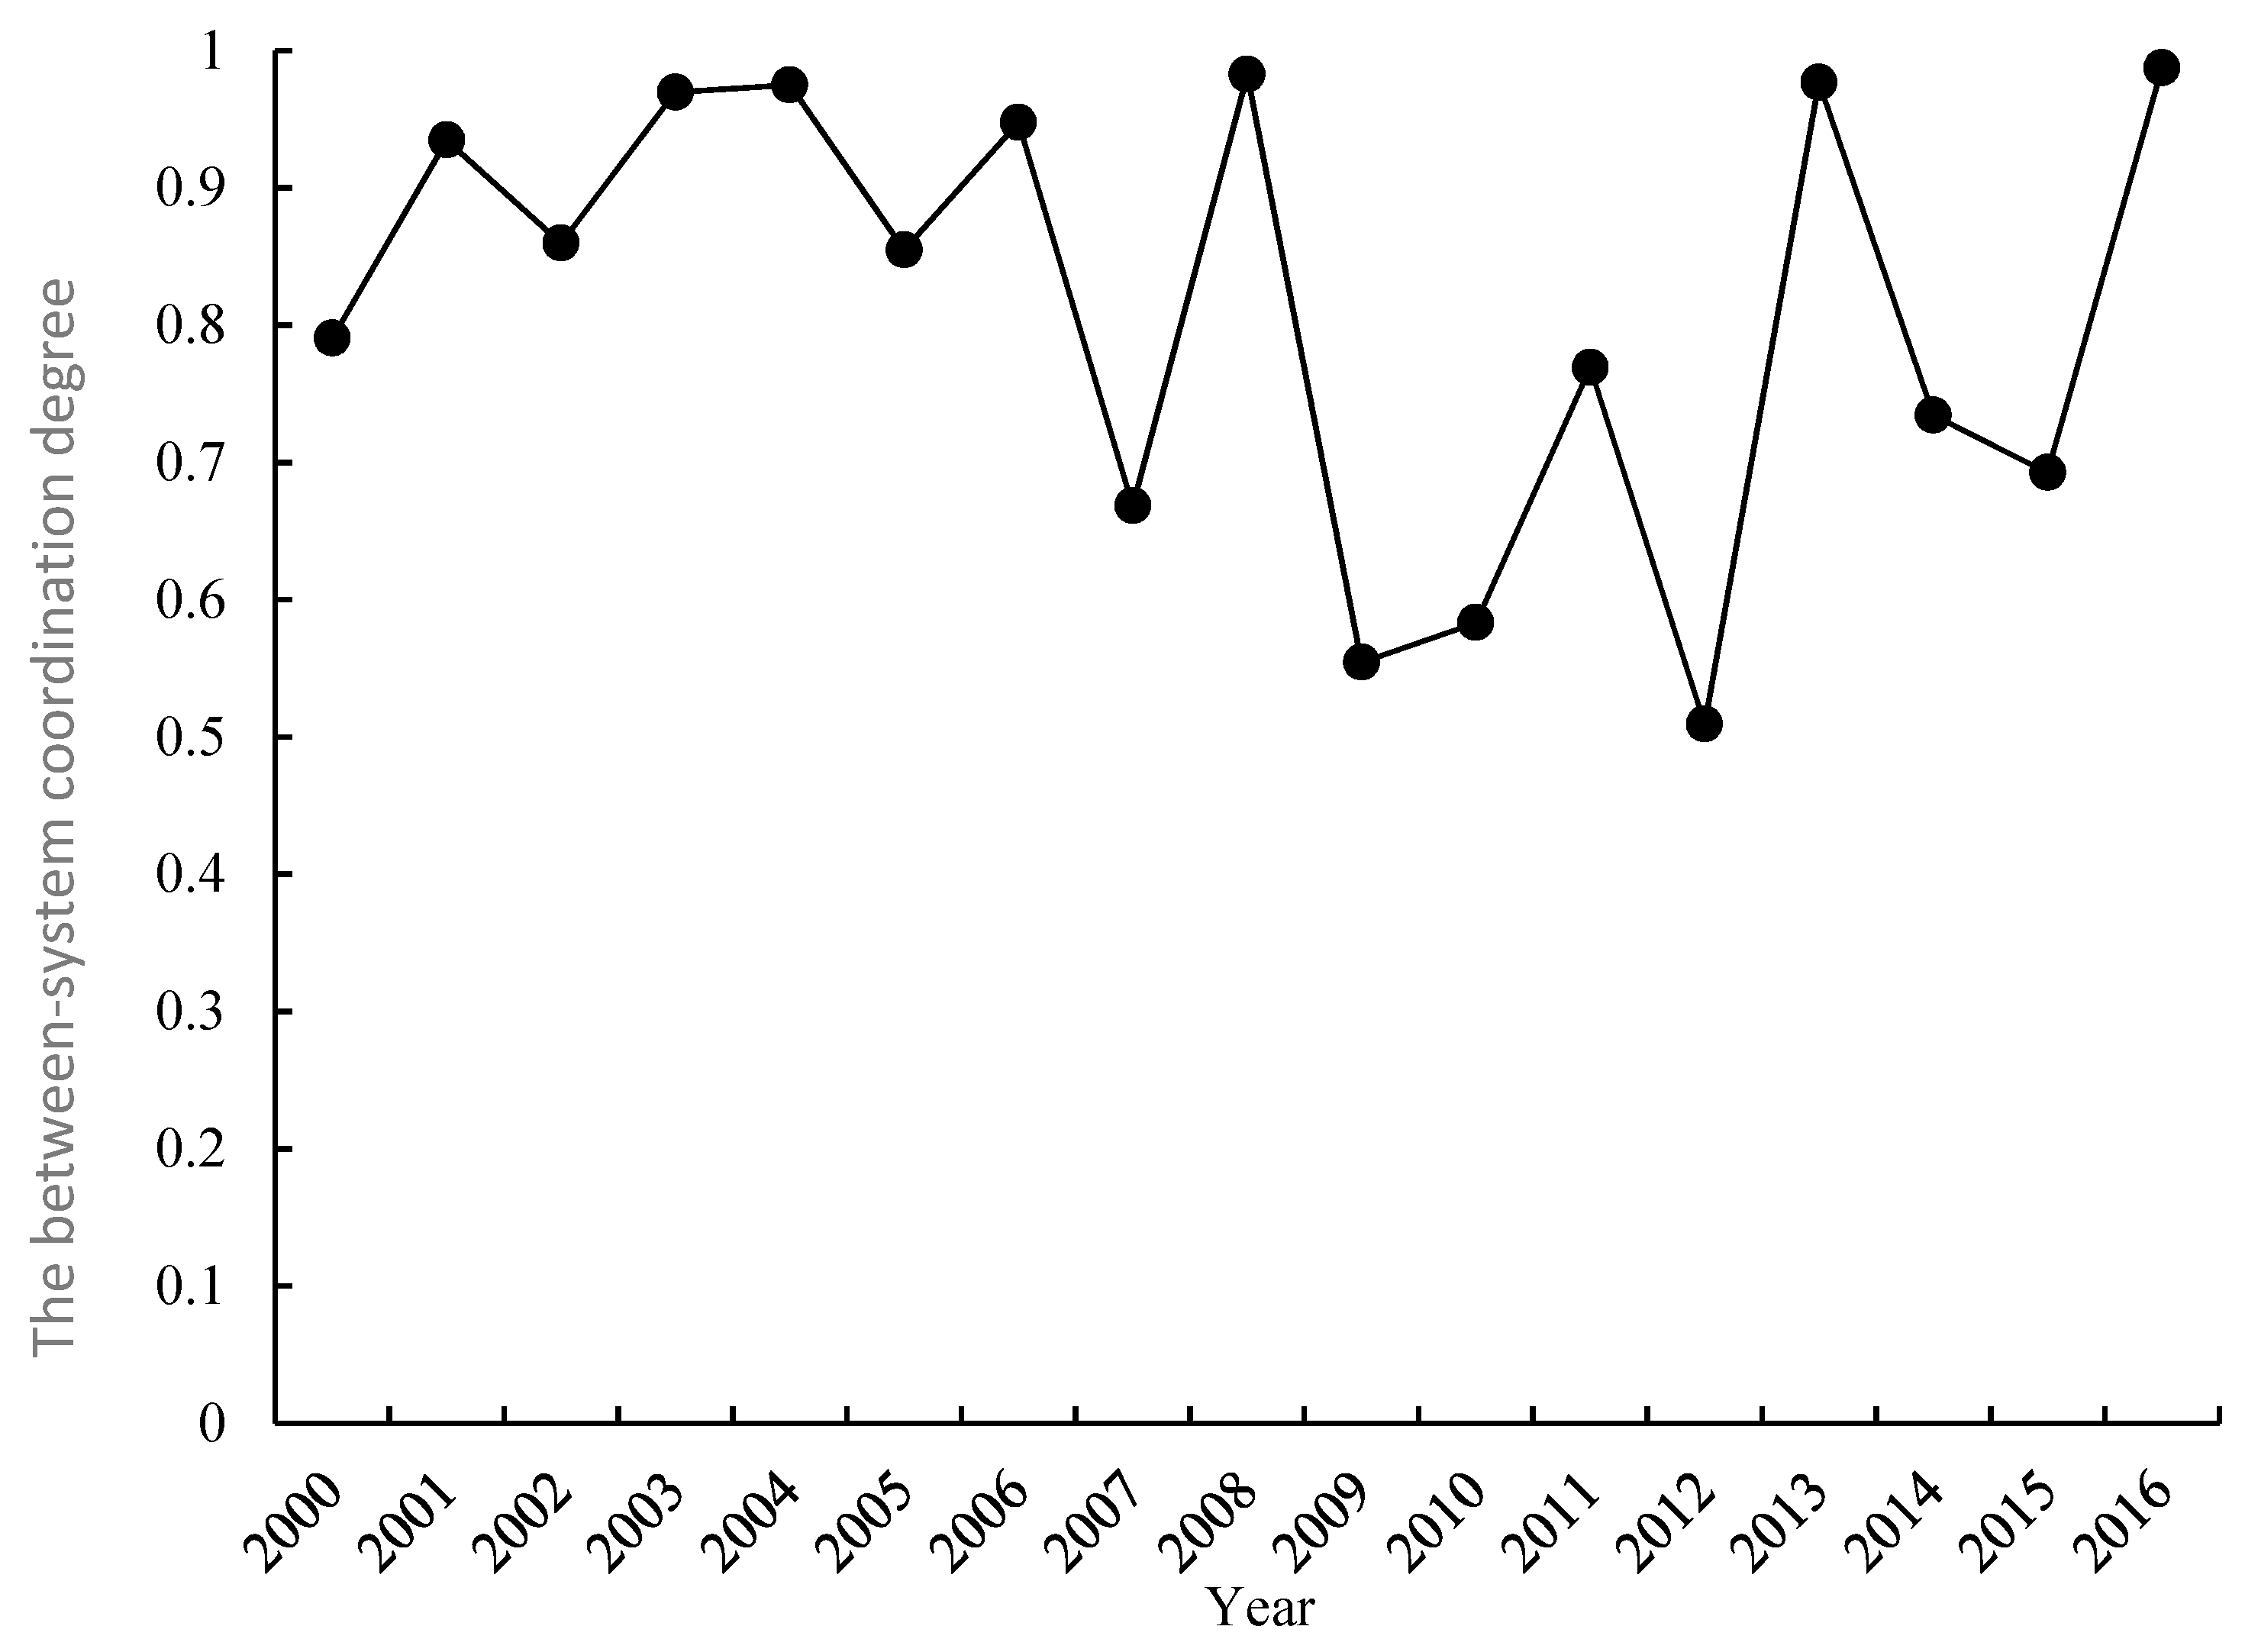
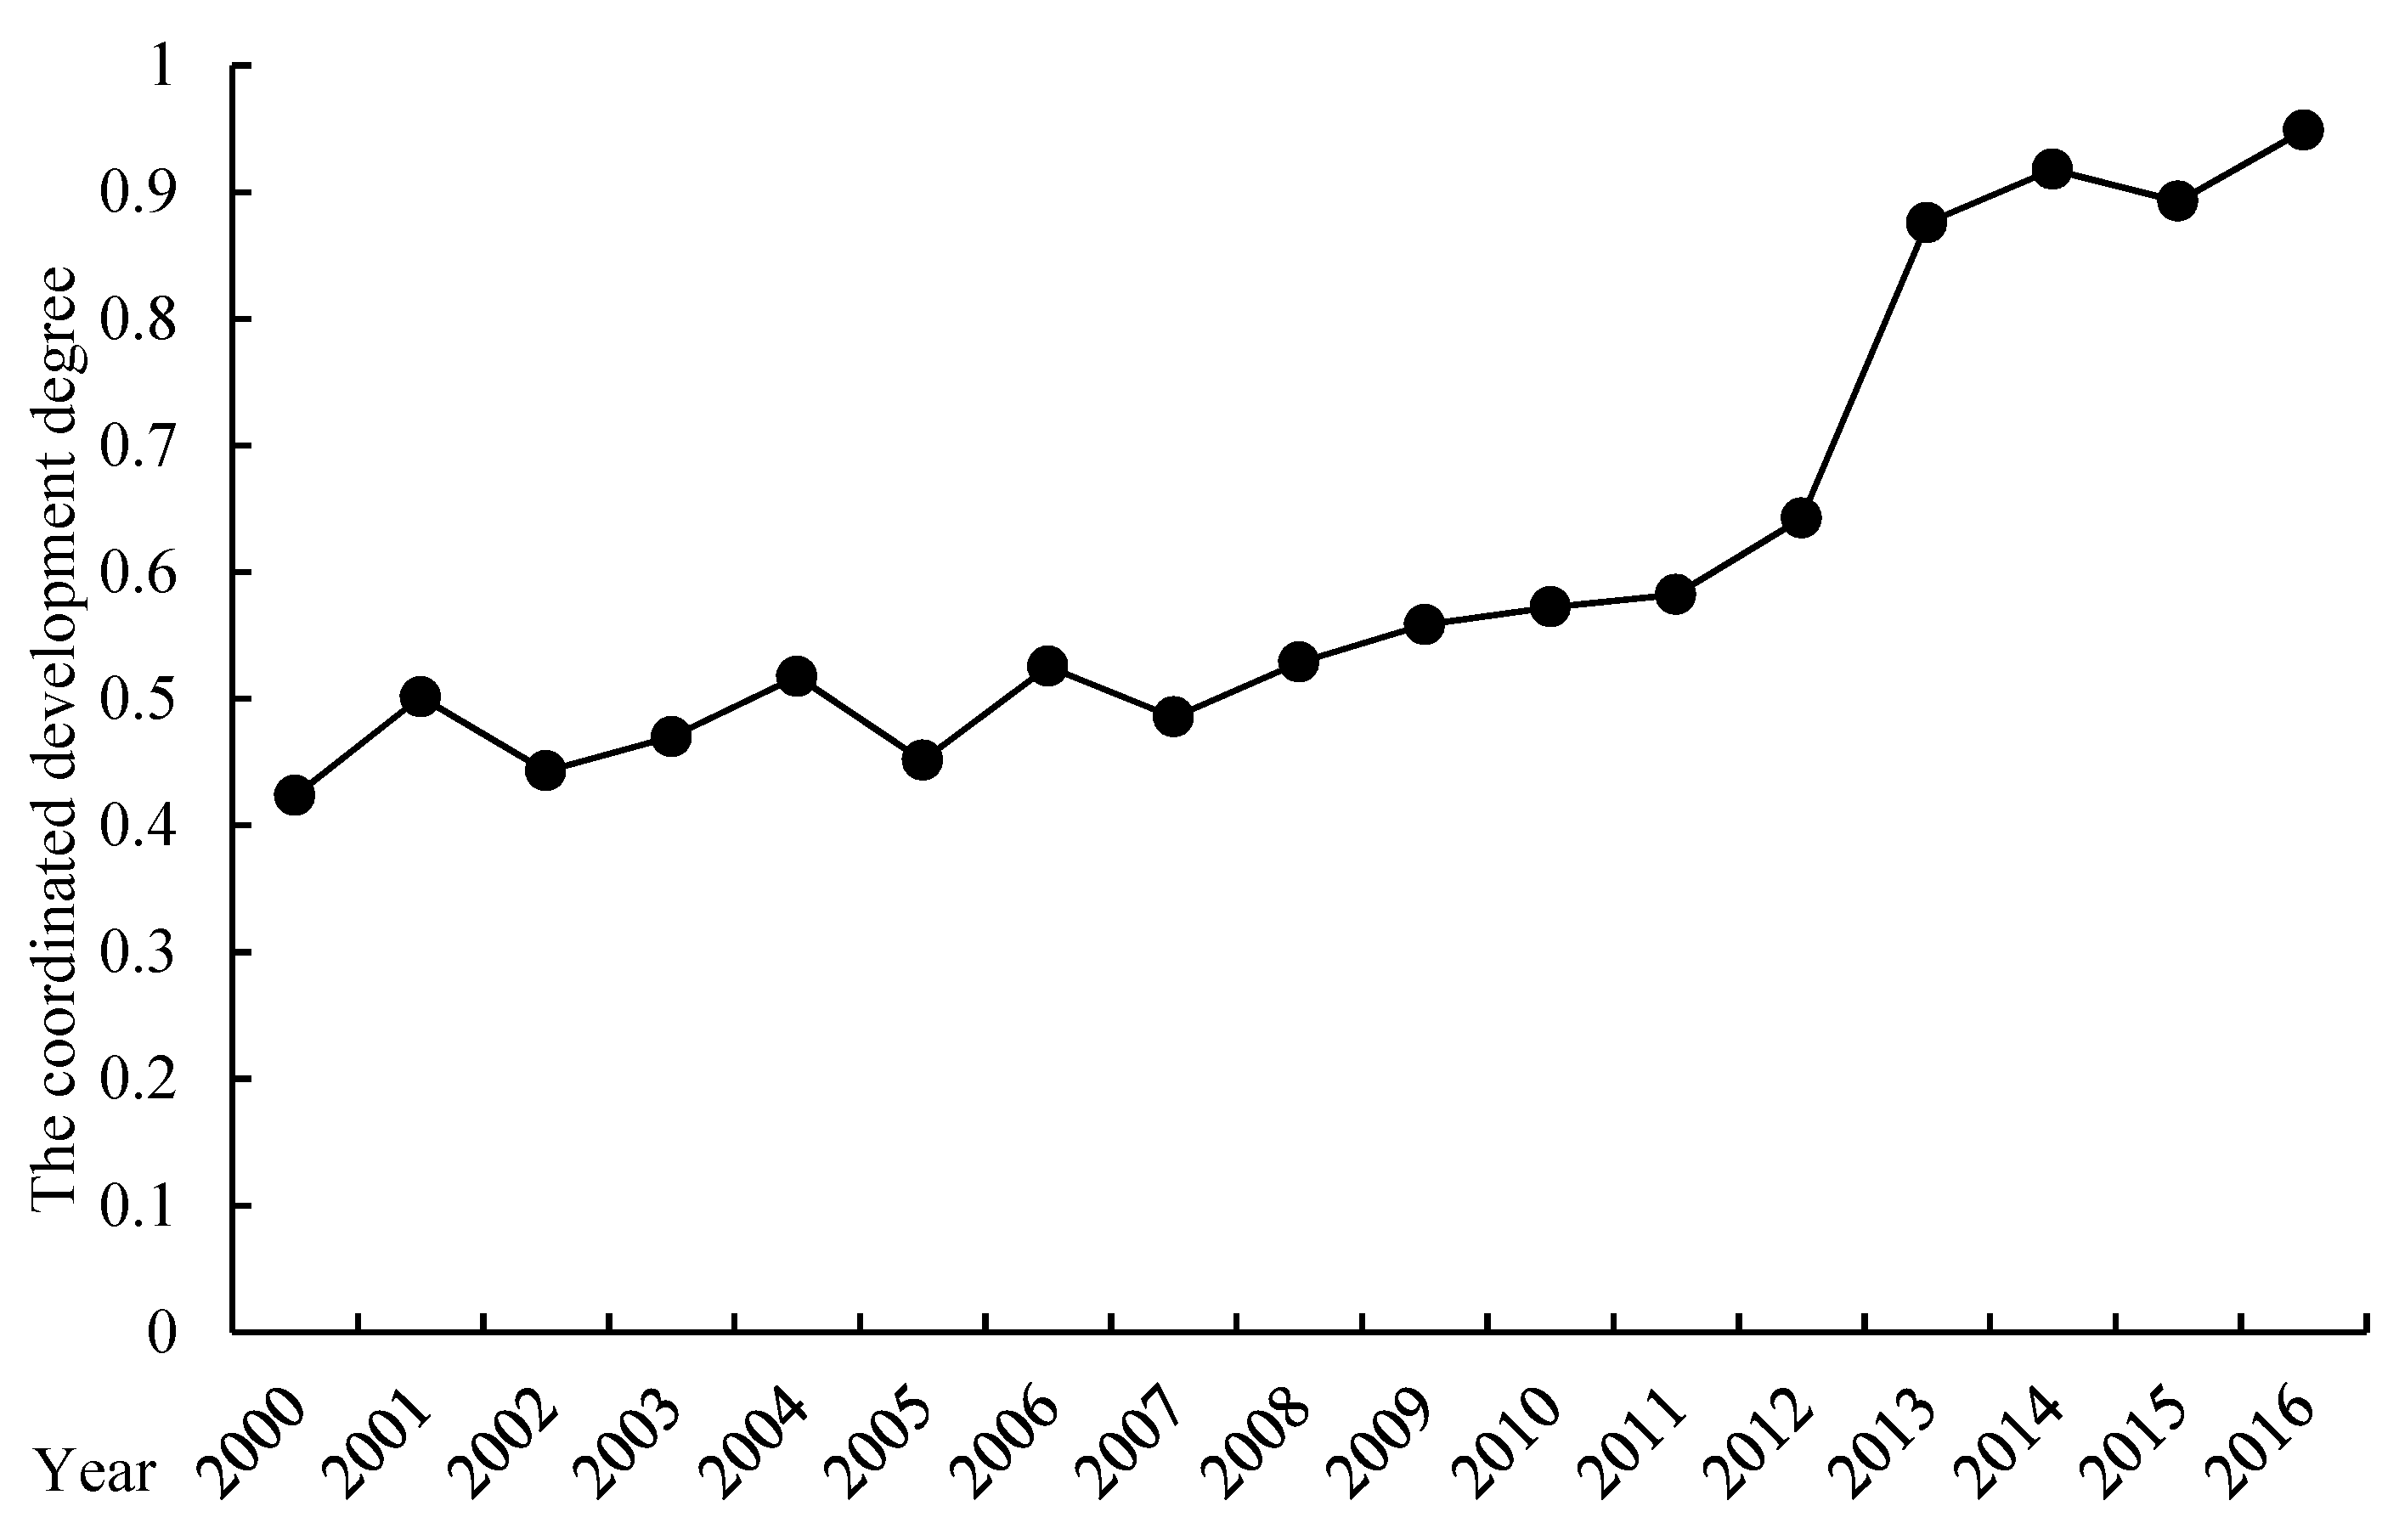
This study chooses Gansu Province and its 14 cities (12 cities and 2 city-level prefectures) as the research area and establishes the evaluation index system of coordinated development of tourism, economy and ecological environment. A comprehensive assignment method combining the subjective analytic hierarchy process and the objective entropy method is used to determine the weight of each index. Furthermore, with a combination of varying quantitative methods, including order parameter analysis, fuzzy membership classification, regression analysis and gray correlation analysis, measurement models for assessing the coordinated development level are established. Then, the within-system coordination degree, the between-system coordination degree and the coordination development degree of tourism, economy and ecological environment are calculated from 2000 to 2016, and the associated temporal and spatial evolution is analyzed.
This research has a certain innovation, that is, it can complement and improve the deficiencies of existing literature. First of all, the research method is innovative. This research uses the order parameter analysis, fuzzy membership classification, gray correlation analysis and other quantitative methods, to establish the measurement models of the within-system coordination degree, the between-system coordination degree and the coordination development degree of tourism, economy and ecological environment. Secondly, the research perspective is innovation. Based on different scales, this research combines the provincial level and prefecture-level to conduct the comprehensive measure and comparative analysis of temporal and spatial evolution of coordinated development of tourism, economy and ecological environment. These two aspects are the contribution of this research to the existing academic literature. In summary, the current study provides solutions and suggestions to help solve some existing research problems, with important theoretical and practical significance. It also offers a useful reference for the development of the regional tourism industry, as well as for executive government departments to create policies related to a coordinated and balanced development between the regional economy, tourism industry and ecological environment, as well as the promotion of sustainable development.


