Can Next-Generation Vehicles Sustainably Survive in the Automobile Market? Evidence from Ex-Ante Market Simulation and Segmentation


Abstract
1. Introduction
2. Literature Review
3. Model Specifications and Data
3.1. The Multiple Discrete-Continuous Extreme Value (MDCEV) Model
3.2. Choice Experiments and Data Description
4. Results and Discussion
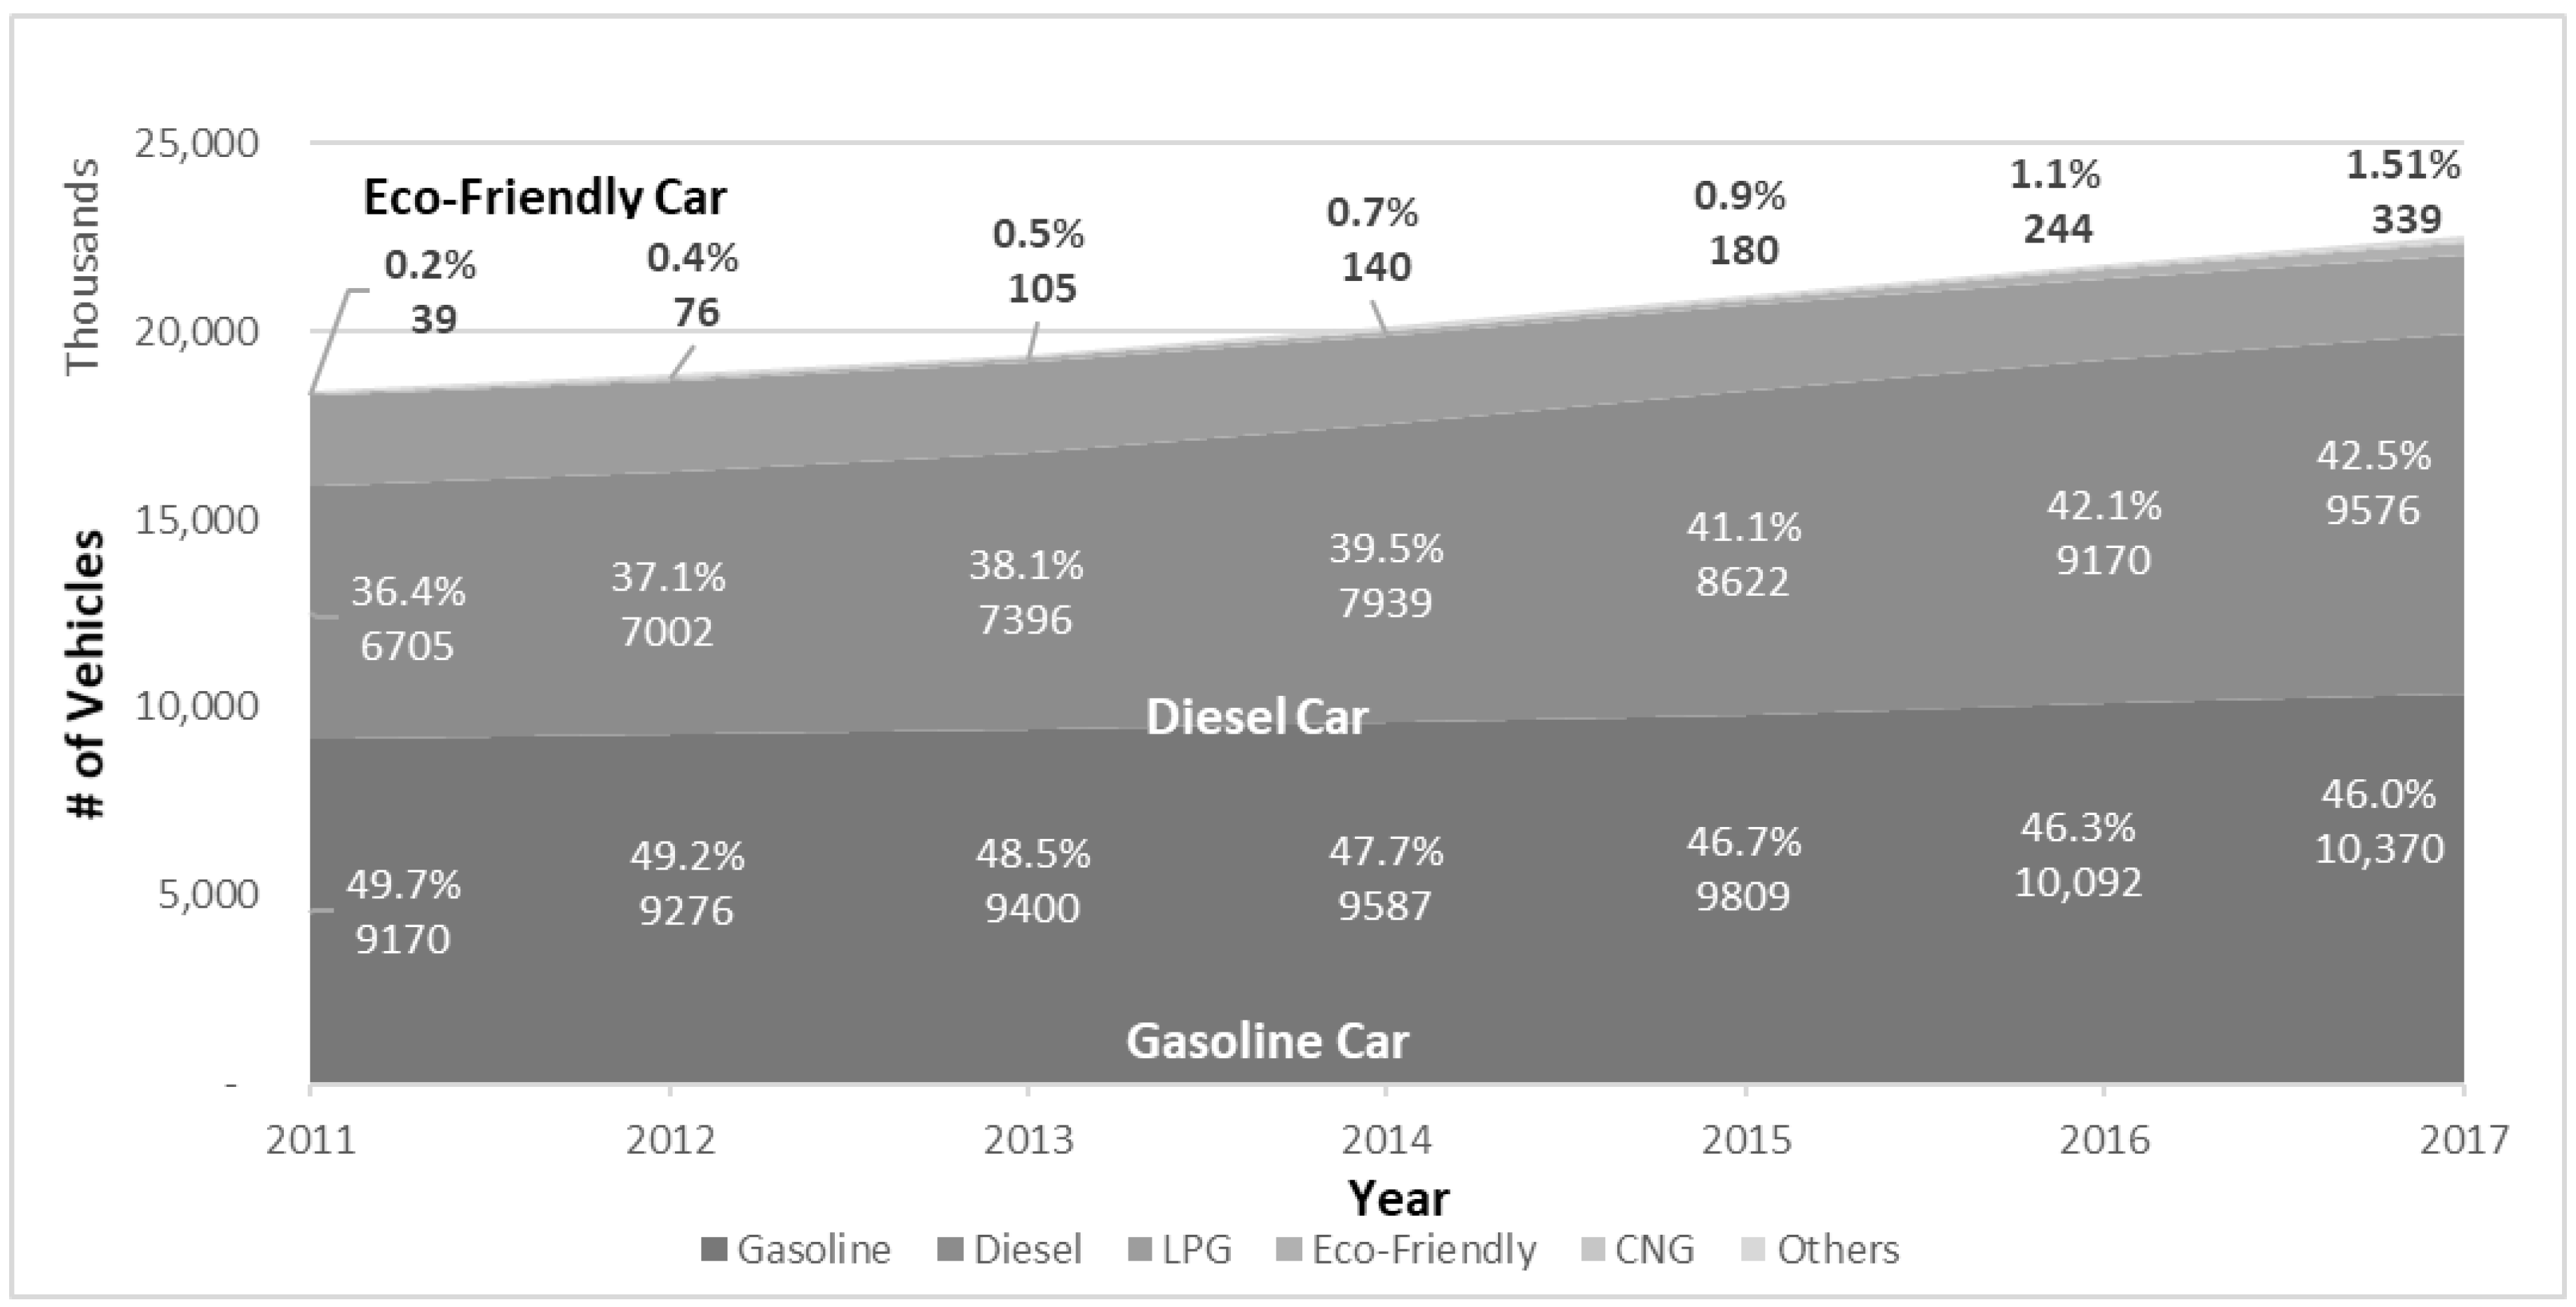
4.1. Overview of Vehicle Market in South Korea
4.2. Estimation Results
4.3. Market Simulations
- Scenario 1: Neither electric vehicles nor smart technologies exist in the automobile market.
- Scenario 2: Electric vehicles are widespread, but smart technologies do not exist in the automobile market.
- Scenario 3: Electric vehicles are widespread, and smart technologies are available in the automobile market.
4.4. Market Segmentation
5. Conclusions and Remarks
Acknowledgments
Author Contributions
Conflicts of Interest
References
- Nelson, S.P. Challenges and Technologies: The Human Friendly Vehicle in 2030 and Beyond; Freescale Semiconductor, Inc.: Mansfield, TX, USA, 2009; Available online: www.freescale.com/files/training_pdf/VFTF09_AA106.pdf (accessed on 29 January 2017).
- Koslowski, T. Your Connected Vehicle Is Arriving. Technology Review. 2012. Available online: www.technologyreview.com/news/426523/your-connected-vehicle-is-arriving/ (accessed on 29 January 2017).
- International Energy Agency (IEA). Statistics—World Energy Balances; IEA: Paris, France, 2017. [Google Scholar]
- Brady, J.; O’Mahony, M. Travel to Work in Dublin. The Potential Impacts of Electric Vehicles on Climate Change and Urban Air Quality. Transp. Res. Part D Transp. Environ. 2011, 16, 188–193. [Google Scholar] [CrossRef]
- Hawkins, T.R.; Gausen, O.M.; Strømman, A.H. Environmental Impacts of Hybrid and Electric Vehicles—A Review. Int. J. Life Cycle Assess. 2012, 17, 997–1014. [Google Scholar] [CrossRef]
- Costagliola, M.A.; Prati, M.V.; Florio, S.; Scorletti, P.; Terna, D.; Iodice, P.; Buono, P.; Senatore, A. Performances and Emissions of a 4-stroke Motorcycle Fueled with Ethanol/Gasoline Blends. Fuel 2016, 183, 470–477. [Google Scholar] [CrossRef]
- Iodice, P.; Senatore, A. Influence of Ethanol-Gasoline Blended Fuels on Cold Start Emissions of a Four-stroke Motorcycle. Methodology and results. SAE Tech. Pap. 2013. [Google Scholar] [CrossRef]
- Chase Econometric Associates. The Effect of Tax and Regulatory Alternatives on Car Sales and Gasoline Consumption; NTIS Report No. PB-234622; Chase Econometric Associates, Inc.: New York, NY, USA, 1974. [Google Scholar]
- Difiglio, C.; Kulash, D. Marketing and Mobility; Report of a Panel of the Interagency Task Force on Motor Vehicle Goals Beyond 1980, Publication FEA/D-76/333; Federal Energy Administration: Washington, DC, USA, 1976. [Google Scholar]
- Beck, M.J.; Chorus, C.G.; Rose, J.M.; Hensher, D.A. Vehicle purchasing behaviour of individuals and groups: Regret or reward? J. Transp. Econ. Policy 2013, 47, 475–492. [Google Scholar]
- Choo, S.; Mokhtarian, P.L. What type of vehicle do people drive? The role of attitude and lifestyle in influencing vehicle type choice. Transp. Res. Part A Gen. 2004, 38, 201–222. [Google Scholar] [CrossRef]
- Chorus, C.G.; Koetse, M.J.; Hoen, A. Consumer preferences for alternative fuel vehicles: Comparing a utility maximization and a regret minimization model. Energy Policy 2013, 61, 901–908. [Google Scholar] [CrossRef]
- Hackbarth, A.; Madlener, R. Consumer preferences for alternative fuel vehicles: A discrete choice analysis. Transp. Res. Part D Transp. Environ. 2013, 25, 5–17. [Google Scholar] [CrossRef]
- Hackbarth, A.; Madlener, R. Willingness-to-pay for alternative fuel vehicle characteristics: A stated choice study for Germany. Transp. Res. Part A Policy Pract. 2016, 85, 89–111. [Google Scholar] [CrossRef]
- Hensher, D.A.; Greene, W.H.; Chorus, C.G. Random regret minimization or random utility maximization: An exploratory analysis in the context of automobile fuel choice. J. Adv. Transp. 2013, 47, 667–678. [Google Scholar] [CrossRef]
- Hoen, A.; Koetse, M.J. A choice experiment on alternative fuel vehicle preferences of private car owners in the Netherlands. Transp. Res. Part A Policy Pract. 2014, 61, 199–215. [Google Scholar] [CrossRef]
- Train, K.E.; Winston, C. Vehicle Choice Behavior and the Declining Market Share of U.S. Automakers. Int. Econ. Rev. 2007, 48, 1469–1496. [Google Scholar] [CrossRef]
- Ahn, J.; Jeong, G.; Kim, Y. A forecast of household ownership and use of alternative fuel vehicles: A multiple discrete-continuous choice approach. Energy Econ. 2008, 30, 2091–2104. [Google Scholar] [CrossRef]
- Shin, J.; Hong, J.; Jeong, G.; Lee, J. Impact of electric vehicles on existing car usage: A mixed multiple discrete–continuous extreme value model approach. Transp. Res. Part D Transp. Environ. 2012, 17, 138–144. [Google Scholar] [CrossRef]
- Ziegler, A. Individual characteristics and stated preferences for alternative energy sources and propulsion technologies in vehicles: A discrete choice analysis for Germany. Transp. Res. Part A Gen. 2012, 46, 1372–1385. [Google Scholar] [CrossRef]
- Lave, C.A.; Train, K. A disaggregate model of auto-type choice. Transp. Res. Part A Gen. 1979, 13, 1–9. [Google Scholar] [CrossRef]
- Boyd, J.H.; Mellman, R.E. The effect of fuel economy standards on the U.S. automotive market: An hedonic demand analysis. Transp. Res. Part A Gen. 1980, 14, 367–378. [Google Scholar] [CrossRef]
- Bunch, D.S.; Bradley, M.; Golob, T.F.; Kitamura, R.; Occhiuzzo, G.P. Demand for clean-fuel vehicles in California: A discrete-choice stated preference pilot project. Transp. Res. Part A Gen. 1993, 27, 237–253. [Google Scholar] [CrossRef]
- Brownstone, D.; Bunch, D.S.; Train, K. Joint mixed logit models of stated and revealed preferences for alternative-fuel vehicles. Transp. Res. Part B Methodol. 2000, 34, 315–338. [Google Scholar] [CrossRef]
- Bhat, C.R. A multiple discrete–continuous extreme value model: Formulation and application to discretionary time-use decisions. Transp. Res. Part B Methodol. 2005, 39, 679–707. [Google Scholar] [CrossRef]
- Bhat, C.R. The multiple discrete-continuous extreme value (MDCEV) model: Role of utility function parameters, identification considerations, and model extensions. Transp. Res. Part B Methodol. 2008, 42, 274–303. [Google Scholar] [CrossRef]
- Site, P.D.; Filippi, F.; Giustiniani, G. Users’ preferences towards innovative and conventional public transport. Procedia Soc. Behav. Sci. 2011, 20, 906–915. [Google Scholar] [CrossRef][Green Version]
- Allenby, G.M.; Rossi, P.E. Marketing models of consumer heterogeneity. J. Econom. 1998, 89, 57–78. [Google Scholar] [CrossRef]
- Edwards, Y.D.; Allenby, G.M. Multivariate analysis of multiple response data. J. Mark. Res. 2003, 40, 321–334. [Google Scholar] [CrossRef]
- Huber, J.; Train, K. On the similarity of classical and Bayesian estimates of individual mean partworths. Mark. Lett. 2001, 12, 259–269. [Google Scholar] [CrossRef]
- Train, K.E. Discrete Choice Methods with Simulation; Cambridge University Press: Cambridge, UK, 2003. [Google Scholar]
- Green, P.E.; Srinivasan, V. Conjoint Analysis in Consumer Research: Issues and Outlook. J. Consum. Res. 1978, 5, 103–123. [Google Scholar] [CrossRef]
- Lim, S.; Huh, S.; Shin, J.; Lee, J.; Lee, Y. Enhancing public acceptance of renewable heat obligation policies in South Korea: Consumer preferences and policy implications. Energy Econ. 2015. [Google Scholar] [CrossRef]
- Ministry of Land, Infrastructure and Transport (MOLIT). Press Releases: The Number of Registered Vehicles Continues to Increase—A Vehicle Owned Per 2.3 People; MOLIT: Sejong City, Korea, 2018. Available online: http://www.molit.go.kr/USR/NEWS/m_71/dtl.jsp?lcmspage=2&id=95080239 (assessed on 10 February 2018).
- Statistics Korea. Current Status on Vehicle Registration; Statistics Korea: Daejeon, Korea, 2018. Available online: http://www.index.go.kr/potal/stts/idxMain/selectPoSttsIdxSearch.do?idx_cd=1257 (assessed on 10 February 2018).
- Ministry of Land, Infrastructure and Transport (MOLIT). Vehicle Registration Statistics December 2017; MOLIT: Sejong City, Korea, 2018. Available online: http://stat.molit.go.kr/portal/cate/statView.do?hRsId=58&hFormId=1244&hDivEng=&month_yn=N (assessed on 10 February 2018).
- Train, K.; Sonnier, G. Mixed Logit with Bounded Distributions of Correlated Partworths. In Applications of Simulation Methods in Environmental and Resource Economics; Scarpa, R., Alberini, A., Eds.; Springer: Dordrecht, The Netherlands, 2005; pp. 117–134. [Google Scholar]
- Harrop, P.; Das, R. Hybrid and Pure Electric Vehicles for Land, Water and Air 2013–2023: Forecasts, Technologies, Players; IDTechEx: Cambridge, UK, 2013; Available online: www.sae.org/images/books/toc_pdfs/MRID005.pdf (accessed on 29 January 2017).
- Consumer Insight. Consumer Report for Vehicles. 2017. Available online: https://www.consumerinsight.co.kr/sub.asp?tcode=t4&code=ins01_view&id=ins01&mode=view&idx=2880 (accessed on 7 February 2018).
- Ministry of Land, Infrastructure and Transport (MOLIT). Accumulated Number of Car Registration Could Exceed 20 Million in This Year; MOLIT: Sejong City, Korea, 2014. Available online: www.molit.go.kr/USR/NEWS/m_71/dtl.jsp?id=95074215 (Korean) (accessed on 29 January 2017).
- Iodice, P.; Senatore, A. Appraisal of Pollutant Emissions and Air Quality State in a Critical Italian Region: Methods and Results. Environ. Prog. Sustain. Energy 2015, 34, 1497–1505. [Google Scholar] [CrossRef]
- Iodice, P.; Senatore, A. Atmospheric Pollution from Point and Diffuse Sources in a National Interest Priority Site Located in Italy. Energy Environ. 2016, 27, 586–596. [Google Scholar] [CrossRef]
- Statistical Package for the Social Sciences (SPSS). The SPSS TwoStep Cluster Component: A Scalable Component Enabling More Efficient Customer Segmentation; SPSS Inc.: Hong Kong, China, 2001; Available online: www.spss.ch/upload/1122644952_The%20SPSS%20TwoStep%20Cluster%20Component.pdf (accessed on 29 January 2017).
- Hensher, D.A. Empirical approaches to combining revealed and stated preference data: Some recent developments with reference to urban mode choice. Res. Transp. Econ. 2008, 23, 23–29. [Google Scholar] [CrossRef]
- Cirillo, C.; Xu, R.; Bastin, F. A dynamic formulation for car ownership modelling. Transp. Sci. 2016, 50, 322–335. [Google Scholar] [CrossRef]


| Study | Research Goal | Data | Methodology | Key Findings |
|---|---|---|---|---|
| Bunch et al. [23] | Consumer preference for clean-fuel vehicles |
|
| Range and fuel cost are key attributes for clean-fuel vehicle choice. |
| Brownstone et al. [24] | Joint ML models for consumer preference toward AFVs |
|
| ML models draw improved results over MNL models; using joint SP/RP data is advantageous. |
| Ahn et al. [18] | Demand pattern change induced by AFVs in the vehicle market |
|
| Introducing AFVs would reduce both gasoline and diesel fuel consumption and related emissions. |
| Site et al. [27] | User preference for CTS |
|
| Users prefer automated transportation systems to conventional ones. |
| Shin et al. [19] | Introduction impact of electric vehicles on current car usage |
|
| Potential demand for electric vehicles is higher than for hybrid, diesel, or gasoline vehicles, and purchase price subsidies are more effective for emission reductions. |
| Ziegler [20] | German potential car buyers’ preference for AFVs |
|
| Policies to promote electromobility should target specific population groups: younger people, environmentally aware people, males. |
| Beck et al. [10] | Estimation of Consumer preference for AFVs |
|
| RRM is preferred behavioral mechanism for groups and individuals charging a high degree of responsibility for the choice of the group |
| Chorus et al. [12] | Estimation of Consumer preference for AFVs using RUM and RRM |
|
| RUM and RRM achieve almost identical fit with the data and differ only marginally in terms of predictive ability |
| Hackbarth and Madlener [13] | Estimation of Consumer preference for AFVs and Introduction impact of AFVs |
|
| Conventional vehicles will maintain their dominance in the market after the introduction of AFVs |
| Hensher et al. [15] | Estimation of Consumer preference on automobile fuel using RUM and RRM |
|
| The RRM model achieve a marginally better fit than RUM |
| Hoen and Koetse [16] | Estimation of Consumer preference for AFVs |
|
| Negative preferences for AFVs are large, especially for the electric and fuel cell car Due to limited driving range and refueling times. |
| Hackbarth and Madlener [14] | Estimation of Consumer preference for AFVs |
|
| Estimation of consumers’ WTP and CV for improvements in vehicle attributes |
| Sample Size | 639 respondents |
| Gender Distribution | 304 (47.6%) males and 335 (52.4%) females |
| Age Distribution | 20–59 (Average: 38.5) |
| Family Monthly Income | 1.4–12 million KRW [USD $1283–$10,999] (Average: 4.14 million KRW [USD $4031]) |
| >Drivers and Non-Drivers | >312 (48.8%) non-drivers and 327 (51.2%) drivers |
| Attributes | Levels | Details |
|---|---|---|
| Fuel Type | Gasoline, Diesel, Hybrid (gasoline + battery), Electric (battery) | Electric vehicles can cover approximately 150 km (81 miles) when fully charged; to recharge, they require a 4-h charge or 2-min battery replacement. |
| Body Type | General Passenger Car, SUV | - |
| Fuel Price (KRW/km) | 200 (0.18 USD/km), 100 (0.09 USD/km), 50 (0.05 USD/km) | - |
| Purchase Price (10,000 KRW) | 2500 (USD $22,915), 3000 (USD $27,498), 3500 (USD $32,081), 4000 (USD $36,664) | Incidental expenses and tax were excluded. |
| Accessibility of Fueling Stations (%) | 100, 80, 50 | The percentage was defined as the ratio of the number of fueling stations for a specific type of fuel to the current number of traditional gas stations. |
| Smart technologies | Equipped, Non-equipped | - |
| All Respondents | Drivers | Non-Drivers | |||||
|---|---|---|---|---|---|---|---|
| Baseline | β | Mean | Variance | Mean | Variance | Mean | Variance |
| Variable | Distribution | ||||||
| Gasoline (Base) | Normal | - | - | - | - | - | - |
| Diesel | Normal | −0.5981 ** | 1.0586 ** | −0.1571 | 1.0544 ** | −1.1797 ** | 1.0611 ** |
| Hybrid | Normal | 0.0617 | 1.0951 ** | 1.6563 ** | 1.094 8 ** | −0.6832 | 1.0876 ** |
| Electric | Normal | −1.2838 ** | 1.0466 ** | −0.095 | 1.0365 ** | −1.6388 ** | 1.044 ** |
| SUV | Normal | 0.0371 | 1.0244 ** | 0.0336 | 1.0074 ** | 0.022 | 1.0461 ** |
| Fuel Cost | Log-normal | −1.2271 ** | 2.4808 ** | −1.1317 ** | 2.1456 ** | −1.2815 ** | 2.6826 ** |
| Purchase Price | Log-normal | −0.7261 ** | 0.8433 ** | −0.5798 ** | 0.5416 ** | −0.7837 ** | 0.9583 ** |
| Accessibility of Fueling Station | Normal | 1.6795 ** | 1.0031 ** | 1.5279 ** | 0.9949 ** | 1.7915 ** | 1.0011 ** |
| Smart technologies | Normal | 0.5263 ** | 1.0404 ** | 0.4817 ** | 1.053 ** | 0.5674 ** | 1.0319 ** |
| Satiation | α | Mean | Variance | Mean | Variance | Mean | Variance |
| Variable | Distribution | ||||||
| Gasoline | Normal | 0.0061 ** | 0.0001 ** | 0.0057 ** | 0.0001 ** | 0.0021 ** | 0.0000 ** |
| Diesel | Normal | 0.0063 ** | 0.0000 ** | 0.0044 ** | 0.0000 ** | 0.0034 ** | 0.0000 ** |
| Hybrid | Normal | 0.0062 ** | 0.0001 ** | 0.0013 ** | 0.0000 ** | 0.0041 ** | 0.0000 ** |
| Electric | Normal | 0.0106 ** | 0.0002 ** | 0.0033 ** | 0.0000 ** | 0.0056 ** | 0.0001 ** |
| Number of Respondents | 639 | 327 | 312 | ||||
| Attributes | Gasoline | Diesel | Hybrid | Electric | |
|---|---|---|---|---|---|
| Fuel cost (KRW/Km) | Sedan | 127.4 | 95.6 | 88.8 | 18.2 |
| SUV | 170.8 | 116.2 | 100.3 | 21.1 | |
| Purchase price (1 million KRW) | Sedan | 25 | 30 | 35 | 45 |
| SUV | 28 | 33 | 38 | 48 | |
| Accessibility of fueling stations (%) | 100 | 100 | 100 | 50 | |
| SUV (Vehicle Type) | SUV or Sedan | SUV or Sedan | SUV or Sedan | SUV or Sedan | |
| Smart technologies | Provide or Not provide | Provide or Not provide | Provide or Not provide | Provide or Not provide | |
| Scenario 1→Scenario 2 (+Electric without Smart Technologies) | Scenario 2→Scenario 3 (+Electric with Smart Technologies) | |||
|---|---|---|---|---|
| Variation on Average Car Usage (km) | Variation in Choice Probability (%) | Variation on Average Car Usage (km) | Variation in Choice Probability (%) | |
| Gasoline | −737.0 | +1.6% | −4336.8 | −2.7% |
| Diesel | −145.7 | +3.1% | −1829.6 | +2.7% |
| Hybrid | −1143.1 | +3.3% | −5036.4 | −11.7% |
| Electric | +2025.8 | +29.7% | −1201.5 | −0.5% |
| Gasoline with smart technologies | - | - | +4409.7 | +83.6% |
| Diesel with smart technologies | - | - | +2461.1 | +65.9% |
| Hybrid with smart technologies | - | - | +4140.9 | +76.7% |
| Electric with smart technologies | - | - | +1392.7 | +38.7% |
| Analysis 1 | Size of Cluster (%) | Sex (Male = 1) (Female = 0) | Age (Years) | Monthly Household Income (10,000 KRW) | No. of Family Members | Preferred Fuel Type |
| Cluster A1 | 44.3 | 0.42 | 39.1 | 420 | 3.59 | Gasoline |
| Cluster A2 | 35.7 | 0.54 | 37.7 | 406 | 3.55 | Hybrid |
| Cluster A3 | 20.0 | 0.46 | 38.4 | 412 | 3.66 | Diesel or electric |
| Analysis 2 | Size of Cluster (%) | Sex (Male = 1) (Female = 0) | Age (Years) | Monthly Household Income (10,000 KRW) | No. of Family Members | Preferred Next Fuel Type of Generation Vehicles |
| Cluster B1 | 36.6 | 0.43 | 39.0 | 410 | 3.56 | Gasoline with smart technologies |
| Cluster B2 | 35.8 | 0.47 | 38.3 | 421 | 3.68 | Diesel or electric with smart technologies |
| Cluster B3 | 27.5 | 0.53 | 37.8 | 408 | 3.52 | Hybrid with smart technologies |
© 2018 by the authors. Licensee MDPI, Basel, Switzerland. This article is an open access article distributed under the terms and conditions of the Creative Commons Attribution (CC BY) license (http://creativecommons.org/licenses/by/4.0/).
Share and Cite
Shin, J.; Lim, T.; Kim, M.Y.; Choi, J.Y. Can Next-Generation Vehicles Sustainably Survive in the Automobile Market? Evidence from Ex-Ante Market Simulation and Segmentation. Sustainability 2018, 10, 607. https://doi.org/10.3390/su10030607
Shin J, Lim T, Kim MY, Choi JY. Can Next-Generation Vehicles Sustainably Survive in the Automobile Market? Evidence from Ex-Ante Market Simulation and Segmentation. Sustainability. 2018; 10(3):607. https://doi.org/10.3390/su10030607
Chicago/Turabian StyleShin, Jungwoo, Taehoon Lim, Moo Yeon Kim, and Jae Young Choi. 2018. "Can Next-Generation Vehicles Sustainably Survive in the Automobile Market? Evidence from Ex-Ante Market Simulation and Segmentation" Sustainability 10, no. 3: 607. https://doi.org/10.3390/su10030607
APA StyleShin, J., Lim, T., Kim, M. Y., & Choi, J. Y. (2018). Can Next-Generation Vehicles Sustainably Survive in the Automobile Market? Evidence from Ex-Ante Market Simulation and Segmentation. Sustainability, 10(3), 607. https://doi.org/10.3390/su10030607