Relationship between Park Composition, Vegetation Characteristics and Cool Island Effect


Abstract
1. Introduction
2. Methods
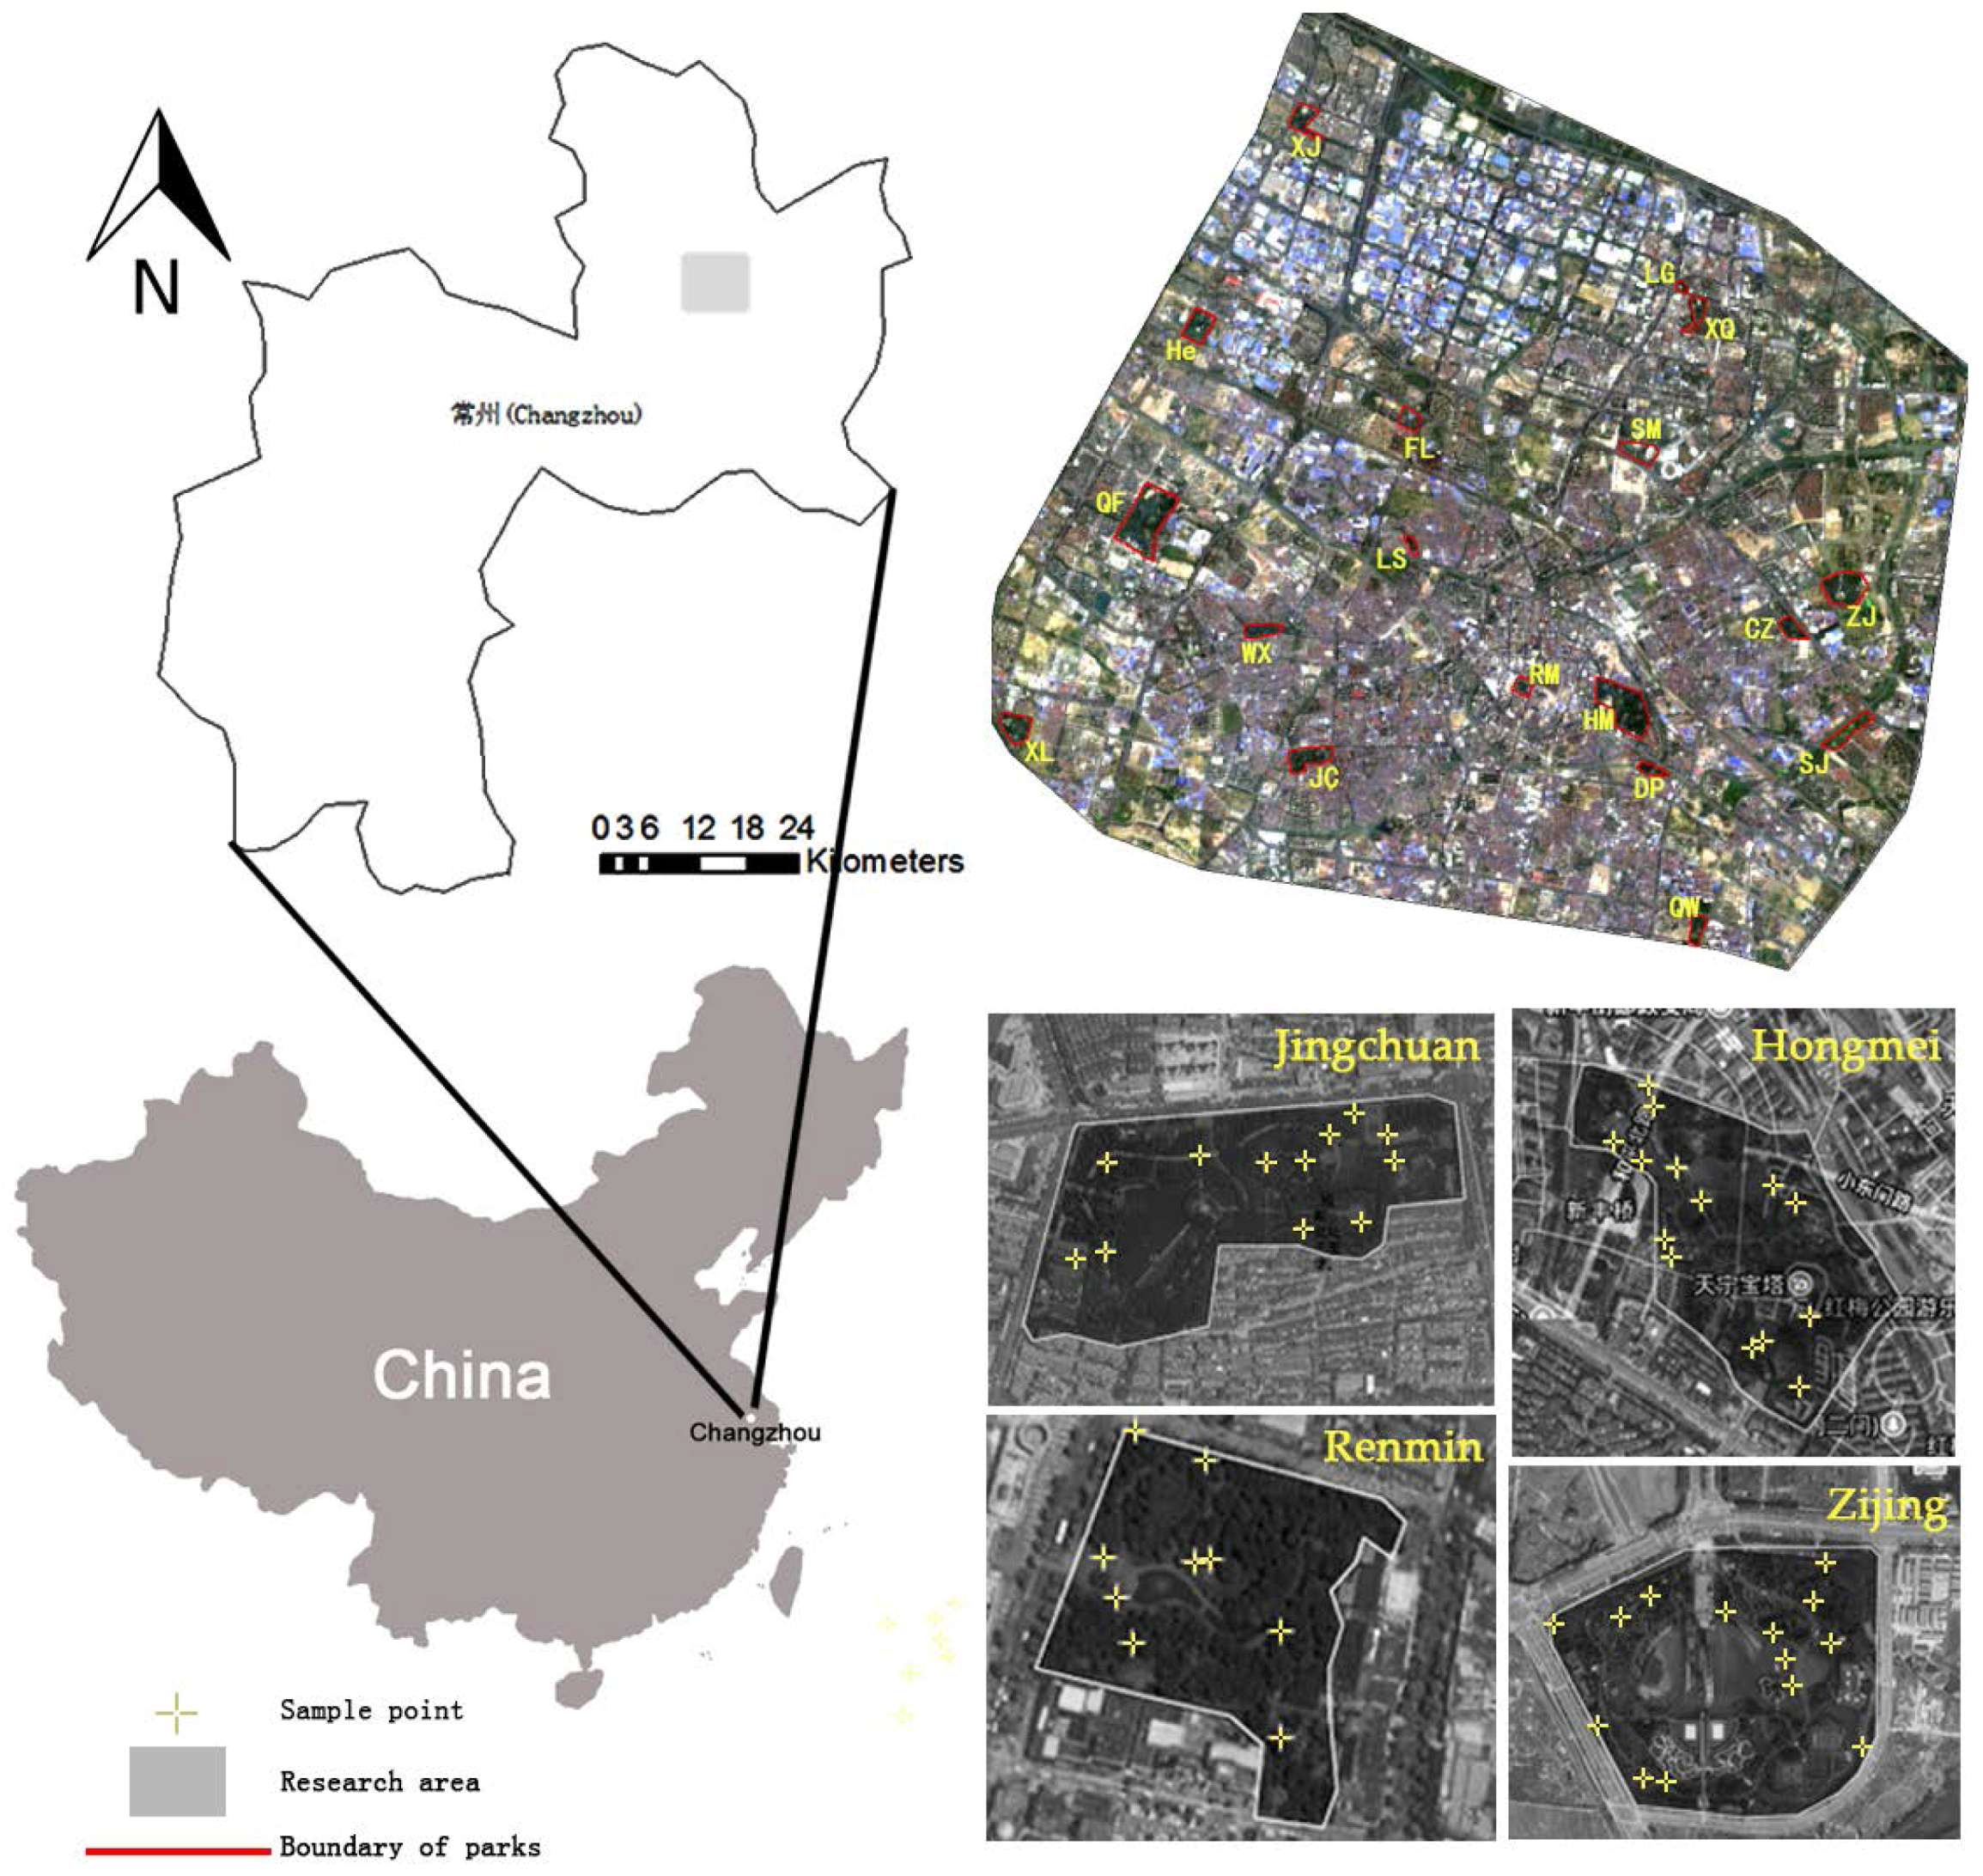
2.1. Study Area
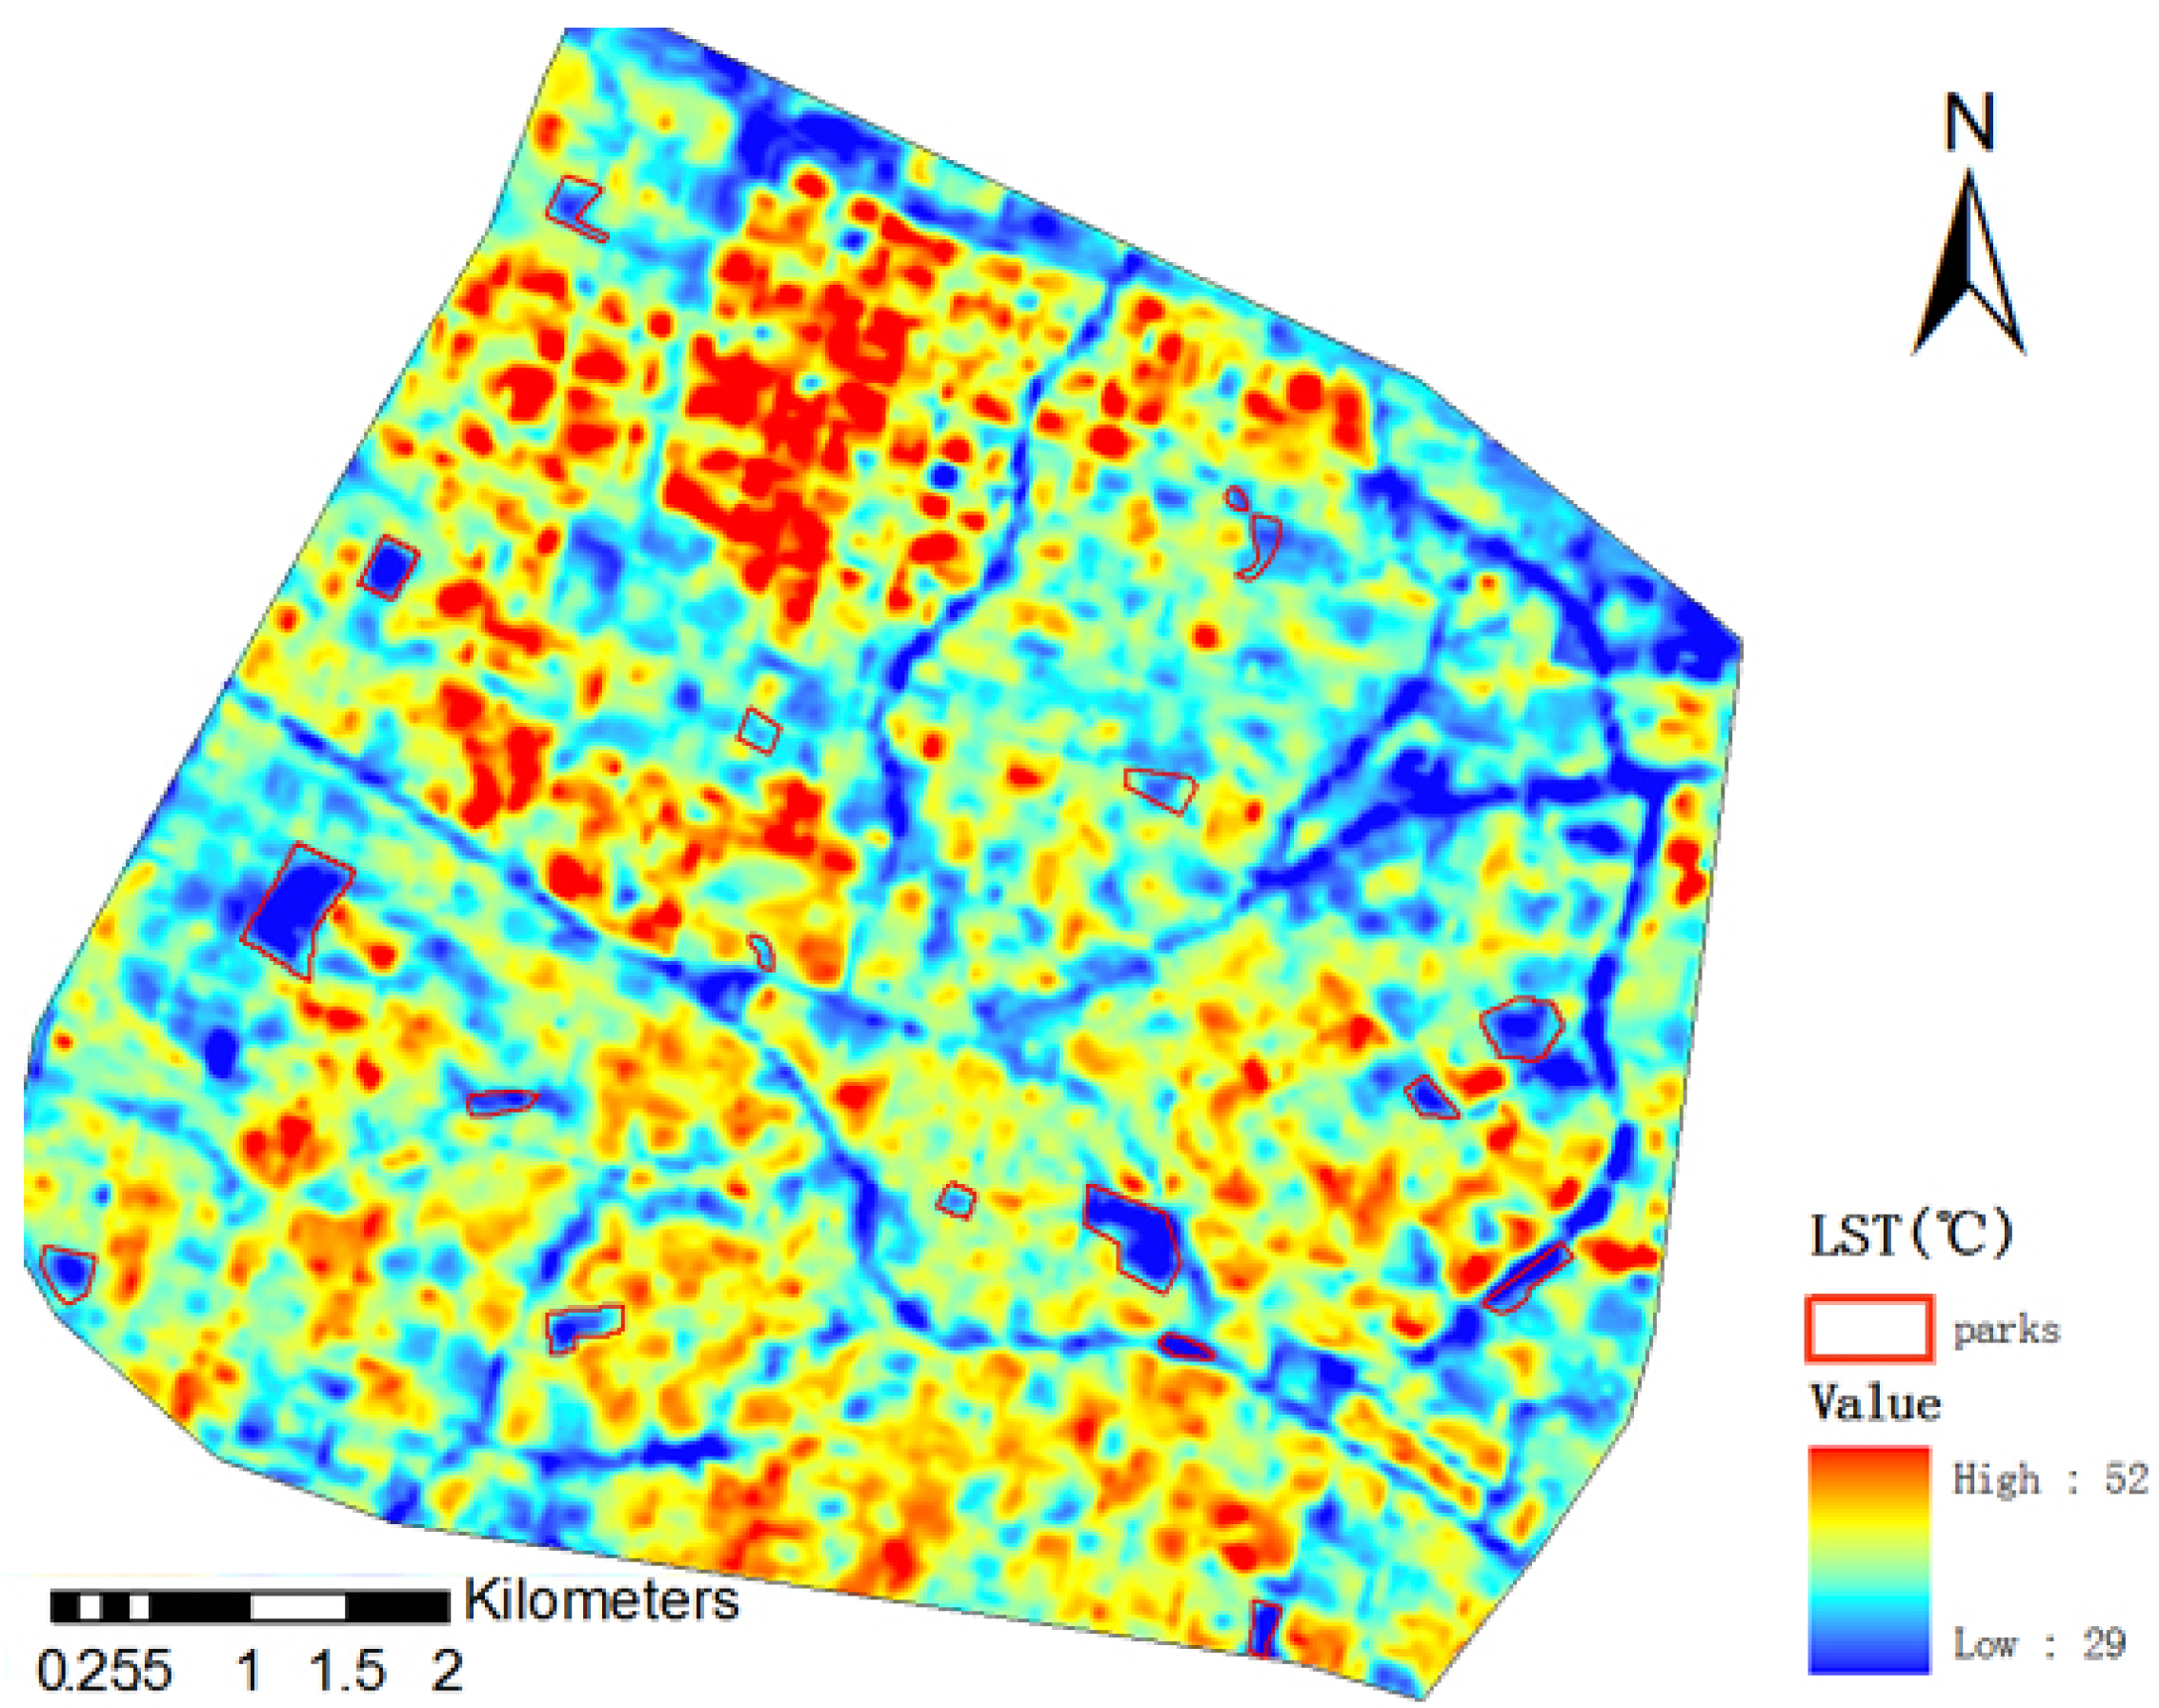
2.2. Radiative Transfer Equation for LST Retrieval from Landsat-8 TIRS
2.3. PCI Indicators
2.4. Plot Investigation of Parks and Data Analysis with i-Tree Eco Model
2.5. Analytical Methods
3. Results
3.1. The LST and Park Composition
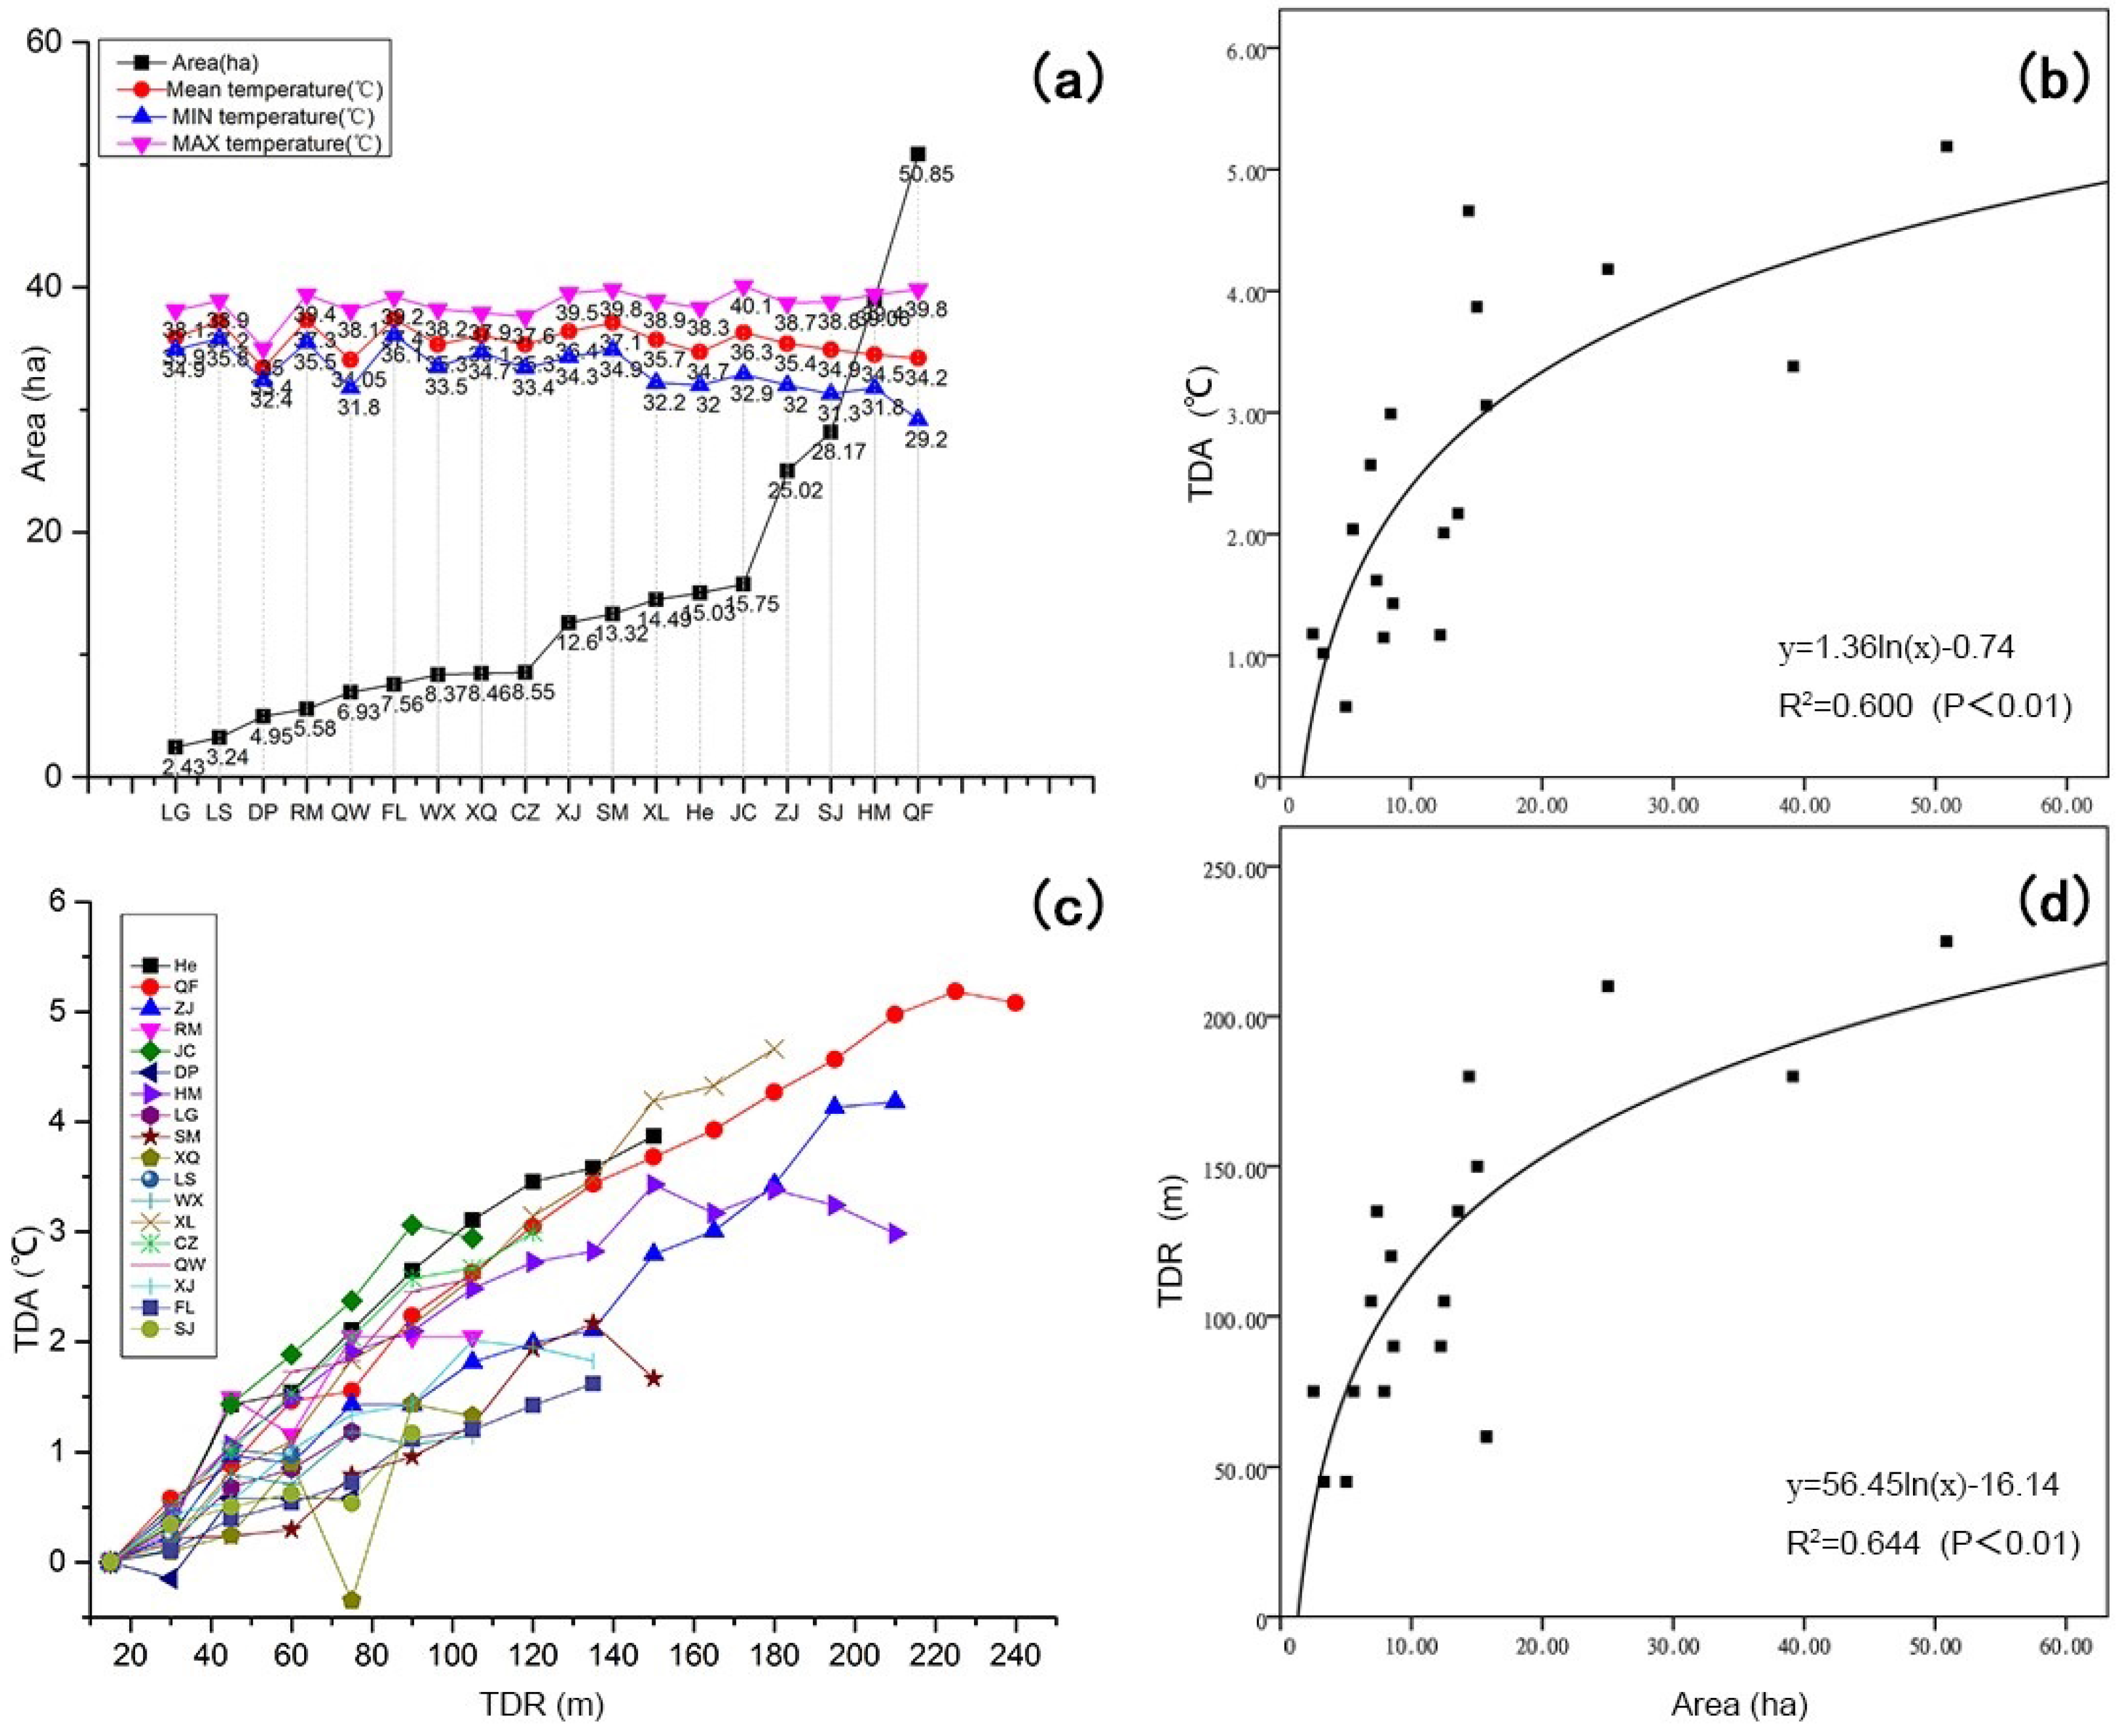
3.2. PCI Development
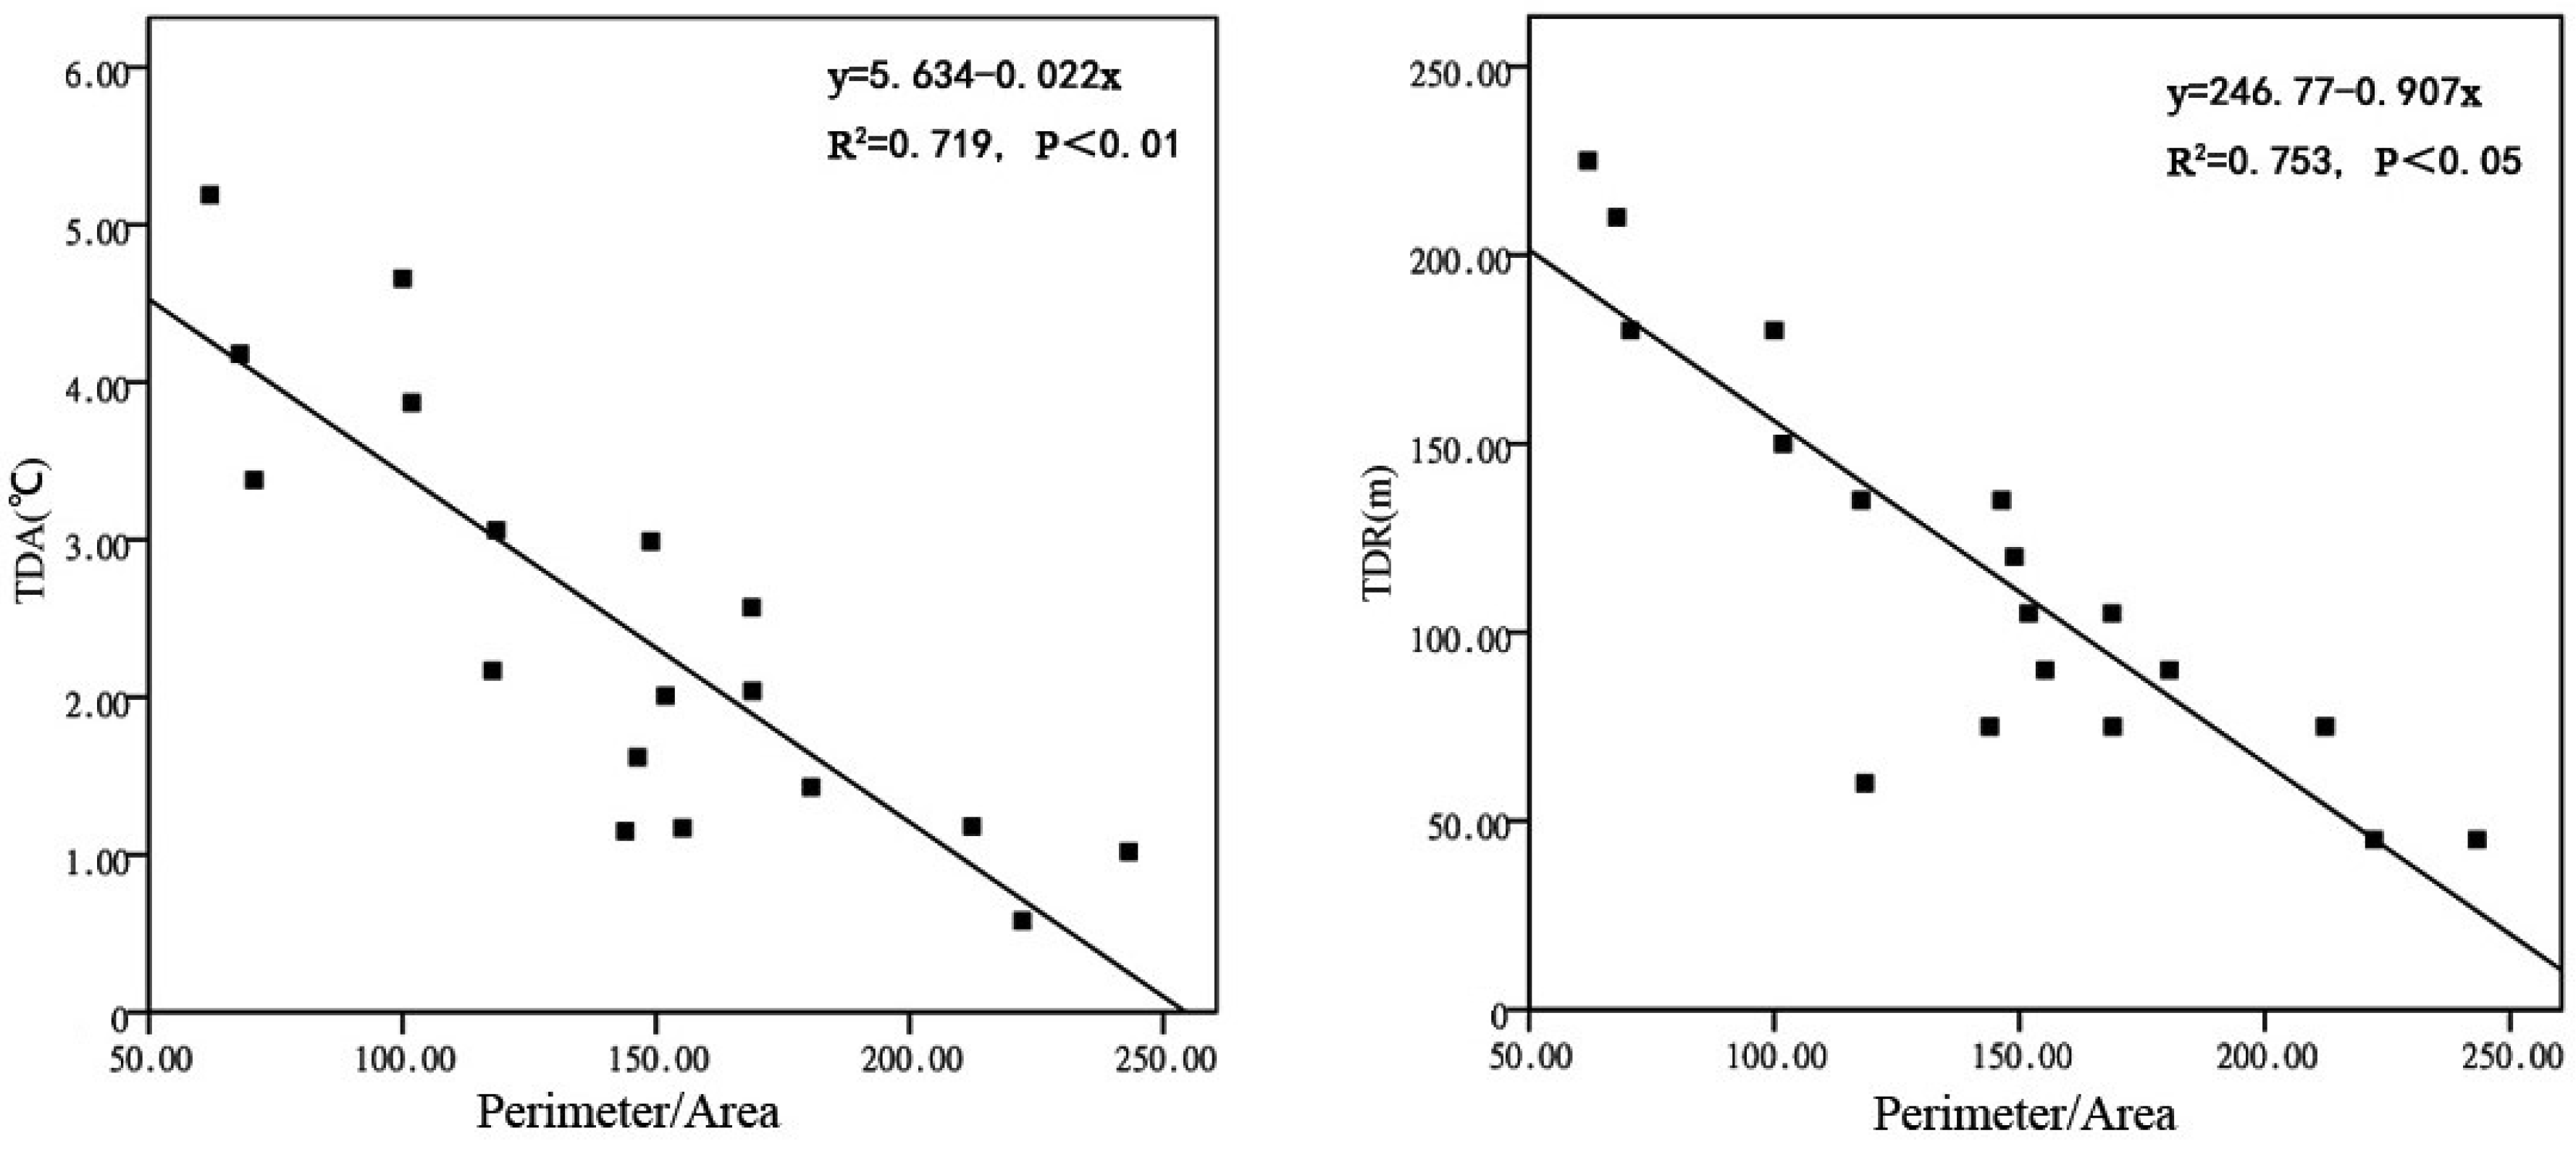
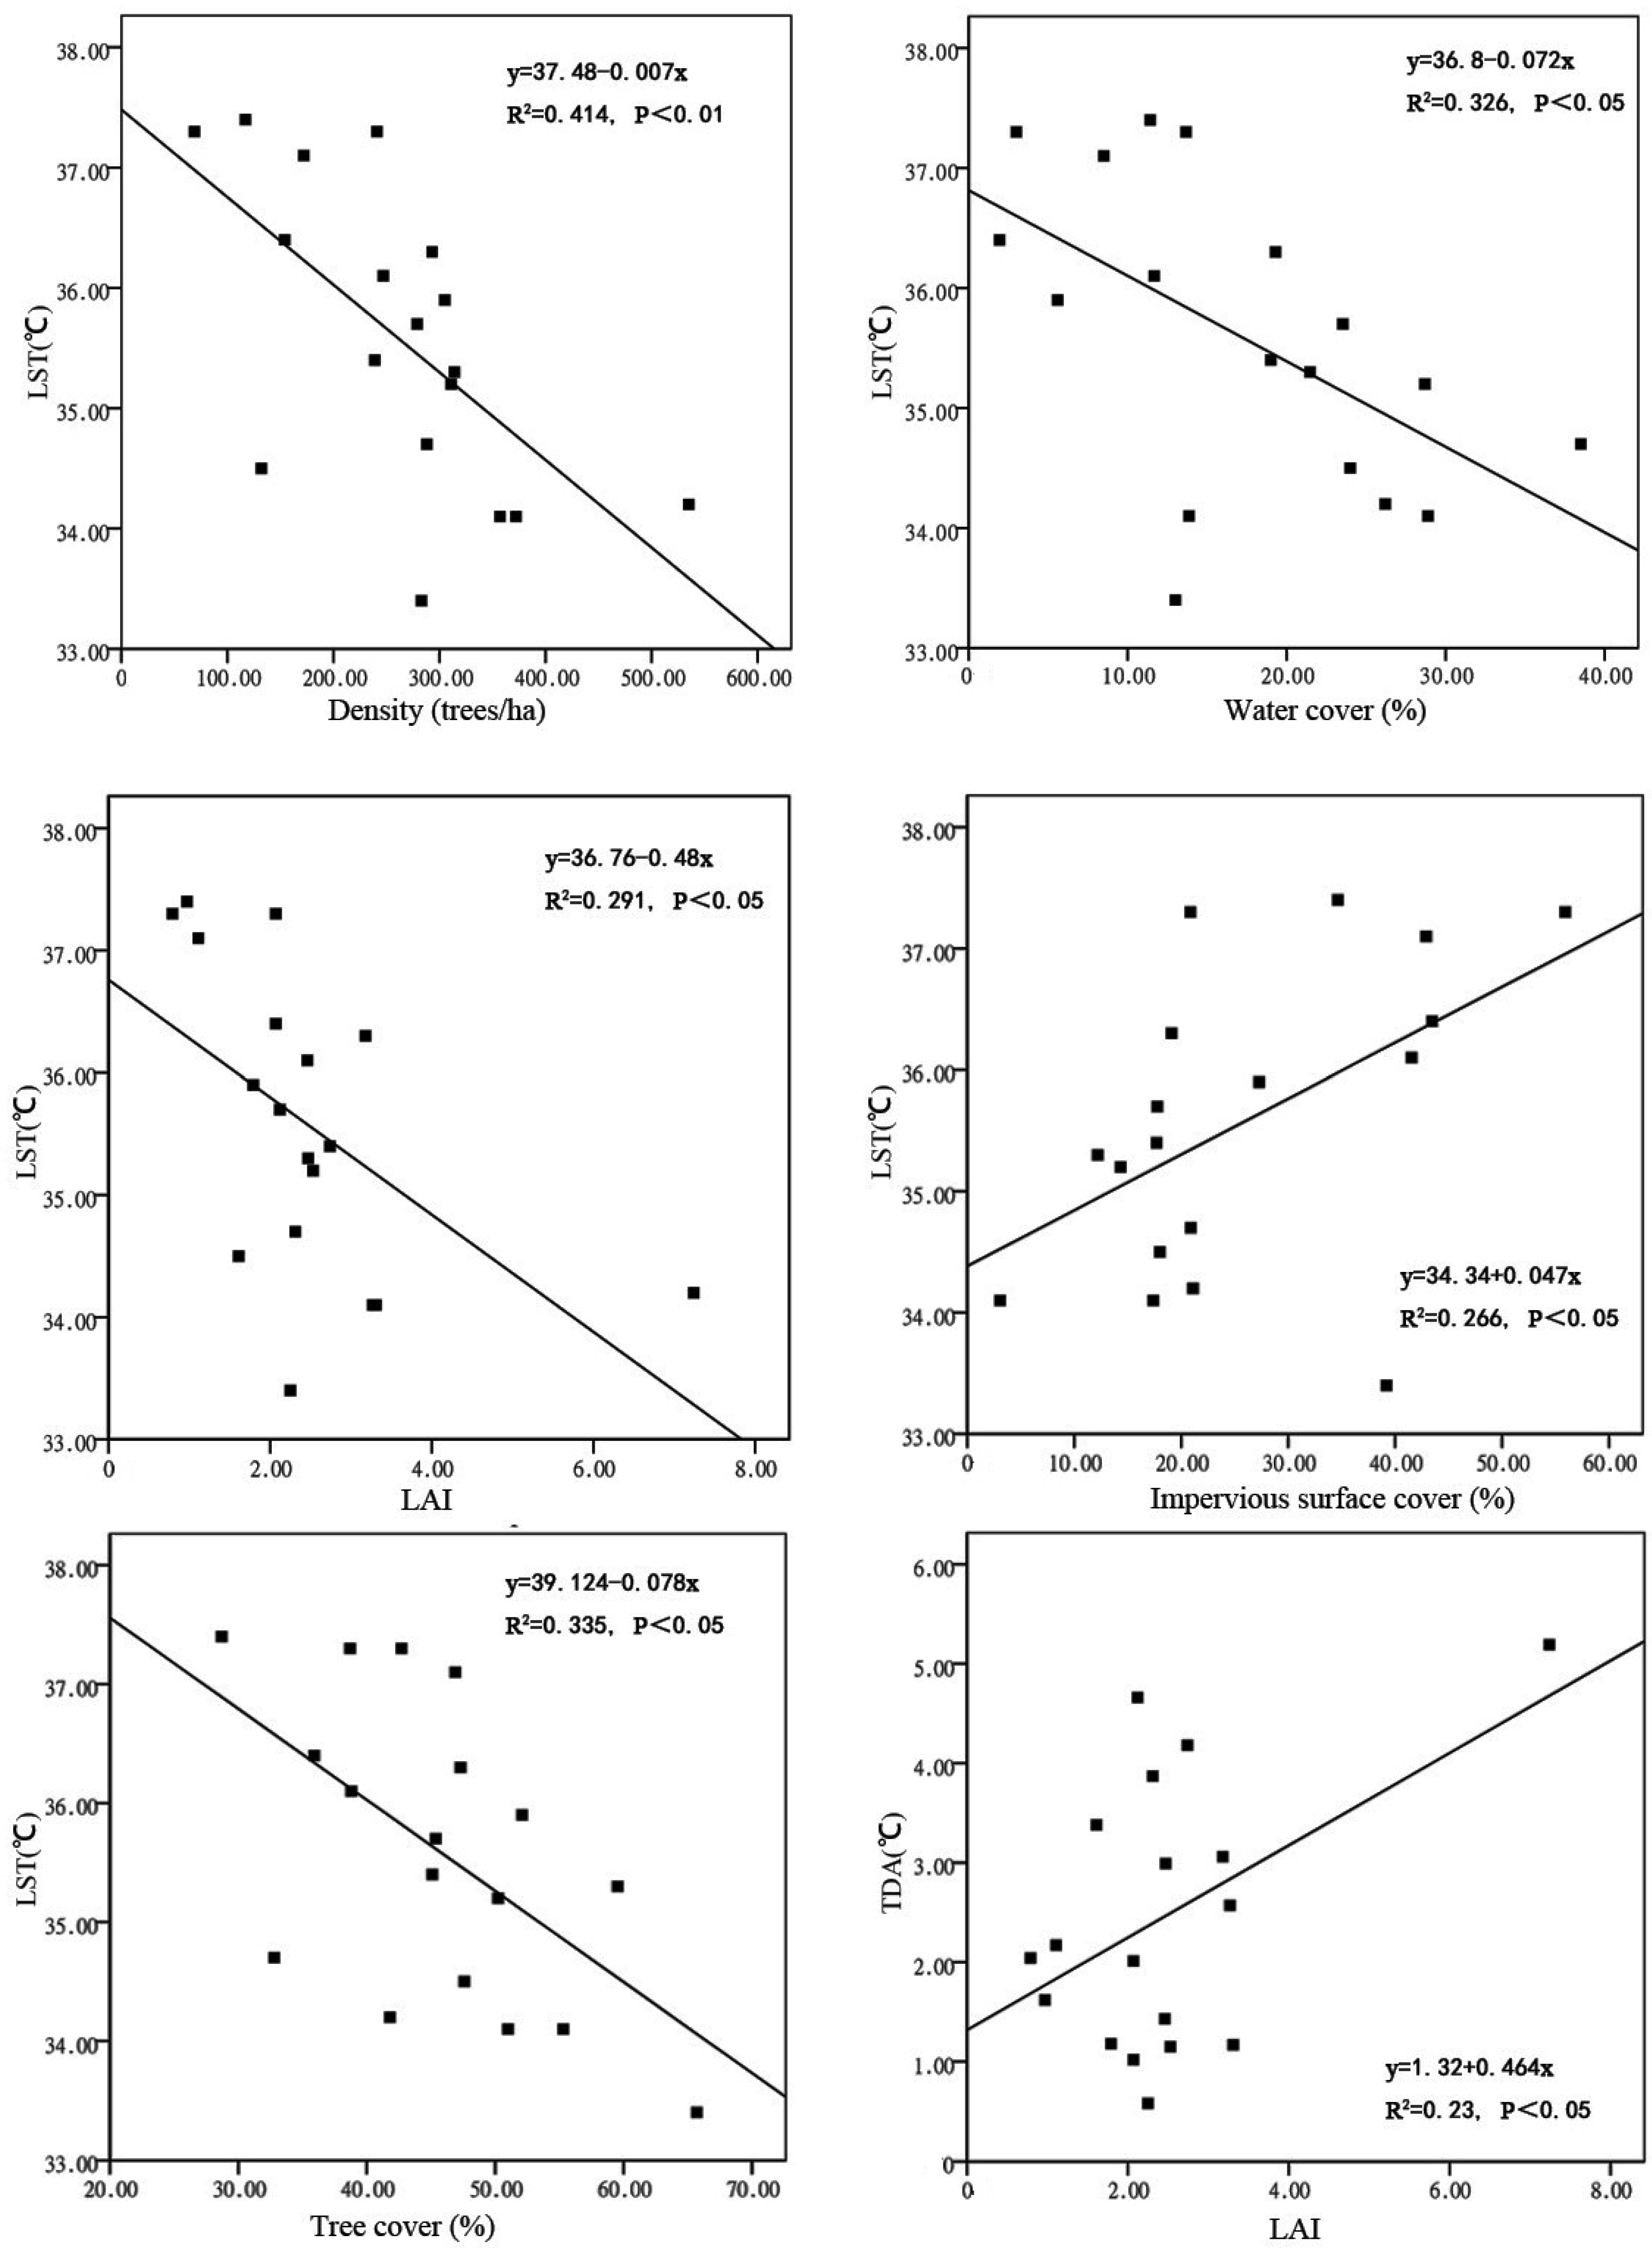
3.3. Relationship between Park Composition and PCI Effect
4. Discussion and Conclusions
4.1. Park Size and PCI
4.2. Park Shape and PCI
4.3. Vegetation Characteristics and PCI
4.4. Park Composition and PCI
4.5. Potential Impact Factors of PCI
4.6. Ways to Improve PCI Effect
Acknowledgments
Author Contributions
Conflicts of Interest
Abbreviations
| LST | Land Surface Temperature; PCI, Park Cool Island |
| LULC | Land Use/Land Cover |
| TDA | Temperature Drop Amplitude |
| TDR | Temperature Drop Range |
| LAI | Leaf Area Index |
| UHI | Urban Heat Island |
| UCI | Urban Cool Island |
| DBH | Diameter at Breast Height |
| RTE | Radiative Transfer Equation |
References
- Lin, W.; Yu, T.; Chang, X.; Wu, W.; Zhang, Y. Calculating cooling extents of green parks using remote sensing: Method and test. Landsc. Urban Plan. 2015, 134, 66–75. [Google Scholar] [CrossRef]
- Giorgio, G.; Ragosta, M.; Telesca, V. Climate Variability and Industrial-Suburban Heat Environment in a Mediterranean Area. Sustainability 2017, 9, 775. [Google Scholar] [CrossRef]
- Seto, K.C.; Güneralp, B.; Hutyra, L.R. Global forecasts of urban expansion to 2030 and direct impacts on biodiversity and carbon pools. Proc. Natl. Acad. Sci. USA 2012, 109, 16083–16088. [Google Scholar] [CrossRef] [PubMed]
- Mushore, T.D.; Odindi, J.; Dube, T.; Matongera, T.N.; Mutanga, O. Remote sensing applications in monitoring urban growth impacts on in-and-out door thermal conditions: A review. Remote Sens. Appl. Soc. Environ. 2017, 8, 83–93. [Google Scholar] [CrossRef]
- Du, H.; Cai, W.; Xu, Y.; Wang, Z.; Wang, Y.; Cai, Y. Quantifying the cool island effects of urban green spaces using remote sensing Data. Urban For. Urban Green. 2017, 27, 24–31. [Google Scholar] [CrossRef]
- Pan, S.; Liu, D.; Wang, Z.; Zhao, Q.; Zou, H.; Hou, Y.; Liu, P.; Xiong, L. Runoff Responses to Climate and Land Use/Cover Changes under Future Scenarios. Water 2017, 9, 475. [Google Scholar] [CrossRef]
- Neiva, H.; da Silva, M.; Cardoso, C. Analysis of Climate Behavior and Land Use in the City of Rio de Janeiro, RJ, Brazil. Climate 2017, 5, 52. [Google Scholar] [CrossRef]
- Cardoso, R.; Dorigon, L.; Teixeira, D.; Amorim, M. Assessment of Urban Heat Islands in Small- and Mid-Sized Cities in Brazil. Climate 2017, 5, 14. [Google Scholar] [CrossRef]
- Santamouris, M.; Haddad, S.; Fiorito, F.; Osmond, P.; Ding, L.; Prasad, D.; Zhai, X.; Wang, R. Urban Heat Island and Overheating Characteristics in Sydney, Australia. An Analysis of Multiyear Measurements. Sustainability 2017, 9, 712. [Google Scholar] [CrossRef]
- Cao, X.; Onishi, A.; Chen, J.; Imura, H. Quantifying the cool island intensity of urban parks using ASTER and IKONOS data. Landsc. Urban Plan. 2010, 96, 224–231. [Google Scholar] [CrossRef]
- Zhang, X.X.; Wu, P.F.; Chen, B. Relationship between vegetation greenness and urban heat island effect in Beijing City of China. Procedia Environ. Sci. 2010, 2, 1438–1450. [Google Scholar] [CrossRef]
- Oliveira, S.; Andrade, H.; Vaz, T. The cooling effect of green spaces as a contribution to the mitigation of urban heat: A case study in Lisbon. Build. Environ. 2011, 46, 2186–2194. [Google Scholar] [CrossRef]
- Gage, E.A.; Cooper, D.J. Urban forest structure and land cover composition effects on land surface temperature in a semi-arid suburban area. Urban For. Urban Green. 2017, 28, 28–35. [Google Scholar] [CrossRef]
- Gage, E.A.; Cooper, D.J. Relationships between landscape pattern metrics, vertical structure and surface urban Heat Island formation in a Colorado suburb. Urban Ecosyst. 2017. [Google Scholar] [CrossRef]
- Hardin, P.J.; Jensen, R.R. The effect of urban leaf area on summertime urban surface kinetic temperatures: A Terre Haute case study. Urban For. Urban Green. 2007, 6, 63–72. [Google Scholar] [CrossRef]
- Buyantuyev, A.; Wu, J. Urban heat islands and landscape heterogeneity: Linking spatiotemporal variations in surface temperatures to land-cover and socioeconomic patterns. Landsc. Ecol. 2010, 25, 17–33. [Google Scholar] [CrossRef]
- Sun, R.; Chen, L. How can urban water bodies be designed for climate adaptation? Landsc. Urban Plan. 2012, 105, 27–33. [Google Scholar] [CrossRef]
- Ren, Z.; He, X.; Zheng, H.; Zhang, D.; Yu, X.; Shen, G.; Guo, R. Estimation of the Relationship between Urban Park Characteristics and Park Cool Island Intensity by Remote Sensing Data and Field Measurement. Forests 2013, 4, 868–886. [Google Scholar] [CrossRef]
- Bowler, D.E.; Buyung-Ali, L.; Knight, T.M.; Pullin, A.S. Urban greening to cool towns and cities: A systematic review of the empirical evidence. Landsc. Urban Plan. 2010, 97, 147–155. [Google Scholar] [CrossRef]
- Lee, S.-H.; Lee, K.-S.; Jin, W.-C.; Song, H.-K. Effect of an urban park on air temperature differences in a central business district area. Landsc. Ecol. Eng. 2009, 5, 183–191. [Google Scholar] [CrossRef]
- Jonsson, P. Vegetation as an urban climate control in the subtropical city of Gaborone, Botswana. Int. J. Climatol. 2004, 24, 1037–1322. [Google Scholar] [CrossRef]
- Onishi, A.; Cao, X.; Ito, T.; Shi, F.; Imura, H. Evaluating the potential for urban heat-island mitigation by greening parking lots. Urban For. Urban Green. 2010, 9, 323–332. [Google Scholar] [CrossRef]
- Sithole, K.; Odindi, J.O. Determination of Urban Thermal Characteristics on an Urban/Rural Land Cover Gradient Using Remotely Sensed Data. S. Afr. J. Geomat. 2015, 4, 384. [Google Scholar] [CrossRef][Green Version]
- Jauregui, E. Influence of a large urban park on temperature and convective precipitation in a tropical city. Energy Build. 1990, 15, 457–463. [Google Scholar] [CrossRef]
- Srivanit, M.; Hokao, K. Evaluating the cooling effects of greening for improving the outdoor thermal environment at an institutional campus in the summer. Build. Environ. 2013, 66, 158–172. [Google Scholar] [CrossRef]
- Shi, Y.; Zhang, Y. Remote sensing retrieval of urban land surface temperature in hot-humid region. Urban Clim. 2017, in press. [Google Scholar] [CrossRef]
- Koc, C.B.; Osmond, P.; Peters, A.; Irger, M. A Methodological Framework to Assess the Thermal Performance of Green Infrastructure Through Airborne Remote Sensing. Procedia Eng. 2017, 180, 1306–1315. [Google Scholar] [CrossRef]
- Jiménez-Muñoz, J.; Sobrino, J.A.; Skokovi´c, D.; Mattar, C.; Cristóbal, J. Land Surface Temperature Retrieval Methods FromLandsat-8 Thermal Infrared Sensor Data. IEEE Geosci. Remote Sens. Lett. 2014, 11, 1840–1843. [Google Scholar] [CrossRef]
- Vlassova, L.; Perez-Cabello, F.; Nieto, H.; Martín, P.; Riaño, D.; de la Riva, J. Assessment of Methods for Land Surface Temperature Retrieval from Landsat-5 TM Images Applicable to Multiscale Tree-Grass Ecosystem Modeling. Remote Sens. 2014, 6, 4345–4368. [Google Scholar] [CrossRef]
- Blasi, M.G.; Liuzzi, G.; Masiello, G.; Serio, C.; Telesca, V. Surface parameters from SEVIRI observations through a Kalman filter approach: Application and evaluation of the scheme in Southern Italy. Tethys J. Weather Clim. West. Mediter. 2016. [Google Scholar] [CrossRef]
- Masiello, G.; Serio, C.; Venafra, S.; DeFeis, I.; Borbas, E.E. Diurnal variation in Sahara desert sand emissivity during the dry season from IASI observations. J. Geophys. Res. Atmos. 2014, 119, 1626–1638. [Google Scholar] [CrossRef]
- Nowak, D.J.; Hoehn, R.E.; Bodine, A.R.; Greenfield, E.J.; O’Neil-Dunne, J. Urban forest structure, ecosystem services and change in Syracuse, NY. Urban Ecosyst. 2013, 19, 1455–1477. [Google Scholar] [CrossRef]
- Statistic, C. National Economic and Social Development Statistics Bulletin of Changzhou in 2016. Available online: http://www.cztjj.gov.cn/html/tjj/2017/OEJQMFCO_0303/13340.html (accessed on 15 November 2017).
- Zheng, J.Y.; Yin, Y.H.; Li, B.Y. A new scheme for climate regionalization in China. Acta Geogr. Sin. 2010, 65, 3–13. (In Chinese) [Google Scholar]
- Sobrino, J.A.; Jiménez-Muñoz, J.C.; Paolini, L. Land surface temperature retrieval from Landsat TM 5. Remote Sens. Environ. 2004, 90, 434–440. [Google Scholar] [CrossRef]
- i-Tree. Available online: http://www.itreetools.org/about.php (accessed on 10 October 2017).
- Xu, H.-L.; Yue, W.-Z. A study on thermal environment effect of urban park landscape. Acta Ecol. Sin. 2008, 28, 1702–1710. (In Chinese) [Google Scholar]
- Yang, F.; Qian, F.; Liu, S. Evaluation of Measurement and Numerical Simulation of Outdoor Thermal Environmental Effect of Planning and Design Strategies of High-rise Residential Quarters. Build. Sci. 2013, 29, 28–34. [Google Scholar]
- Chang, C.-R.; Li, M.-H.; Chang, S.-D. A preliminary study on the local cool-island intensity of Taipei city parks. Landsc. Urban Plan. 2007, 80, 386–395. [Google Scholar] [CrossRef]
- Zhao, W.H. Common street tree diseases and pests prevention and control technology in Changzhou. Chin. Hortic. Abstr. 2014, 4, 123–124. (In Chinese) [Google Scholar]
- Ping, G.; Ling-Qin, Z.; Zhong, X. Biological Characteristics and Control of Periphyllus Koelreuteria (Takahashi) in Shanghai District. J. Shanghai Jiaotong Univ. Agric. Sci. 2004, 22, 389–392. (In Chinese) [Google Scholar]
- Guan, Y.; Zhang, X.; Zheng, F.; Wang, B. Trends and variability of daily temperature extremes during 1960–2012 in the Yangtze River Basin, China. Glob. Planet. Chang. 2015, 124, 79–94. [Google Scholar] [CrossRef]


| Parks | LST (°C) | TDA (°C) | TDR (m) | Area (ha) | LAI | Height (m) | DBH (cm) | Density (Trees/ha) | Tree Cover (%) | Water Cover (%) | Green Land (%) | Impervious Surface Cover (%) | Perimeter/Area (m/ha) |
|---|---|---|---|---|---|---|---|---|---|---|---|---|---|
| He | 34.7 | 3.87 | 150 | 15.03 | 2.31 | 7.52 | 17.4 | 288 | 32.8 | 38.5 | 40.6 | 20.9 | 101.80 |
| QF | 34.2 | 5.19 | 225 | 50.85 | 7.24 | 6.31 | 16.78 | 535 | 41.8 | 26.2 | 52.7 | 21.1 | 62.08 |
| ZJ | 35.4 | 4.18 | 210 | 25.02 | 2.74 | 7.73 | 19 | 239 | 45.1 | 19 | 63.3 | 17.7 | 67.95 |
| RM | 37.3 | 2.04 | 75 | 5.58 | 0.79 | 8.84 | 31.4 | 69 | 38.7 | 3 | 41.1 | 55.9 | 169.00 |
| DP | 33.4 | 0.58 | 45 | 5.04 | 2.25 | 7.6 | 19.9 | 283 | 65.7 | 13 | 47.8 | 39.2 | 222.22 |
| HM | 34.5 | 3.38 | 180 | 39.15 | 1.61 | 9.19 | 26.46 | 132 | 47.6 | 24 | 58 | 18 | 70.75 |
| LG | 35.9 | 1.18 | 75 | 2.52 | 1.79 | 8.95 | 23.7 | 305 | 52.1 | 5.6 | 67.1 | 27.3 | 212.30 |
| SMGC | 37.1 | 2.17 | 135 | 13.59 | 1.11 | 7.33 | 24.67 | 172 | 46.9 | 8.5 | 48.6 | 42.9 | 117.73 |
| XQ | 36.1 | 1.43 | 90 | 8.64 | 2.46 | 8.75 | 22.03 | 247 | 38.8 | 11.67 | 46.79 | 41.54 | 180.56 |
| LS | 37.3 | 1.02 | 45 | 3.33 | 2.07 | 7.58 | 27.08 | 241 | 58.7 | 13.67 | 65.47 | 20.86 | 243.24 |
| WX | 35.2 | 1.15 | 75 | 7.92 | 2.53 | 8.23 | 26.37 | 311 | 50.23 | 28.69 | 56.96 | 14.35 | 143.94 |
| XL | 35.7 | 4.66 | 180 | 14.4 | 2.12 | 8.06 | 27.74 | 279 | 52.38 | 23.53 | 58.7 | 17.77 | 100.00 |
| CZ | 35.3 | 2.99 | 120 | 8.46 | 2.47 | 7.96 | 28.32 | 314 | 59.54 | 21.47 | 66.33 | 12.20 | 148.94 |
| XJ | 36.4 | 2.01 | 105 | 12.51 | 2.07 | 7.67 | 19.35 | 154 | 35.9 | 1.94 | 54.59 | 43.46 | 151.88 |
| FL | 37.4 | 1.62 | 135 | 7.38 | 0.97 | 7.05 | 25.24 | 117 | 28.7 | 11.42 | 53.94 | 34.65 | 146.34 |
| SJ | 34.1 | 1.17 | 90 | 12.24 | 3.31 | 8.32 | 27.03 | 372 | 51 | 28.89 | 68.03 | 3.08 | 155.23 |
| QW | 34.1 | 2.57 | 105 | 6.93 | 3.27 | 9.05 | 25.54 | 357 | 55.3 | 13.86 | 68.75 | 17.39 | 168.83 |
| JC | 36.3 | 3.06 | 60 | 15.75 | 3.06 | 7.76 | 28.08 | 293 | 47.3 | 19.3 | 61.6 | 19.1 | 118.48 |
| PCI | LAI | Height | DBH | Density | Tree Cover | Water Cover | Green Cover | Impervious Surface Cover | Perimeter/Area |
|---|---|---|---|---|---|---|---|---|---|
| LST | −0.540 * | −0.092 | 0.380 | −0.636 ** | −0.568 * | −0.566 * | −0.155 | 0.509 * | 0.199 |
| TDA | 0.477 * | −0.291 | −0.265 | 0.293 | −0.212 | 0.456 | −0.043 | −0.299 | −0.848 ** |
| TDR | 0.370 | −0.316 | −0.403 | 0.169 | −0.289 | 0.383 | −0.063 | −0.234 | −0.868 ** |
© 2018 by the authors. Licensee MDPI, Basel, Switzerland. This article is an open access article distributed under the terms and conditions of the Creative Commons Attribution (CC BY) license (http://creativecommons.org/licenses/by/4.0/).
Share and Cite
Wang, X.; Cheng, H.; Xi, J.; Yang, G.; Zhao, Y. Relationship between Park Composition, Vegetation Characteristics and Cool Island Effect. Sustainability 2018, 10, 587. https://doi.org/10.3390/su10030587
Wang X, Cheng H, Xi J, Yang G, Zhao Y. Relationship between Park Composition, Vegetation Characteristics and Cool Island Effect. Sustainability. 2018; 10(3):587. https://doi.org/10.3390/su10030587
Chicago/Turabian StyleWang, Xinjun, Haoming Cheng, Juan Xi, Guoying Yang, and Yanwen Zhao. 2018. "Relationship between Park Composition, Vegetation Characteristics and Cool Island Effect" Sustainability 10, no. 3: 587. https://doi.org/10.3390/su10030587
APA StyleWang, X., Cheng, H., Xi, J., Yang, G., & Zhao, Y. (2018). Relationship between Park Composition, Vegetation Characteristics and Cool Island Effect. Sustainability, 10(3), 587. https://doi.org/10.3390/su10030587