Article

The Macroeconomic Determinants of International Casino Travel: Evidence from South Korea’s Top Four Inbound Markets

1
Department of Economics, Inha University, 404 Building 6, Incheon 22201, Korea
2
College of Business Administration, Inha University, 421B Building 6, Incheon 22201, Korea
*
Author to whom correspondence should be addressed.
Sustainability 2018, 10(2), 554; https://doi.org/10.3390/su10020554
Submission received: 4 January 2018 / Revised: 10 February 2018 / Accepted: 16 February 2018 / Published: 22 February 2018
(This article belongs to the Section Tourism, Culture, and Heritage)

Abstract

:
This study investigates the macroeconomic determinants behind the number of foreign visitors to Korean casinos arriving from major source countries, namely Japan, Mainland China, Hong Kong SAR and Taiwan. Using monthly data from 2006 to 2016, we utilized a Structural Vector Autoregression (SVAR) model to investigate the dynamic effects of macroeconomic factors on the number of casino visitors. Estimation results supported the conclusion that visitors from Japan and Mainland China—who account for approximately three quarters of the total number of foreign casino visitors—were affected by macroeconomic or financial indicators such as changes in oil prices, exports and exchange rates (Japan), exports and short-term interest rates (Mainland China). In contrast, visitors from Hong Kong SAR did not seem to be influenced by any of these factors. We also found that the MERS (Middle East Respiratory Syndrome) outbreak in Korea in 2015 had a significant adverse effect on casino visitors from all regions. Implications and suggestions for future studies are provided along with the results of this study.

1. Introduction

After decades as a fairly regional phenomenon, the casino industry has experienced intense internationalized competition over the last thirty years [1]. In fact, for a single five-year period starting in 2010, casino revenues throughout the Asia-Pacific region increased at an average of nearly 20% per annum [2]. Accordingly, national governments, tourism authorities and corporations are turning more and more frequently to the casino sector to spur tourism—and overall economic—growth [3]. The casino market is one of the most substantial income generators within the tourism industry, with casino developments having made important contributions to the tourism industry and broad economic revitalization in localities. Korea is a prime example of a modern economy actively supporting casino gaming to grow both its touristic and non-touristic sectors, with casinos bringing not only tourists but also new jobs, new taxation, new social capital, new foreign funds and new entrepreneurial opportunities to the country [3]. For Korea, casino developments now stand as a highly profitable sector of the wider economy [4]. This strong casino market has proven to be very effective at encouraging foreign tourists to spend more money and extend their periods of stay. Yet even as this opportunity for expansion beckons, hospitality and tourism industry scholars point out that consistent sustained growth in tourism is all but impossible while intermittent fall-offs are all but inevitable, the result of a host of external factors outside of any casino operator’s control [5].
Grasping the ways in which international macroeconomic factors underpin the ebb and flow of tourism behaviors and decision making is therefore essential and modern social science provides the econometric and statistical models to gain this understanding. It is well established that the macro-environment strongly influences consumer behavior and existing studies have done a thorough job developing the theoretical background behind the economic-factor/consumer-behavior relationship [6]. This background explains how critical tourism-success variables such as flow of visitors, visitor spending and tourism activity generally can be affected by changes in macroeconomic factors. A comprehensive study of macroeconomic indicators can lead to a better understanding of the forces that drive decisions in a country of origin and improve the forecasting of tourism demand in external destinations. Demand for a vacation destination also may be affected by special events. While the relevant studies examine both the economic and non-economic factors of tourism demand [7], none deny that economics—especially macroeconomics—are key in forecasting touristic economic behavior.
There are a number of studies that focus on the impact of economics on tourism demand, employing both theoretical and methodological designs to isolate the drivers of tourism demand. Several point to macroeconomic factors and have demonstrated that both the money supply and interest rates influence tourist decision making about travel [8]. A few scholars have investigated the ways in which gambling activities are affected by non-macroeconomic events [9,10] but there is little understanding about how macroeconomics impact casino-visitor behavior. Only very few studies have investigated whether and how gambling activities are influenced by events. In a way that echoes the industry’s history, casino gambling in Western nations or Macao has received thorough attention in the scholarly press, while a clear empirical picture of the more recently emerged Asian sector (i.e., South Korea) has much more rarely been studied.
This study aims to fill this gap in the literature by ascertaining precisely which macroeconomic forces influence the number of inbound casino visitors. To answer this question, the current research analyzes the influence of six major macroeconomic factors (oil prices, exchange rates, stock price, exports, M2 (M2 is a monetary indicator that includes cash, checkable deposits and savings deposits) and interest rates) on the number of visitors from South Korea’s four main sources of international tourism, namely Mainland China, Taiwan, Hong Kong SAR and Japan, to foreigner-only casinos in Korea. After reviewing the previous tourism-economics literature, e.g., [8,11], we selected six key major macro-economic variables employed commonly in previous tourism studies. Our focused literature review on tourism demand led to the identification of likely determinants of casino/gambling activities that need be discussed in relation to casino-visitor numbers. In addition to the key macroeconomic variables, this study also targets the effects of some recent non-macroeconomic events to present a more comprehensive understanding of how the international casino business fluctuates. Thus, this study illustrates the importance of identifying the key factors that influence the number of visitors in order to effectively understand changes and trends in the casino market and create competitive advantages for the casino industry.

2. Literature Review

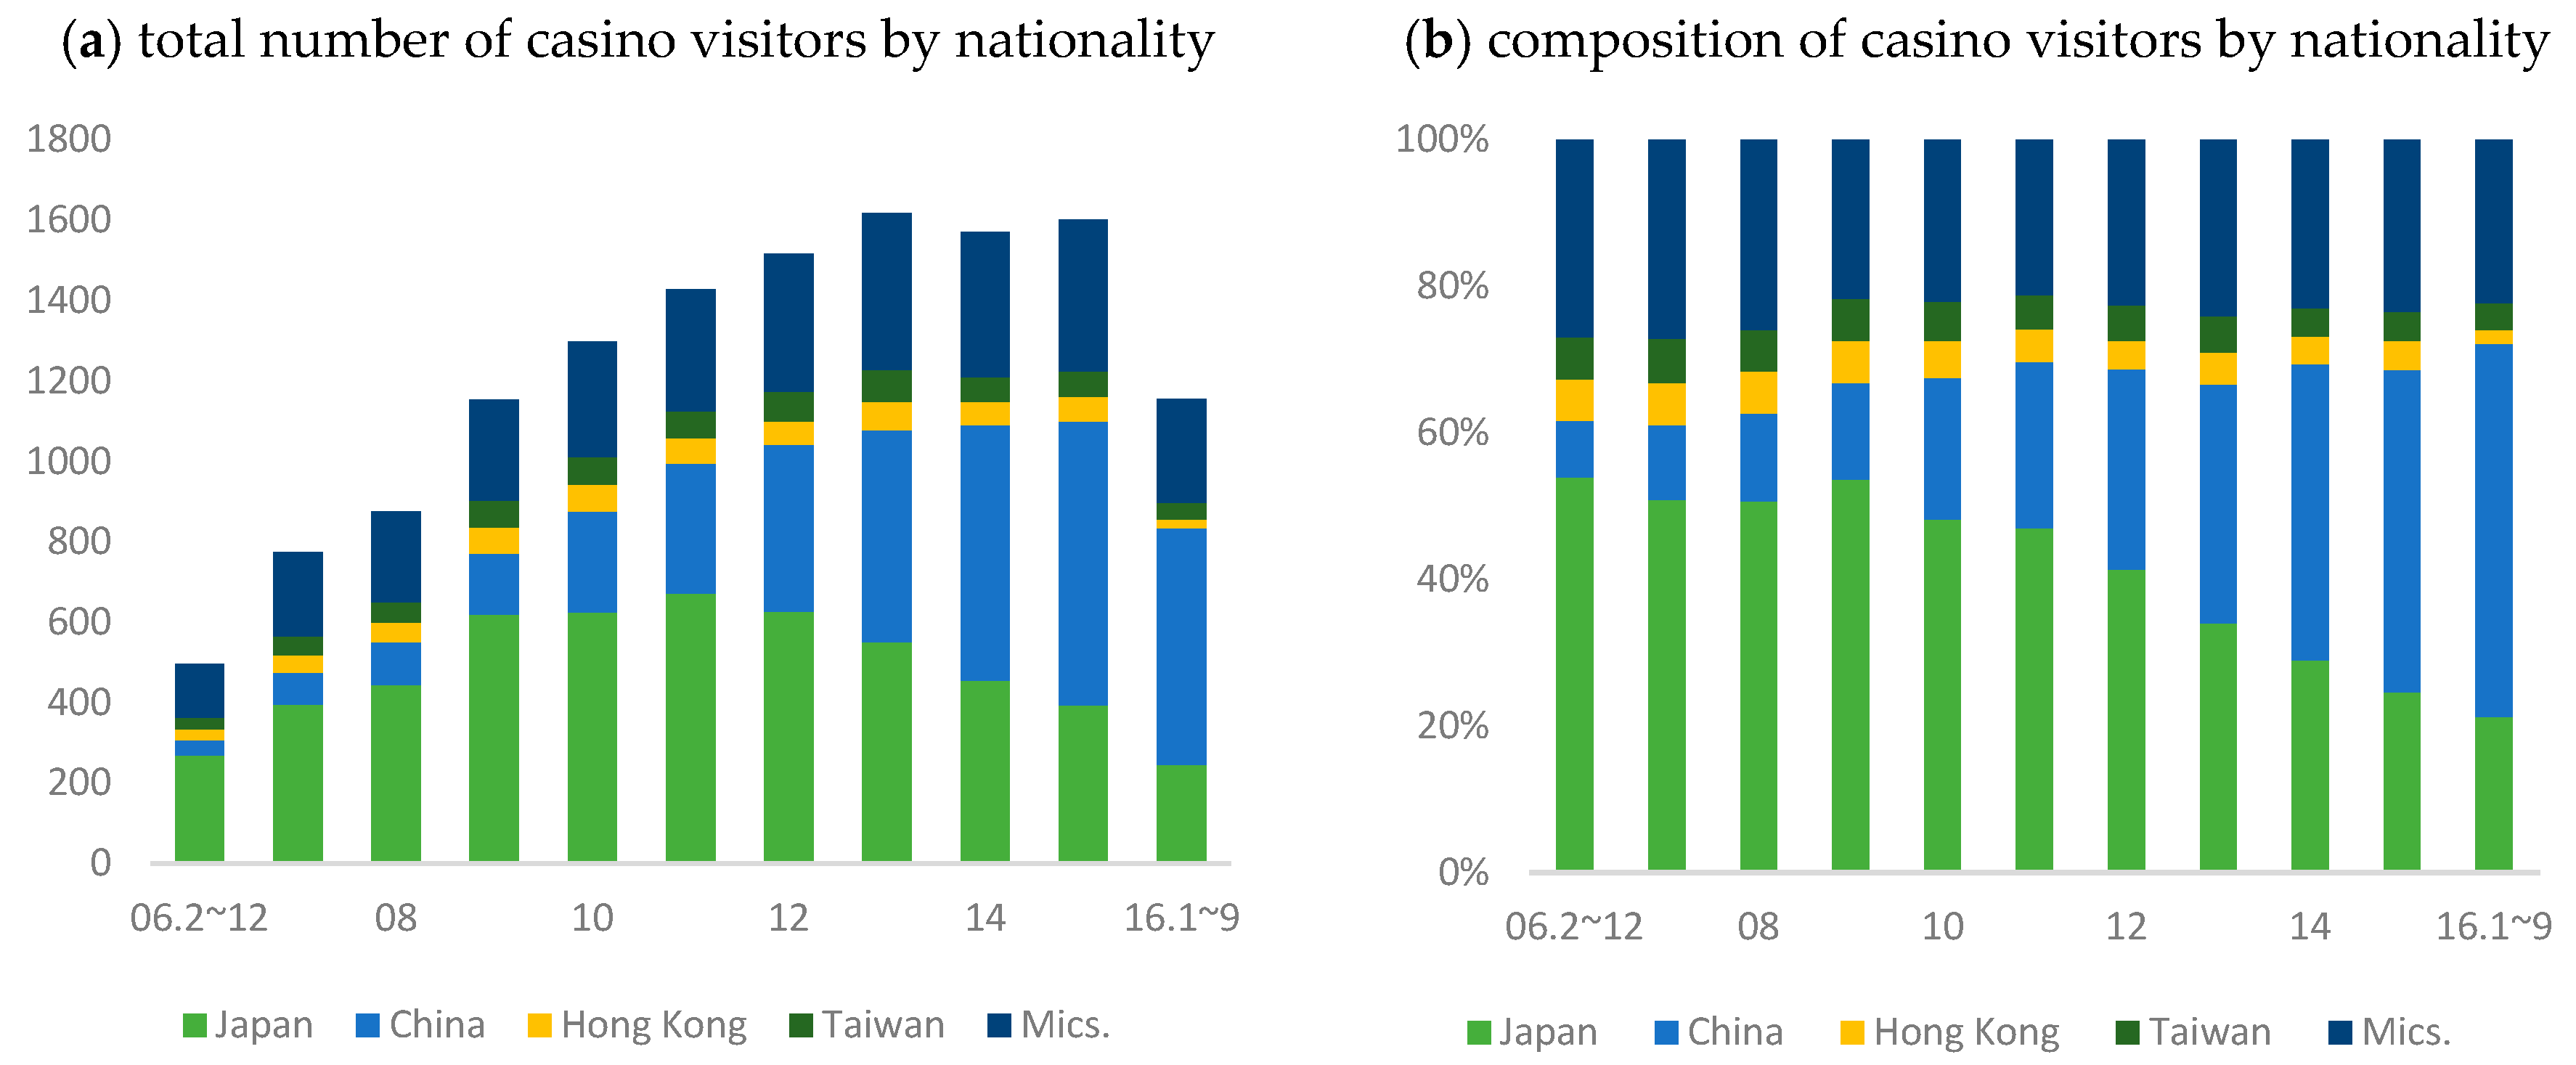
2.1. The South Korean Casino Industry

For more than a year, the Korean casino industry has been on the rise [12]. The upwelling in demand has been driven by both domestic and international demand increases [13]. Five years ago, the Korean gaming sector posted revenues of $1.215 billion (USD) from more than three million gamblers [14]. Foreign arrivals have been largely responsible for this success. Korean law divides its casinos into open-access and foreigner-only categories and it is the latter casinos that saw the strongest growth: gamblers utilizing foreigner-only casinos grew from a mere 627,000 in 2001 to 2.96 million in 2014 [15]. Gamblers from China and Japan were foremost among the foreign gamblers that drove success in South Korean casinos [16]. This casino boom coincides with a period in which South Korea has emerged as one of the premier destinations in Asia. South Korean’s casino sector had a total of 17 casinos in 2016 (sixteen for foreigners only and one allowing access by visitors and Korean citizens). Aware of this fact, the Korean government is currently expanding the casino market by adding to Korea’s existing seventeen casinos while simultaneously developing the tourism industry through the investment of foreign capital, with special focus being paid to casino expansion in the Incheon region.

2.2. Review of the Casino Literature

While many aspects of casino gambling have been investigated, the literature on the relationship between it and macroeconomic growth is scant [17]. Instead, researchers have frequently expressed their concerns regarding the profitability and effectiveness of marketing and promotion efforts within the industry. Other fertile ground explored within the casino context has been the question of human impacts, with many researchers explicating the perspective of the customer (e.g., attitudes, satisfaction and loyalty), the employee (e.g., casino dealers’ job satisfaction), or the local. Casino customers have been studied for their behaviors and motivations and have even been profiled extensively [18]. Researchers, utilizing surveys and interviews, have analyzed residents’ negative or positive perceptions of casino development in the US and Macau [19], while other papers have similarly exposed locals’ experiences following the intense gaming growth in Macau and Singapore [20]. Casino gaming’s effects on the social, environmental and economic milieus of casino-developing areas have also been studied with interesting results [21]. Some studies have focused on gambling addiction and others have targeted demographic analyses, showing the differences among gamblers by nation of origin [10].
In the setting of a Korean casino, scholars focusing on Korea have segmented gamblers at Korean casinos by demographic characteristics and the psychographic variable of motive [22]. Kim et al. [23] focused on the international inbound market by noting the demographic and socioeconomic differences between Chinese casino-bound and non-casino vacationers coming into Korea. Kim and Kim [10] examined the determinants of casino revenues and highlighted the impacts of customer types and foreign exchange rates. Lee and colleagues [22] conducted a study at Kangwon Land Casino, which is the only Korean casino out of seventeen in which Korean citizens are permitted to gamble. However, these studies have overlooked the effects of macroeconomic factors on the number of casino visitors.

2.3. Determinants of Tourism Demand

The link between consumer behavior and economic variables rests on a theoretical basis in the existing literature [6]. This exploration goes beyond consumer behavior to examine how economic indicators also predict rates of tourism development itself [24], an extension of the long tradition of research into the determinants of tourism flows. There is a growing body of research that explores how macroeconomic conditions influence tourist behavior and tourism development. The money supply, interest rates and other factors at play in the macroeconomic environment drive tourist decision making [8]. The literature considers many variables, such as real exchange rate, exports, events (e.g., financial crises and natural disasters) as the determinants of inbound tourism. The high degree to which economic conditions influence tourism demand—in aspects such as tourism receipts, intended lengths of stay, expenditures, tourist arrivals, travel willingness and tourist destination choice—has been firmly established empirically.
The tourism literature suggests that dummy variables can be used to capture the influence of one-off socio-economic events, such as when Song and colleagues [25] reported the quantification of external shocks on tourism demand. Non-macroeconomic forces, such as the outbreak of Severe Acute Respiratory Syndrome (SARS), the swine flu pandemic, the advent of mega sporting events and the Asian financial crisis all significantly affected hotel stock returns. The tourism and hospitality literature has shown great interest in how human-driven crises, such as political upheavals and financial meltdowns, affect tourism receipts [26]. Researchers are currently examining how, as the North Korean regime has accelerated its offensive-weapons testing and increased its bellicose rhetoric, Pyeongyang has emerged as a growing threat to inbound tourism to South Korea [26].
Yet South Korea has been a major international hub for decades and shows no signs of surrendering that role. Given South Korea’s growing status as an international destination, prior researchers have made efforts to examine the determinants, including economic determinants, underpinning inbound tourism for South Korea. For example, Lee [27] found income levels, transportation fees and other costs and exchange rates to predict tourist arrivals into Korea. In a complementary but inverse study, Seo et al. [28] looked at how a variety of determinants impacted Korean outbound tourism levels to Korea’s offshore vacation hotspot and three international destinations throughout Asia.

2.4. Variables in the Literature

The money stock, or total value of monetary assets present in an economy at a particular time, has an intricate relationship with economic growth, consumer spending, and, ultimately, tourism demand [29]. The higher the level of money stock in a country, the more disposable income its people have and, thus, the more economic activity they can create [30]. Nonetheless, money stock has received limited attention in previous studies within the tourism context [31], despite the fact that money stock in tourists’ origin countries must be considered a determinant of tourism demand.
In the tourism-research literature, exchange rate is a common variable that has been shown to affect inbound tourism demand. It is consistently used in modeling tourism demand and has been found to have explanatory power in the determination of tourism flows for both outbound and inbound countries [32]. The exchange rate has empirically been found to be an explanatory variable determining rises and falls in the number of inbound tourist arrivals [7] but in another study, changes in real exchange rates were shown to have mixed effects on tourism demand [33].
International travel is fuel-intensive and energy prices are an important factor not only in the tourism industry but also in the wide variety of industries in which it is a crucial component of production and transportation [34]. Accordingly, researchers have naturally been interested in how the price of oil affects demand in the tourism and hospitality industry, resulting in a thoroughgoing model that incorporates oil prices, tourist spending and consumption of travel activities. Oil prices have been clearly identified as one macroeconomic factor affecting consumption generally, with still greater impact inside the tourism and hospitality sphere [35]. The connection between energy prices (gasoline, airplane fuel, etc.) and travel demand is so strong that even small changes to prices paid for oil can result in major shifts in consumptive behavior associated with hospitality-related products and services [36]. There is an inverse relationship between oil prices and expenditures on hospitality products and tourism such as visitor spending in restaurants, admissions to attractions and events, entertainment spending and the number of activities pursued by visitors [37]. However, the impacts of rising oil prices are not necessarily negative and have the potential to be positive or negative for the tourism industry [38].
Previous studies [39] have investigated the connection between international trade and international tourism flows; they have demonstrated that trade is indeed linked to tourism. These findings are in line with prior findings that exports accord with tourist arrivals [40]. Furthermore, interest rates are determined within domestic or international markets. The factors influencing the willingness of tourists to engage in tourist activities include these interest rates [25]. The literature puts a great emphasis on the relationship between macroeconomic variables and stock prices [41]. A higher stock price is known to lead to an increase in the number of participants in tourism activities [42]. In keeping with this background, our focused literature review on tourism demand leads to the identification of interest rates as a possible determinant of the number of casino visitors traveling into Korea.
However, prior studies have not systematically examined the effects of macroeconomic determinants on the number of casino visitors. To fill this gap in the existing literature, in keeping with this background, the current study adopts the major macroeconomic factors (oil prices, exchange rates, stock price, exports, M2 and interest rates) as possible determinants of the number of casino visitors traveling into Korea. The variables in our model are commonly used in the literature. This study also applies previously validated methodology, adopting dummy variables to test the effects of idiosyncratic socio-economic events on tourism demand [43].

3. Methodology and Data

3.1. Model

Vector Autoregression (VAR) is an econometric model that captures linear dynamic interaction among variables of interest. This method has been widely used in the macroeconomics and finance literature since Sims [44] famously demonstrated its empirical usefulness. There are two key elements in VAR: a vector of endogenous dependent variables and their lagged values as explanatory variables. Typically, a VAR (p) model in a reduced form is expressed as below:
Y t = i = 1 p A i Y t i + B X t +   ε t ,       ε t   ~   ( 0 ,   Σ ) ,
where Yt is a vector of endogenous variables, Yt−i is its lagged value, p is the number of lags included as regressor, Xt is a vector of exogenous variables, εt is a vector of error terms (not necessarily uncorrelated with each other) and Ai and B are coefficient matrices. One of the biggest advantages in the VAR approach is that one can isolate the instantaneous or dynamic effects of a “shock (εt)” in one variable on other variables. However, it can be problematic to define such shocks from the above reduced-form VAR, because shocks are likely to be contemporaneously correlated. Moreover, there can be an infinite number of such correlation structures, because one can find an infinite number of linear transformations of Equation (1) that are still consistent with the original reduced form VAR, as in Equation (2) below:
C Y t = C i = 1 p A i Y t i + C B X t +   ε t ,
Structural Vector Autoregression (SVAR) imposes restrictions in the VAR structure to identify the appropriate C matrix. Those restrictions generally come from underlying economic theory concerning the endogenous variables. In this study, we employ short-run restriction using Choleski decomposition, which is a popular method for the identification of SVAR (For more detailed theories about and examples of SVAR, see [45] and Hamilton [46]). In doing so, we assume C to be lower triangular. Because C defines the contemporaneous relationship among variables included in Yt, its lower-triangular structure implies that a variable ranked lower in the Yt vector cannot affect the determination of other variables that are ranked higher in Yt at time t. Therefore, the order of endogenous variables matters in this identification scheme and the order must reflect relative exogeneity between variables. Choleski decomposition enables researchers to obtain error terms (structural errors) that have a diagonal variance-covariance matrix—that is, those that are orthogonal to each other. In addition to this identification assumption, we also impose a block exogeneity assumption that the number of casino visitors does not have any effect on macroeconomic variables. That is, casino visitors are ranked last in the Yt vector and the coefficients with respect to this vector’s lagged values are restricted to zero in the macroeconomic variable equations. At that point, the coefficients of our VAR model can be estimated using the maximum likelihood estimation (MLE) method (Engle and Granger [47] advocate using a co-integration and vector error correction model (VECM) when there is a long-run equilibrium relationship between non-stationary variables. However, our study uses VAR instead of VECM due to the following rationale: our variable of interest, casino visitors, has hardly any effect on the macroeconomic variables being studied. Thus, it is hard to believe it maintains a long-run equilibrium relationship and exerts some adjusting power, with macroeconomic variables. However, when we include casino visitors into the Johansen [48] test, it is possible that the contribution of casino visitors to a co-integration relationship is estimated to be significant, which does lead to possible model misspecification).
We included the following variables as endogenous in the VAR system, considering their data availability in monthly frequency and their economic significance: the number of casino visitors, the oil price, the real exchange rate between Korea and the origin country and four other variables specific to origin countries (exports, stock-market index, short-term interest rate and M2). The number of casino visitors is the variable of main interest. The oil price affects traveling expenses and the supply costs of casino operators. A higher oil price is likely to reduce the number of casino visitors, especially when origin countries are not known as oil exporters. The real exchange rate is defined as (units of Korean Won per one unit of an origin country’s currency) multiplied by (price index of the origin country/price index of Korea) and this formula indicates the relative price of goods and services between Korea and the origin country measured in real terms. In practice, when the real exchange rate goes up, it means goods and services in Korea become relatively cheaper than those in the origin country. It should be noted that exchange-rate regimes vary across countries as Korea, Japan and Taiwan adopt flexible exchange rates, while Hong Kong SAR employs a fixed exchange rate. This “currency board system” accords with Mainland China’s less strict “managed float system”, which is a mix of flexible and fixed systems. Because of this profusion, the variability of nominal exchange rate is relatively small in Hong Kong SAR and Mainland China and the movement of the real exchange rate for those areas is mostly explained by Korea’s nominal exchange rate as well as the relative price level between Korea and those areas.
In principle, an origin country’s income should affect its citizens’ decision to travel abroad for casino tourism. However, because GDP is not available in monthly frequency, we instead include export values of the origin countries, as all these countries are known for their significant exports (According to International Financial Statistics, China ranks first in the world, Japan fourth, Hong Kong SAR eighth and Taiwan seventeenth in export value in 2015). Stock-market indices in origin countries inform us how strong overall economic activity in that country is, another factor that can affect the number of outbound travelers via the wealth effect on households. Also, we used the origin countries’ central bank discount-window interest rates as indicators of monetary policy. These interest rates are used as primary monetary policy instruments and have direct effects on the bank deposit rates, thus affecting the saving-consumption decision. We used these short-term rates instead of the long-term rates because of the former rates’ tighter connection with the monetary-policy stance. M2 has a tendency to be determined, for the most part, by money demand, although money supply and monetary policy can affect it. Therefore, the more exuberant the economic activity is, the faster the increase in M2 should be. We use M2 instead of M1 because the former reflects overall economic conditions better. Our choice of macroeconomic indicators is generally consistent with previous studies focused on the macroeconomic impacts on tourism [34,49,50].
In addition, time trends, squared time trends and the dummy variables for key historic events (2008 global financial crisis (The period from August 2008 to March 2009 was chosen for the global financial crisis dummy, as this was the time when stress in the financial market was the sharpest. The key results of our study remain robust if we instead select several different time periods as the crisis dummy), 2009 H1N1 flu outbreak, 2014 Incheon Asian Games, 2015 MERS outbreak, political tension regarding North Korea (To measure political tensions between North Korea and surrounding countries, which can impact tourism into South Korea, we extract the search frequency index for “North Korea” from Google Trends and define a dummy variable that is scored 1 when the z-score of the index exceeds 1. There are six such occasions during the sample period)) and the origin countries’ major holiday events (Golden Week for Japan, Lunar New Year and National Day for Mainland China and Hong Kong SAR, Lunar New Year for Taiwan) were included as exogenous variables.
We determined the lag length of the AR terms in the VAR system by Akaike Information Criteria (AIC). AIC is defined as AIC = −2(LL/T) + 2tp/T, where LL is log likelihood, T is the length of the time series sample and tp is the model’s total parameters. We chose a lag length between 1 and 4, minimizing AIC. Using this criterion, the optimal lag length is 2 for Mainland China, 3 for Japan and Hong Kong SAR and 4 for Taiwan.

3.2. Data

The sample data period was February 2006 to September 2016, with samples taken in monthly frequency. We used data from three Grand Korea Leisure Co. Ltd. (GKL, Seoul, Korea) casinos, the largest foreigners-only casino-resort chain in Korea and collected it from the Korea Casino Association’s available resources. GKL, which is a subsidiary of the Korea Tourism Organization, was founded in 2005 and has run three “Seven Luck” casinos in Seoul (the capital and most-populous city) and Busan (the second most-populous city) since then.
Figure 1 presents the annual trend and composition of casino visitors by nationality. Since 2006, Chinese visitors have steadily increased, while Japanese have decreased since 2011. This trend is reflected by the relative proportion of visitors, as Chinese—who accounted for just 8% of total visitors in 2006—rose to 44% in 2015, while the share of Japanese visitors fell from 54% to 25% during the same period. The number of visitors from Hong Kong SAR and Taiwan are rather consistent in their sizes; each of these areas constitutes 4% to 6% of total arrivals every year. These four countries combined accounted for between 70% and 80% of the total visitors every year during the study period.
For macroeconomic data, we surveyed numerous sources. We used the West Texas Intermediate (WTI) crude oil price per barrel as the indicator of the oil price. The price index used for the calculation of the real exchange rate is the consumer price index. Regarding the indicator of stock price, we used the Nikkei 225 Index for Japan, the Shanghai Stock Exchange B Share Index for Mainland China, the Hang Seng Index for Hong Kong SAR and the Taiwan Capitalization Weighted Stock Index for Taiwan. The oil price, the nominal exchange rate, the stock-market index, the interest rate and M2 were collected from Federal Reserve Economic Data (FRED) and the central banks of Korea and the four origin areas. Exports are measured by value of exports in US dollars using the free on board (FOB) criterion and were collected from International Financial Statistics.
Seasonality in casino visitors, the oil price and exports were adjusted using the X-13 Arima/Seats package. All variables were transformed to enter the VAR system. We use the log difference of the number of casino visitors, the oil price, the stock price, the real exchange rate and exports. Consistent with this practice, the year-on-year growth rate of M2 was calculated and its first difference was used. Finally, the difference of the interest rate was used. Table 1 shows key descriptive statistics of these variables. The mean growth rate of casino visitors ranges from 1.1% (Japan) to 2.8% (Mainland China). Mainland China also has the highest average growth rate in exports and stock price, reflecting that economy’s strong growth during the sample period. Except Hong Kong SAR, the average growth rate of the real exchange rate is quite small, showing that these countries maintained quite stable terms of trade with Korea.
Non-stationarity of the variables can lead to a spurious regression. In order to examine the stationarity of the variables, we conducted an Augmented Dickey-Fuller (ADF) test with a constant, a trend and one lagged difference term for each variable. The null hypothesis of the unit root was rejected for all series with 1% level of significance, supporting their stationarity as shown in Table 2.

4. Results

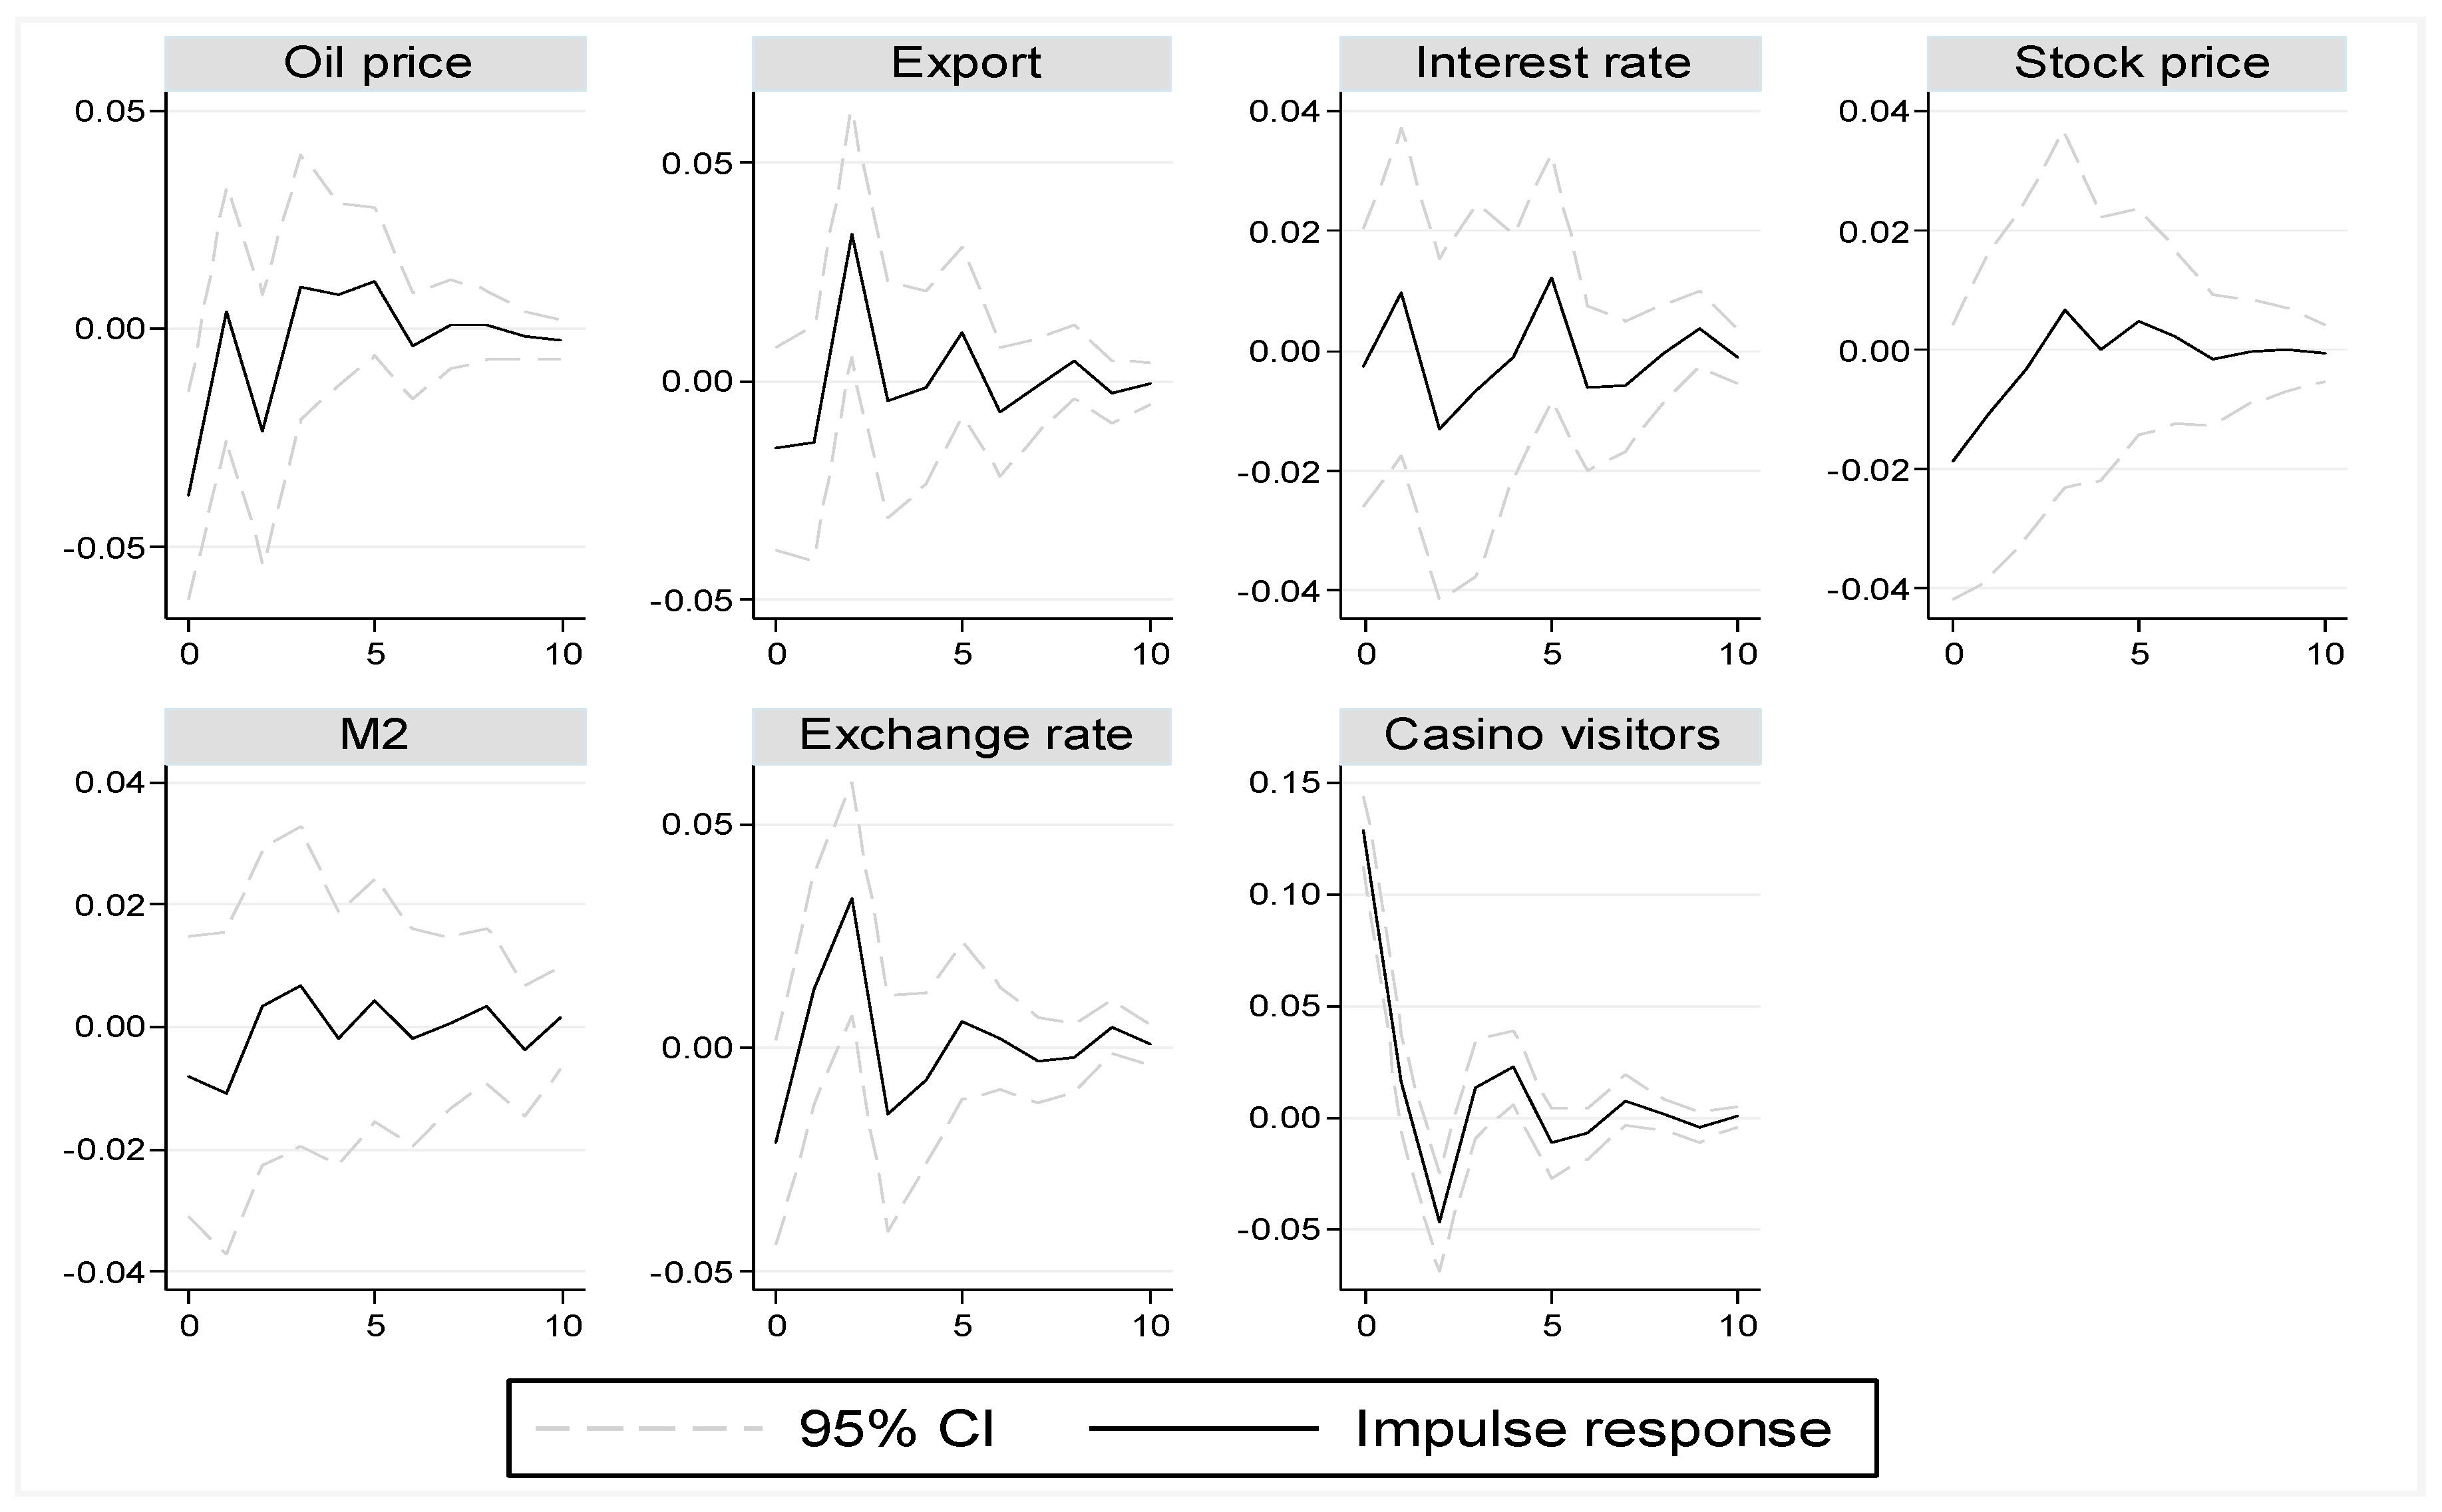
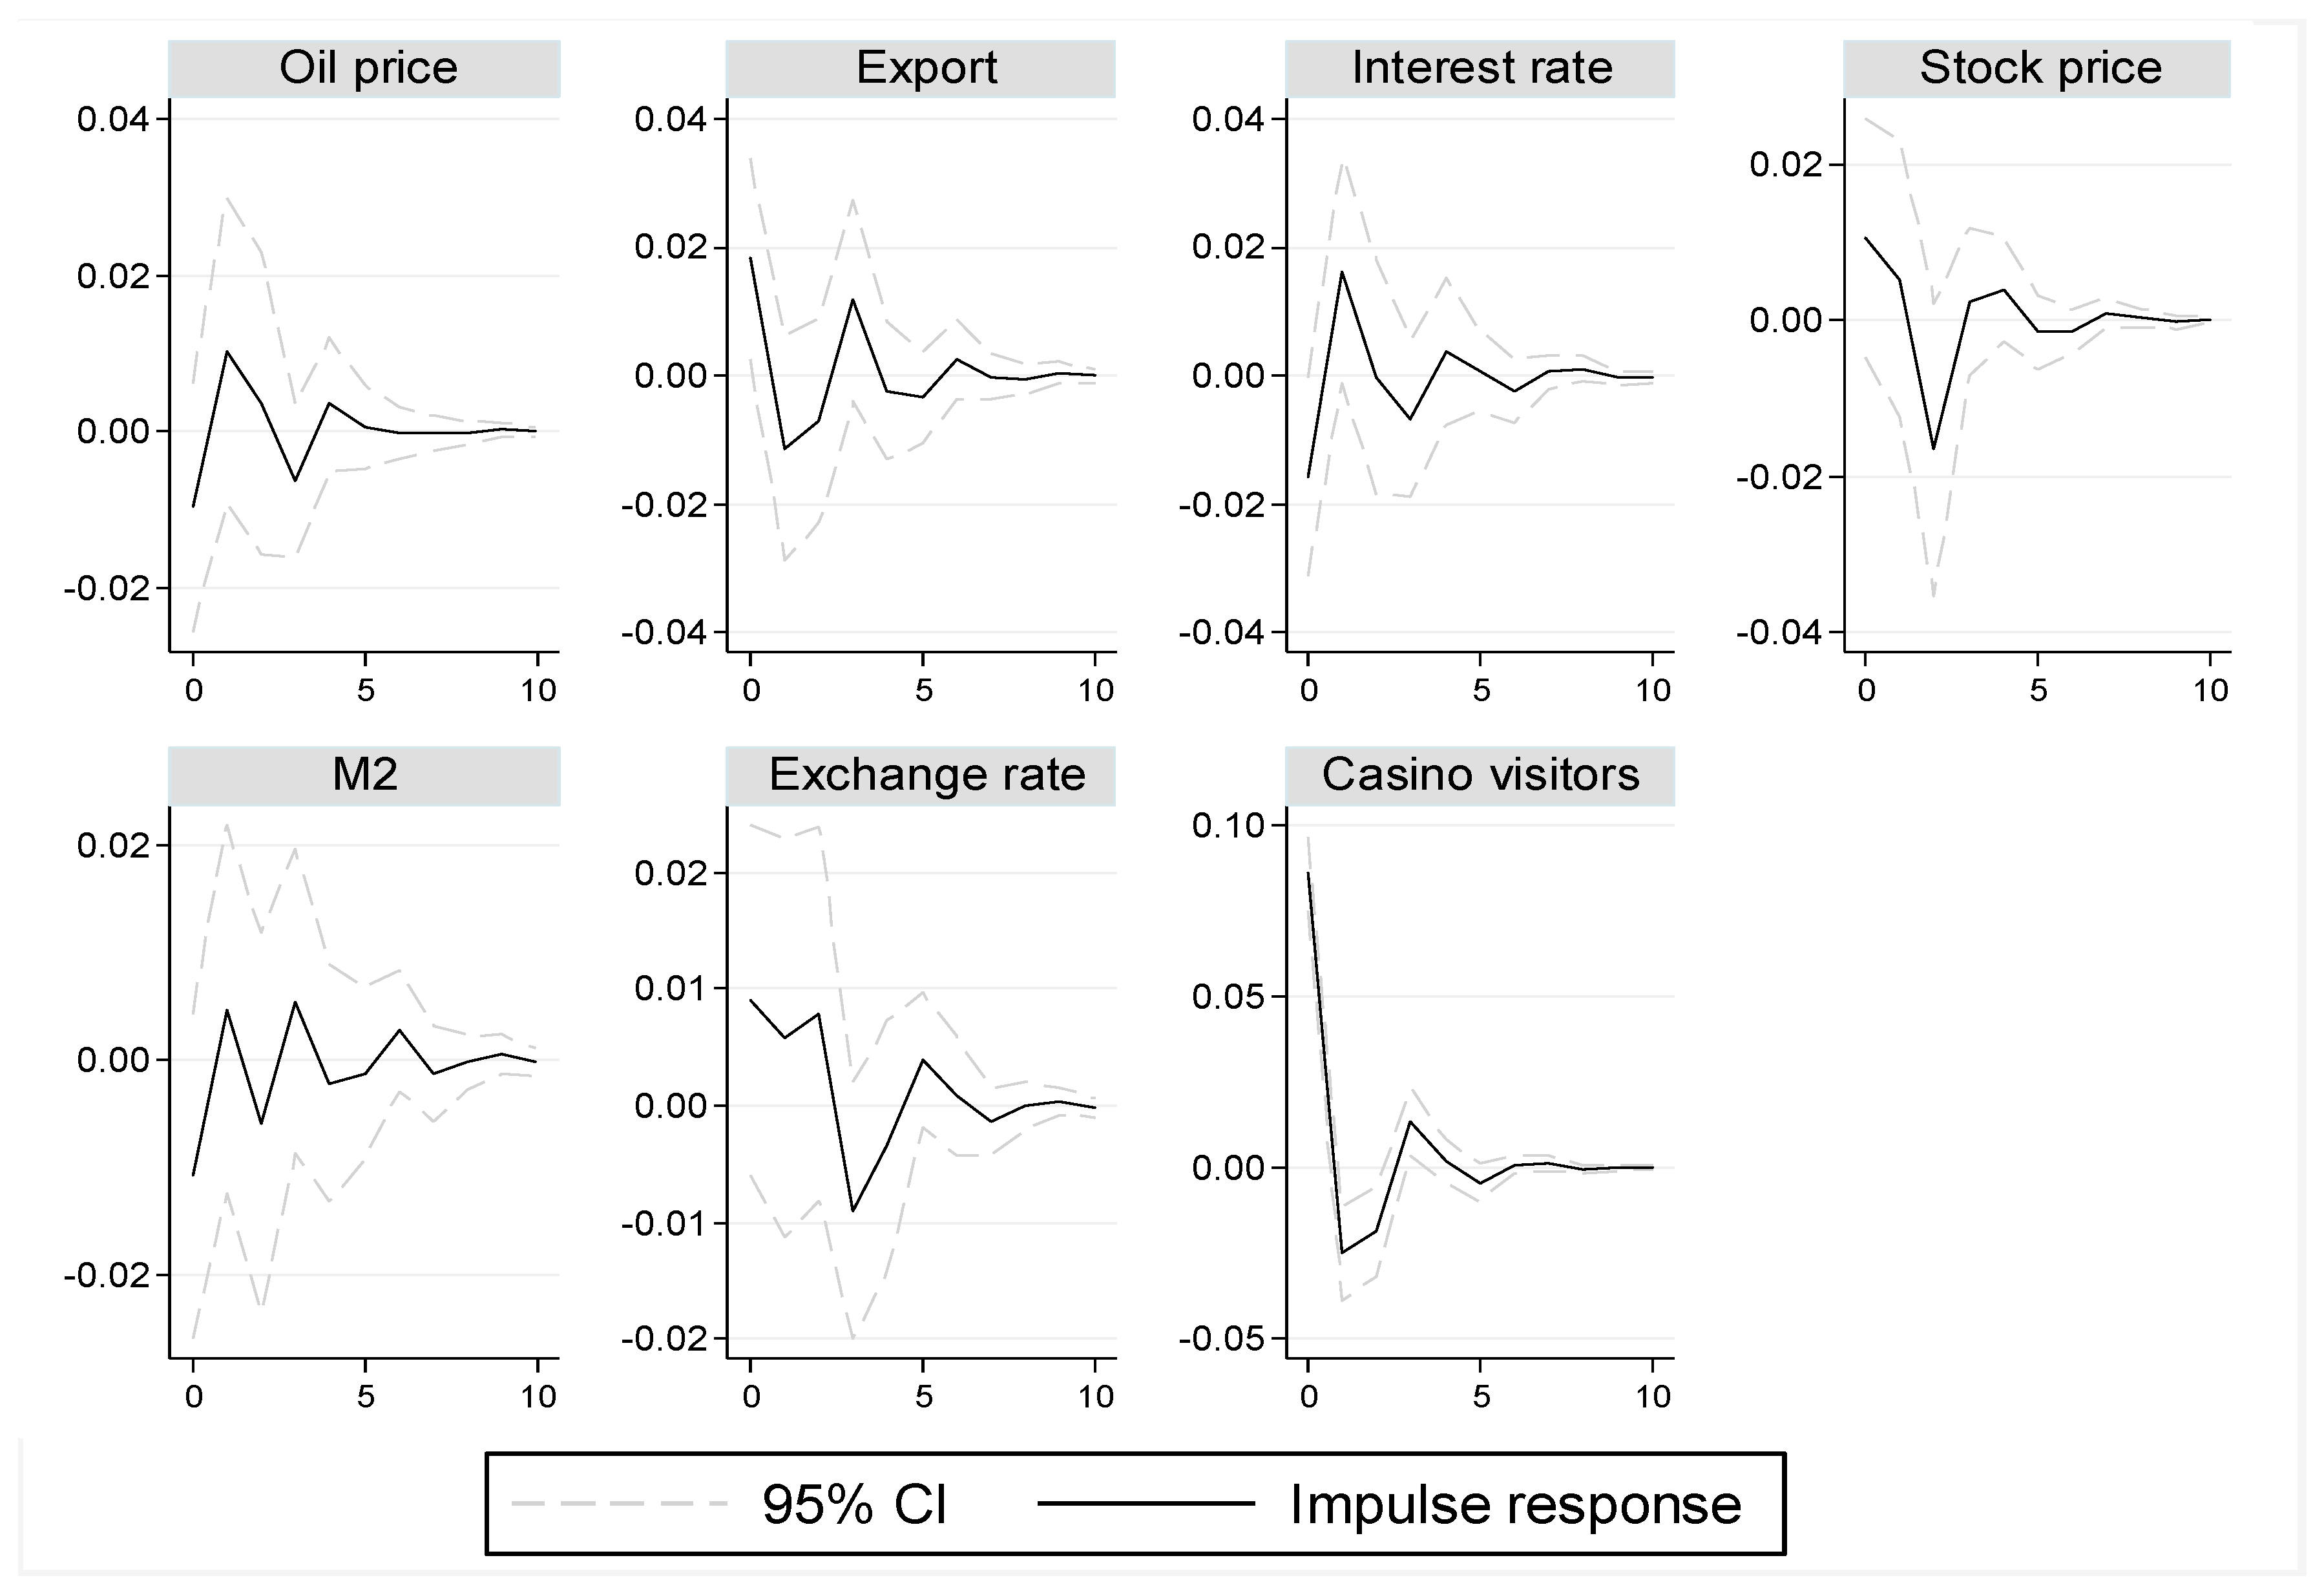
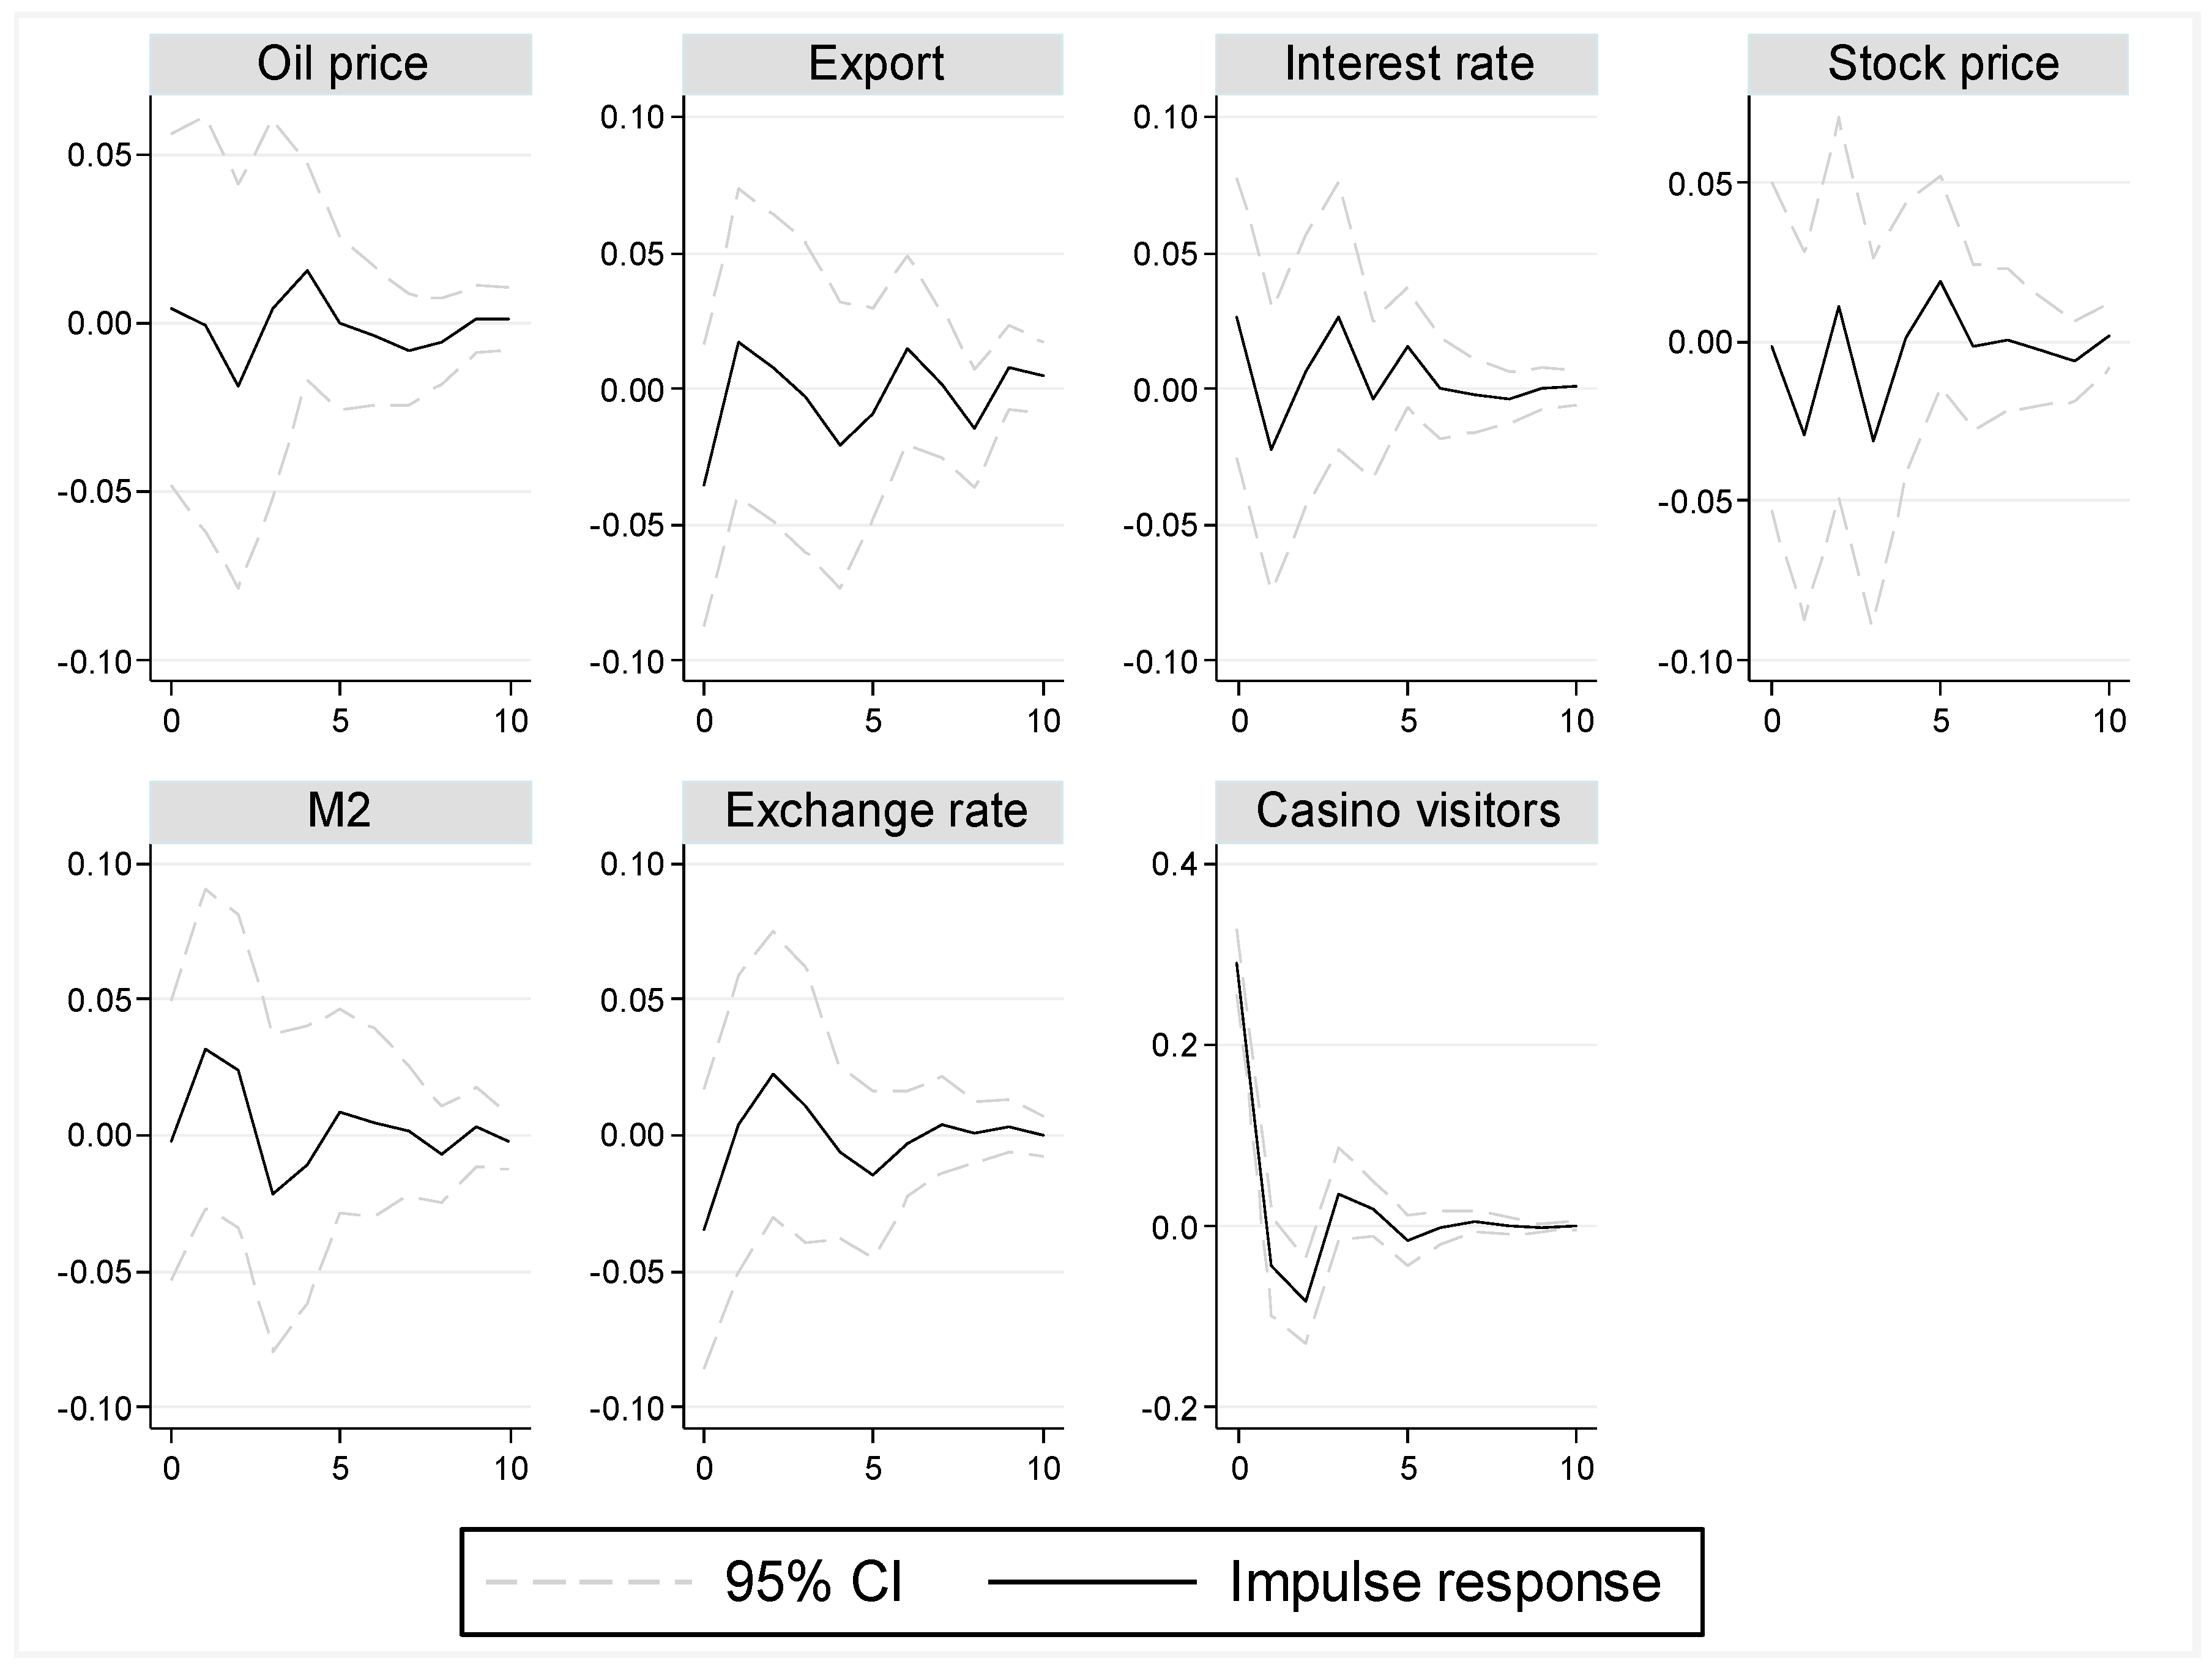
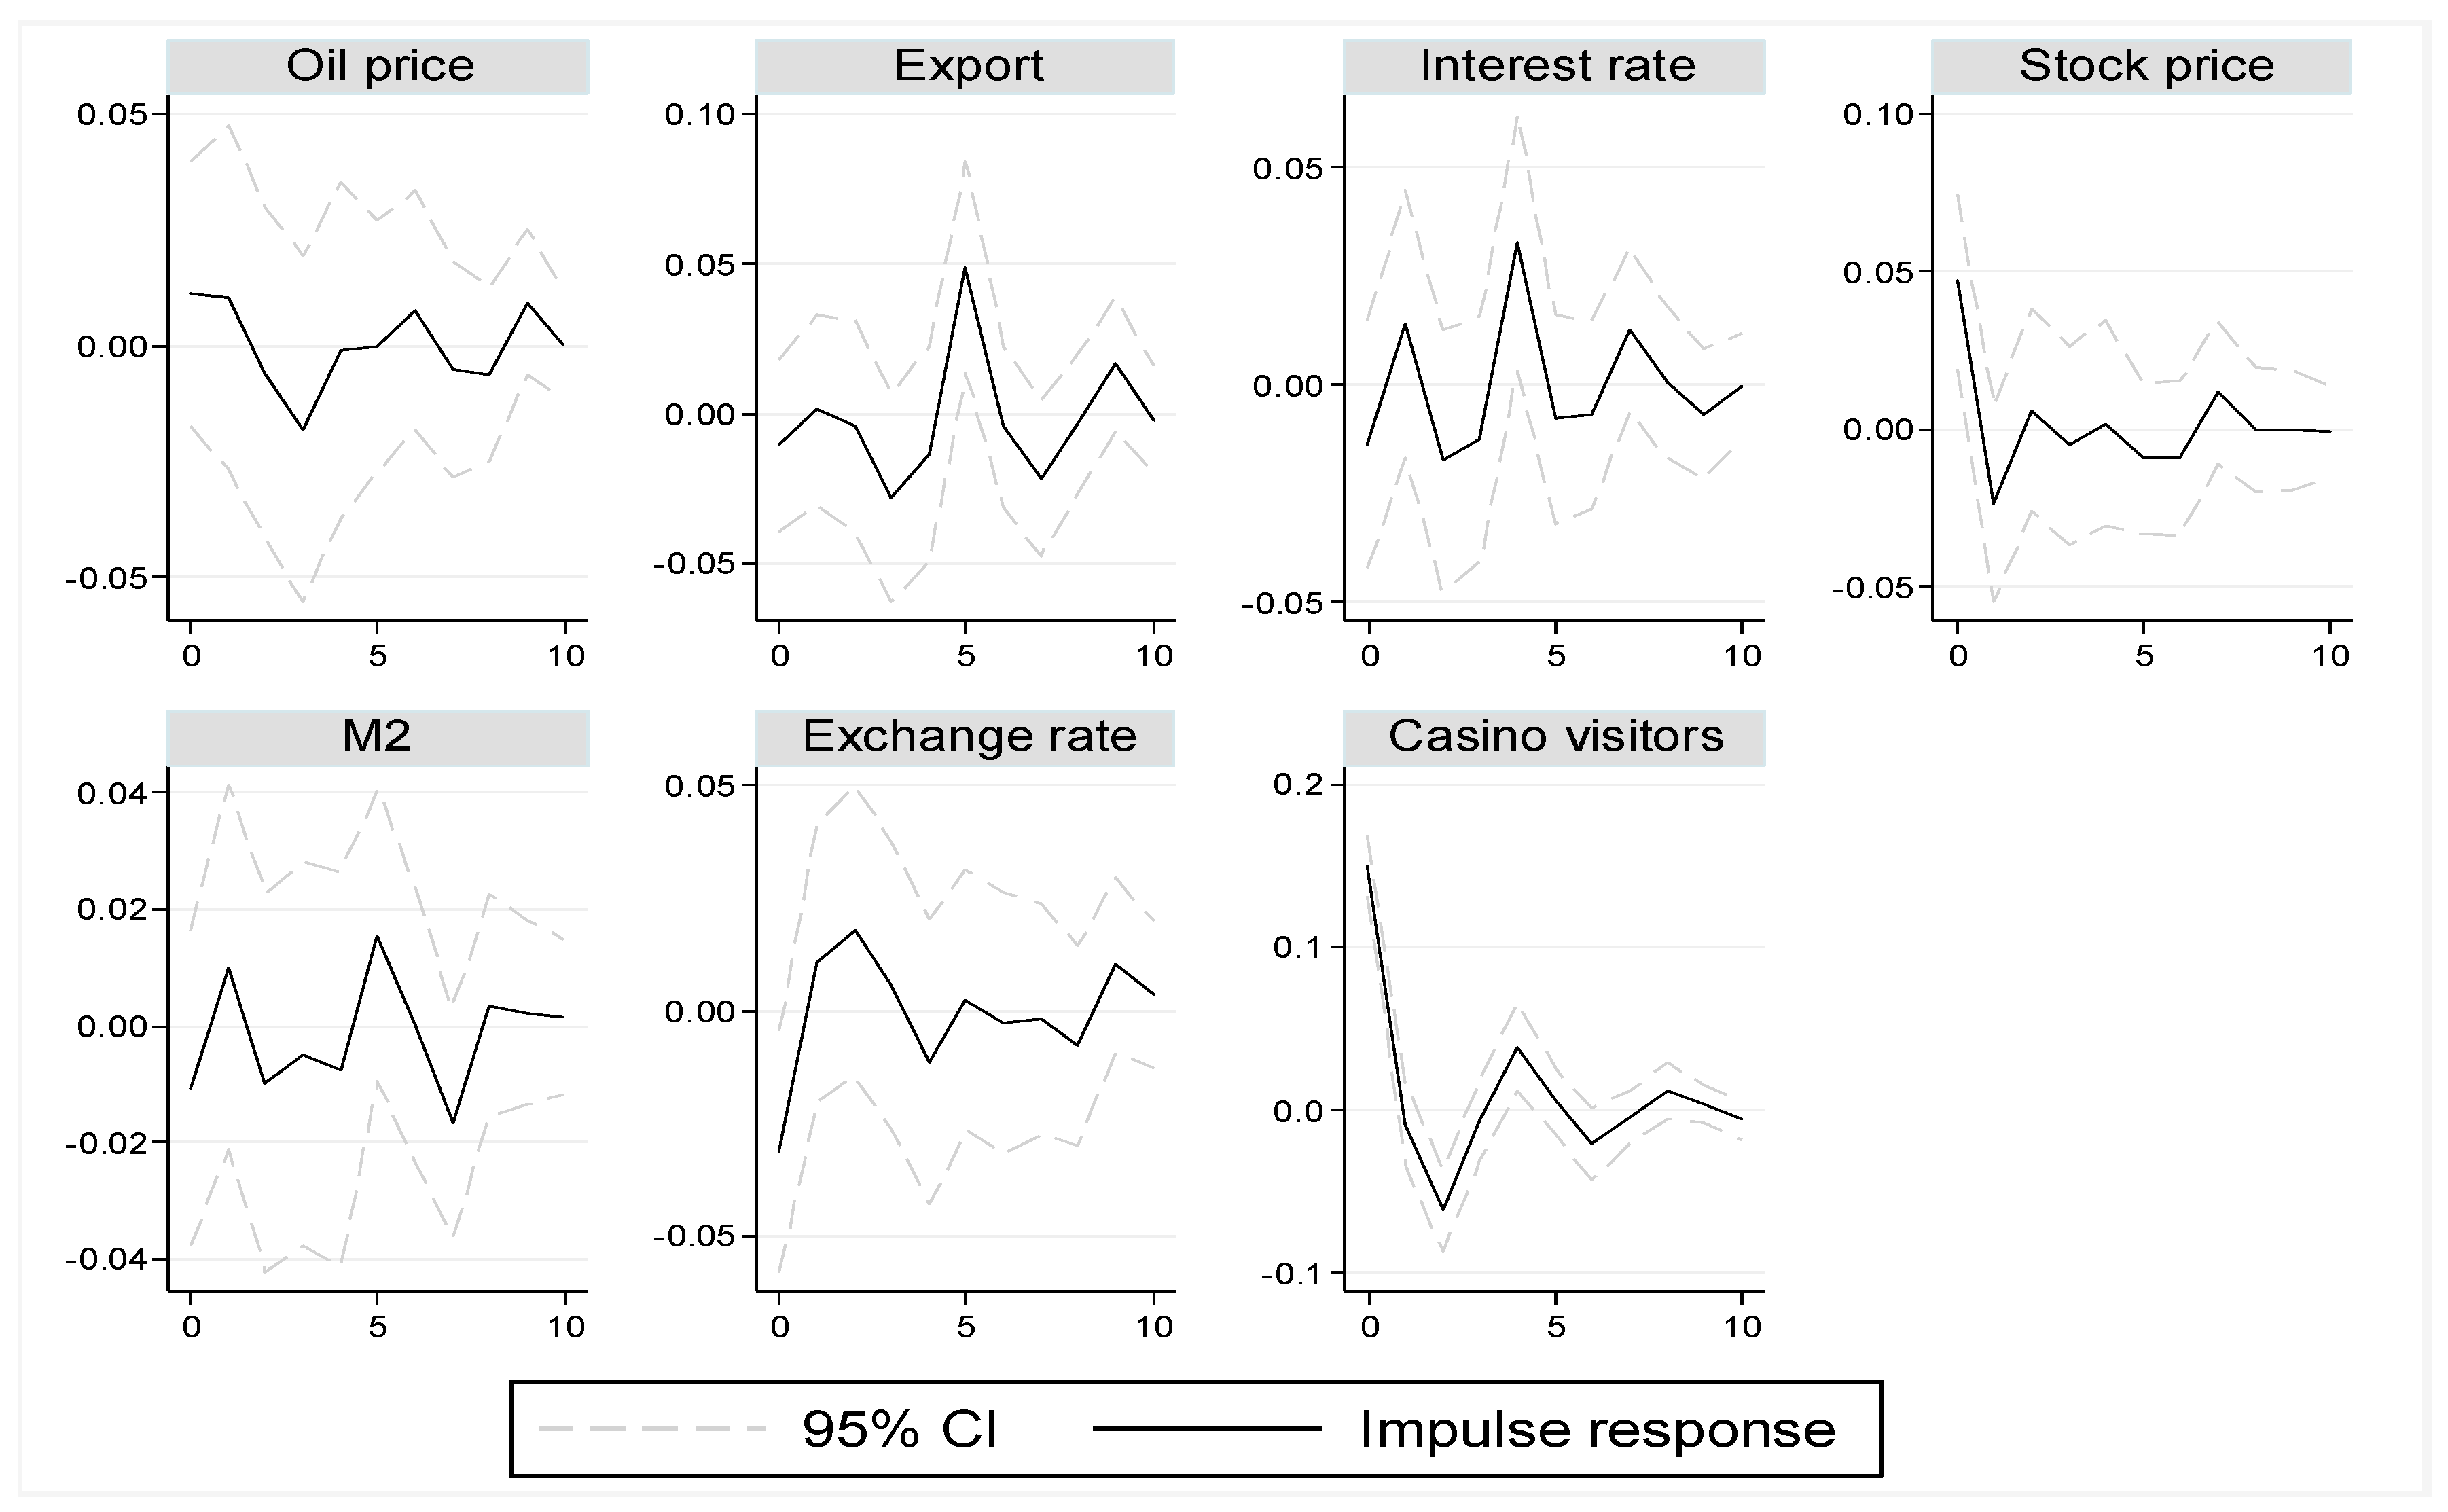
4.1. Impulse Response Functions

Impulse response functions measure the dynamic response of endogenous variables upon the shock (one unit increase in the error term) in endogenous variables. In our SVAR, because error terms are orthogonalized, a shock to an endogenous variable represents an innovation independently originated from that specific variable. The impulse response function of Yj, given the shock to Yi after h period, is defined as
I R F ( i , j ) ( h ) = Y j , t + h ε i , t .
Figure 2, Figure 3, Figure 4 and Figure 5 report the impulse response functions of casino visitors given one standard deviation shock to all macroeconomic variables, including the shock to casino visitors itself. In all figures, a positive shock to casino visitors itself creates a significant positive response in period 0. The response then falls into the negative region for a time, indicating that casino visitors reverts back to its normal level as the effect of the shock weakens. In Figure 2, the sudden rise in the oil price has a significant negative effect on Japanese casino visitors at once but has nonsignificant effects in subsequent periods. On the other hand, delayed responses are shown from the exchange rate and for exports. The rise in the exchange rate (which implies real appreciation of Japanese Yen), or the increase in exports, has a nonsignificant effect until period 2, when a positive response appears, which is consistent with conventional wisdom. For Mainland China, as seen in Figure 3, exports and the interest rate have an immediate effect on casino visitors. As expected, the increase in exports increases casino visitors. The difference from the Japanese case is that the response is not delayed at all, as it is significant in period 0 and nonsignificant in subsequent periods. A rise in the interest rate reduces casino visitors immediately, which can be interpreted as an outcome of contractionary monetary policy. In Figure 4, the impulse response functions of variables regarding Hong Kong SAR are displayed. There is no significant response found among those points, however, suggesting that casino visitors from that region are unique in the inelasticity of their response to macroeconomic conditions. For Taiwan, in Figure 5, the rise in the stock price has an instant significant effect on casino visitors. This effect is large in magnitude as well, dominating the stock price effects of other origin countries.

4.2. Forecast Error Variance Decomposition

An h-step ahead forecast error of an endogenous variable Yj at time t is defined by Yj,t+hEt(Yj,t+h). This forecast error exists because of the innovations between time t and t + h. Forecast error variance decomposition quantifies the contribution of each structural shock to the variance of an h-step forecast error. Therefore, this decomposition can be interpreted as an indicator that informs us of the source of variation in endogenous variables. Table 3 summarizes the 2-step, 5-step and 10-step forecast error decompositions for each origin area’s casino visitors. For Japan, the oil price explains about 7% of forecast errors across all horizons. The explanatory power of exports and the exchange rate increases after two months, which is consistent with the impulse-response function result showing that casino visitors respond significantly to the shock in these variables after two months. For Mainland China, exports and the interest rate explain about 5% of the variance decomposition, again consistent with the impulse-response function result. For Hong Kong SAR, macroeconomic variables have at most limited explanatory power to forecast errors, as the number of casino visitors itself accounts for more than 90% of the variance decomposition for all horizons. For Taiwan, the contribution of the stock-price slightly decreases over time, from 10% of 2-step forecast errors to 8% of 10-step but that of exports increases, from almost 0% of 2-step forecast errors to 10% of 10-step.

4.3. Granger Causality Test

The Granger causality test, introduced by [51], determines whether the current and past values of one variable add predictive power to the future values of other variables, beyond the information carried by the current and past values of those other variables. In a VAR system, whether a variable Yi Granger-causes Yj can be performed with a Wald test by imposing a restriction that all coefficients of the lagged values of Yi in Yj equation are jointly zero.
Table 4 reports the Granger causality test results for the casino-visitors equation. The null hypothesis is that each macroeconomic variable does not Granger-cause casino visitors. The results in Table 4 indicate that macroeconomic variables do not Granger-cause casino visitors. Although there are some instantaneous and delayed effects from macroeconomic variables found from impulse-response functions and variance decomposition analysis, the predictive power of those variables on casino visitors is found to be weak.

4.4. The Event Effects

Our VAR system includes dummy variables for key historic events (the global financial crisis, the H1N1 flu outbreak, the Incheon Asian Games, the MERS outbreak and political tension regarding North Korea) and major holiday events (Golden Week for Japan, Lunar New Year and National Day for Mainland China and Hong Kong SAR, Lunar New Year for Taiwan) as exogenous variables. Among those variables, only the MERS outbreak, Incheon Asian Games for Taiwan and Lunar New Year for Mainland China have statistically significant coefficients with a 5% level of significance. Clearly, the MERS outbreak had severe adverse impacts on casino visitors. Its coefficients are all significant (−0.83 for Taiwan, −0.72 for Hong Kong SAR, −0.70 for Japan and −0.40 for Mainland China), which implies a 40 to 85 percentage-point decrease in casino visitors compared to what would have otherwise been expected. The coefficient for the Incheon Asian Games is 0.29 for Taiwan, suggesting the event’s positive economic influence. The effect from major holiday events is regarded as seasonality and should be removed by a seasonal-adjustment process. This is consistent with the conclusion that most major holiday events have nonsignificant coefficient estimates. Lunar New Year for Mainland China is an exception; it has a positive significant estimate of 0.08. One possible explanation is that the event follows lunar-calendar practice and hence falls interchangeably between January and February.

5. Conclusions and Implications

For years, tourism research has focused on understanding travel demand [52]. In that line of inquiry, economic variables have frequently been studied as potential determinants of tourist flows between disparate nations [53]. Given that tourism arrivals for casino visits are key underpins of numerous national economies [54], the heretofore assessed empirical results for the casino sector in the existing tourism-economics literature is lacking [10]. While some previous tourism studies have employed macroeconomic variables to examine tourism demand, less is known about their effects on specific sectors, such as gaming. For example, very few studies have investigated the factors influencing the number of casino visitors to foreigner-only casinos in South Korea, despite the fact that Korea’s casino industry is becoming one of the most relevant drivers of tourism on the Korean peninsula. Nearly all—sixteen out of seventeen—South Korean casinos are bound by law to admit only foreign gamblers, meaning the determinants of inbound casino tourists is a critical topic for Korea’s tourism industry [16]. Nonetheless, the majority of prior studies on Korean gaming have focused on data from Kangwon Land, the country’s single open-access (i.e., capable of admitting Korean citizens) casino. Thus, for scholars, managers and policy makers, it is extremely important to identify which factors influence the number of casino visitors using appropriate econometric tools. In this article, we have examined the various macroeconomic determinants of the number of visitors to foreigner-only casinos in South Korea from Korea’s top four tourism-source areas: Mainland China, Taiwan, Hong Kong SAR and Japan, the four inbound markets that make up half of all arrivals to Korea.
The major macroeconomic variables found by this study to have explanatory power included the exchange rate, oil prices, stock prices, interest rates, money stock and exports. In addition, several dummy variables were used to represent events. The results indicated that visitors from Japan and Mainland China, who account for approximately three quarters of all foreign visitors to Korean casinos, were affected by macroeconomic or financial indicators such as changes in oil prices, exports and the exchange rate (for Japan) and exports and short-term interest rates (for Mainland China).
Consistent with [55], the effect of Japan’s exchange rate on tourism demand is significant. The Japanese are very sensitive to fluctuations in the exchange rate because this affects their ability to travel overseas [7]. The exchange rate is greatly impacted by monetary and fiscal/economic policies in both the outbound and inbound country, which partially explains the number of Japanese patrons in Korea’s foreigner-only casinos. In addition, many Japanese citizens prefer arranged private tours [56] for most of their international travel. Because such travelers are generally price-sensitive, they look for better deals before visiting the casinos in Korea.
Thanks to Mainland China’s rapid economic development and rising individual wealth, outbound tourism from China has been developing steadily. Exports and interest rates are linked to economic growth and GDP and can therefore cause an increase in the number of casino patrons. Additionally, because of rapid economic development, incentive tours—the most common type of outbound travel for the Mainland Chinese—may be increasingly focusing on foreigner-only casinos in South Korea. In contrast, based on the current findings, we could assume that visitors from Hong Kong SAR, who are apt to be high-level business travelers, did not seem to be affected by any of these factors, possibly because they are familiar with Macao and its thriving casino-gaming industry. Finally, we found that the MERS (Middle East Respiratory Syndrome) outbreak in Korea in 2015 had a significant adverse impact on casino visitors from all countries.
Both academics and practitioners have become increasingly interested in how the quality of service affects consumer behavior, particularly in casino settings. Previous studies have utilized casino frontline employees and customer loyalty as research topics. This cutting-edge research has rarely ventured beyond the confines of Las Vegas- and Macao-based casinos. So, while the social, economic and environmental impacts of Macao’s casino expansion are well documented and while the basic casino/economic-growth link has been thoroughly explained, still scant literature demonstrates how economic factors influence the growth of gaming as a tourism driver and how fluctuations like economic crises can restrict casino growth.
The casino market has been effectively used within the tourism industry to encourage foreign tourists to spend more money and to extend their periods of stay and Korean tourism officials are fully cognizant of this trend. In recent years, the Korean government has been keenly interested in attracting foreign gaming investors and developers to invest in and boost South Korea’s tourism industry. Thus, this study will be immediately helpful for policy makers. This study will also enrich the tourism literature and expand the limited research in this area by shedding light on the relationship between macroeconomic variables and the number of casino visitors arriving in South Korea.
The sustainability of gaming’s recent growth is a research topic of key interest for scholars and managers [57]. As casino gambling continues to proliferate in the Asia Pacific zone, a more and more competitive marketplace emerges. Understanding how economic indicators drive casino-visitor is crucial to predicting casinos’ competitiveness and assessing competitive advantages. It is increasingly important for casino operators to understand their customers, their inbound markets and the drivers of casino demand. While Korea is now more or less established as an international tourism destination, its critical foreigner-casino revenues remain highly susceptible to fluctuation and significantly influenced by economic and financial conditions. The existing literature assigns a pivotal role to the macroeconomic environment for shaping consumer behavior [58]. This study shows how those macroeconomic determinants have been affecting casino visitors to Korea in recent years. By investigating the effects of macroeconomic variables on casino-tourist behavior, the current study stands to fill the need for an improved modelling process [59].
The tourism and hospitality industry has always been but has now become still more, susceptible to disasters, crises and shocks. Since MERS is still in its relatively early stages, its impact on tourism has so far been fairly moderate. Nonetheless, policymakers need to gain an understanding of how MERS-like crises affect tourism. Our results show that tourism officials need to address crisis-related uncertainty directly, countering stories about health and safety issues with strong statements and images promoting the cleanliness, safety and natural beauty of the destination. For Korea, emphasizing the healthiness of the populace and the attractiveness of both its urban and natural areas will help to insulate the tourism-driving international-casino sector from demand fluctuations caused by current events such as MERS.
This study is not without its limitations. Because of the unavailability of data, we investigated foreigner-only casinos in Korea. Further studies could set out to compare foreigners only casinos and one allowing access by Korean citizens. One of the further limitations of this study is that it has considered six key determinants for the number of inbound casino visitors, largely owing to the availability of reliable data. Future scholars could identify other determinants (e.g., distance between countries, etc.). From a micro-tourism perspective, further analysis could also investigate linkages between the sociodemographic characteristics of visitors and their casino-tourism behavior.

Author Contributions

Sung-Bum and Hyunduk Suh Kim designed and developed the idea of the paper. Sung-Bum Kim reviewed related previous research. Hyunduk Suh analyzed the data. All authors wrote and reviewed the manuscript.

Conflicts of Interest

The authors declare no conflict of interest.

References

  1. Kralj, A.; Solnet, D. Service climate and customer satisfaction in a casino hotel: An exploratory case study. Int. J. Hosp. Manag. 2010, 29, 711–719. [Google Scholar] [CrossRef]
  2. PwC. Global Gaming Industry Regulatory Frameworks. PricewaterhouseCoopers International Limited. 2015. Available online: http://www.pwc.com (accessed on 21 February 2018).
  3. Walker, D.M. The Economic Effects of Casino Gambling: A Perspective from the US. 2009. Available online: http://walkerd.people.cofe.edu/pubs/Walker_Macao_ss.pdf (accessed on 21 February 2018).
  4. Siu, R.C.S. After the games in Macau and Singapore, what next? Casino Gaming Int. 2008, 4, 17–21. [Google Scholar]
  5. Valadkhani, A.; Smyth, R.; O’Mahony, B. Asymmetric causality between Australian inbound and outbound tourism flows. Appl. Econ. 2017, 49, 33–50. [Google Scholar] [CrossRef]
  6. Wong, I.A.; Fong, L.H.N.; Law, R. A longitudinal multilevel model of tourist outbound travel behavior and the dual-cycle model. J. Travel Res. 2016, 55, 957–970. [Google Scholar] [CrossRef]
  7. Wang, Y.S. The impacts of crisis events and macroeconomic activity on Taiwan’s international inbound tourism demand. Tour. Manag. 2009, 30, 75–82. [Google Scholar] [CrossRef]
  8. Chang, W.S.; Lee, Y.-H. The macroeconomic contribution to foreign-exchange earnings from tourism in Taiwan. Curr. Issues Tour. 2017, 20, 1110–1115. [Google Scholar] [CrossRef]
  9. Horváth, C.; Paap, R. The effect of recessions on gambling expenditures. J. Gambl. Stud. 2012, 28, 703–717. [Google Scholar] [CrossRef] [PubMed] [Green Version]
  10. Kim, S.H.; Kim, D.J. Determining revenue-generating casino visitors using a Vector Autoregressive Model: The case of the G casino in Korea. J. Qual. Assur. Hosp. Tour. 2016, 17, 257–273. [Google Scholar] [CrossRef]
  11. Demir, E.; Alıcı, Z.A.; Lau, M.C.K. Macro explanatory factors of Turkish tourism companies’ stock returns. Asia Pac. J. Tour. Res. 2017, 22, 370–380. [Google Scholar]
  12. Postrado, L. Mohegan Sun to Get $750M from South Korea Casino. 2016. Available online: CalvinAyre.com (accessed on 21 February 2018).
  13. Malek, K.; Kim, J. Convention attendance and gaming volume in South Korean casinos. Int. J. Event Festiv. Manag. 2016, 7, 66–80. [Google Scholar] [CrossRef]
  14. Korea Casino Association. Statistics of Casino Visitors and Revenues; Korean Casino Association: Seoul, Korean, 2014. [Google Scholar]
  15. Korea Casino Association. 2015 Casino Insight; Korea Casino Association: Seoul, Korean, 2015. [Google Scholar]
  16. Kim, J.; Ahlgren, M.B.; Byun, J.-W.; Malek, K. Gambling motivations and superstitious beliefs: A cross-cultural study with casino customers. Int. Gambl. Stud. 2016, 16, 296–315. [Google Scholar] [CrossRef]
  17. Li, G.; Gu, X.; Siu, R.C.S. The impacts of gaming expansion on economic growth: A theoretical reconsideration. J. Gambl. Stud. 2010, 26, 269–285. [Google Scholar] [CrossRef] [PubMed]
  18. Koo, H.; Ko, J. Study on the relationships between foreign customers’ casino motivation and their satisfaction. Korean J. Hotel Adm. 2010, 19, 171–186. [Google Scholar]
  19. Suh, E.; Dang, T.T.; Alhaery, M. Examining the effects of various promotion types on slot gaming volumes. Int. J. Hosp. Manag. 2014, 37, 68–79. [Google Scholar] [CrossRef]
  20. Wu, S.-T.; Chen, Y.-S. The social, economic and environmental impacts of casino gambling on the residents of Macau and Singapore. Tour. Manag. 2015, 48, 285–298. [Google Scholar] [CrossRef]
  21. Wan, Y.K.P. The social, economic and environmental impacts of casino gaming in Macao: The community leader perspective. J. Sustain. Tour. 2012, 20, 737–755. [Google Scholar] [CrossRef]
  22. Lee, C.K.; Lee, Y.; Bernhard, B.; Yoon, Y. Segmenting casino gamblers by motivation: A cluster analysis of Korean gamblers. Tour. Manag. 2006, 27, 856–866. [Google Scholar] [CrossRef]
  23. Kim, W.G.; Cai, L.; Jung, K. A profile of the Chinese casino vacationer to South Korea. J. Hosp. Leisure Mark. 2004, 11, 65–79. [Google Scholar] [CrossRef]
  24. Tseng, F.-M.; Huang, W.C. The long-term effects of tourist policy adjustments on the development of tourism in Taiwan: Consideration of time trends and Fourier component test results. Int. J. Tour. Res. 2017, in press. [Google Scholar] [CrossRef]
  25. Song, H.; Lin, S.; Zhang, X.; Gao, Z. Global financial/economic crisis and tourist arrival forecasts for Hong Kong. Asia Pac. J. Tour. Res. 2010, 15, 223–242. [Google Scholar] [CrossRef]
  26. Li, S.; Blake, A.; Cooper, C. China’s tourism in a global financial crisis: A computable general equilibrium approach. Curr. Issues Tour. 2010, 13, 435–453. [Google Scholar] [CrossRef]
  27. Li, F.; Wen, J.; Ying, T. The influence of crisis on tourists’ perceived destination image and revisit intention: An exploratory study of Chinese tourists to North Korea. J. Destin. Mark. Manag. 2017, in press. [Google Scholar] [CrossRef]
  28. Lee, C.-K. Major determinants of international tourism demand for South Korea: Inclusion of marketing variable. J. Travel Tour. Mark. 1996, 5, 101–118. [Google Scholar] [CrossRef]
  29. Seo, J.H.; Park, S.Y.; Yu, L. The analysis of the relationships of Korea outbound tourism demand: Jeju Island and three international destinations. Tour. Manag. 2009, 30, 530–543. [Google Scholar] [CrossRef]
  30. Ridderstaat, J.; Croes, R. The link between money supply and tourism demand cycles: A case study of two Caribbean destinations. J. Travel Res. 2017, 56, 187–205. [Google Scholar] [CrossRef]
  31. Cho, V. Tourism Forecasting and Its Relationship with Leading Economic Indicators. J. Hosp. Tour. Res. 2001, 25, 399–420. [Google Scholar] [CrossRef]
  32. Jayaraman, K.; Lin, S.K.; Haron, H.; Ong, W.L. Macroeconomic factors influencing Malaysian tourism revenue, 2002–2008. Tour. Econ. 2011, 17, 1347–1363. [Google Scholar] [CrossRef]
  33. De Vita, G. The long-run impact of exchange rate regimes on international tourism Flows. Tour. Manag. 2014, 45, 226–233. [Google Scholar] [CrossRef]
  34. Lennox, J. Impacts of high oil prices on tourism in New Zealand. Tour. Econ. 2012, 18, 781–800. [Google Scholar] [CrossRef]
  35. Wheaton, W.C.; Rossoff, L. The Cyclic behavior on the US lodging industry. Real Estate Econ. 1998, 26, 67–82. [Google Scholar] [CrossRef]
  36. Canina, L.; Walsh, K.; Enz, C.A. The effects of gasoline-price changes on room demand: A study of branded hotels from 1988 through 2000. Cornell Hotel Restaur. Adm. Q. 2003, 44, 29–37. [Google Scholar] [CrossRef]
  37. Bonn, M.A.; Line, N.D.; Cho, M. Low gasoline prices: The effects upon auto visitor spending, numbers of activities, satisfaction and return intention. J. Travel R. 2017, 56, 263–278. [Google Scholar] [CrossRef]
  38. Oh, C.-O.; Hammitt, W.E. Impact of increasing gasoline prices on tourism travel patterns to a state park. Tour. Econ. 2011, 17, 1311–1324. [Google Scholar] [CrossRef]
  39. Shan, J.; Wilson, L. Causality between trade and tourism: Empirical evidence from China. Appl. Econ. Lett. 2001, 8, 279–283. [Google Scholar] [CrossRef]
  40. Easton, S.T. Is tourism just another commodity? links between commodity trade and tourism. J. Econ. Integr. 1998, 13, 522–543. [Google Scholar] [CrossRef]
  41. Sevil, T.; Polat, A. Macro-economic determinants of travel and leisure sector: A co-integration analysis from Turkey. Res. J. Finan. Account. 2015, 6, 213–223. [Google Scholar]
  42. Chen, C.-M.; Lin, Y.-L.; Chang, T.-T. The effects of macroeconomic and weather conditions on the business cycle of Taiwan’s adventure tourism. Curr. Issues Tour. 2017, 20, 447–454. [Google Scholar] [CrossRef]
  43. Shi, W.; Li, K.X. Impact of unexpected events on inbound tourism demand modeling: Evidence of Middle East Respiratory Syndrome outbreak in South Korea. Asia Pac. J. Tour. Res. 2017, 22, 344–356. [Google Scholar] [CrossRef]
  44. Sims, C.A. Macroeconomics and reality. Econometrica 1980, 48, 1–48. [Google Scholar] [CrossRef]
  45. Amisano, G.; Giannini, C. Topics in Structural VAR Econometrics, 2nd ed.; Springer: Heidelberg, Germany, 1997. [Google Scholar]
  46. Hamilton, J.D. Time Series Analysis; Princeton University Press: Princeton, NJ, USA, 1994. [Google Scholar]
  47. Engle, R.F.; Granger, C.W.J. Cointegration and error correction: Representation, estimation and testing. Econometrica 1987, 55, 251–276. [Google Scholar] [CrossRef]
  48. Johansen, S. Estimation and hypothesis testing of co-integration vectors in Gaussian Vector Autoregressive Models. Econometrica 1991, 59, 1551–1580. [Google Scholar] [CrossRef]
  49. Gani, A.; Clemes, M.D. The main determinants effecting international visitor arrivals in New Zealand: Some empirical evidence. Tour. Econ. 2017, 23, 921–940. [Google Scholar] [CrossRef]
  50. Lin, V.S.; Liu, A.; Song, H. Modeling and Forecasting Chinese Outbound Tourism: An Econometric Approach. J. Travel Tour. Mark. 2015, 32, 34–49. [Google Scholar] [CrossRef]
  51. Granger, C.W.J. Investigating causal relations by econometric models and cross spectral Methods. Econometrica 1969, 37, 424–438. [Google Scholar] [CrossRef]
  52. Wong, I.A.; Law, R.; Zhao, X. When and where to travel? A longitudinal multilevel investigation on destination choice and demand. J. Travel Res. 2017, 56, 868–880. [Google Scholar] [CrossRef]
  53. Timothy, D.J.; Kim, S. Understanding the tourism relationships between South Korea and China: A review of influential factors. Curr. Issues Tour. 2015, 18, 413–432. [Google Scholar] [CrossRef]
  54. Vergura, D.T.; Luceri, B. The antecedents of gambling behaviour from a social marketing perspective. J. Gambl. Bus. Econ. 2015, 9, 1–12. [Google Scholar]
  55. Cheng, K.M. Tourism demand in Hong Kong: Income, prices and visa restrictions. Curr. Issues Tour. 2012, 15, 167–181. [Google Scholar] [CrossRef]
  56. Jang, S.C.; Bai, B.; Hong, G.-S.; O’Leary, J.T. Understanding travel expenditure patterns: A study of Japanese pleasure travelers to the United States by income level. Tour. Manag. 2004, 25, 331–341. [Google Scholar] [CrossRef]
  57. Prentice, C.; Wong, I.A. Casino marketing, problem gamblers or loyal customers? J. Bus. Res. 2015, 68, 2084–2092. [Google Scholar] [CrossRef]
  58. Devan, J.; Rowland, M.; Woetzel, J. A Consumer Paradigm for China. McKinsey Q. 2009, 4, 36–49. [Google Scholar]
  59. Lim, S.; Giouvris, E. Tourist arrivals in Korea: Hallyu as a pull factor. Curr. Issues Tour. in press. [CrossRef]
Figure 1. Annual trend and composition of casino visitors by nationality.
Sustainability 10 00554 g001
Figure 2. Impulse response functions, casino visitors, Japan.
Sustainability 10 00554 g002
Figure 3. Impulse response functions, casino visitors, Mainland China.
Sustainability 10 00554 g003
Figure 4. Impulse response functions, casino visitors, Hong Kong SAR.
Sustainability 10 00554 g004
Figure 5. Impulse response functions, casino visitors, Taiwan.
Sustainability 10 00554 g005
Table 1. Key descriptive statistics.
MeanMedianS.D.MaxMin
JapanOil price−0.0030.0040.0840.215−0.302
Export0.0000.0070.0460.106−0.170
Interest rate0.0020.0000.0500.350−0.250
Stock price0.0000.0020.0600.121−0.272
M20.0030.0070.0030.010−0.010
Exchange rate0.001−0.0040.0370.222−0.097
Casino visitors0.0110.0140.1650.877−0.668
Mainland ChinaExport0.0060.0030.0780.221−0.409
Interest rate−0.0080.0000.1901.080−1.350
Stock price0.0110.0180.1080.269−0.406
M2−0.001−0.0010.0230.109−0.117
Exchange rate0.0010.0000.0260.152−0.089
Casino visitors0.0280.0360.1220.676−0.425
Hong Kong SARExport0.0030.0040.0590.299−0.267
Interest rate−0.0410.0000.2460.250−2.000
Stock price0.0030.0080.0650.158−0.254
M20.0000.0010.0300.111−0.097
Exchange rate0.0020.0000.0280.166−0.086
Casino visitors0.020−0.0120.3652.167−1.407
TaiwanExport0.000−0.0030.0660.321−0.193
Interest rate−0.0070.0000.1100.250−0.750
Stock price0.0030.0100.0560.140−0.209
M20.0000.0000.0060.016−0.015
Exchange rate0.000−0.0030.0220.150−0.059
Casino visitors0.0220.0210.2211.211−0.803
Log difference for casino visitors, oil price, stock price, exchange rate, export, the first difference of the year-on-year growth rate for M2 (the monetary indicator) and the first difference for the interest rate.
Table 2. Augmented Dickey-Fuller (ADF) test results.
t-Valuep-Value
JapanOil price−5.540.00
Export−7.070.00
Interest rate−6.730.00
Stock price−7.590.00
M2−13.280.00
Exchange rate−6.240.00
Casino visitors−10.050.00
Mainland ChinaExport−11.660.00
Interest rate−7.240.00
Stock price−6.230.00
M2−10.310.00
Exchange rate−8.340.00
Casino visitors−12.860.00
Hong Kong SARExport−12.350.00
Interest rate−5.040.00
Stock price−6.840.00
M2−9.580.00
Exchange rate−8.140.00
Casino visitors−12.020.00
TaiwanExport−9.130.00
Interest rate−4.140.00
Stock price−6.500.00
M2−7.420.00
Exchange rate−8.460.00
Casino visitors−11.070.00
ADF test result with a constant, a trend and one lagged difference terms. The null hypothesis is that the variable contains the unit root. The critical value is −4.03 for 1% level of significance.
Table 3. Variance decompositions of casino visitors.
2-Step5-Step10-Step
JapanOil price0.070.080.08
Export0.020.060.06
Interest rate0.010.010.02
Stock price0.020.020.02
M20.010.010.01
Exchange rate0.030.080.08
Casino visitors0.870.740.72
Mainland ChinaOil price0.020.020.02
Export0.050.060.06
Interest rate0.050.050.05
Stock price0.010.040.04
M20.010.020.02
Exchange rate0.010.020.03
Casino visitors0.840.780.78
Hong Kong SAROil price0.000.010.01
Export0.020.020.02
Interest rate0.010.020.02
Stock price0.010.020.02
M20.010.020.02
Exchange rate0.010.020.02
Casino visitors0.940.900.88
TaiwanOil price0.010.020.02
Export0.000.030.10
Interest rate0.010.050.05
Stock price0.100.080.08
M20.000.010.02
Exchange rate0.040.040.04
Casino visitors0.820.770.69
Table 4. Granger causality test results.
F-Statisticp-Value
JapanOil price1.120.34
Export1.950.12
Interest rate0.700.55
Stock price0.650.58
M20.450.72
Exchange rate1.880.10
Mainland ChinaOil price0.610.54
Export0.450.64
Interest rate1.200.30
Stock price1.100.33
M20.730.48
Exchange rate1.860.16
Hong Kong SAROil price0.120.95
Export0.670.57
Interest rate0.770.51
Stock price0.950.41
M20.970.41
Exchange rate0.250.86
TaiwanOil price0.320.87
Export1.470.21
Interest rate2.350.05
Stock price0.780.54
M20.380.82
Exchange rate0.600.67

