Analyzing the Effects of Car Sharing Services on the Reduction of Greenhouse Gas (GHG) Emissions

Abstract
:1. Introduction
2. Materials and Methods
2.1. Data Description
2.2. Survey Design
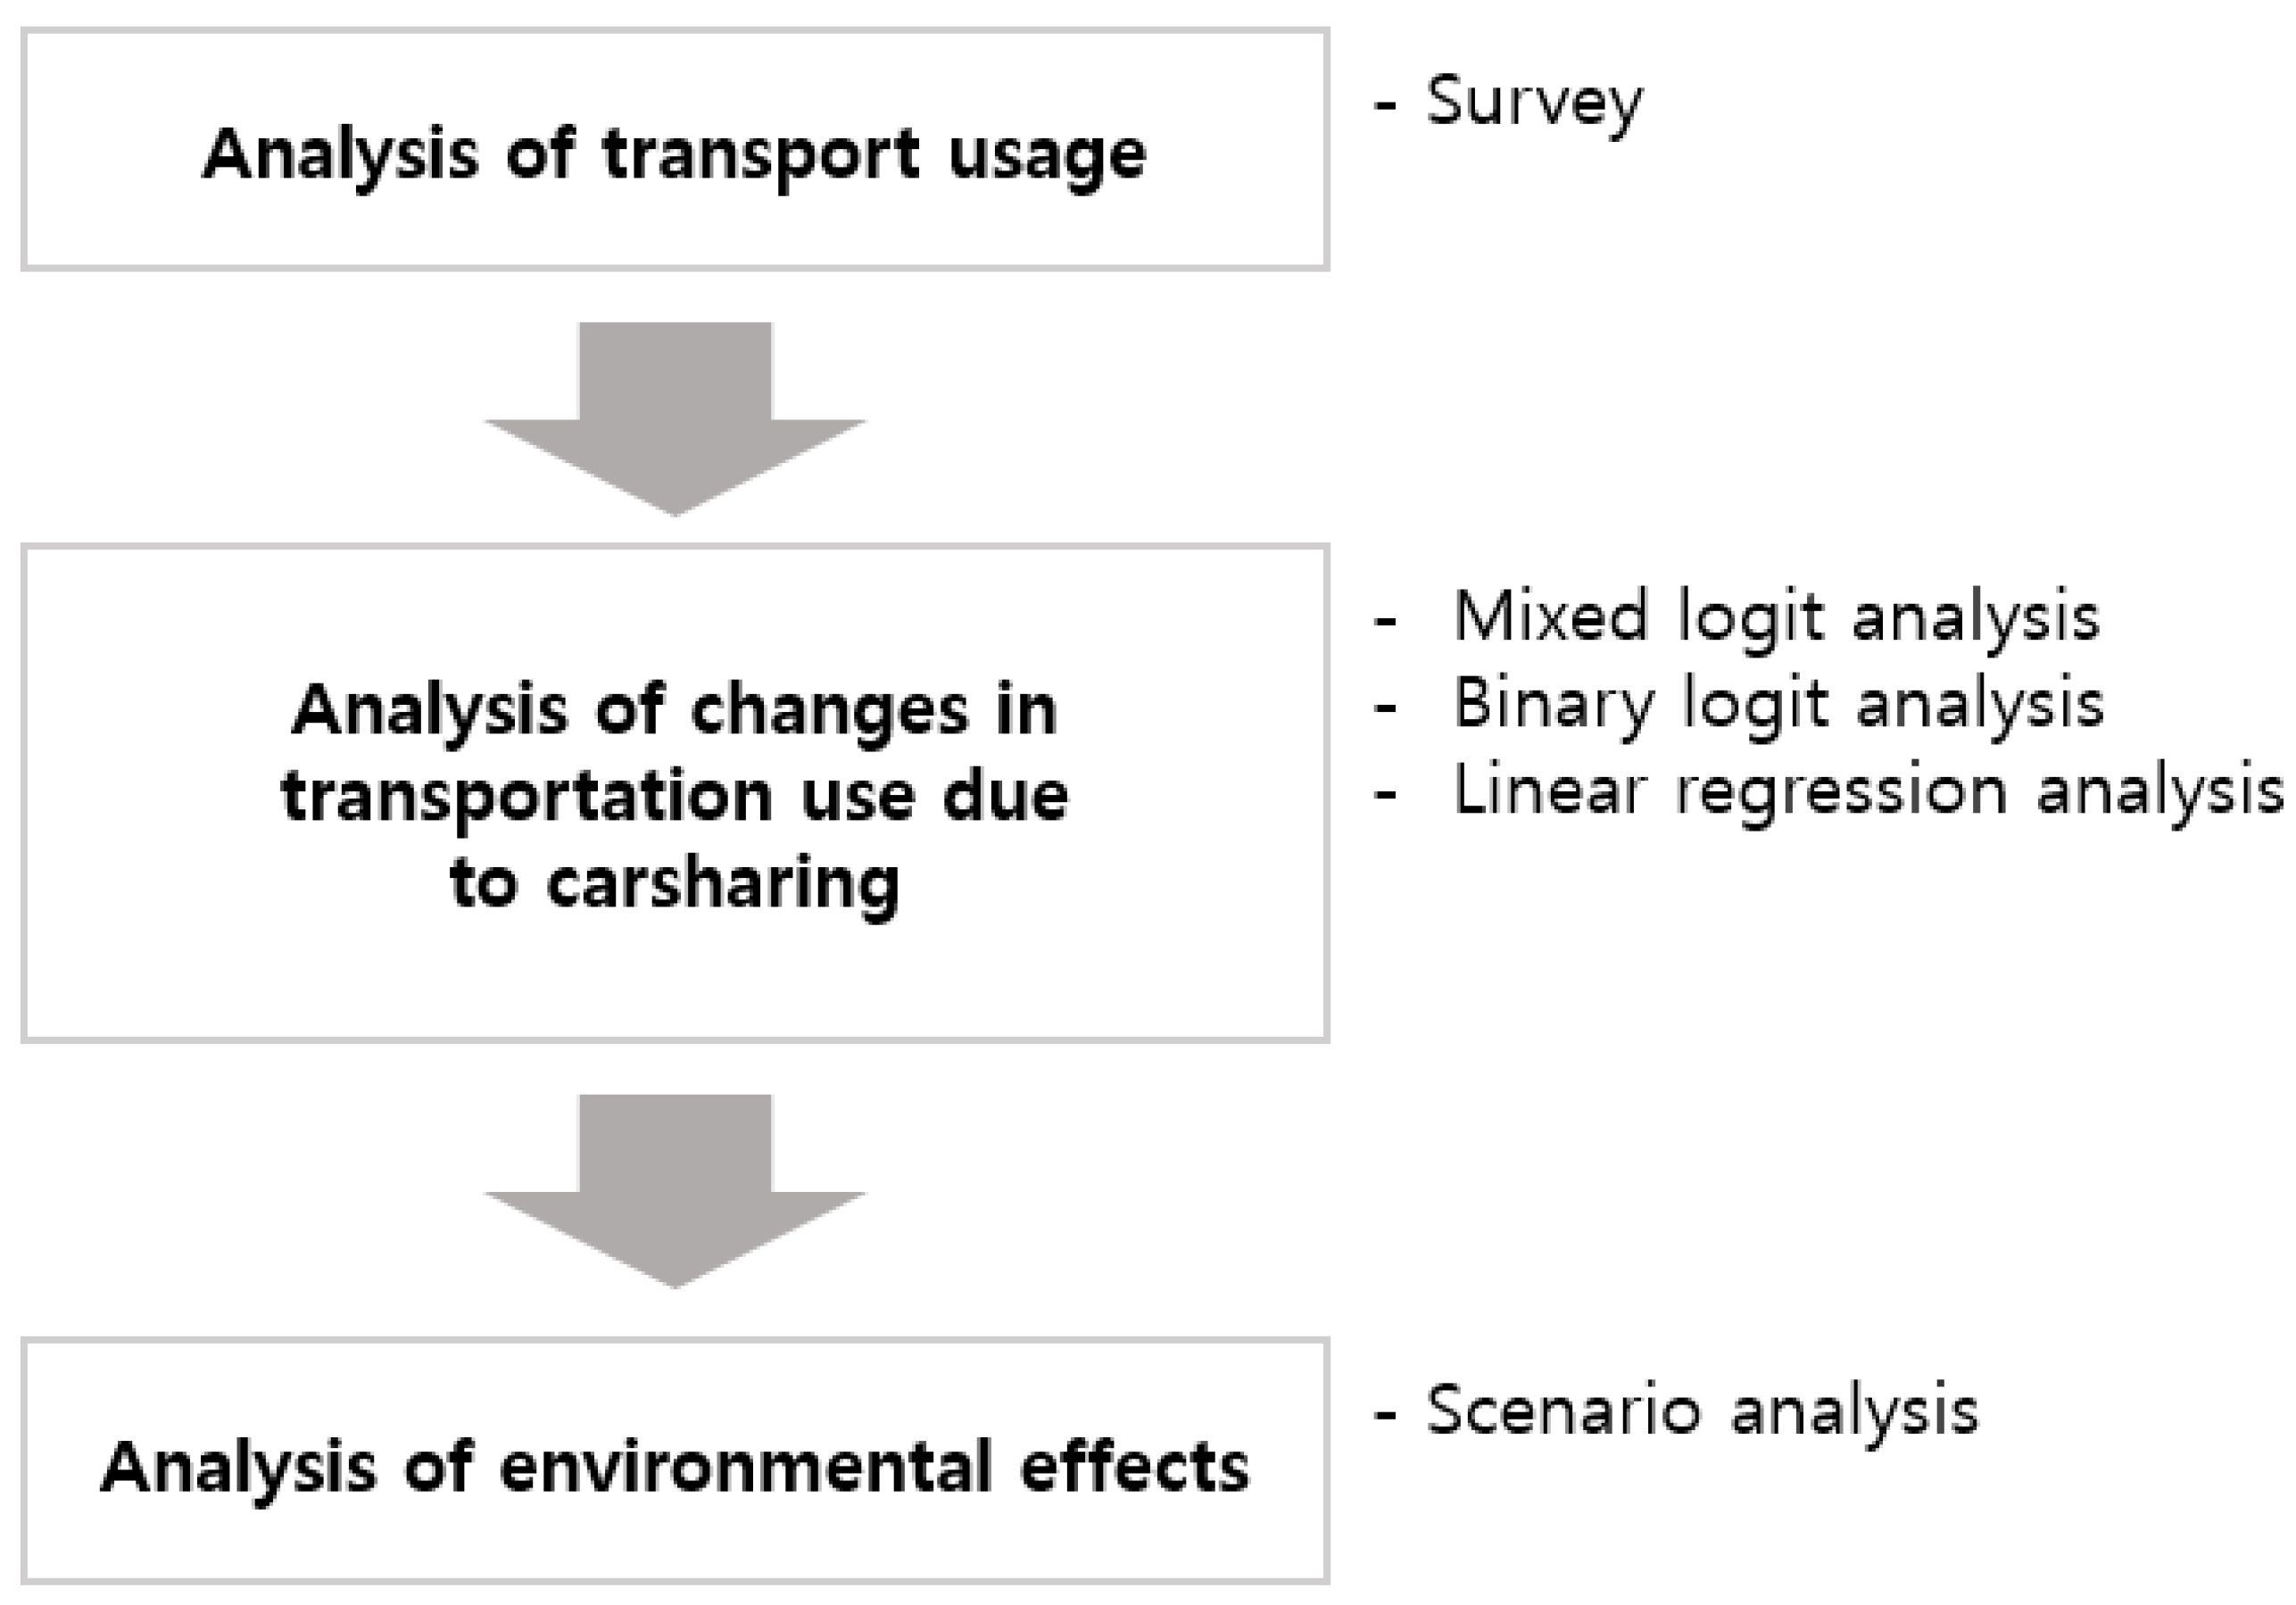
2.3. Methodology
2.3.1. Empirical Model
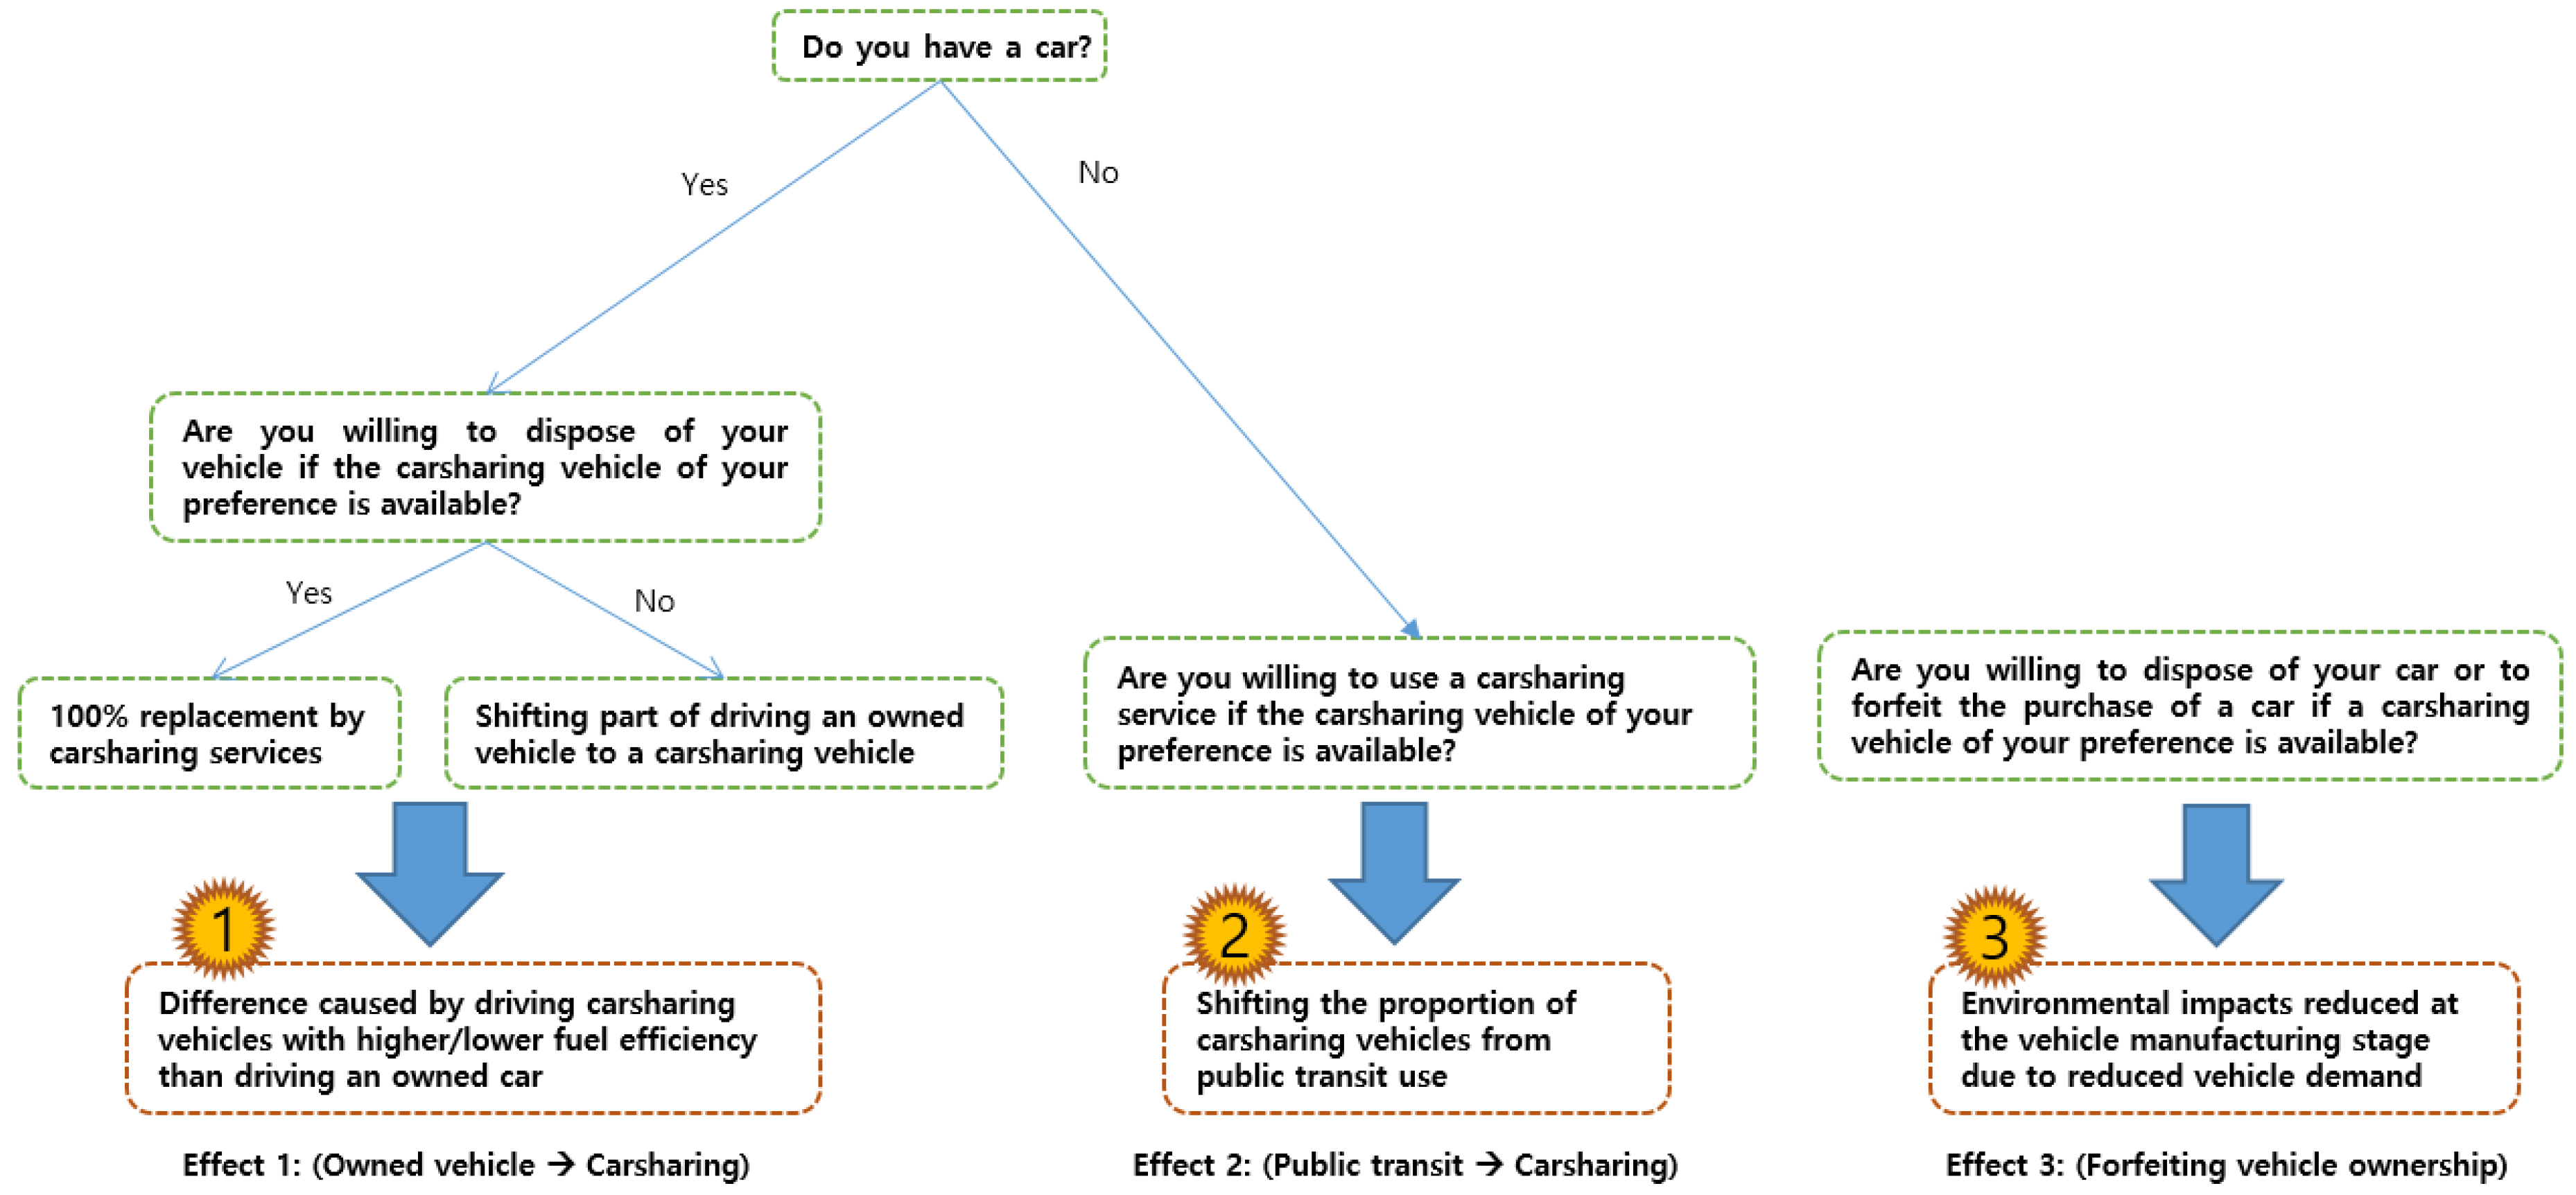
2.3.2. Framework for Analyzing GHG Emission Impacts
3. Results
3.1. Empirical Results
3.2. Estimating Car Sharing Impacts on GHG Emissions
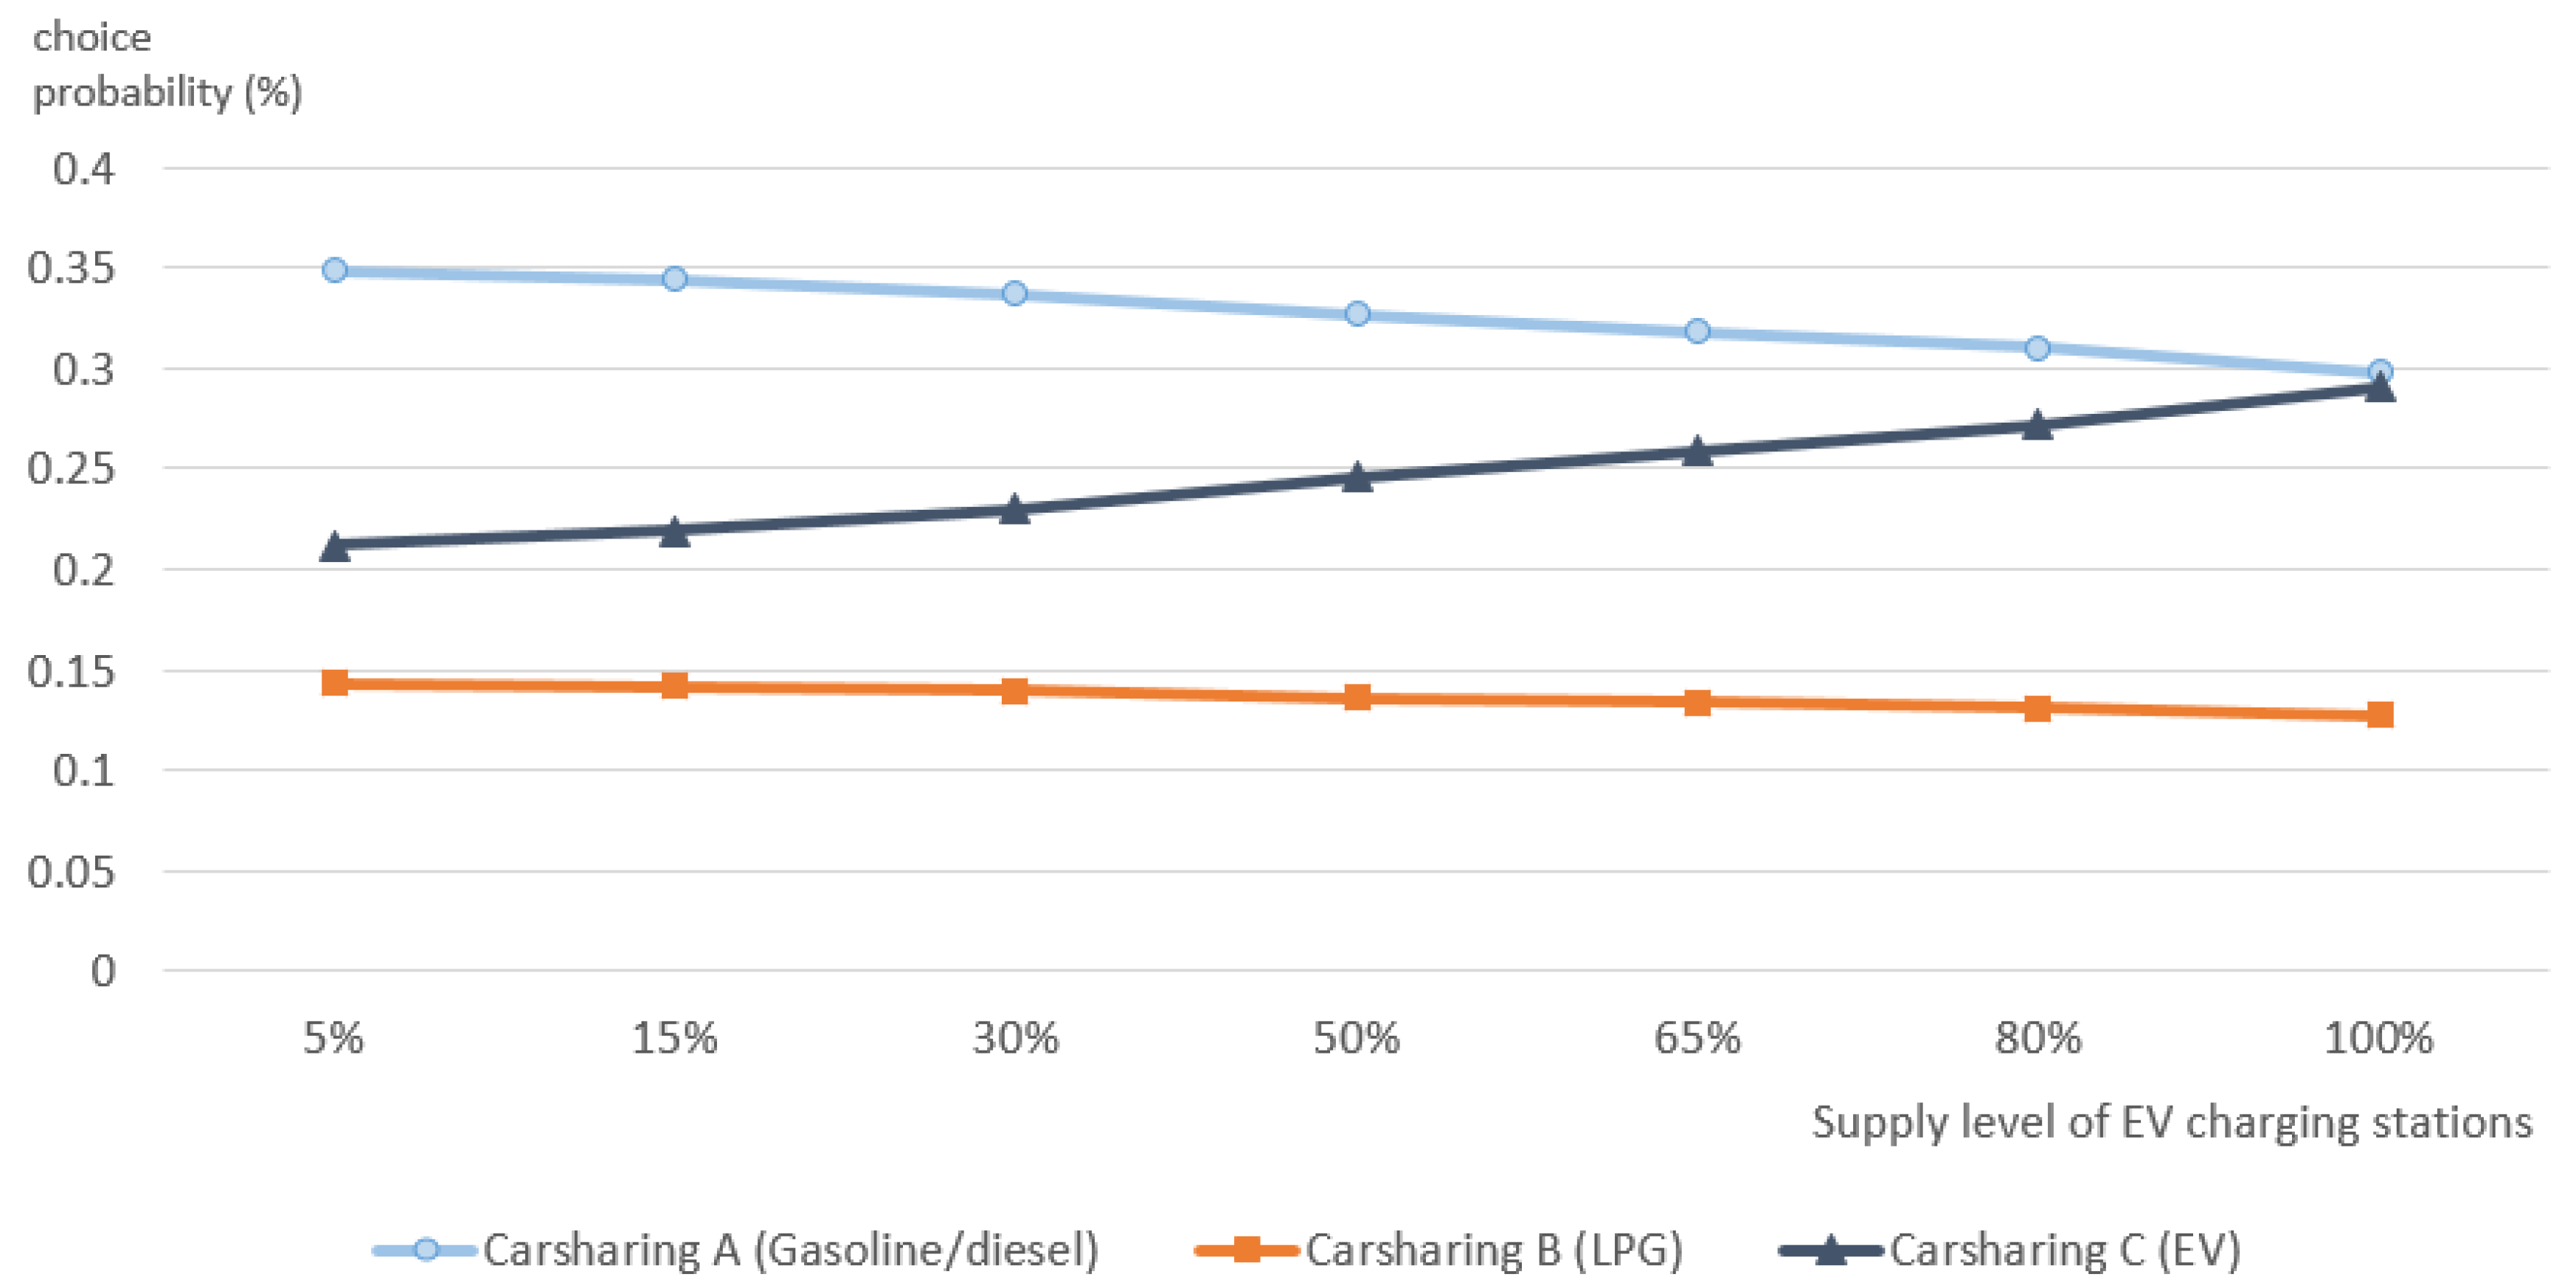
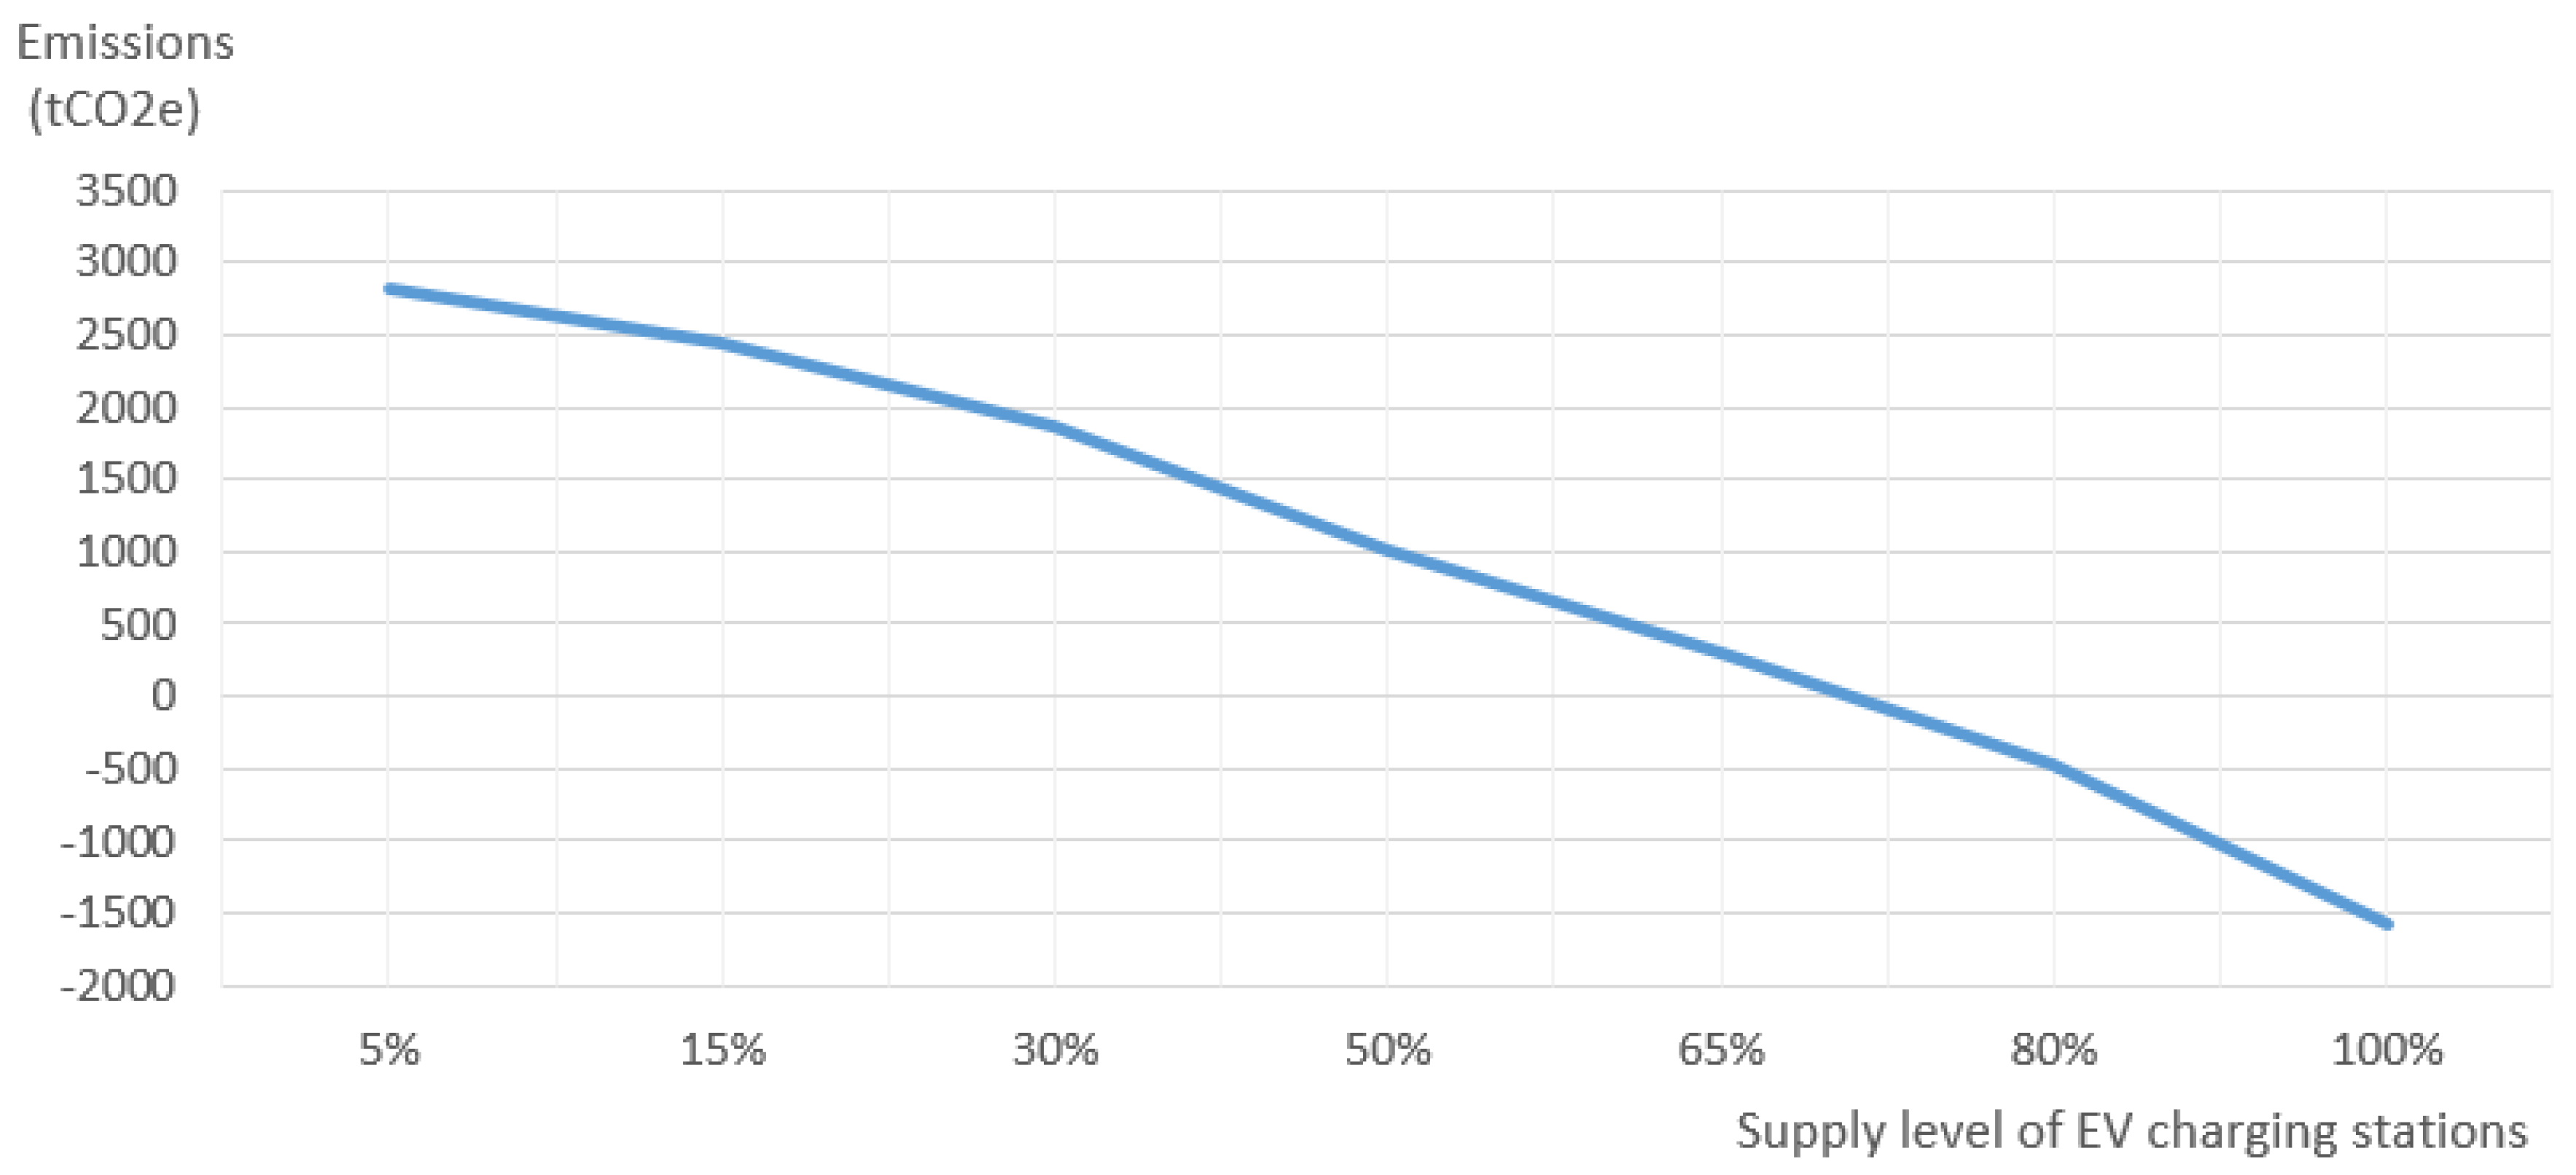
3.3. Effect of Increased EV Infrastructure on GHG Emissions
4. Discussion and Conclusions
4.1. Concluding Remarks and Contributions
4.2. Limitations and Future Research Topics
Acknowledgments
Author Contributions
Conflicts of Interest
References
- Lee, S. A review of carsharing research: With a focus on domestic thesis and research papers. Inst. Korean Reg. Stud. 2015, 62, 3–17. [Google Scholar]
- Litman, T. Evaluating carsharing benefits. Transp. Res. Rec. 2000, 1702, 31–35. [Google Scholar] [CrossRef]
- Shaheen, S.A.; Chan, N.D.; Micheaux, H. One-way carsharing’s evolution and operator perspectives from the Americas. Transportation 2015, 42, 519–536. [Google Scholar] [CrossRef]
- Kim, Y. Hyundai Capital Boosts Carsharing with ‘Delivery Car’. Available online: https://www.koreatimes.co.kr/www/tech/2017/12/694_241426.html (accessed on 28 January 2018).
- Navigant. Carsharing Membership and Vehicle Fleets, Personal Vehicle Reduction, and Revenue from Carsharing Services: Global Market Analysis and Forecasts. 2013. Available online: https://www.navigantresearch.com/research/carsharing-programs (accessed on 28 June 2017).
- Bank of Korea. Available online: www.bok.or.kr (accessed on 28 January 2017).
- Shon, J. KISTI Market Report. Continuous Increase in Interest and Market Size of Sharing Economy; Korea Institute of Science and Technology Information: Daejeon, Korea, 2017. [Google Scholar]
- Millard-Ball, A. Car-sharing: Where and how it succeeds. In Transportation Research Board; The National Academies Press: Washington, DC, USA, 2005. [Google Scholar]
- District Department of Transportation. On-Street Carsharing Program. Available online: https://ddot.dc.gov/page/street-carsharing-program (accessed on 28 January 2018).
- Seoul Solution. Seoul Solution Main Activity: Policy Sharing. Available online: https://seoulsolution.kr/content/shared-transport-carsharing-seoul-nanum-car?language=en (accessed on 22 November 2016).
- Koo, Y.; Lee, M.; Cho, Y. A point card system for public transport utilization in Korea. Transp. Res. D 2013, 22, 70–74. [Google Scholar] [CrossRef]
- Hong, J.; Koo, Y.; Jeong, G.; Lee, J. Ex-ante evaluation of profitability and government’s subsidy policy on vehicle-to-grid system. Energy Policy 2012, 42, 95–104. [Google Scholar] [CrossRef]
- Dissanayake, D.; Morikawa, T. Investigating household vehicle ownership, mode choice and trip sharing decisions using a combined revealed preference/stated preference Nested Logit model: Case study in Bangkok Metropolitan Region. J. Transp. Geogr. 2010, 18, 402–410. [Google Scholar] [CrossRef]
- Catalano, M.; Lo Casto, B.; Migliore, M. Carsharing demand estimation and urban transport demand modelling using stated preference techniques. Eur. Transp. 2008, 40, 33–50. [Google Scholar]
- Chen, T.D.; Kockelman, K.M. Carsharing’s life-cycle impacts on energy use and greenhouse gas emissions. Transp. Res. D 2016, 47, 276–284. [Google Scholar] [CrossRef]
- Katzev, R. Carsharing: A new approach to urban transportation problems. Anal. Soc. Issues Public Policy 2003, 3, 65–86. [Google Scholar] [CrossRef]
- Martin, E.W.; Shaheen, S.A. Greenhouse gas emission impacts of carsharing in North America. IEEE Trans. Intell. Transp. Syst. 2011, 12, 1074–1086. [Google Scholar] [CrossRef]
- Firnkorn, J.; Müller, M. What will be the environmental effects of new free-floating carsharing systems? The case of car2go in Ulm. Ecol. Econ. 2011, 70, 1519–1528. [Google Scholar] [CrossRef]
- Martin, E.; Shaheen, S.; Lidicker, J. Impact of carsharing on household vehicle holdings: Results from North American shared-use vehicle survey. J. Transp. Res. Board 2010, 2143, 150–158. [Google Scholar] [CrossRef]
- Shaheen, S.; Cohen, A.; Chung, M. North American carsharing: A ten-year retrospective. Transp. Res. Rec. 2009, 2110, 35–44. [Google Scholar] [CrossRef]
- Cervero, R. City CarShare: First-year travel demand impacts. Transp. Res. Rec. 2003, 1839, 159–166. [Google Scholar] [CrossRef]
- Martin, E.W.; Shaheen, S.A. The impact of carsharing on public transit and non-motorized travel: An exploration of North American carsharing survey data. Energies 2011, 4, 2094–2114. [Google Scholar] [CrossRef]
- Nijland, H.; van Meerkerk, J.; Hoen, A. Impact of Carsharing on Mobility and CO2 Emissions. PBL Netherlands Environmental Assessment Agency. PBL Publication Number 1842. 2015. Available online: http://www.pbl.nl/sites/default/files/cms/publicaties/PBL_2015_Note%20Impact%20of%20car%20sharing_1842.pdf (accessed on 28 June 2017).
- Martin, E.; Shaheen, S. Impacts of Car2Go on Vehicle Ownership, Modal Shift, Vehicle Miles Traveled, and Greenhouse Gas Emissions: An Analysis of Five North American Cities; Transportation Sustainability Research Center: Berkeley, CA, USA, 2016. [Google Scholar]
- Baptista, P.; Melo, S.; Rolim, C. Energy, environmental and mobility impacts of carsharing systems. Empirical results from Lisbon, Portugal. Procedia Soc. Behav. Sci. 2014, 111, 28–37. [Google Scholar] [CrossRef]
- McFadden, D.; Train, K. Mixed MNL models for discrete response. J. Appl. Econom. 2000, 15, 447–470. [Google Scholar] [CrossRef]
- Train, K.E. Discrete Choice Methods with Simulation; Cambridge University Press: Cambridge, MA, USA, 2009. [Google Scholar]
- Joint Research Center of the European Commission. Well-To-Wheels Report (Version 4a). JEC Well-To-Wheels Analysis of Future Automotive Fuels and Powertrains in the European Context; Joint Research Center of the European Commission: Brussels, Belgium, 2014. [Google Scholar]
- Edwards, R.; Mahieu, V.; Griesemann, J.C.; Larivé, J.F.; Rickeard, D.J. Well-To-Wheels Analysis of Future Automotive Fuels and Powertrains in the European Context; SAE Technical Paper No. 2004-01-1924; SAE: Warrendale, PA, USA, 2004. [Google Scholar]
- Woo, J.; Choi, H.; Ahn, J. Well-to-wheel analysis of greenhouse gas emissions for electric vehicles based on electricity generation mix: A global perspective. Transp. Res. D 2017, 51, 340–350. [Google Scholar] [CrossRef]
- Korea Energy Agency. Vehicle Energy Efficiency Labeling and Standard and Average Fuel Economy. Available online: http://www.energy.or.kr/renew_eng/energy/transport/vehicle.aspx (accessed on 1 November 2016).
- Socar. Available online: https://www.socar.kr/ (accessed on 12 January 2017).
- Greencar. Available online: https://www.greencar.kr (accessed on 12 January 2017).
- Ministry of Land, Infrastructure and Transport. Statistical Yearbook of MOLIT; Ministry of Land, Infrastructure and Transport: Sejong City, Korea, 2016.
- Park, J.; Ko, J. Comparing methods for apportioning transport CO2 emissions to sub-regional areas in Seoul. Seoul Inst. 2014, 15, 65–78. [Google Scholar]
- Korea Environmental Industry and Technology Institute. 2015 Carbon Footprint Certification Product Information. Available online: http://www.epd.or.kr/information/data.asp?bbs_code=6&mode=view&bbs_idx=1964&page=1&search_type=0&search_word=&bbs_class=%uC790%uB8CC%uC2E4 (accessed on 28 June 2017).
- Korea Energy Agency. Vehicle Fuel Economy and CO2 Emission: Data and Analysis; Korea Energy Agency: Yongin-si, Korea, 2016. [Google Scholar]
- Vermeulen, B.; Goos, P.; Vandebroek, M. Models and optimal designs for conjoint choice experiments including a no-choice option. Int. J. Res. Mark. 2008, 25, 94–103. [Google Scholar] [CrossRef]
- Korea Transport Emission Management Systems. Greenhouse Gas Emissions in Transportation Sector. Available online: https://www.kotems.or.kr/app/kotems/forward?pageUrl=/kotems/ptl/emission/nir/KotemsPtlEmissionNirEmissionYearLs&topmenu1=01&topmenu2=03&topmenu3=03 (accessed on 1 November 2016).


| Demographic Variables | Category | Respondents | Percentage |
|---|---|---|---|
| Total | 1022 | 100.0% | |
| Gender | Male | 534 | 52.3% |
| Female | 488 | 47.7% | |
| Age | 20s | 225 | 22.0% |
| 30s | 337 | 33.0% | |
| 40s | 284 | 27.8% | |
| 50s | 176 | 17.2% | |
| Occupation | Self-employed | 72 | 7.0% |
| Blue-collar | 80 | 7.8% | |
| White-collar | 636 | 62.2% | |
| House-maker/Student/Jobless | 234 | 22.9% | |
| Monthly household income (USD 10) | <199 | 244 | 23.9% |
| 200–299 | 257 | 25.1% | |
| 300–399 | 146 | 14.3% | |
| 400–499 | 121 | 11.8% | |
| 500–699 | 93 | 9.1% | |
| >700 | 54 | 5.3% | |
| No income | 107 | 10.5% | |
| Number of family members | 1 | 98 | 9.6% |
| 2 | 127 | 12.4% | |
| 3 | 285 | 27.9% | |
| 4 | 402 | 39.3% | |
| >5 | 110 | 10.8% | |
| Education | Below secondary education | 110 | 10.8% |
| Undergraduate level | 775 | 75.8% | |
| Graduate level | 137 | 13.4% |
| Attribute | Attribute Level | Description |
|---|---|---|
| Fuel type () | Gasoline or diesel | For EVs: can drive 200 km with one full charge and vehicle can be charged at the rental station. |
| LPG | ||
| Electricity | ||
| Fuel charging station supply rate () | 15% | Station supply rate refers to the availability of LPG fuel or EV charging stations (where the number and supply level of gasoline or diesel stations is 100%). |
| 50% | ||
| 80% | ||
| 100% | ||
| Vehicle type () | Economy, subcompact, or compact vehicle | e.g. Morning, Spark, Soul, Accent, Pride, Niro, Avante, K3, etc. |
| Mid-size or full-size vehicle | e.g. Sonata, K5, Grandeur, Genesis, K9, Chairman, etc. | |
| SUV (Sports utility vehicle) | e.g. Tucson, Spotage, Tivoli, SantaFe, Trax, Orlando, etc. | |
| Pickup & delivery Service () | Provided | If pickup and delivery services are provided, a car sharing vehicle will be delivered to the door. Otherwise, a car sharing vehicle can be collected at the nearest station, which is approximately 15-min walking distance. |
| Not provided | ||
| One-way drive () | Allowed | If one-way trips are allowed, the vehicle can be returned to a different station than the one from which it was rented. |
| Not allowed | ||
| Cost (USD/h) () | 5 | Refers to the total rental cost per hour (including fuel, rental duration and insurance). The price increases proportionally with additional rental duration. |
| 10 | ||
| 15 | ||
| 20 |
| Variable | Description | Source |
|---|---|---|
| Estimated variables used in calculation | ||
| Probability of choosing car sharing services and foregoing car ownership varies with car sharing attributes and individual characteristics. | Estimated value from conjoint experiment within the questionnaire survey | |
| , , | Car sharing use shifts from owned vehicles or public transit is calculated by multiplying travel distance and replacement rate. Replacement rate is based on car sharing attributes and individual characteristics. | |
| Mobility change indicates increased or decreased travel distances due to the convenience of car sharing services. This value varies with car sharing attributes and between individuals. | ||
| Fixed variables used in calculation | ||
| , | (car sharing emission factor) and (owned car emission factor) are calculated by dividing the emission factor (gCO2e/L) by the vehicle fuel efficiency (km/L or km/kWh). The emission factor varies depending on vehicle fuel [gasoline = 2778.2 gCO2e/L, diesel = 3241.3 gCO2e/L, LPG = 2942.6 gCO2e/L, electricity = 393.3–865.1 gCO2e/kWh]. | [28,29,30] |
| Fuel efficiency | The fuel efficiency of car sharing vehicles differs as follows: gasoline/diesel (13.7 km/L), LPG (9.6 km/L), EV (5.4 km/kWh). | [31,32,33] |
| Conversion factor | This converts travel time on public transit to travel distance [0.35 km/min]. | [34] |
| , | Bus emission factor [57.3 g per person·km] Subway emission factor [26.0 g per person·km] | [35] |
| Emissions from producing a car [4.6709 t CO2e per unit] | [36] | |
| Number of registered cars used to estimate the number of car owners [20,989,885 units] | [34] | |
| Number of daily bus users who have a driving license [9,620,591 people] | [34] | |
| Number of daily subway users who have a driving license [5,208,389 people] | [34] | |
| Number of vehicles sold per day in South Korea [4091 units] | [37] | |
| Variables | Mixed Logit Model 1 | Binary Logit Model 2 | Linear Regression Model | |||||||
|---|---|---|---|---|---|---|---|---|---|---|
| Mean (S.D.) | Std. Error | Estimate | Std. Error | Estimate | Std. Error | Estimate | Std. Error | Estimate | Std. Error | |
| Car sharing attribute variable | ||||||||||
| Fuel type 1: LPG | −0.281 *** (0.127) | 0.076 | 0.517 ** | 0.250 | 0.047 ** | 0.020 | 0.063 *** | 0.022 | - | - |
| Fuel type 2: Electricity | 0.132 *** (0.000 ***) | 0.035 | 0.347 ** | 0.144 | - | - | - | - | - | - |
| Station rate | 0.481 *** (0.000 ***) | 0.156 | 0.578 ** | 0.268 | 0.045 ** | 0.022 | 0.056 ** | 0.024 | - | - |
| Car type 1 (economy) | −0.181 *** (0.000 ***) | 0.037 | −0.109 | 0.108 | - | - | - | - | - | - |
| Car type 2 (mid-size) | −0.136 *** (0.855) | 0.041 | 0.006 | 0.117 | 0.033 *** | 0.012 | 0.037 *** | 0.013 | - | - |
| One-way trip option | 0.433 *** (0.000 ***) | 0.026 | −0.009 | 0.090 | 0.031 *** | 0.007 | 0.034 *** | 0.008 | 0.006 ** | 0.003 |
| Vehicle delivery | 0.350 *** (0.995) | 0.029 | 0.062 | 0.088 | - | - | - | - | - | - |
| Cost | −0.210 *** (0.000 ***) | 0.007 | −0.024 *** | 0.008 | −0.004 *** | 0.001 | −0.004 *** | 0.001 | −0.001 *** | 0.000 |
| No choice | −3.779 *** (0.000 ***) | 0.182 | - | - | - | - | - | - | - | - |
| Individual characteristic variables | ||||||||||
| Constant | - | - | −3.587 *** | 0.549 | 0.146 *** | 0.044 | 0.065 | 0.047 | 0.043 *** | 0.015 |
| Age | - | - | −0.004 | 0.005 | 0.001 | 0.000 | 0.000 | 0.000 | 0.000 ** | 0.000 |
| Education | - | - | 0.040 * | 0.023 | −0.007 *** | 0.002 | −0.002 | 0.002 | −0.002 *** | 0.001 |
| Eco-friendly | - | - | 0.377 *** | 0.053 | 0.026 *** | 0.004 | 0.029 *** | 0.005 | 0.008 *** | 0.002 |
| Individual income | - | - | 0.077 *** | 0.018 | 0.002 | 0.001 | 0.005 *** | 0.002 | 0.002 *** | 0.001 |
| Choice Alternative | Car sharing Vehicle A | Car sharingVehicle B | Car sharingVehicle C | - | |
|---|---|---|---|---|---|
| Attributes | |||||
| Fuel charging station supply rate | 100% | 15% | 5% | No choice | |
| Fuel type | Gasoline or diesel | LPG | Electricity | ||
| Vehicle type | Mid-size or full-size vehicle | Mid-size or full-size vehicle | Mid-size or full-size vehicle | ||
| Pickup & delivery service | Not provided | Not provided | Not provided | ||
| One-way trip | Not allowed | Not allowed | Not allowed | ||
| Cost per hour (KRW) | 10,000 | 10,000 | 10,000 | ||
| Choice probability | 34.90% | 14.36% | 21.17% | - | |
| Forfeit probability | 16.20% | - | |||
| Effects | Baseline Scenario | EV 50% Scenario | EV 100% Scenario | ||||||
|---|---|---|---|---|---|---|---|---|---|
| Min | Mean | Max | Min | Mean | Max | Min | Mean | Max | |
| Effect 1 (Shift from owned car) | −7001.73 | −5928.90 | −4856.08 | −8486.26 | −7058.19 | −5630.12 | −10,537.07 | −8617.48 | −6697.89 |
| Effect 2-1 (Shift from bus use) | 6460.21 | 7069.30 | 7678.39 | 6103.03 | 6770.51 | 7437.98 | 5629.43 | 6337.56 | 7045.70 |
| Effect 2-2 (Shift from subway use) | 4420.12 | 4763.77 | 5107.42 | 4224.74 | 4603.62 | 4982.50 | 3948.23 | 4353.00 | 4757.76 |
| Effect 3 (Vehicle disposal) | −3094.33 | −3094.33 | −3094.33 | −3302.74 | −3302.74 | −3302.74 | −3652.28 | −3652.28 | −3652.28 |
| Total Effect (daily) | 784.27 | 2809.83 | 4835.40 | −1461.24 | 1013.19 | 3487.63 | −4611.70 | −1579.20 | 1453.29 |
| Total Effect (yearly) | 286,257 | 1,025,589.36 | 1,764,921 | −533 352 | 369,815.97 | 1,272,984 | −1,683,269 | −576,408.46 | 530,452 |
© 2018 by the authors. Licensee MDPI, Basel, Switzerland. This article is an open access article distributed under the terms and conditions of the Creative Commons Attribution (CC BY) license (http://creativecommons.org/licenses/by/4.0/).
Share and Cite
Jung, J.; Koo, Y. Analyzing the Effects of Car Sharing Services on the Reduction of Greenhouse Gas (GHG) Emissions. Sustainability 2018, 10, 539. https://doi.org/10.3390/su10020539
Jung J, Koo Y. Analyzing the Effects of Car Sharing Services on the Reduction of Greenhouse Gas (GHG) Emissions. Sustainability. 2018; 10(2):539. https://doi.org/10.3390/su10020539
Chicago/Turabian StyleJung, Jiyeon, and Yoonmo Koo. 2018. "Analyzing the Effects of Car Sharing Services on the Reduction of Greenhouse Gas (GHG) Emissions" Sustainability 10, no. 2: 539. https://doi.org/10.3390/su10020539
APA StyleJung, J., & Koo, Y. (2018). Analyzing the Effects of Car Sharing Services on the Reduction of Greenhouse Gas (GHG) Emissions. Sustainability, 10(2), 539. https://doi.org/10.3390/su10020539