Quantitative Evaluation of the Sustainable Development Capacity of Hydropower in China Based on Information Entropy

Abstract
1. Introduction
2. Literature Review
2.1. Researches on Sustainable Hydropower Development
- (1)
- The related concepts of sustainable hydropower development have been widely researched. Some international organizations and institutions put forward their opinions and suggestions about the concepts. In 2004, “the United Nations International Conference on Hydropower and Sustainable Development” was held in Beijing. In the conference, “promoting the development of environment-friendly, socially responsible and economically viable hydropower” was pointed out. The government and hydropower industry were called upon to promote good practices, appropriate policies, regulations and guidelines and included them into the economic, social and environmental sustainability of hydropower development. “The Guide to Hydropower Sustainability,” put out in 2004, stated that “IHA (International Hydropower Association, London, UK) considered sustainable hydropower development as an essential element of social responsibility, sound business operations and natural resource management” [4]. Based on the guidance document, the IHA claimed “the Hydropower Sustainability Assessment Code” as a practical tool for assessing hydropower sustainability in 2006 [5,6,7]. In 2009, the World Bank released “the Direction of Hydropower Development,” which concentrated on the World Bank’s policies and views on hydropower development. The report said: “Hydropower development is complex and involves a number of economic, social and environmental risks. Some of that are inherent to the industry and more risk can be addressed through prudent implementation of good practices, a sustainable triple bottom line, social and environmental benefits.” [8]. In 2010, IHA issued “the Hydropower Sustainability Assessment Protocol,” which was a sustainability assessment framework for hydropower projects and outlined key sustainability considerations. It was designed to serve as an independent assessment in specific phases of the project’s life cycle [9].
- (2)
- The effective operation and management mode for sustainable electrical generation in reservoirs have been a hot research topic recently. For the important cascade hydropower stations, some scholars have done targeted researches on the operation mode. As the world’s largest mixed cascade hydropower generation system—the Three Gorges and Qingjiang cascade reservoirs in China was completed, Shang et al. [10] adopted two methods—routine and optimal operations to determine the effects of joint operation. And the results showed that although joint operation could increase hydropower generation to a certain extent, there was little room for improvement in hydropower generation. So, amending existing reservoirs operational mode was obviously important for enhancing the economic benefits of cascade hydropower stations. Aiming at the Lancang River cascade, Li et al. [11] developed an operation model for hydropower environmental flow tradeoff analysis and found that there was a competitive relationship between maximization of hydropower generation and minimization of environmental flow alteration. Zhou et al. [12] established an improved particle swarm optimization to solve maximum hydropower generation program. Joint operation of Liuku power station had great benefits for power compensation of the Three Gorges cascade and optimized power generation scheduling scheme of the Yangtze River. Considering the existing water demand conflicts in the Ethiopia, Seyoum et al. [13] used the HECResSim (reservoir simulation) model to simulate cascade reservoirs operation for improving hydropower energy generation. This model determined that the new reservoir operation system would evenly allocate and release the available water. In the study of operational modes, scholars have also made a lot of efforts about the maximization of power generation. Xu et al. [14] selected the power generation as the main objective and used the ε-constraint method to establish the joint and multi-objective operation of Xiluodu, Xiangjiaba, the Three Gorges Project and Gezhouba reservoirs. It was extreme value for the water energy development in the upper reaches of the Yangtze River, flood control safety in the middle and lower reaches and water supply guarantee. Yang et al. [15] derived reservoir operating rules based on the combination of CIS and Gaussian radial basis functions (RBFs) methods and addressed the input variable selection in multi-objective cascade reservoir operation for maximizing both power generation and water supply. Wang et al. [16] used the concept of value at risk and an extreme value theory—genetic algorithm (EVT-GA) to establish a short-term reservoir optimal operation model, which not only improved the utilization rate of water resource but also helped the hydropower stations to develop more reasonable power generation schedules for decision makers. The uncertainty of rainfall forecast information would directly affect the efficiency of power generation scheduling, so Xu et al. [17] used a parameter-simulation-optimization (PSO) model and hedging rule curves (HRCs) to construct hydropower operation model and presented that the 70–85% probability-based scheduling decision in a reservoir had high efficiency and stability.
- (3)
- The methods about the scheduling model of hydropower stations have been studied. There are usually two kinds of methods to solve the scheduling model of hydropower stations: the traditional optimization algorithms and the intelligent algorithm. The traditional optimization algorithms include the heuristic method, the micro-increment rate method, the Lagrange multiplier method, the network flow planning method, the linear programming method, dynamic programming, triangle swing algorithm, decomposition coordination algorithm [18,19]. The traditional algorithms have strict requirements on the objective function and the initial solution, so they easily fall into the local optimal solution when dealing with the energy-saving optimal scheduling problem of complex cascade hydropower. The others are the intelligent algorithms, including genetic algorithm, artificial immune algorithm, artificial neural network method, simulated annealing method, chaos algorithm, particle swarm optimization, fuzzy optimization method, ant colony algorithm, differential evolution algorithm [20,21,22,23]. The advanced methods and evaluative techniques in this yield have especially been deeply researched by Yang et al. Yang et al. [24] applied the Shuffled Complex Evolutionary Global Optimization Algorithm with Principal Component Analysis—University of California Irvine (SP-UCI)—to the weight training process of a three-layer feed-forward ANN and comparison with various Evolutionary Algorithms. It was found that the SP-UCI algorithm possessed a good potential in support of the ANN weight training in real-word problems, such as the rainfall runoff processes and probability distribution estimates, to support the complicated artificial decision-making process. Yang et al. [25] proposed an improved Evolutionary optimization Algorithm—Multi Objective Complex Evolution Global Optimization Method with Principal Component Analysis and Crowding Distance Operator (MOSPD) for the hydropower reservoir operation of the Orovillee Thermalito Complex (OTC) and the algorithm showed the best and most consistent performance. Yang et al. [26] used Random Forest, Artificial Neural Network and Support Vector Regression to compare with their capabilities for predicting inflows of two headwater reservoirs in USA and China one month-ahead. By comparing with the three methods, Random Forest had the best statistical performances. Yang et al. [27] proposed a robust reservoir outflow simulation model, which incorporated one of the well-developed data-mining models (Classification and Regression Tree) to predict the complicated human-controlled reservoir outflows and extracted the reservoir operation patterns. And they proved that the enhanced CART had a better predictive performance and reasonably supported the expert’s decisions.
2.2. Summary of Research Innovation
- (1)
- An evaluation index system of sustainable hydropower development capacity is established, based on the previous research results.
- (2)
- The index system is divided according to specific properties and through the dissipative theory and information entropy theory, the sustainable hydropower development capacity is evaluated.
3. Evaluation Index System of Sustainable Hydropower Development
3.1. Factors Analysis of Sustainable Hydropower Development
- (1)
- Considering the sustainable hydropower development from the perspective of social economy. Due to the construction of hydropower projects, pumped storage and cascade control can reduce natural disturbances, maintain a stable level of power generation and satisfy rising demands for electricity. The overnight cost of a hydropower plant does not include interest during construction (Insulation Distribution Connection). As a result, in terms of the unit cost of electricity generation, hydropower is still higher than all currently available energies [30]. Besides, investments in infrastructure (access roads, dams and canals), communications and skill building in large projects can support regional economic development [31]. Other benefits of hydropower include irrigation and flood control [32,33]. As a mature power generation technology, hydropower accounts for 16.3% of power generation worldwide [1] and Chinese hydropower development is primarily driven by market demand and strategic promotion. At the same time, the river also provides ecological services such as clean water, fisheries and entertainment [29]. However, there are also resettlement and ecological destruction problems, it is recommended that the government firstly focuses on solving these problems. On a community level, hydropower projects are often multi-purpose in nature, serving various needs including power, water supply and recreational benefits [34,35,36]. Land alteration is also commonly associated with dam construction [33,37]. Hydroelectric dam development can bring many benefits, such as providing a clean energy source, developing infrastructure, using water for multiple industries and improving social justice [38], but, at the same time it also creates negative impacts on society and environment. The establishment of dams and water reservoirs will cause direct impacts to people and landscape at the local area, flooding land that they previously occupied and causing them to be moved elsewhere [38].
- (2)
- Considering ecological environment view of the sustainable hydropower development. CO2 emissions are related closely with energy usage, from a life cycle perspective, the CO2 produced during construction and operation of hydropower projects is seldom, comparing to the use of non-renewables. Studies have also shown that the potential of hydropower development in the world economy can reduce GHG emissions (13%) and avoid SO2 emissions greater [30,39]. So, hydropower is a green energy source that contributes less GHG (Greenhouse Gas) emissions and reduce pollution during the operational phase [40,41]. But continuous cascade hydropower development may also affect the river nitrogen cycle, releasing nitrous oxide (a potent GHG) to the atmosphere [42]. When a reservoir is impounding, the land and riparian habitats within the impoundment area are transformed and aquatic habitats within the original canal become lentic environments, so habitats and resources based on local and regional ecosystems have been changed. It is reasonable that the area of land and length of channel inundated by reservoirs is assessed to estimate the quantity of habitat disturbed by impoundment. Besides, higher watershed relief, soil erosive potential and narrower basins may also facilitate increased terrestrial habitat modification [43]. The exacerbation of the reservoir water level may destabilize hillside bases and the infrastructure construction of hydropower often requires the expansion of transmission lines and the roads to dams and power generation sites. Both of these may increase potential for land disturbance and landslides in the vicinity of dams. Reservoir filling can also contribute to landscape instability by intensifying seismic activity [37]. And some successful hydropower projects are often linked to negative environmental consequences in the form of biodiversity loss, disrupted migration of fish, potential large-scale land submergence and many others [31]. Obstructions on watercourses have interfered with migratory pathways of fish species and reduced their life. And shift from target species to ecosystem restoration, which can improve ecological sustainability, has generated interest in developing fishways that are capable of passing entire fish communities [44,45,46]. Hydropower development alters terrestrial and aquatic ecosystems, thereby impacting a multitude of ecological and biophysical processes and feedback mechanisms [43]. Moreover, with the continuous development of hydropower stations, the state support for small-scale hydropower stations is gradually increasing and water wheels and Archimedes screw have become the sustainable and economic technology, since their construction is simpler over turbines, their environmental impact is lower [47,48,49].
3.2. Establishing the Index System
4. Sustainable Hydropower Development Evaluation Model
4.1. Measurement Based on the Information Entropy-Brusselator Model
4.2. Calculating the Hydropower System’s Capacity
5. Data Analysis
6. Results Analysis
- (1)
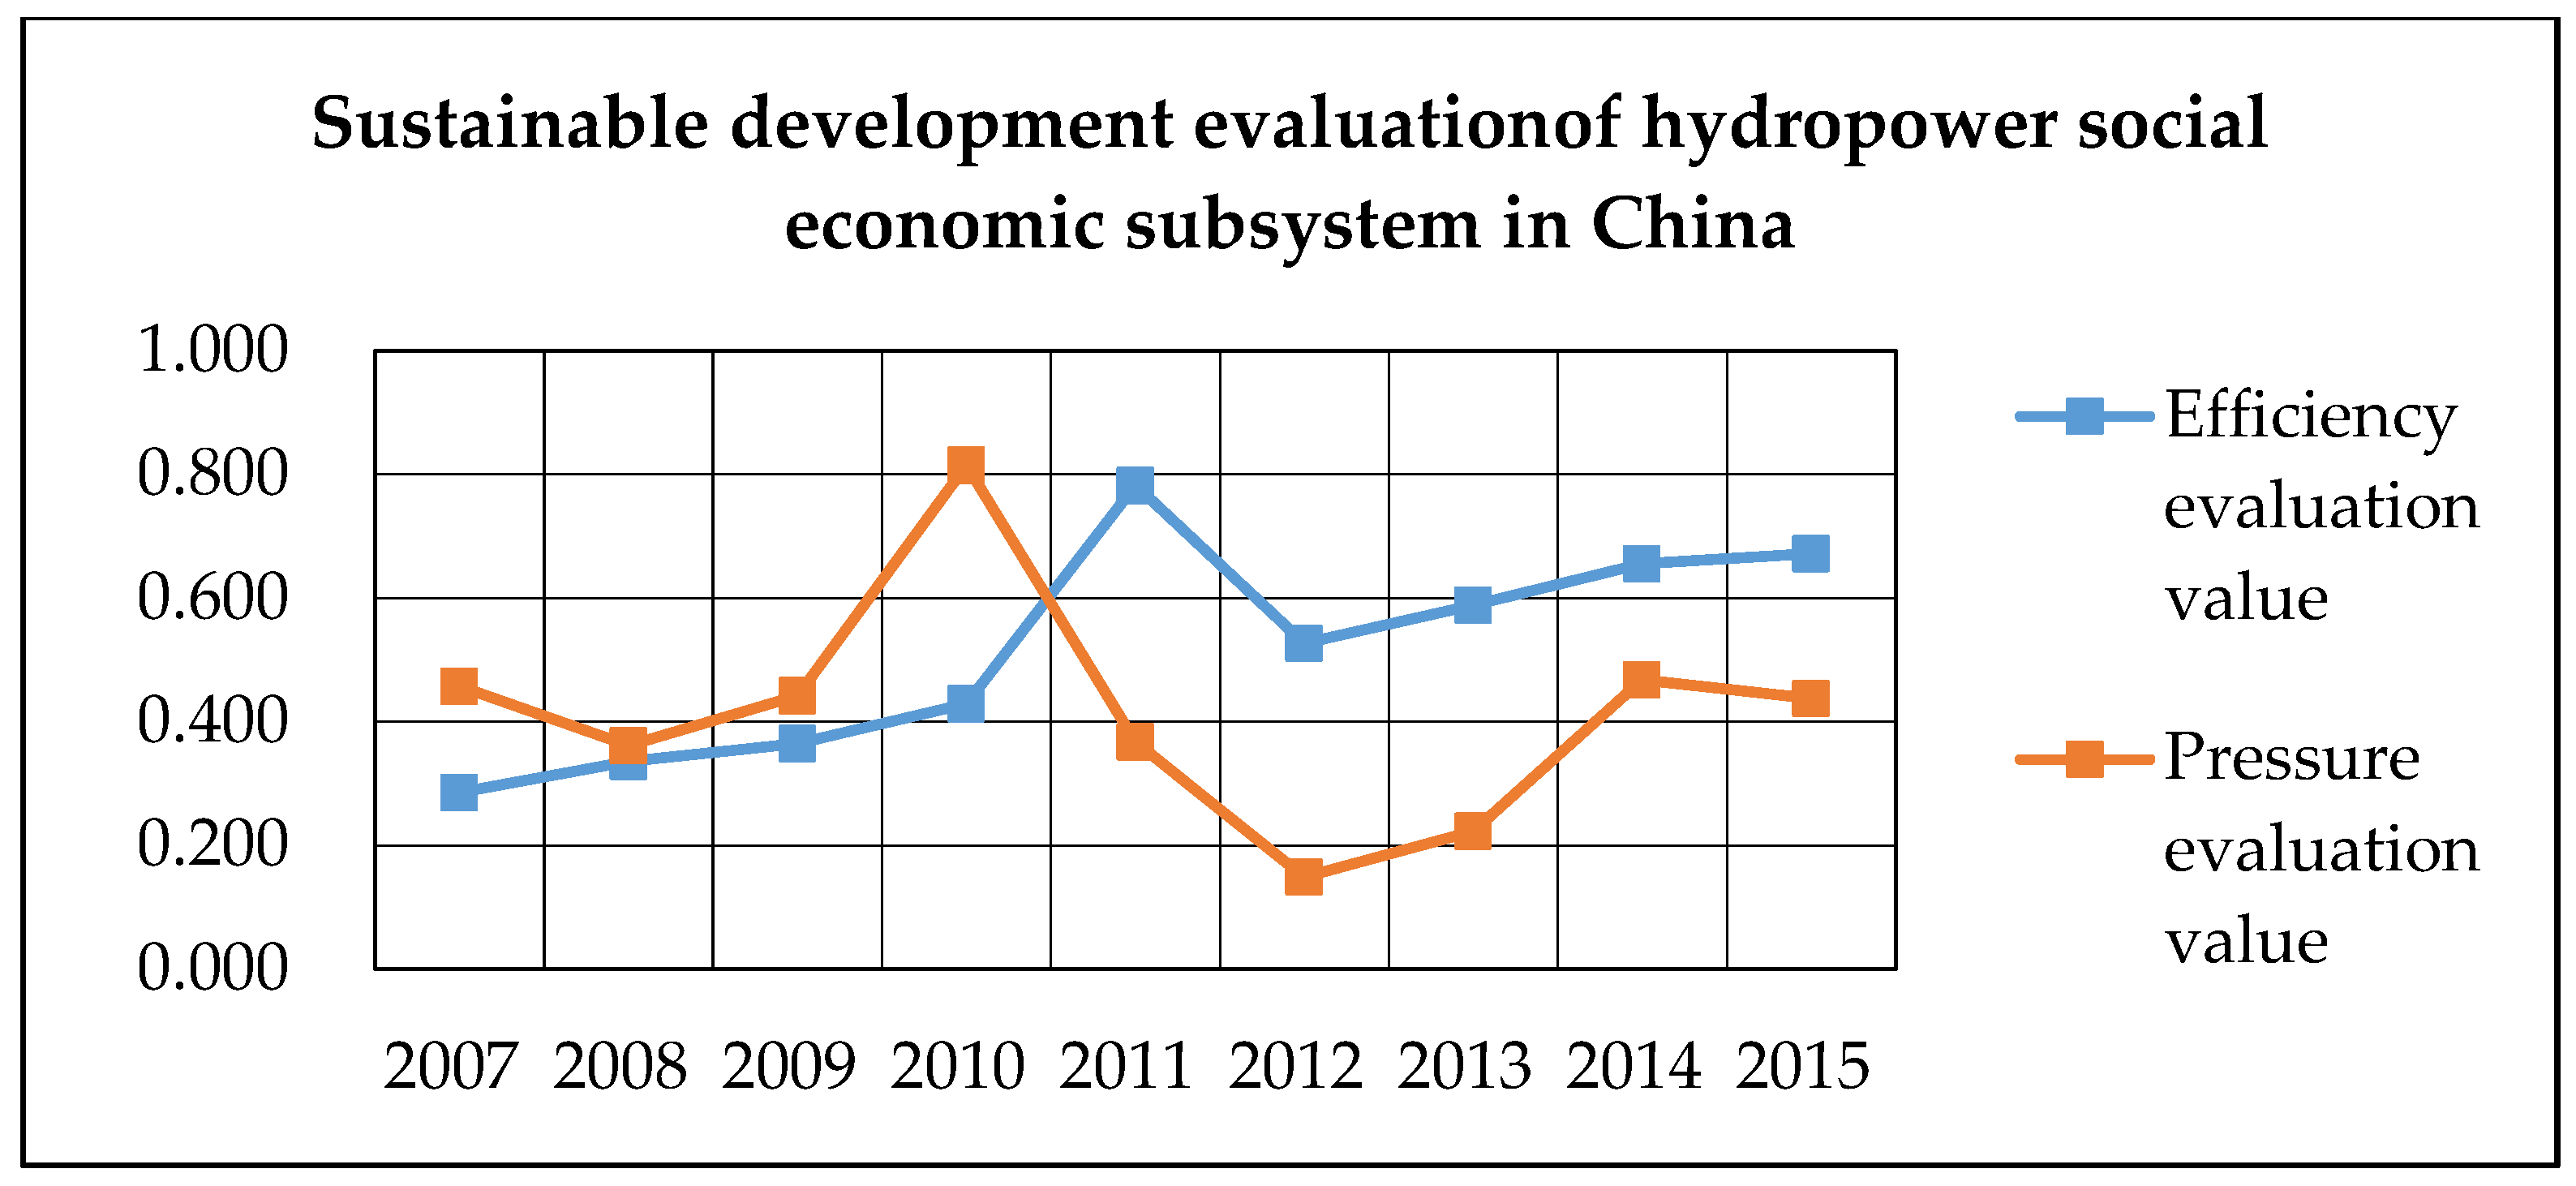
- The sustainable development level for the hydropower social economic subsystem shows decreased firstly, then rose as time passed and finally slightly declined. From Figure 4, we can see that the efficiency evaluation value reaches to the highest value in 2011 and then always has grown faster than the pressure value from 2011. Combining with the social economic subsystem development level in Figure 6, it indicates that the effect is pretty good, which means that effective measures are being taken in a timely manner. During the “11th Five-Year plan,” a large pumped storage power station was constructed in China. Due to the size of the reservoir, there was an immigration problem, which have features of passive evacuation, time limits, complex regional situation and insufficient compensation. These results had led to a decrease in the number of installed hydropower projects from 2007–2010 in China. Energy development underwent mode changes and structural adjustments, since the “12th Five-Year Plan” was a critical period of building a well-off society in an all-rounded way. As new China’s energy development strategy highlighted that hydropower should be actively developed for ecological protection, hydropower was nominated as an encouraged industry in the industrial structural adjustment guidance catalogue (2011 Edition) [66,67]. With the installed hydropower capacity increasing and hydropower project investment inputting, the sustainable development level of the social economic subsystem increased by 0.802 from 2010 to 2011 and then kept a healthy tendency. If this state is maintained, the social economic subsystem is expected to become stronger.
- (2)
- The sustainable development level of the ecological environment subsystem decreased firstly and then rose as time passed. From Figure 5, although the pressure evaluation value reaches to the highest value in 2010, the efficiency evaluation value always grows faster than the pressure evaluation value and the sustainable development capacity of the ecological environment subsystem is continuously enhanced. Combining with the evaluation value in the ecological environmental subsystem in Figure 6, it declined rapidly from 2009 to 2010, however it rose smoothly after 2010. With the abundance in resource and labor force developed rapidly in China, there had been major environmental problems such as acid rain, ozone depletion and geological hazards, causing a significant drop in the sustainable development level to −0.0012 in 2010. Since then, the damage had been repaired and the ecological environment subsystem development level rose by 0.445 in 2015. Hydropower development is closely related to natural ecological protection and ecological environment carrying capacity. The expansion of hydropower projects had resulted in river truncation and increased reservoir storage, which in turn had affected hydrographic conditions, air humidity and temperature, resulting in earthquakes and soil erosion. Geological hazards increased 3.0 × 10⁴ times and soil erosion increased by 106 × 104 km2 in 2010. The government then promulgated an “air pollution prevention action plan” and a “water pollution prevention action plan” to enforce control measures in all regions. During the “12th Five-Year plan” period, major pollutant emissions were greatly reduced, for example, SO2 emissions decreased by 326 × 104 t and flood-affected areas decreased by 5673 × 103 khm2 and environmental “Kuznets curve” had undergone positive changes in China. As some environmental factors continued to rise, the government’s support for environmental protection was gradually reflected. Thus, the policies promulgated by the state to protect the hydropower environment play a certain role in the sustainable development of hydropower. If the current trends continue, the development of the ecological environment subsystem is expected to improve.
- (3)
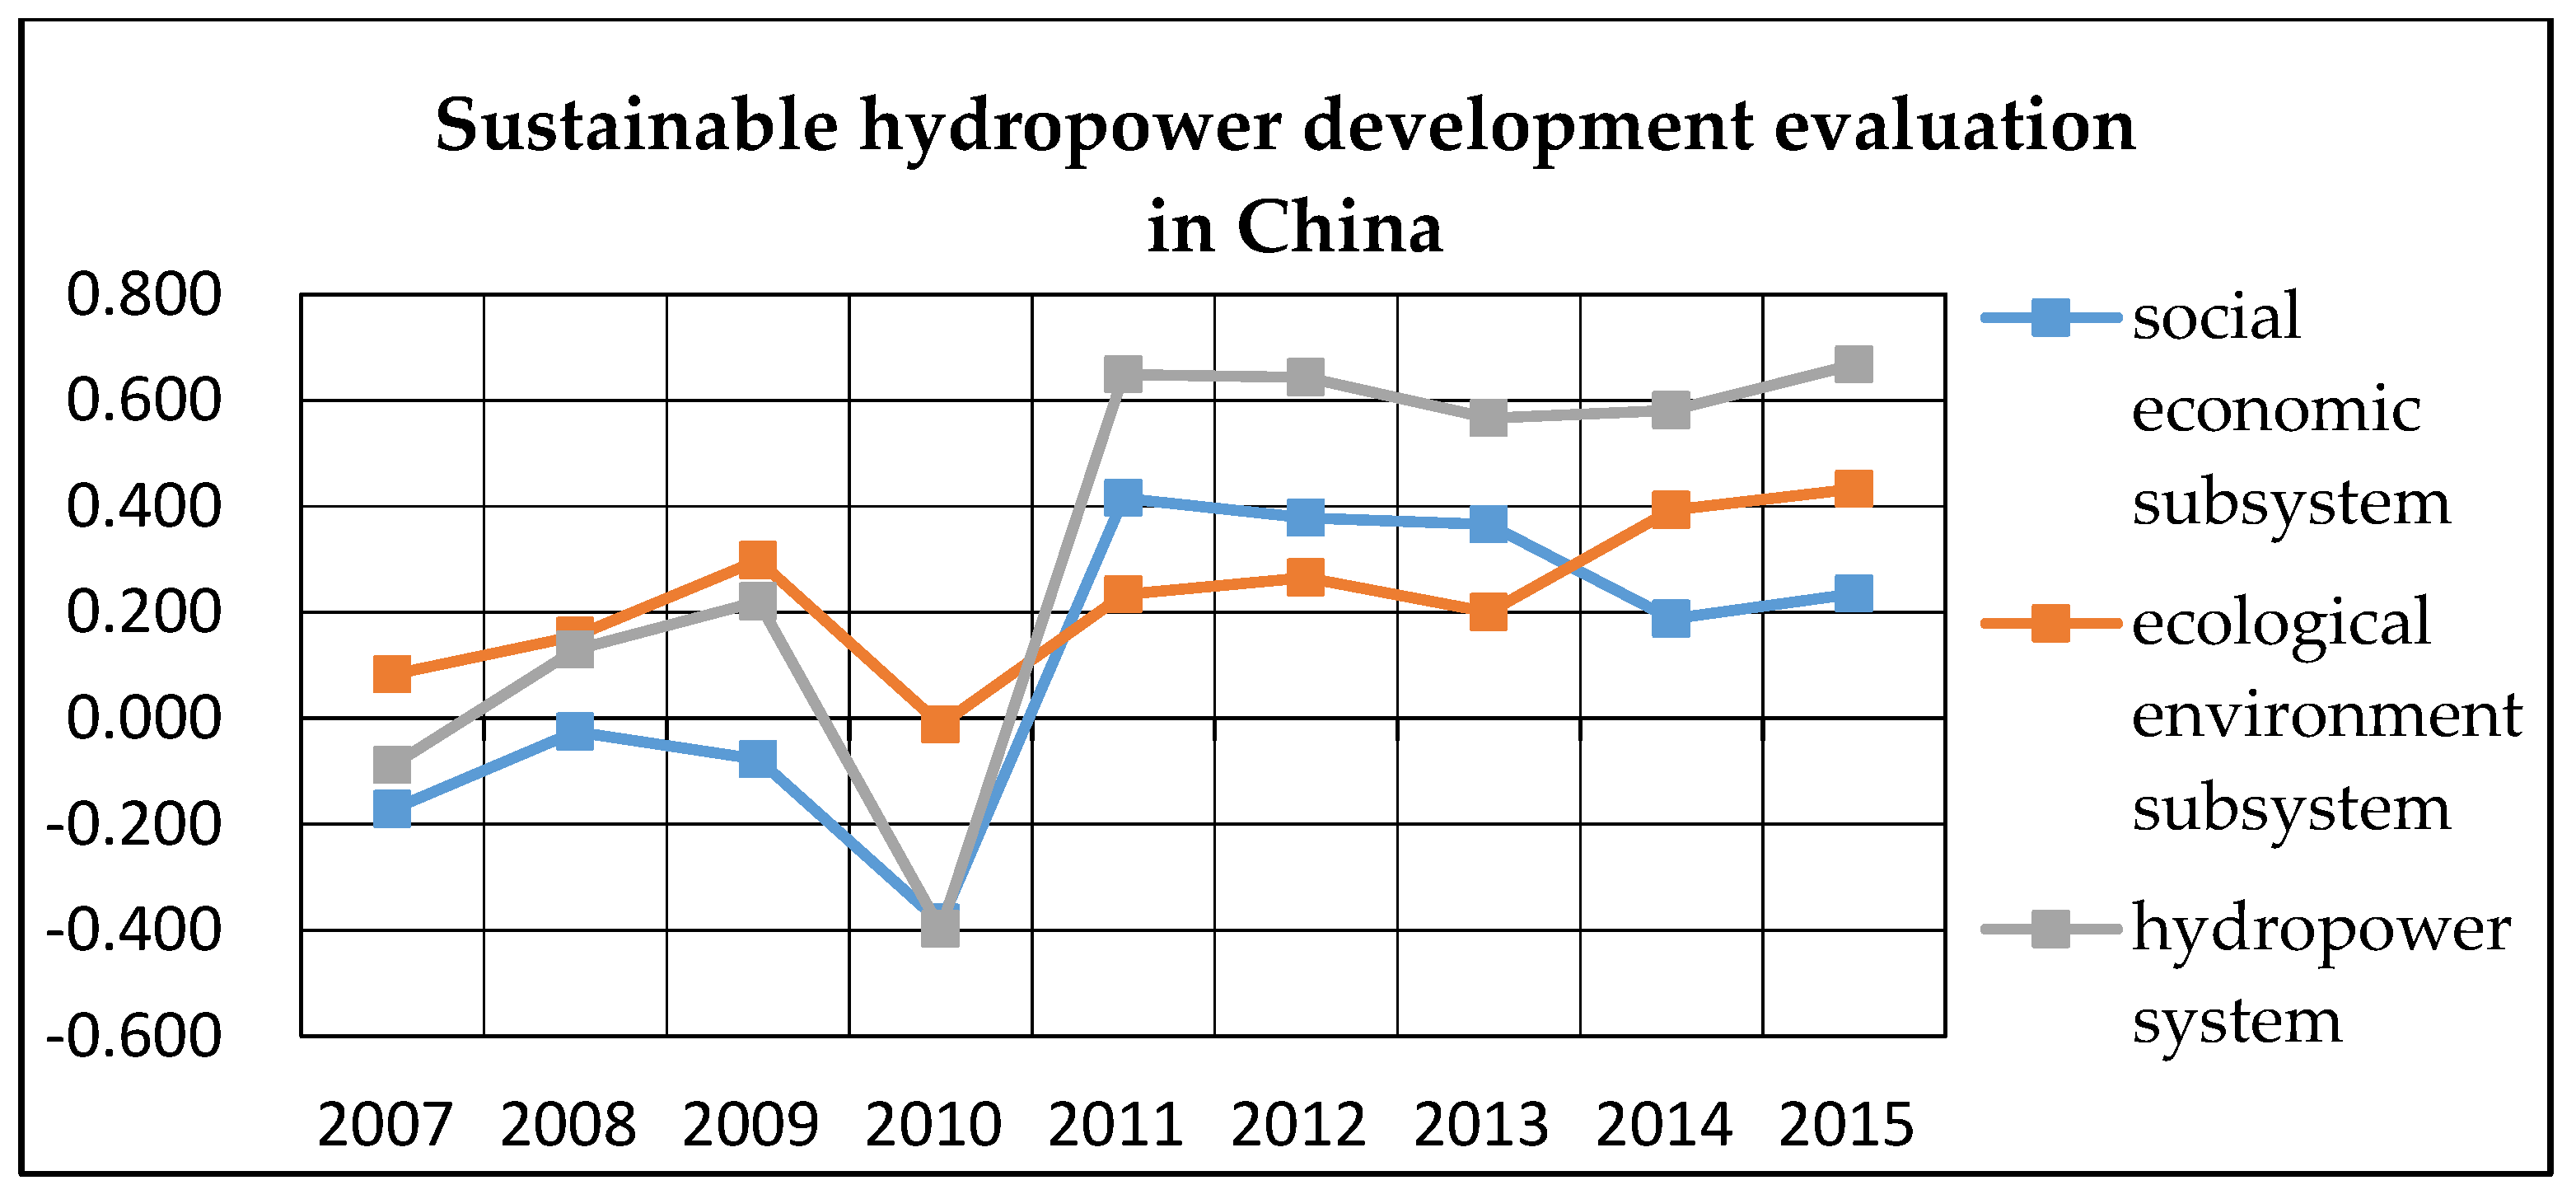
- In the beginning of 2007, the sustainable hydropower development level had a decreasing trend and then rose. The social economic subsystem and the ecological environment subsystem mutually interact to produce the final sustainable hydropower development level. Due to the rapid decrease in evaluation value of social economic subsystem and ecological environment subsystem from 2009 to 2010, hydropower development stagnated, after which the sustainable hydropower development level declined. With the transformation of energy structure and resources integration in 2010, there were no obvious advantages, therefore the sustainable hydropower development was at a low but stable level. After the introduction of the “12th Five-Year” plan which started in 2010, government efforts were made to change the industrial structure and increase input. Although restoration of the ecological environment is a time-consuming and gradual process, the overall level has been correspondingly increased, due to the rapid development in hydropower social economic subsystems. Sustainable development means that there is a reasonable balance and win-win situation between the social economic and ecological environment developments [68]. By comparing, efficiency values of the ecological environment subsystem fluctuate less than the social economic subsystem and the two subsystem pressure values fluctuate basically the same. Obviously, the change of the ecological environment subsystem may result in great changes in hydropower system, so the ecological environment subsystem should be needed to give more attention and protection when considering the sustainability of the hydropower station [69]. Therefore, improving hydropower technological development and equipment levels and perfecting the environmental protection law will not only lead to continuous improvements for hydropower construction projects in the environmental evaluation system but also eliminate all the ecological impacts of adverse hydropower development. If this trend continues, sustainable development can be achieved.
7. Conclusions
- (1)
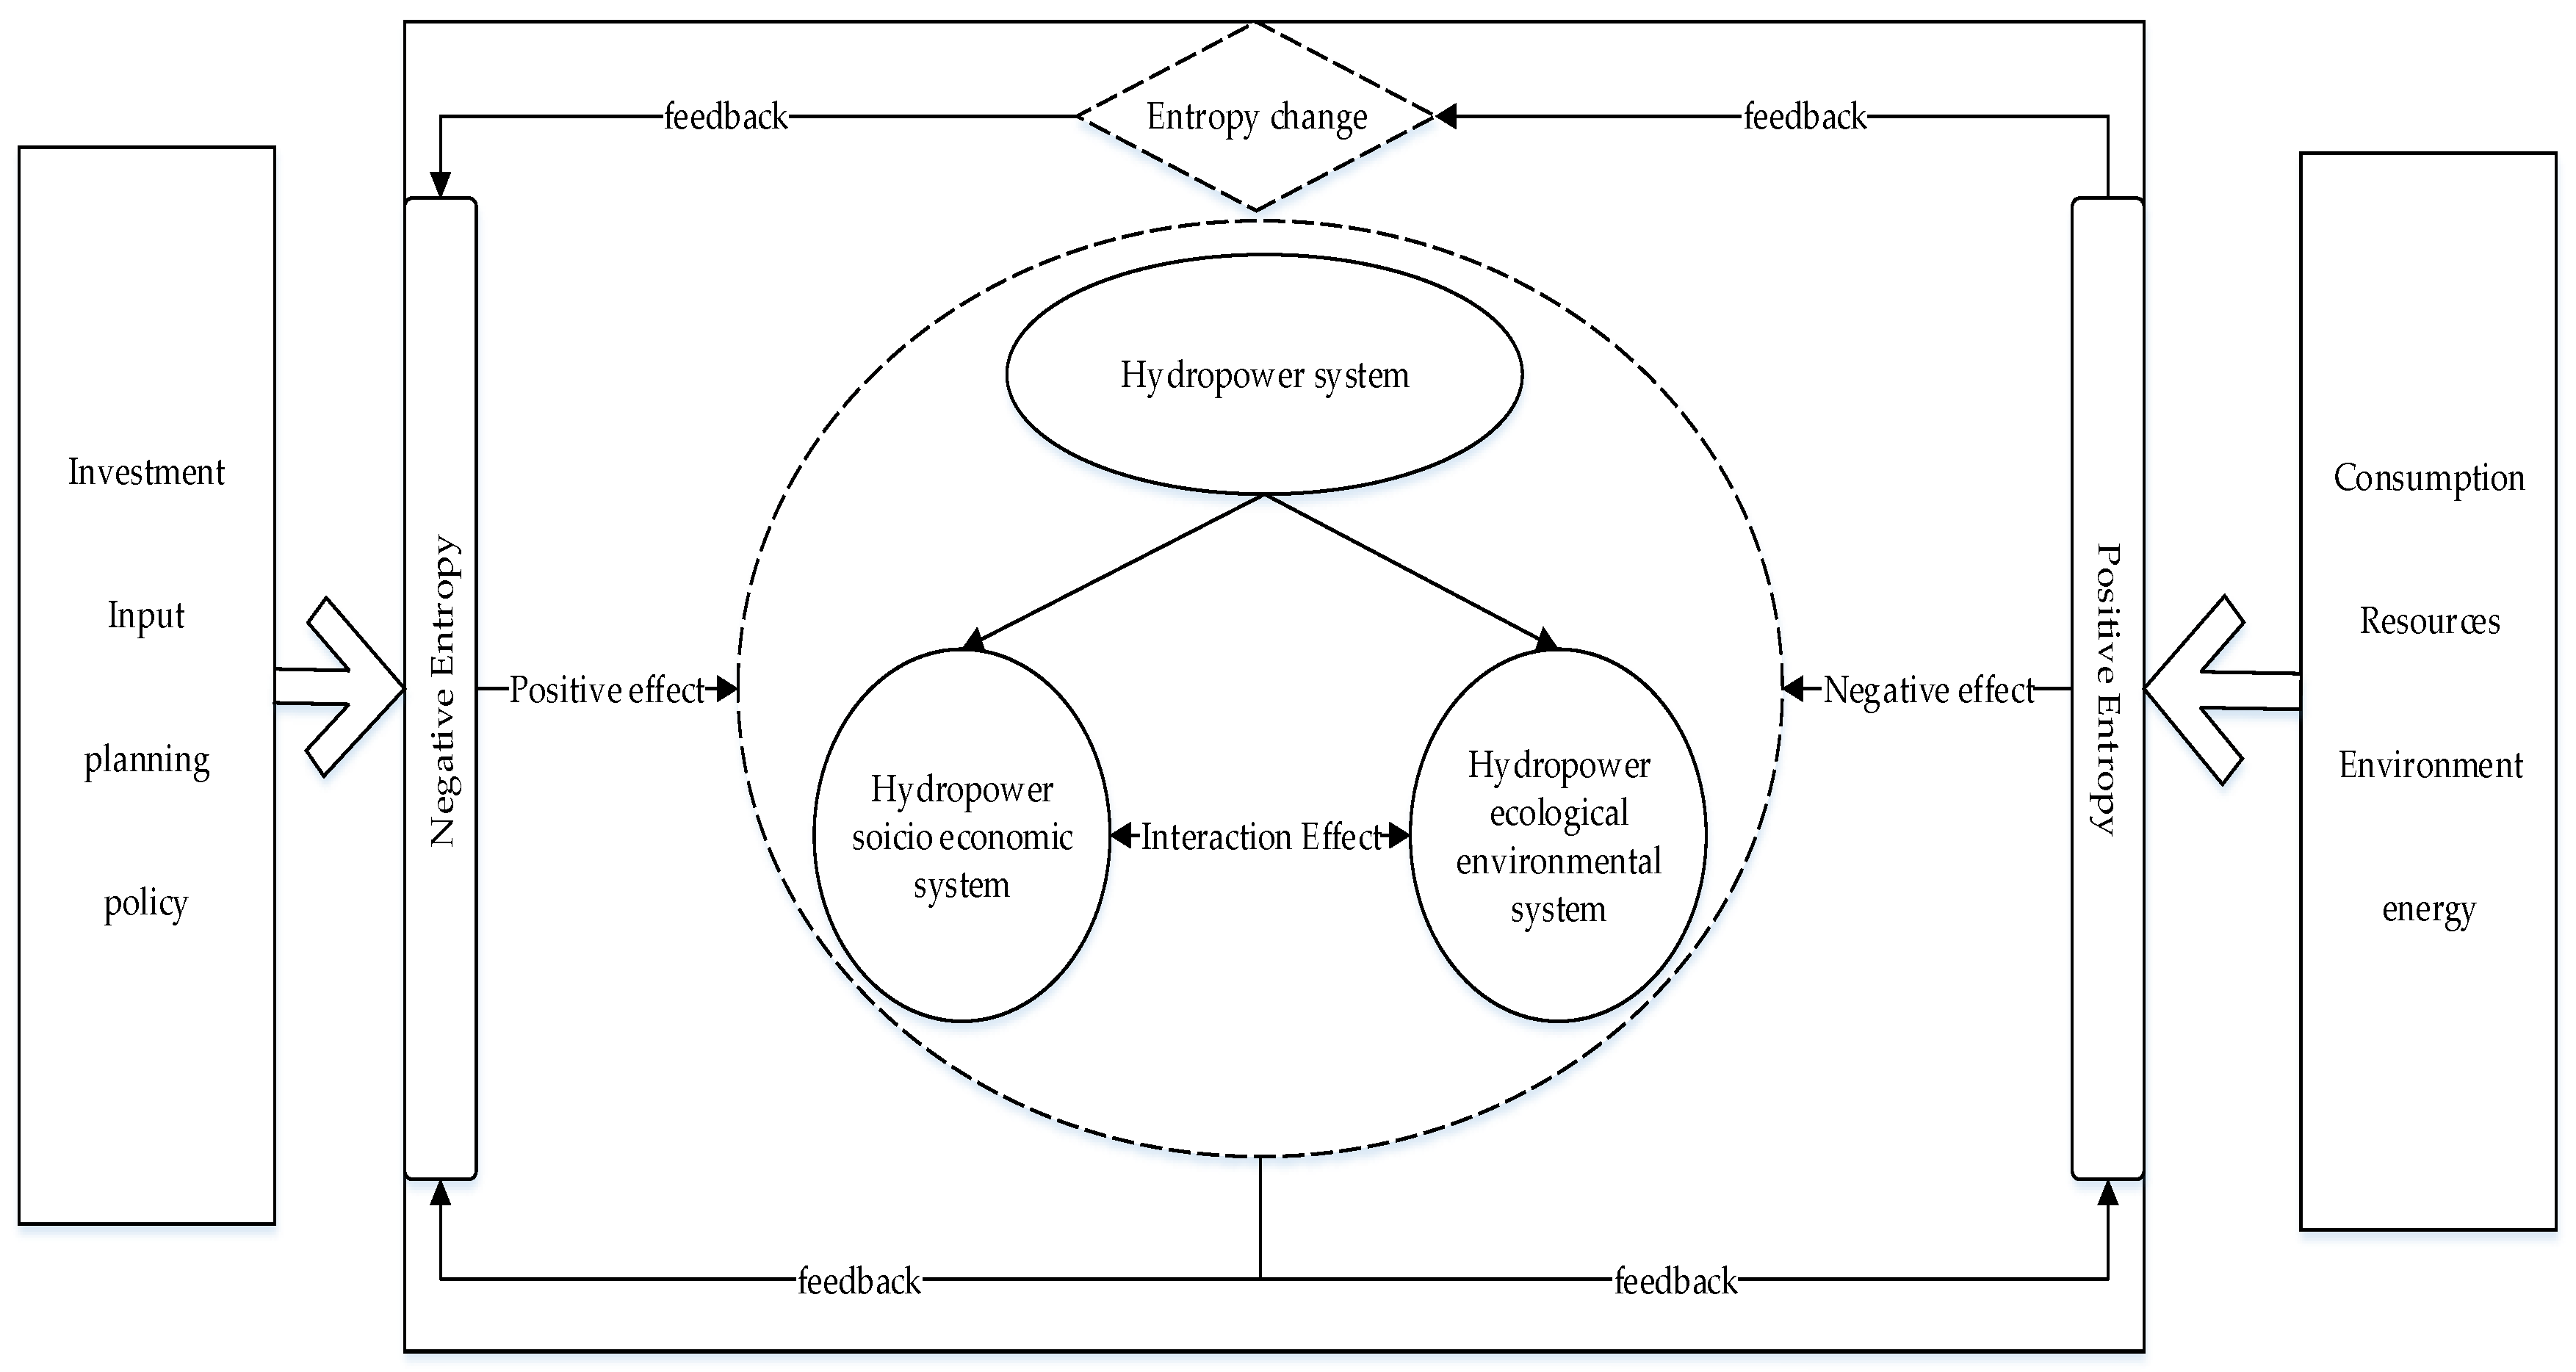
- Through the establishment of an information entropy-Brusselator measurement model, entropy value changes in the social economic and the ecological environment subsystem can be analyzed to determine sustainable development capacity of the hydropower system.
- (2)
- The information entropy model established in this paper can be used to find the factors affecting the operation of hydropower. It can help to find a more reasonable internal improvement focus for the system and provide a decision basis for effective improvements.
- (3)
- From the sustainability analysis of hydropower in China, it is found that the sustainable hydropower development can only be realized through the coordinated development between the social economic subsystem and the ecological environment subsystem.
Acknowledgments
Author Contributions
Conflicts of Interest
References
- Agency, I.E. Electricity Information 2012: (Complete Edition—ISBN 9789264174696). SourceOECD Energy 2012, 2012, i-883(883). [Google Scholar]
- Winemiller, K.O.; Mcintyre, P.B.; Castello, L.; Fluet-Chouinard, E.; Giarrizzo, T.; Nam, S.; Baird, I.G.; Darwall, W.; Lujan, N.K.; Harrison, I. Development And Environment. Balancing hydropower and biodiversity in the Amazon, Congo, and Mekong. Science 2016, 351, 128–129. [Google Scholar] [CrossRef] [PubMed]
- Liu, J.; Zuo, J.; Sun, Z.; Zillante, G.; Chen, X. Sustainability in hydropower development—A case study. Renew. Sustain. Energy Rev. 2013, 19, 230–237. [Google Scholar] [CrossRef]
- Association, I.H. Sustainability Guidelines; International Hydropower Association (IHA): London, UK, 2004; Available online: http://xueshu.baidu.com/s?wd=paperuri:(8b05d771e105b1aa0c1b544e361e0871)&filter=sc_long_sign&sc_ks_para=q%3DSustainability+guidelines&tn=SE_baiduxueshu_c1gjeupa&ie=utf-8&sc_us=778360872468900417 (accessed on 11 February 2018).
- International Hydropower Association (IHA). International Hydropower Association Sustainability Assessment Protocol; International Hydropower Association (IHA): London, UK, 2006. [Google Scholar]
- International Hydropower Association (IHA). Draft Hydropower Sustainability Assessment Protocol—August 2009; International Hydropower Association (IHA): London, UK, 2009. [Google Scholar]
- Jing, Y.; Xuezhong, Y.; Jianxin, X. Introduction and discussion of IHA guidelines and norms for sustainable development of hydropower. Express Water Resour. Hydropower Inf. 2009, 30, 1–5. [Google Scholar]
- Bank, T.W. Directions in Hydropower; World Bank: Washington, DC, USA, 2010; Available online: http://xueshu.baidu.com/s?wd=paperuri%3A%28d0674604886cf9a18bf6585260ad2cd0%29&filter=sc_long_sign&sc_ks_para=q%3DDirections%20in%20hydropower&sc_us=2980385128063796096&tn=SE_baiduxueshu_c1gjeupa&ie=utf-8. (accessed on 11 February 2018).
- International Hydropower Association (IHA). Hydropower Sustainability Assessment Protocol; International Hydropower Association (IHA): London, UK, 2011. [Google Scholar]
- Shang, Y.; Lu, S.; Ye, Y.; Liu, R.; Shang, L.; Liu, C.; Meng, X.; Li, X.; Fan, Q. China’ energy-water nexus: Hydropower generation potential of joint operation of the Three Gorges and Qingjiang cascade reservoirs. Energy 2017, 142, 14–32. [Google Scholar] [CrossRef]
- Li, D.; Zhao, J. Hydropower-ecologic benefits tradeoff analysis of cascade reservoir operation. J. Hydroelectr. Eng. 2016, 35, 37–44. [Google Scholar]
- Zhou, J.; Mu, Q.; Feng, Y.; Zhang, Y. Joint Operation of Cascade Reservoirs’ Hydropower Generation in the Upper Yantze River Reach. J. Water Resour. Res. 2013, 2, 1–6. [Google Scholar] [CrossRef]
- Seyoum, T.; Theobald, S. Modeling of Cascade Dams and Reservoirs Operation for Hydropower Energy Generation; International Conference on Hydroscience & Engineering (ICHE): Hamburg, Germany, 2013; Available online: http://xueshu.baidu.com/s?wd=Modeling+of+Cascade+Dams+and+Reservoirs+Operation+for+Hydropower+Energy+Generation%3B&tn=SE_baiduxueshu_c1gjeupa&cl=3&ie=utf-8&bs=paperuri%3A%288b05d771e105b1aa0c1b544e361e0871%29&f=8&rsv_bp=1&rsv_sug2=1&sc_f_para=sc_tasktype%3D%7BfirstSimpleSearch%7D&rsv_n=2. (accessed on 11 February 2018).
- Xu, B.; Zhong, P.A.; Chen, Y.T.; Zhao, Y.F. The multi-objective and joint operation of Xiluodu cascade and Three Gorges cascade reservoirs system. Sci. Sinica 2017. [Google Scholar] [CrossRef]
- Yang, G.; Guo, S.; Liu, P.; Li, L.; Xu, C. Multiobjective reservoir operating rules based on cascade reservoir input variable selection method. Water Resour. Res. 2017, 53, 3446–3463. [Google Scholar] [CrossRef]
- Wang, L.; Wang, B.; Zhang, P.; Liu, M.; Li, C. Study on optimization of the short-term operation of cascade hydropower stations by considering output error. J. Hydrol. 2017, 549, 326–339. [Google Scholar] [CrossRef]
- Xu, W.; Peng, Y. Optimal operation of cascade reservoir hydropower generation based on precipitation forecasts. J. Hydroelectr. Eng. 2016, 35, 23–33. [Google Scholar]
- Long, J.; Qunfang, M.O.; Jian, Z. A Stochastic Programming Based Short-Term Optimization Scheduling Strategy Considering Energy Conservation for Power System Containing Wind Farms. Power Syst. Technol. 2011, 35, 133–138. [Google Scholar]
- Basu, M. An interactive fuzzy satisfying method based on evolutionary programming technique for multiobjective short-term hydrothermal scheduling. Electr. Power Syst. Res. 2004, 69, 277–285. [Google Scholar] [CrossRef]
- Wu, J.; Tang, L.; Huang, H.; Yongwen, L.U. Multi-objective Economic Scheduling for Hydrothermal Power Systems Based on Genetic Algorithm and Data Envelopment Analysis. Power Syst. Technol. 2011, 35, 76–81. [Google Scholar]
- Wu, J.; Zhu, Y.; Wei, S. Multi-Objective Optimal Scheduling for Cascaded Hydroelectric Power Plant Based on Improved Membership Functions. Power Syst. Technol. 2011, 49, 3380–3384. [Google Scholar]
- Franco, P.E.C.; Carvalho, M.F.; Soares, S. Network flow model for short-term hydro-dominated hydrothermal scheduling problems. IEEE Trans. Power Syst. 1994, 9, 1016–1022. [Google Scholar] [CrossRef]
- Naresh, R.; Sharma, J. Short term hydro scheduling using two-phase neural network. Int. J. Electr. Power Energy Syst. 2002, 24, 583–590. [Google Scholar] [CrossRef]
- Yang, T.; Asanjan, A.A.; Faridzad, M.; Hayatbini, N.; Gao, X.; Sorooshian, S. An Enhanced Artificial Neural Network with A Shuffled Complex Evolutionary Global Optimization with Principal Component Analysis. Inf. Sci. 2017, 418, 302–316. [Google Scholar] [CrossRef]
- Yang, T.; Gao, X.; Sellars, S.L.; Sorooshian, S. Improving the multi-objective evolutionary optimization algorithm for hydropower reservoir operations in the California Oroville—Thermalito complex. Environ. Modell. Softw. 2014, 69, 262–279. [Google Scholar] [CrossRef]
- Yang, T.; Asanjan, A.A.; Welles, E.; Gao, X.; Sorooshian, S.; Liu, X. Developing reservoir monthly inflow forecasts using artificial intelligence and climate phenomenon information. Water Resour. Res. 2017, 53, 2786–2812. [Google Scholar] [CrossRef]
- Yang, T.; Gao, X.; Sorooshian, S.; Li, X. Simulating California reservoir operation using the classification and regression—Tree algorithm combined with a shuffled cross—Validation scheme. Water Resour. Res. 2016, 52, 1626–1651. [Google Scholar] [CrossRef]
- Baril, J.; Bartle, A.; Clarke, T.; Gagnon, L.; Guerard, Y.; Klimpt, J.E.; Mccartney, M.P.; Raschidsally, L.; Rotheram, T.; Seelos, K. The role of hydropower in sustainable development. Acta Ethol. 2003, 8, 23–34. [Google Scholar]
- Jager, H.I.; Efroymson, R.A.; Opperman, J.J.; Kelly, M.R. Spatial design principles for sustainable hydropower development in river basins. Renew. Sustain. Energy Rev. 2015, 45, 808–816. [Google Scholar] [CrossRef]
- Zhang, Y. Accelerating Sustainability by Hydropower Development in China: The Story of HydroLancang. Sustainability 2017, 9, 1305. [Google Scholar] [CrossRef]
- Tahseen, S.; Karney, B.W. Reviewing and critiquing published approaches to the sustainability assessment of hydropower. Renew. Sustain. Energy Rev. 2017, 67, 225–234. [Google Scholar] [CrossRef]
- Ozturk, M.; Bezir, N.C.; Ozek, N. Hydropower–water and renewable energy in Turkey: Sources and policy. Renew. Sustain. Energy Rev. 2009, 13, 605–615. [Google Scholar] [CrossRef]
- Zhao, Q.; Liu, S.; Deng, L.; Dong, S.; Yang, Z.; Liu, Q. Determining the influencing distance of dam construction and reservoir impoundment on land use: A case study of Manwan Dam, Lancang River. Ecol. Eng. 2013, 53, 235–242. [Google Scholar] [CrossRef]
- Capik, M.; Yılmaz, A.O.; Cavusoglu, İ. Hydropower for sustainable energy development in Turkey: The small hydropower case of the Eastern Black Sea Region. Renew. Sustain. Energy Rev. 2012, 16, 6160–6172. [Google Scholar] [CrossRef]
- Evans, A.; Strezov, V.; Evans, T.J. Assessment of sustainability indicators for renewable energy technologies. Renew. Sustain. Energy Rev. 2009, 13, 1082–1088. [Google Scholar] [CrossRef]
- Kaygusuz, K. The Role of Hydropower for Sustainable Energy Development. Energy Sources Part B Econom. Plan. Policy 2009, 4, 365–376. [Google Scholar] [CrossRef]
- Kibler, K.M.; Tullos, D.D. Cumulative biophysical impact of small and large hydropower development in Nu River, China. Water Resour. Res. 2013, 49, 3104–3118. [Google Scholar] [CrossRef]
- Suh, D.H. An Entropy Approach to Regional Differences in Carbon Dioxide Emissions: Implications for Ethanol Usage. Sustainability 2018, 10, 243. [Google Scholar] [CrossRef]
- Nguyen, H.; Pham, T.; Bruyn, L. Impact of Hydroelectric Dam Development and Resettlement on the Natural and Social Capital of Rural Livelihoods in Bo Hon Village in Central Vietnam. Sustainability 2017, 9, 1422. [Google Scholar] [CrossRef]
- Glasnovic, Z.; Margeta, J. Vision of total renewable electricity scenario. Renew. Sustain. Energy Rev. 2011, 15, 1873–1884. [Google Scholar] [CrossRef]
- Raadal, H.L.; Gagnon, L.; Modahl, I.S.; Hanssen, O.J. Life cycle greenhouse gas (GHG) emissions from the generation of wind and hydro power. Renew. Sustain. Energy Rev. 2011, 15, 3417–3422. [Google Scholar] [CrossRef]
- Alexander, R.B.; Smith, R.A.; Schwarz, G.E. Effect of stream channel size on the delivery of nitrogen to the Gulf of Mexico. Nature 2000, 403, 758–761. [Google Scholar] [CrossRef] [PubMed]
- Mcmanamay, R.A.; Samu, N.; Kao, S.C.; Bevelhimer, M.S.; Hetrick, S.C. A multi-scale spatial approach to address environmental effects of small hydropower development. Environ. Manag. 2015, 55, 217–243. [Google Scholar] [CrossRef] [PubMed]
- Santos, J.M.; Silva, A.; Katopodis, C.; Pinheiro, P.; Pinheiro, A.; Bochechas, J.; Ferreira, M.T. Ecohydraulics of pool-type fishways: Getting past the barriers. Ecol. Eng. 2012, 48, 38–50. [Google Scholar] [CrossRef]
- Williams, J.G.; Armstrong, G.; Katopodis, C.; Larinier, M.; Travade, F. Thinking like a fish: A key ingredient for development of effective fish passage facilities at river obstructions. River Res. Appl. 2012, 28, 407–417. [Google Scholar] [CrossRef]
- Thiem, J.D.; Binder, T.R.; Dumont, P.; Hatin, D.; Hatry, C.; Katopodis, C.; Stamplecoskie, K.M.; Cooke, S.J. Multispecies fish passage behaviour in a vertical slot fishway on the richelieu river, Quebec, Canada. River Res. Appl. 2013, 29, 582–592. [Google Scholar] [CrossRef]
- Quaranta, E.; Revelli, R. Output power and power losses estimation for an overshot water wheel. Renew. Energy 2015, 83, 979–987. [Google Scholar] [CrossRef]
- Müller, G.; Kauppert, K. Performance characteristics of water wheels. J. Hydraul. Res. 2004, 42, 451–460. [Google Scholar] [CrossRef]
- Lubitz, W.D.; Lyons, M.; Simmons, S. Performance Model of Archimedes Screw Hydro Turbines with Variable Fill Level. J. Hydraul. Eng. 2014, 140, 2729–2737. [Google Scholar] [CrossRef]
- Bureau, S.S. China Statistical Yearbook; China Statistics Press: Beijing, China, 2008–2016. [Google Scholar]
- Ministry, C.W.R. Statistic Bullein on China Water Activities; China Water & Power Press: Beijing, China, 2008–2016. [Google Scholar]
- Bureau, S.S. China Statistical Yearbook on Environment; China Statistics Press: Beijing, China, 2008–2016. [Google Scholar]
- Bureau, S.S. China Statistical Yearbook on Energy; China Statistics Press: Beijing, China, 2008–2016. [Google Scholar]
- Aeyels, D.; Peuteman, J. A new asymptotic stability criterion for nonlinear time-variant differential equations. IEEE Trans. Autom. Control 2002, 43, 968–971. [Google Scholar] [CrossRef]
- Zhang, Y.; Yang, Z.; Li, W. Analyses of urban ecosystem based on information entropy. Ecol. Modell. 2006, 197, 1–12. [Google Scholar] [CrossRef]
- Schieve, W.C.; Allen, P.M. Self-organization and dissipative structures. Tech. Phys. Lett. 1990, 16, 248–251. [Google Scholar]
- Tian, S. Research on Negative Entropy of High-Tech Virtual Enterprise Based on Dissipative Structure. In Proceedings of the International Conference on Industrial Engineering and Engineering Management, IE&Em, Beijing, China, 21–23 October 2009; pp. 233–237. [Google Scholar]
- Prigogine, I.; Stengers, I.; Pagels, H.R. Order out of Chaos. Phys. Today 1985, 38, 97–99. [Google Scholar] [CrossRef]
- Rees, W.E. Economic development and environmental protection: An ecological economics perspective. Environ. Monit. Assess. 2003, 86, 29–45. [Google Scholar] [CrossRef] [PubMed]
- Yang, Q.L.; Zhang, Y. Research on Evaluation of Sustainable Development Based on Management Entropy for Scenic Areas. Adv. Mater. Res. 2012, 766–771. [Google Scholar] [CrossRef]
- Yanbin, L.; Xuefeng, S. The coupled mode and discrimination of urbanization and ecological environment. Sci. Geogr. Sinica 2005, 25, 408–414. [Google Scholar]
- Bao, B.; Kong, X. The Analysis about the Dissipative Structure on Innovation Management. In Proceedings of the 2010 International Conference on E-Business and E-Government, Guangzhou, China, 7–9 May 2010; pp. 1253–1256. [Google Scholar]
- Xiang, P.; Zou, L. Application of the Dissipative Structure Theory in Construction Project Management. Int. J. Adv. Comput. Technol. 2011, 3, 364–374. [Google Scholar]
- Chen, F.; Zhang, X.H. Research on Evolution of Chinese Telecommunication Industry System Based on Dissipative Structure Theory. J. Comput. 2011, 6, 725–731. [Google Scholar] [CrossRef]
- Hsu, T.; Lin, L. QFD with fuzzy and entropy weight for evaluating retail customer values. Total Qual. Manag. Bus. Excell. 2006, 17, 935–958. [Google Scholar] [CrossRef]
- Wenyuan, N. Theory and practice of sustainable development in China. Bull. Chin. Acad. Sci. 2012, 37, 280–290. [Google Scholar]
- Shichun, Z.; Xiaowei, z. Practice of sustainable hydropower development in China. J. Hydroelectr. Power Gen. 2012, 31, 1–6. [Google Scholar]
- Lindström, A.; Ruud, A. Who’s Hydropower? From Conflictual Management into an Era of Reconciling Environmental Concerns; a Retake of Hydropower Governance towards Win-Win Solutions? Sustainability 2017, 9, 1262. [Google Scholar]
- Tang, W.; Li, Z.; Tu, Y. Sustainability Risk Evaluation for Large-Scale Hydropower Projects with Hybrid Uncertainty. Sustainability 2018, 10, 138. [Google Scholar] [CrossRef]


| Target-Grade | First-Grade Index | Second-Grade Index | Third-Grade Index | Data Source |
|---|---|---|---|---|
| Hydropower sustainable development | Hydropower social economic sustainable development S | Efficiency indexes S1 | GDP () S11 | [50] |
| Hydropower station installed capacity (KW) S12 | [53] | |||
| Hydropower production (KWh) S13 | [50] | |||
| Water conservancy facility land (km2) S14 | [51] | |||
| Hydropower project investment (RMB) S15 | [51] | |||
| Number of water parks (units) S16 | [51] | |||
| Number of water conservancy workers (person) S17 | [51] | |||
| Spending on energy conservation and environmental Protection (RMB) S18 | [51] | |||
| Water conservancy irrigation area (khm2) S19 | [51] | |||
| Pressure indexes S2 | Economic losses caused by floods (RMB) S21 | [51] | ||
| Water conservancy immigration (person) S22 | [51] | |||
| Hydropower ecological environment sustainable development E | Efficiency indexes E1 | Water supply (km3) E11 | [51] | |
| Surface water resources (km3) E12 | [51] | |||
| Ground water resources (km3) E13 | [51] | |||
| Water quality proportion (%) E14 | [51] | |||
| Water logging control (khm3) E15 | [51] | |||
| Pressure indexes E2 | CO2 emissions (t) E21 | [51] | ||
| Geological hazards (time) E22 | [52] | |||
| SO2 emissions (t) E23 | [52] | |||
| Waste water discharge (t) E24 | [52] | |||
| Flood disaster (khm2) E25 | [52] | |||
| Soil erosion control area (km2) E26 | [52] |
| Index | 2007 | 2008 | 2009 | 2010 | 2011 | 2012 | 2013 | 2014 | 2015 | Entropy | Weight | |
|---|---|---|---|---|---|---|---|---|---|---|---|---|
| S1 | S11 | 0.397 | 0.471 | 0.511 | 0.603 | 0.710 | 0.790 | 0.865 | 0.945 | 1.000 | 0.980 | 0.286 |
| S12 | 0.454 | 0.540 | 0.614 | 0.676 | 0.729 | 0.781 | 0.878 | 0.954 | 1.000 | 0.987 | 0.073 | |
| S13 | 0.429 | 0.518 | 0.545 | 0.639 | 0.618 | 0.772 | 0.814 | 0.942 | 1.000 | 0.984 | 0.055 | |
| S14 | 0.996 | 1.000 | 0.943 | 0.947 | 0.956 | 0.960 | 0.961 | 0.977 | 0.980 | 1.000 | 0.000 | |
| S15 | 0.307 | 0.357 | 0.332 | 0.486 | 0.503 | 0.540 | 0.758 | 1.000 | 0.701 | 0.967 | 0.065 | |
| S16 | 0.490 | 0.565 | 0.666 | 0.761 | 0.855 | 0.932 | 0.971 | 0.990 | 1.000 | 0.988 | 0.020 | |
| S17 | 1.002 | 0.991 | 0.973 | 1.000 | 0.962 | 0.970 | 0.943 | 0.911 | 0.888 | 1.000 | 0.000 | |
| S18 | 0.207 | 0.302 | 0.403 | 0.508 | 0.550 | 0.617 | 0.715 | 0.794 | 1.000 | 0.960 | 0.048 | |
| S19 | 0.094 | 0.095 | 0.096 | 0.098 | 1.000 | 0.100 | 0.103 | 0.104 | 0.106 | 0.732 | 0.283 | |
| S2 | S21 | 0.300 | 0.255 | 0.226 | 1.000 | 0.347 | 0.125 | 0.119 | 0.420 | 0.444 | 0.907 | 0.090 |
| S22 | 0.862 | 0.636 | 1.000 | 0.339 | 0.418 | 0.209 | 0.490 | 0.590 | 0.422 | 0.958 | 0.037 | |
| E1 | E11 | 0.929 | 0.935 | 0.952 | 0.961 | 0.980 | 1.000 | 0.992 | 0.978 | 0.979 | 1.000 | 0.000 |
| E12 | 0.814 | 0.885 | 0.776 | 1.000 | 0.746 | 0.952 | 0.901 | 0.881 | 0.903 | 0.998 | 0.001 | |
| E13 | 0.905 | 0.965 | 0.863 | 1.000 | 0.857 | 1.000 | 0.960 | 0.920 | 0.926 | 0.999 | 0.000 | |
| E14 | 0.834 | 0.825 | 0.793 | 0.837 | 0.903 | 0.903 | 0.925 | 0.981 | 1.000 | 0.999 | 0.001 | |
| E15 | 0.943 | 0.943 | 0.950 | 0.955 | 0.956 | 0.962 | 0.966 | 0.985 | 1.000 | 1.000 | 0.000 | |
| E2 | E21 | 0.672 | 0.697 | 0.744 | 0.820 | 0.894 | 0.951 | 0.979 | 0.993 | 1.000 | 0.995 | 0.003 |
| E22 | 0.827 | 0.867 | 0.345 | 1.000 | 0.515 | 0.479 | 0.501 | 0.357 | 0.272 | 0.960 | 0.021 | |
| E23 | 1.063 | 1.000 | 0.954 | 0.941 | 0.956 | 0.912 | 0.881 | 0.851 | 0.801 | 0.999 | 0.001 | |
| E24 | 0.757 | 0.778 | 0.801 | 0.840 | 0.897 | 0.931 | 0.946 | 0.974 | 1.000 | 0.998 | 0.001 | |
| E25 | 0.684 | 0.520 | 0.435 | 1.000 | 0.389 | 0.673 | 0.759 | 0.324 | 0.350 | 0.970 | 0.014 | |
| E26 | 0.865 | 0.880 | 0.903 | 0.925 | 0.950 | 0.892 | 0.926 | 0.966 | 1.000 | 1.000 | 0.000 |
| Item | Year | |||||||||
|---|---|---|---|---|---|---|---|---|---|---|
| 2007 | 2008 | 2009 | 2010 | 2011 | 2012 | 2013 | 2014 | 2015 | ||
| S | Efficiency evaluation value | 0.286 | 0.336 | 0.365 | 0.429 | 0.783 | 0.527 | 0.589 | 0.656 | 0.672 |
| Pressure evaluation value | 0.457 | 0.362 | 0.442 | 0.815 | 0.367 | 0.149 | 0.223 | 0.468 | 0.437 | |
| variation value | −0.172 | −0.026 | −0.078 | −0.386 | 0.416 | 0.379 | 0.366 | 0.188 | 0.235 | |
| E | Efficiency evaluation value | 0.842 | 0.880 | 0.804 | 0.942 | 0.824 | 0.942 | 0.918 | 0.921 | 0.938 |
| Pressure evaluation value | 0.759 | 0.725 | 0.506 | 0.954 | 0.590 | 0.677 | 0.718 | 0.527 | 0.505 | |
| variation value | 0.083 | 0.155 | 0.298 | −0.012 | 0.234 | 0.266 | 0.200 | 0.393 | 0.433 | |
| Total evaluation value change | −0.0887 | −0.089 | 0.130 | 0.221 | −0.398 | 0.649 | 0.644 | 0.567 | 0.581 | |
| Social Economic Sustainable Hydropower Development Level | Rank | Ecological Environment Sustainable Hydropower Development Level | Rank | Sustainable Hydropower Development Level | Rank | |
|---|---|---|---|---|---|---|
| 2007 | −0.172 | 8 | 0.083 | 8 | −0.089 | 8 |
| 2008 | −0.026 | 6 | 0.155 | 7 | 0.130 | 7 |
| 2009 | −0.078 | 7 | 0.298 | 3 | 0.221 | 6 |
| 2010 | −0.386 | 9 | −0.012 | 9 | −0.398 | 9 |
| 2011 | 0.416 | 1 | 0.234 | 5 | 0.649 | 2 |
| 2012 | 0.379 | 2 | 0.266 | 4 | 0.644 | 3 |
| 2013 | 0.366 | 3 | 0.200 | 6 | 0.567 | 5 |
| 2014 | 0.188 | 5 | 0.393 | 2 | 0.581 | 4 |
| 2015 | 0.235 | 4 | 0.433 | 1 | 0.668 | 1 |
© 2018 by the authors. Licensee MDPI, Basel, Switzerland. This article is an open access article distributed under the terms and conditions of the Creative Commons Attribution (CC BY) license (http://creativecommons.org/licenses/by/4.0/).
Share and Cite
Liang, X.; Si, D.; Xu, J. Quantitative Evaluation of the Sustainable Development Capacity of Hydropower in China Based on Information Entropy. Sustainability 2018, 10, 529. https://doi.org/10.3390/su10020529
Liang X, Si D, Xu J. Quantitative Evaluation of the Sustainable Development Capacity of Hydropower in China Based on Information Entropy. Sustainability. 2018; 10(2):529. https://doi.org/10.3390/su10020529
Chicago/Turabian StyleLiang, Xuedong, Dongyang Si, and Jing Xu. 2018. "Quantitative Evaluation of the Sustainable Development Capacity of Hydropower in China Based on Information Entropy" Sustainability 10, no. 2: 529. https://doi.org/10.3390/su10020529
APA StyleLiang, X., Si, D., & Xu, J. (2018). Quantitative Evaluation of the Sustainable Development Capacity of Hydropower in China Based on Information Entropy. Sustainability, 10(2), 529. https://doi.org/10.3390/su10020529