Article

Comparison among Detailed and Simplified Calculation Methods for Thermal and Energy Assessment of the Building Envelope and the Shadings of a New Wooden nZEB House

1
DIEF Department, University of Florence, via di Santa Marta 3, 50139 Florence, Italy
2
Salvietti Studio, Corso Italia 41, 52043 Castiglion Fiorentino, Italy
*
Author to whom correspondence should be addressed.
Sustainability 2018, 10(2), 476; https://doi.org/10.3390/su10020476
Submission received: 31 October 2017 / Revised: 4 February 2018 / Accepted: 4 February 2018 / Published: 11 February 2018

Abstract

:
This paper deals with research carried out by the University of Florence on the thermal and energy performances of a recently built nZEB in Mediterranean Italian area. Heterogeneous component and thermal bridges performances have been analysed and critically evaluated with different calculation methods, and the results in terms of energy consumptions for heating and cooling have been compared. Some solar shading devices have been evaluated to reduce the building energy need for cooling. Main results of the research are presented for the components and thermal bridges properties and for the energy balance of the building implemented with different solar shadings.

1. Introduction

The Energy Performance of Buildings Directive (EPBD) recast 2010 [1] introduces the concept and the definition of the “nearly zero-energy building” (nZEB). In the Directive, “nearly zero-energy building” means “a building that has a very high energy performance. The nearly zero or very low amount of energy required should be covered to a very significant extent by energy from renewable sources, including energy from renewable sources produced on-site or nearby” [1]. Since the Commission does not give minimum or maximum harmonized requirements, it will be up to the Member States to define what for them exactly constitutes a “very high energy performance” based on the cost optimal performance level. The cost optimal level could represent “the energy performance that leads to the lowest cost during the estimated economic lifecycle” (the latter determined by Member States). In the definition, local conditions can be obviously considered, but the uniform methodology should be used in all Member States.
EPBD recast requires that after 31 December 2018, public authorities that occupy and own a new building shall ensure that the building will be a nearly zero energy building, and, by 31 December 2020, all new buildings will be nearly zero energy buildings.
According to the EPBD recast, the Italian Decree of 26 June 2015 [2] defines the requirements of the nZEB, whether new or existing construction. In particular, the following parameters should be lower than the values calculated for the reference building (a virtual building geometrically equivalent to the design building, but offering the minimum current energy parameters and thermal characteristics):
  • the transmission heat transfer global coefficient averaged over envelope dispersing surface (H’T);
  • the summer solar equivalent area of glazed elements per unit floor area (Asol,est/Asup utile);
  • the specific energy need for space heating (EPH) and cooling (EPC);
  • the specific global primary energy need both total (EPgl,tot) and non-renewable(EPgl,nren); and
  • the efficiency of the heating (ηH), cooling (ηC), and domestic hot water systems (ηW).
Moreover, renewable sources should be present in compliance with the minimum standards set out in the Italian Legislative Decree 3 March 2011, n. 28 [3].
In cold climates, the windows properties, thermal insulation, window-to-wall ratio and shading devices are analysed in [4]. Passive techniques, energy efficient mechanical systems and renewable energy sources are strategic elements to obtain a nZEB [5,6,7,8]. The ZEBRA project [9] individuates the nZEB distribution in Europe. In Italy, there are 100 buildings constructed in accordance with nZEB concept (15 residential buildings and 85 non-residential buildings).
In Southern Europe, the energy performance of residential buildings is strongly penalized in summer [10] and the cooling demand is going to rise due to increasing comfort requirements; in fact, cooling systems are thus becoming standard systems for new or refurbished buildings, as well as heating systems. The Italian legislation introduced only in 2009 the necessity to calculate the summer performance index for buildings and compare it with the legal limits; furthermore, it must be noted that the common design strategies have not been completely adapted to these requirements. Since Southern Europe buildings have to perform effectively both in heating and in cooling mode, some strategies should be taken to match the nZEB requirements in this climatic area [11], such as:
  • the optimization of the building envelope for the whole year and not only for heating season to reduce the energy need as much as possible (insulation, increased use of daylight, thermal activation of the mass, night natural ventilation, shading devices, etc.); and
  • the increase of the heating and cooling technical systems energy efficiencies, by using the best available technology (heat recovery, increase the efficiency of air conditioning systems, etc.) and by enhancing the production of heat and electricity from on-site renewable sources (solar thermal, PV, heat pumps, district heating powered by renewable fuels, etc.).
The design of wooden high insulated buildings, currently widely used in Southern Europe to reach the nZEB target, can present some critical issues mainly due to the discontinuity of the thermal insulation layer, the correct envelope heterogeneous components thermal evaluation, the thermal bridge assessment, the summer overheating and the consequent high cooling needs due to the lack of proper solar shading strategies.
To assess the thermal and energy performances of a platform frame nZEB residential building in Central Italy, the University of Florence is carrying out a research dealing both with building envelope performances evaluation and a monitoring campaign. Within this framework this paper analyses heterogeneous components and thermal bridges performances by means of finite elements calculation code. To reduce the building energy need for cooling, the effectiveness of some solar shading devices is carefully evaluated not only with a steady state calculation code but also with dynamic software.
The results of this paper show that all these elements are of fundamental importance to achieve a better design and a correct construction of these kind of buildings when a nZEB target is aimed.

2. Materials and Methods

This paper deals with the study of a new nZEB detached house in central Italy and includes two main phases:
  • First phase: The main thermal characteristics of the building envelope are calculated and critically evaluated; and the building components (heterogeneous components and thermal bridges) and solar shading systems are analysed with both simplified (commonly used by energy performance certifiers) and detailed calculation methods (2D finite elements and dynamic codes.
  • Second phase: An energy simulation of the building is carried out with dedicated steady state software; building envelope energy requirements in the heating and cooling mode are assessed and critically analysed. This phase is articulated in three steps:
    energy analysis of the nZEB building using the thermal performance of building components analysed with simplified methods (from first phase);
    energy analysis of the nZEB building using the thermal performance of building components analysed with detailed calculation methods (from first phase); and
    energy analysis of the nZEB building using the thermal performance of building components and the energy performance of solar shading systems analysed with detailed calculation methods (from first phase).
In the present paper, results related to the first and second phase are fully described and discussed.

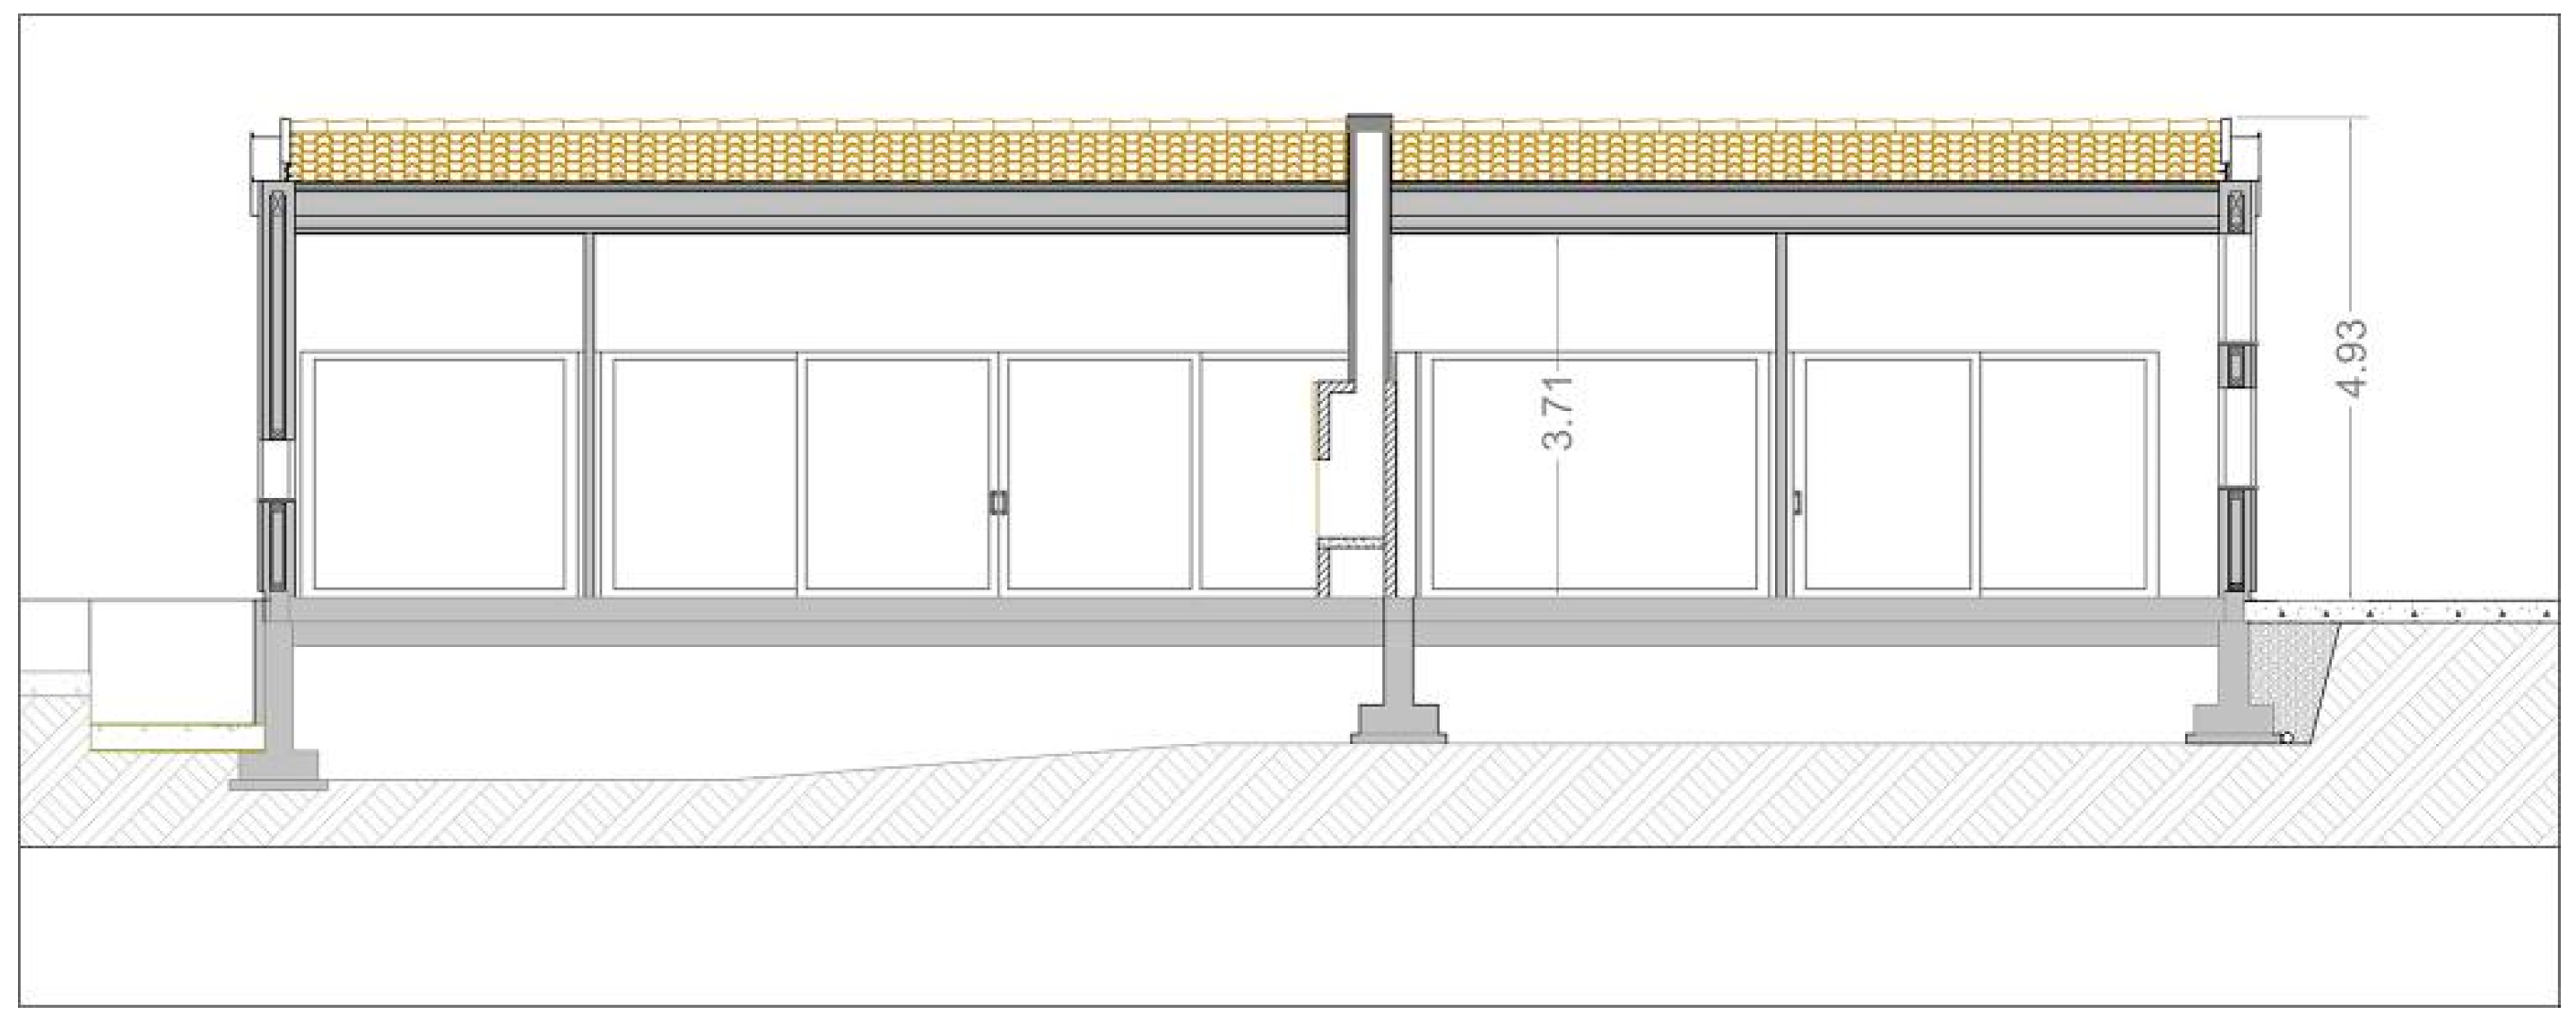
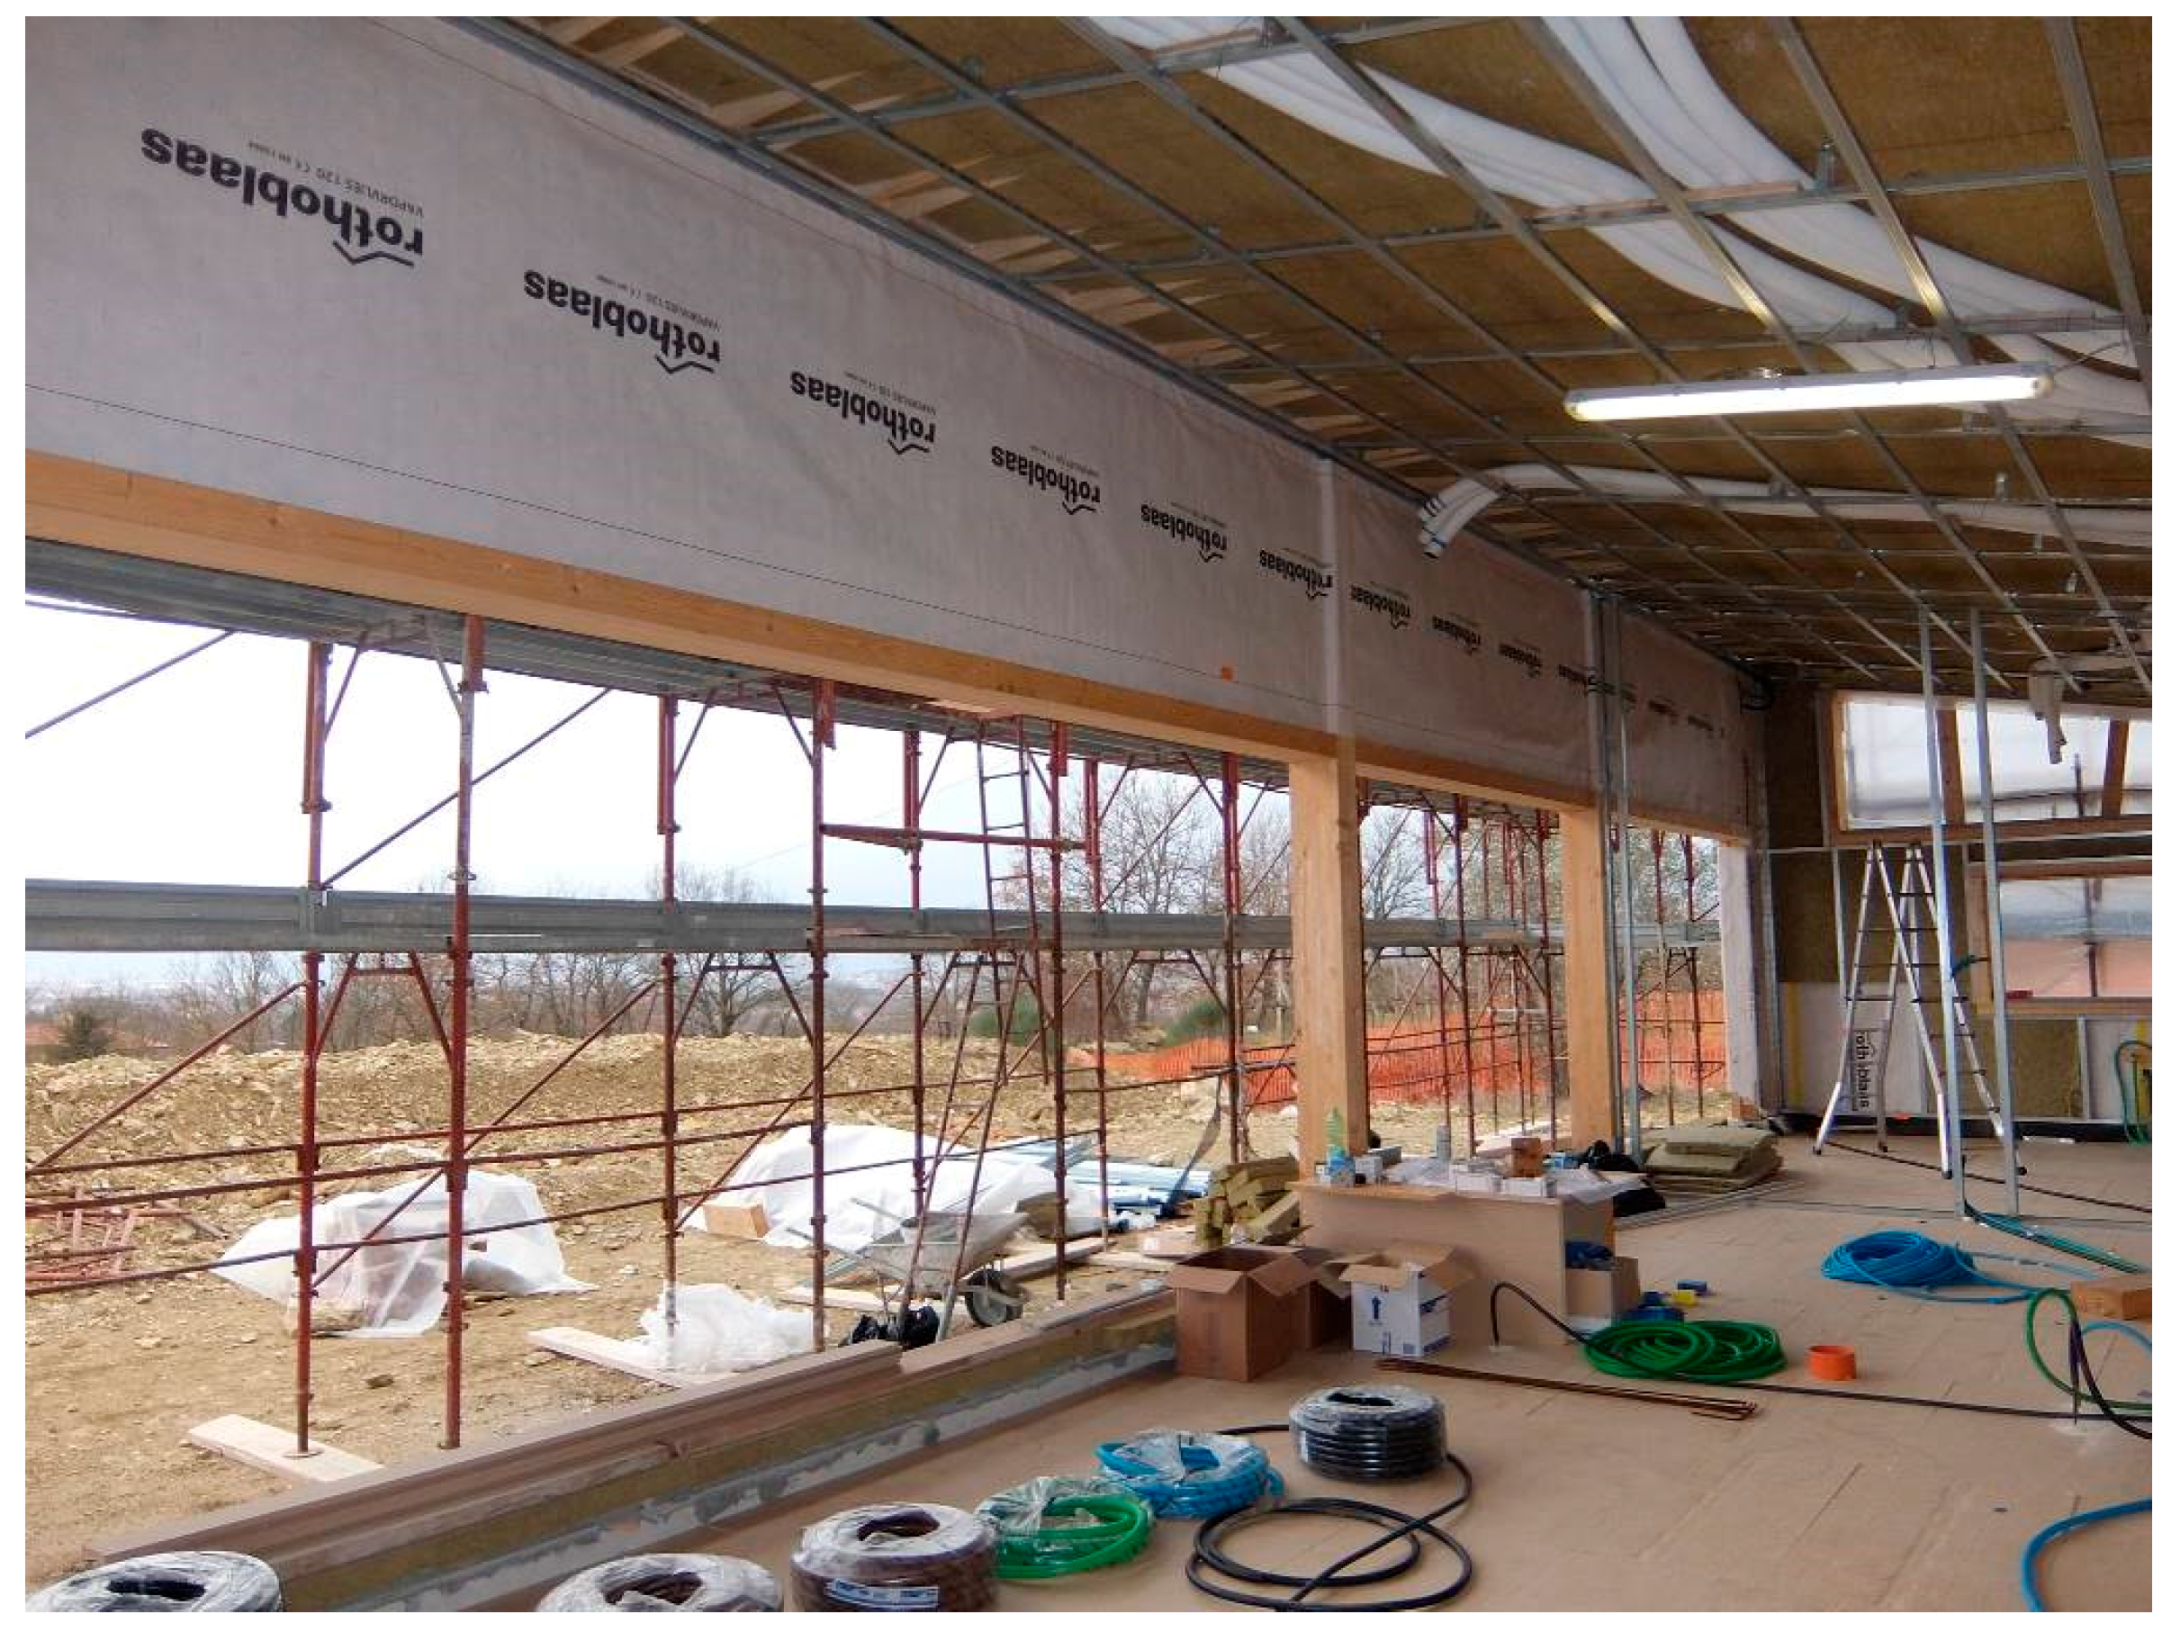
2.1. Description of the Building

The analysed building is a detached house (one-story building) in Tuscany (Figure 1, Figure 2 and Figure 3); it is built with a platform frame wooden technology combined with a reinforced concrete slab for the floors. The building technology is based on a wooden frame made of studs and joists suitably spaced (0.625 m), plugged by timber boards and filled with large layers of insulating materials. This technology is affected by materials heterogeneity and consequently presents many thermal bridges that are widespread all over the building envelope.
Climatic and building data are reported in Table 1.
The garage and the cellar, with a reinforced concrete structure, are placed in the unheated basement.
The aim of this building is to reach the nZEB target as defined in Italian Decree of 26 June 2015 [2]. In the building, PV panels are integrated in the roof to produce about 5000 kWh per year. Two heat pumps are installed: the first for heating and cooling is placed outside, while the second for hot water production is placed in the basement. A mechanical ventilation system (VMC) creates a 24 h air flow in every room varying from 1 vol/h to 1.5 vol/h; nominal heat recovery efficiency of the VMC is 84%.
Figure 4, Figure 5 and Figure 6 refer to the building under construction and underline its technology as well as the great southwest oriented window in the living room filling the entire wall.

2.2. Analysis of Building Components

The analysis of the thermal performances of the opaque building envelope comprehend the calculation of different indicators in accordance with the Italian standards:
  • thermal transmittance (U) in accordance to UNI EN ISO 6946:2008 [13];
  • periodic thermal transmittance (YIE), decrement factor (f), and time shift (Δt) in accordance to UNI EN ISO 13786:2008 [14];
  • surface mass index (Ms) [15]; and
  • vapour condensation risk assessment (internal surface temperature and interstitial condensation) in accordance to UNI EN ISO 13788:2013 [16].
Calculated values of thermal transmittance have been compared with the reference nZEB ones reported in the Italian Decree of 26 June 2015 [2] for the climatic zone E (Arezzo).
Moreover, to evaluate the inertial performances of the components the YIE indicator has been assessed even if the local thermal irradiation is less than the reference value (Im,s = 290 W/m²). Table 2 reports the description of the envelope with the layers of the components while the main results of thermal analysis are collected in Table 3.
As a result of the thermal analysis carried out in accordance to UNI EN ISO 6946:2008, all the opaque components present very low transmittance values compared with the reference ones of the nZEB target and good inertial performances. No condensation risk has been highlighted.
Nevertheless, the platform frame technology requires a more detailed analysis for the heterogeneous components (walls and roof) that present a wooden structure with a 0.625 m distance between studs.
For this reason, all heterogeneous components have been assessed both with the calculation method reported in UNI EN ISO 6946:2008 and with a 2D numeric evaluation method in accordance to UNI EN ISO 10211:2008 [17] by using a finite element analysis tool (Bisco®) [18].
The specific requirements of the two-dimensional model refereed to the technology nodes have been defined together with the boundary conditions to calculate thermal fluxes and the internal surface temperatures.
From the thermal balance of the analysed components, heat fluxes and isothermal curves have been deduced for the heterogeneous external wall and the roof.
Figure 7 and Figure 8 report the temperature trends and heat fluxes.
From the analysis carried out with Bisco®, surface temperatures in the different layers have also been calculated and are reported in Table 4 (external wall) and Table 5 (roof).
In Table 6, thermal transmittance values for the external wall and the roof calculated with Bisco® software are reported.
In addition, thermal bridge coefficients (ψ) have been calculated for the main technological configurations of the building both with UNI EN ISO 14683:2008 [19] (simplified geometric model) and with UNI EN ISO 10211:2008 (Bisco®—detailed geometric model). The following thermal bridge typologies have been analysed and reported in Table 7:
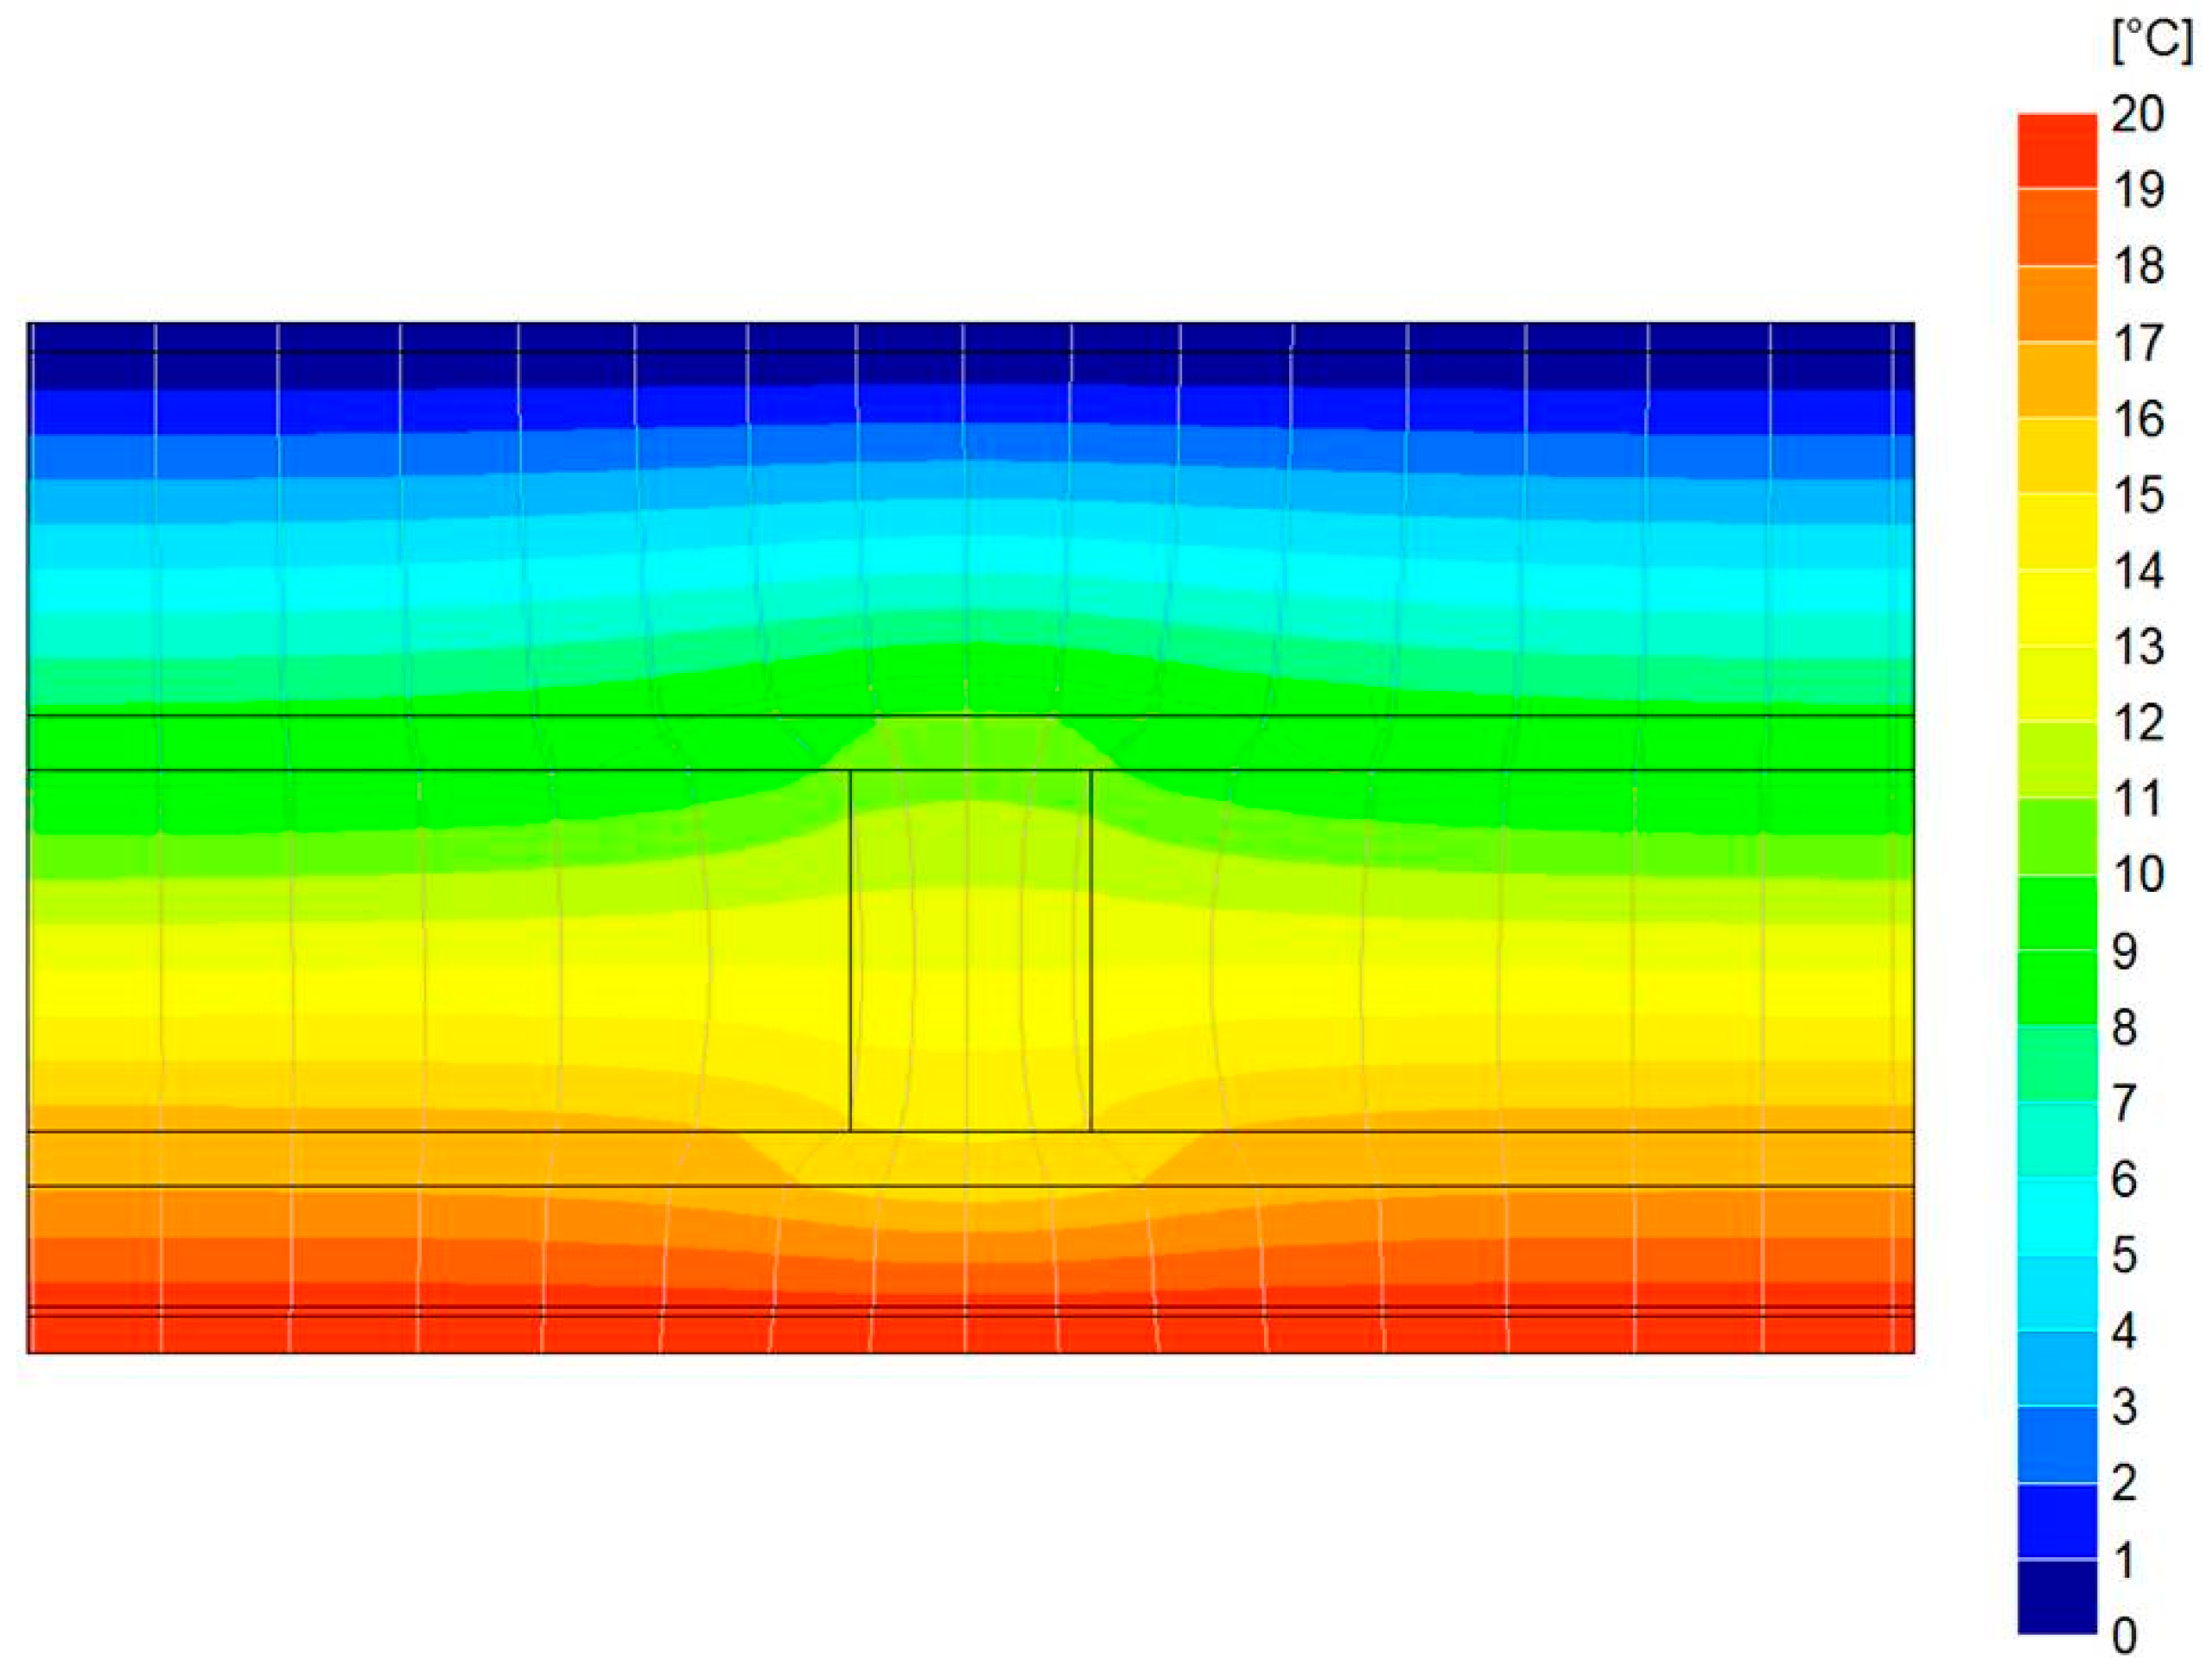
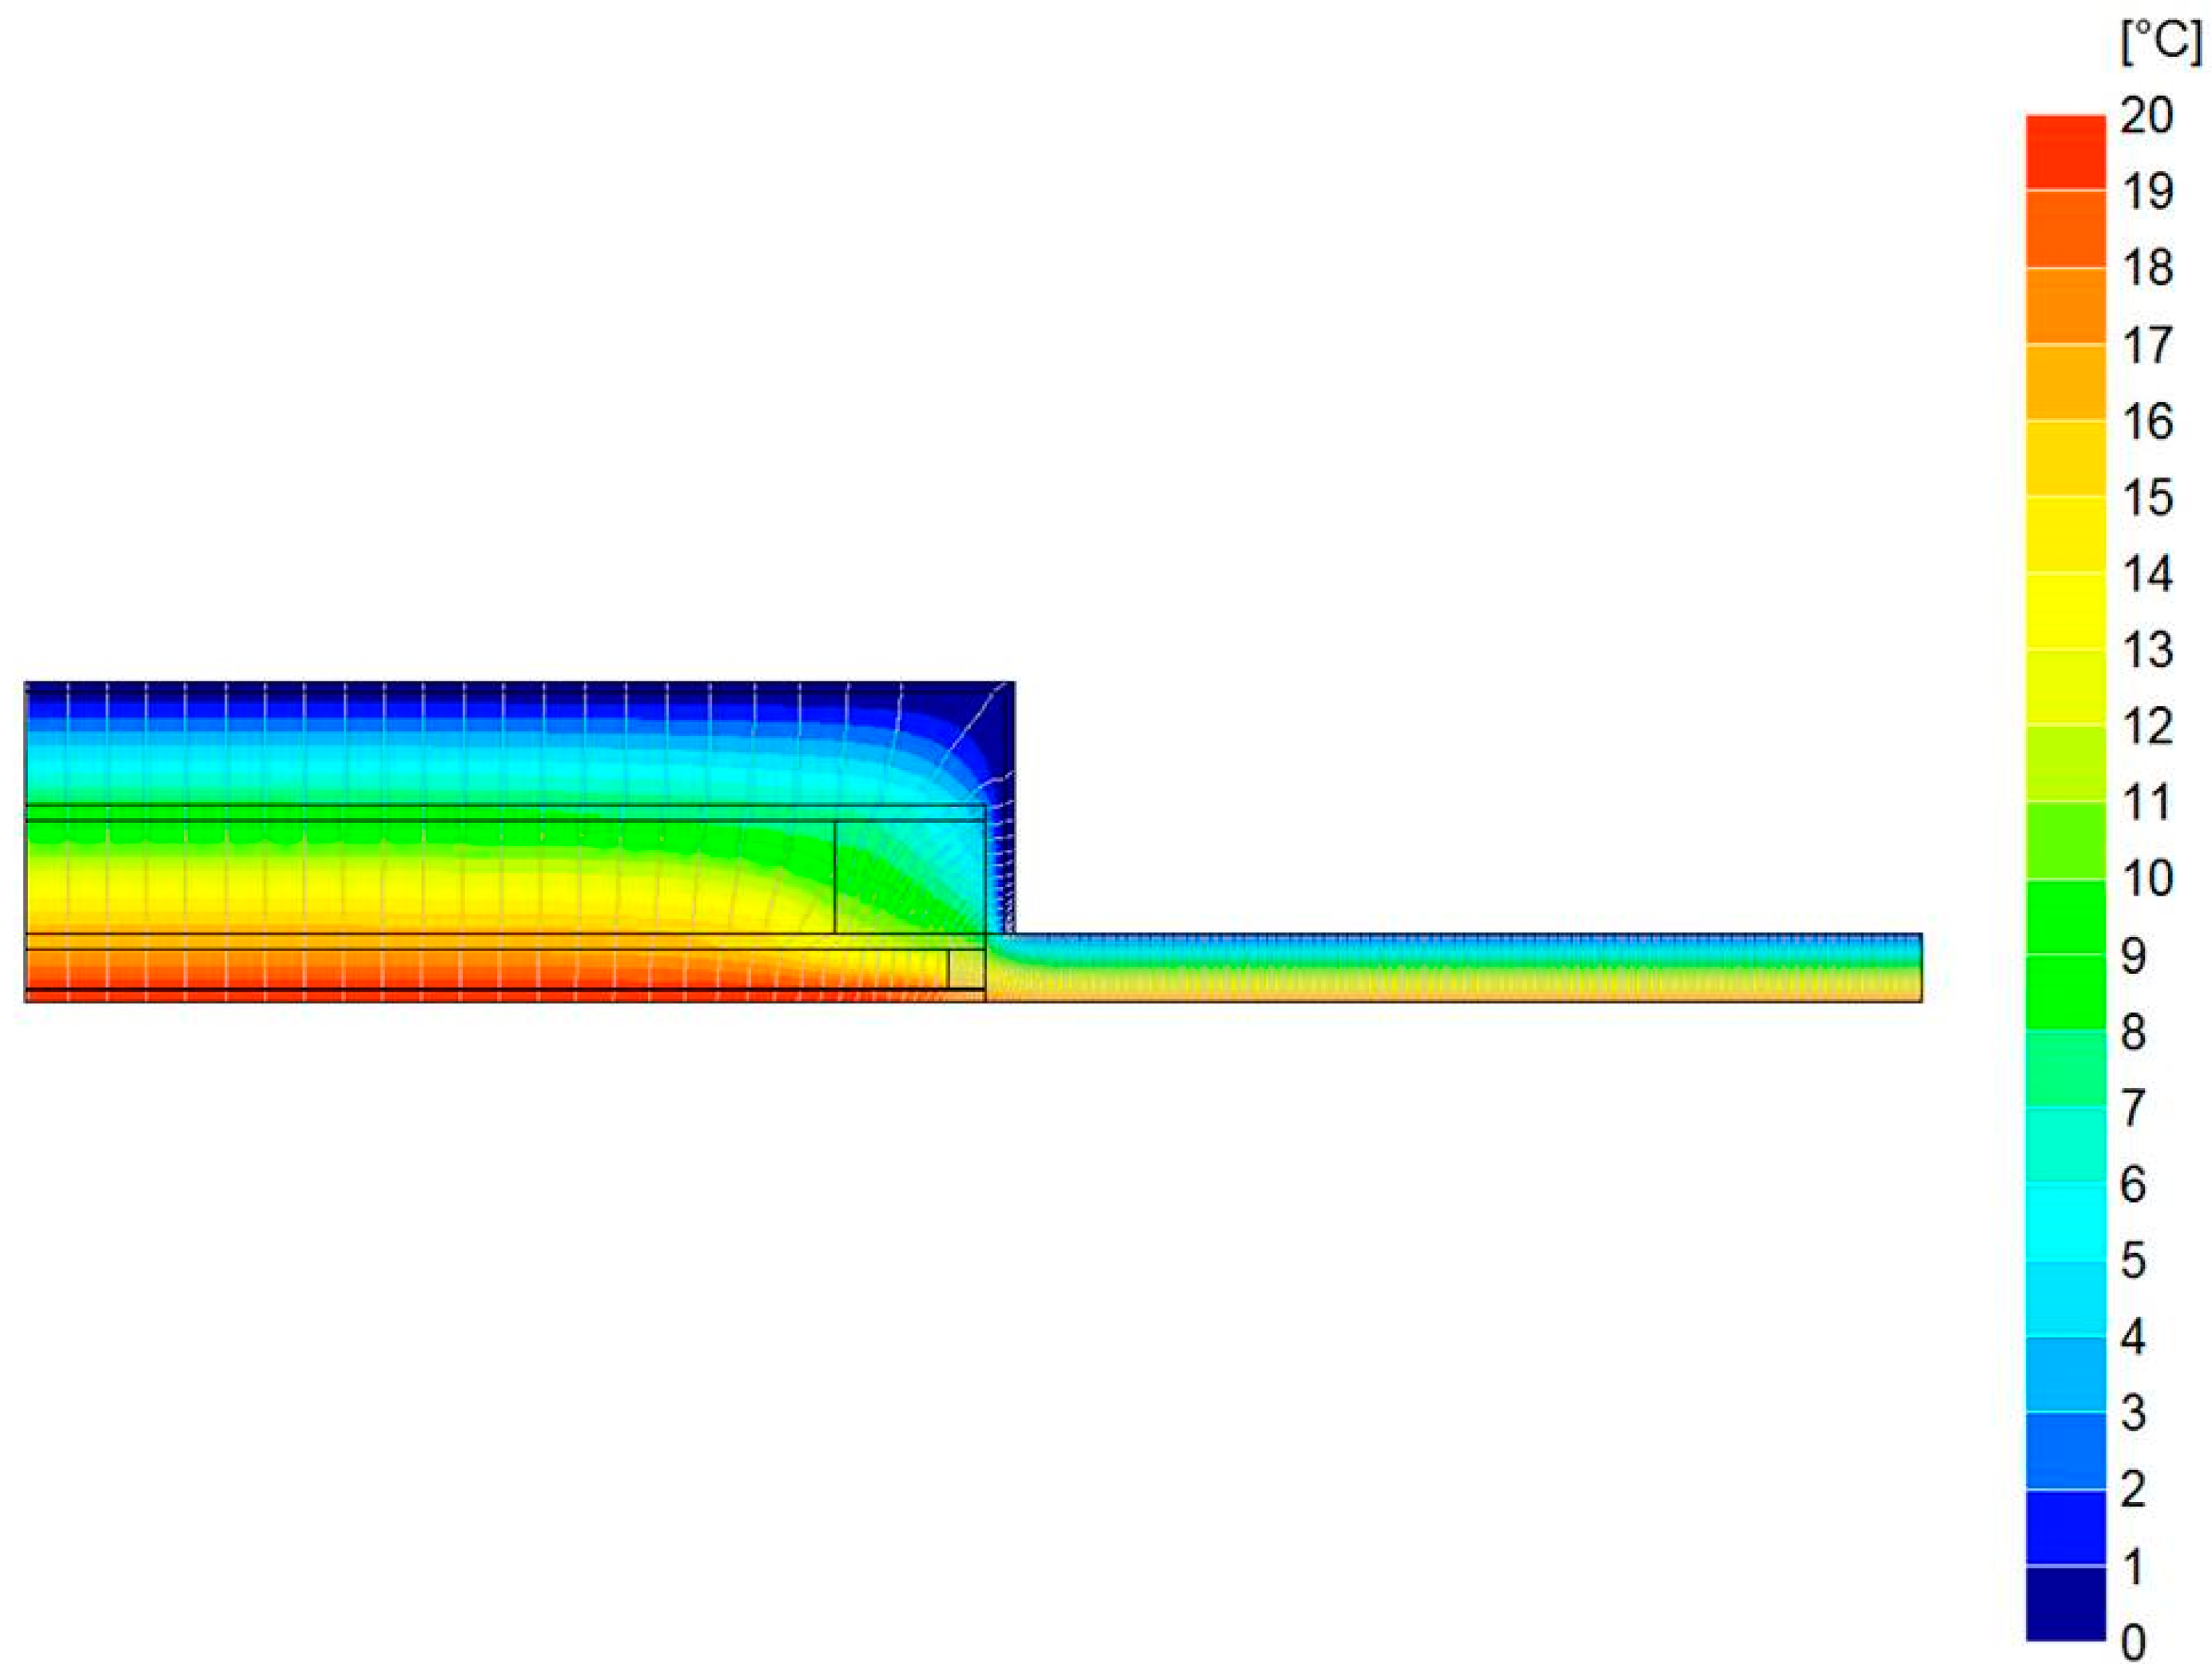
  • connection between external wall and ground floor;
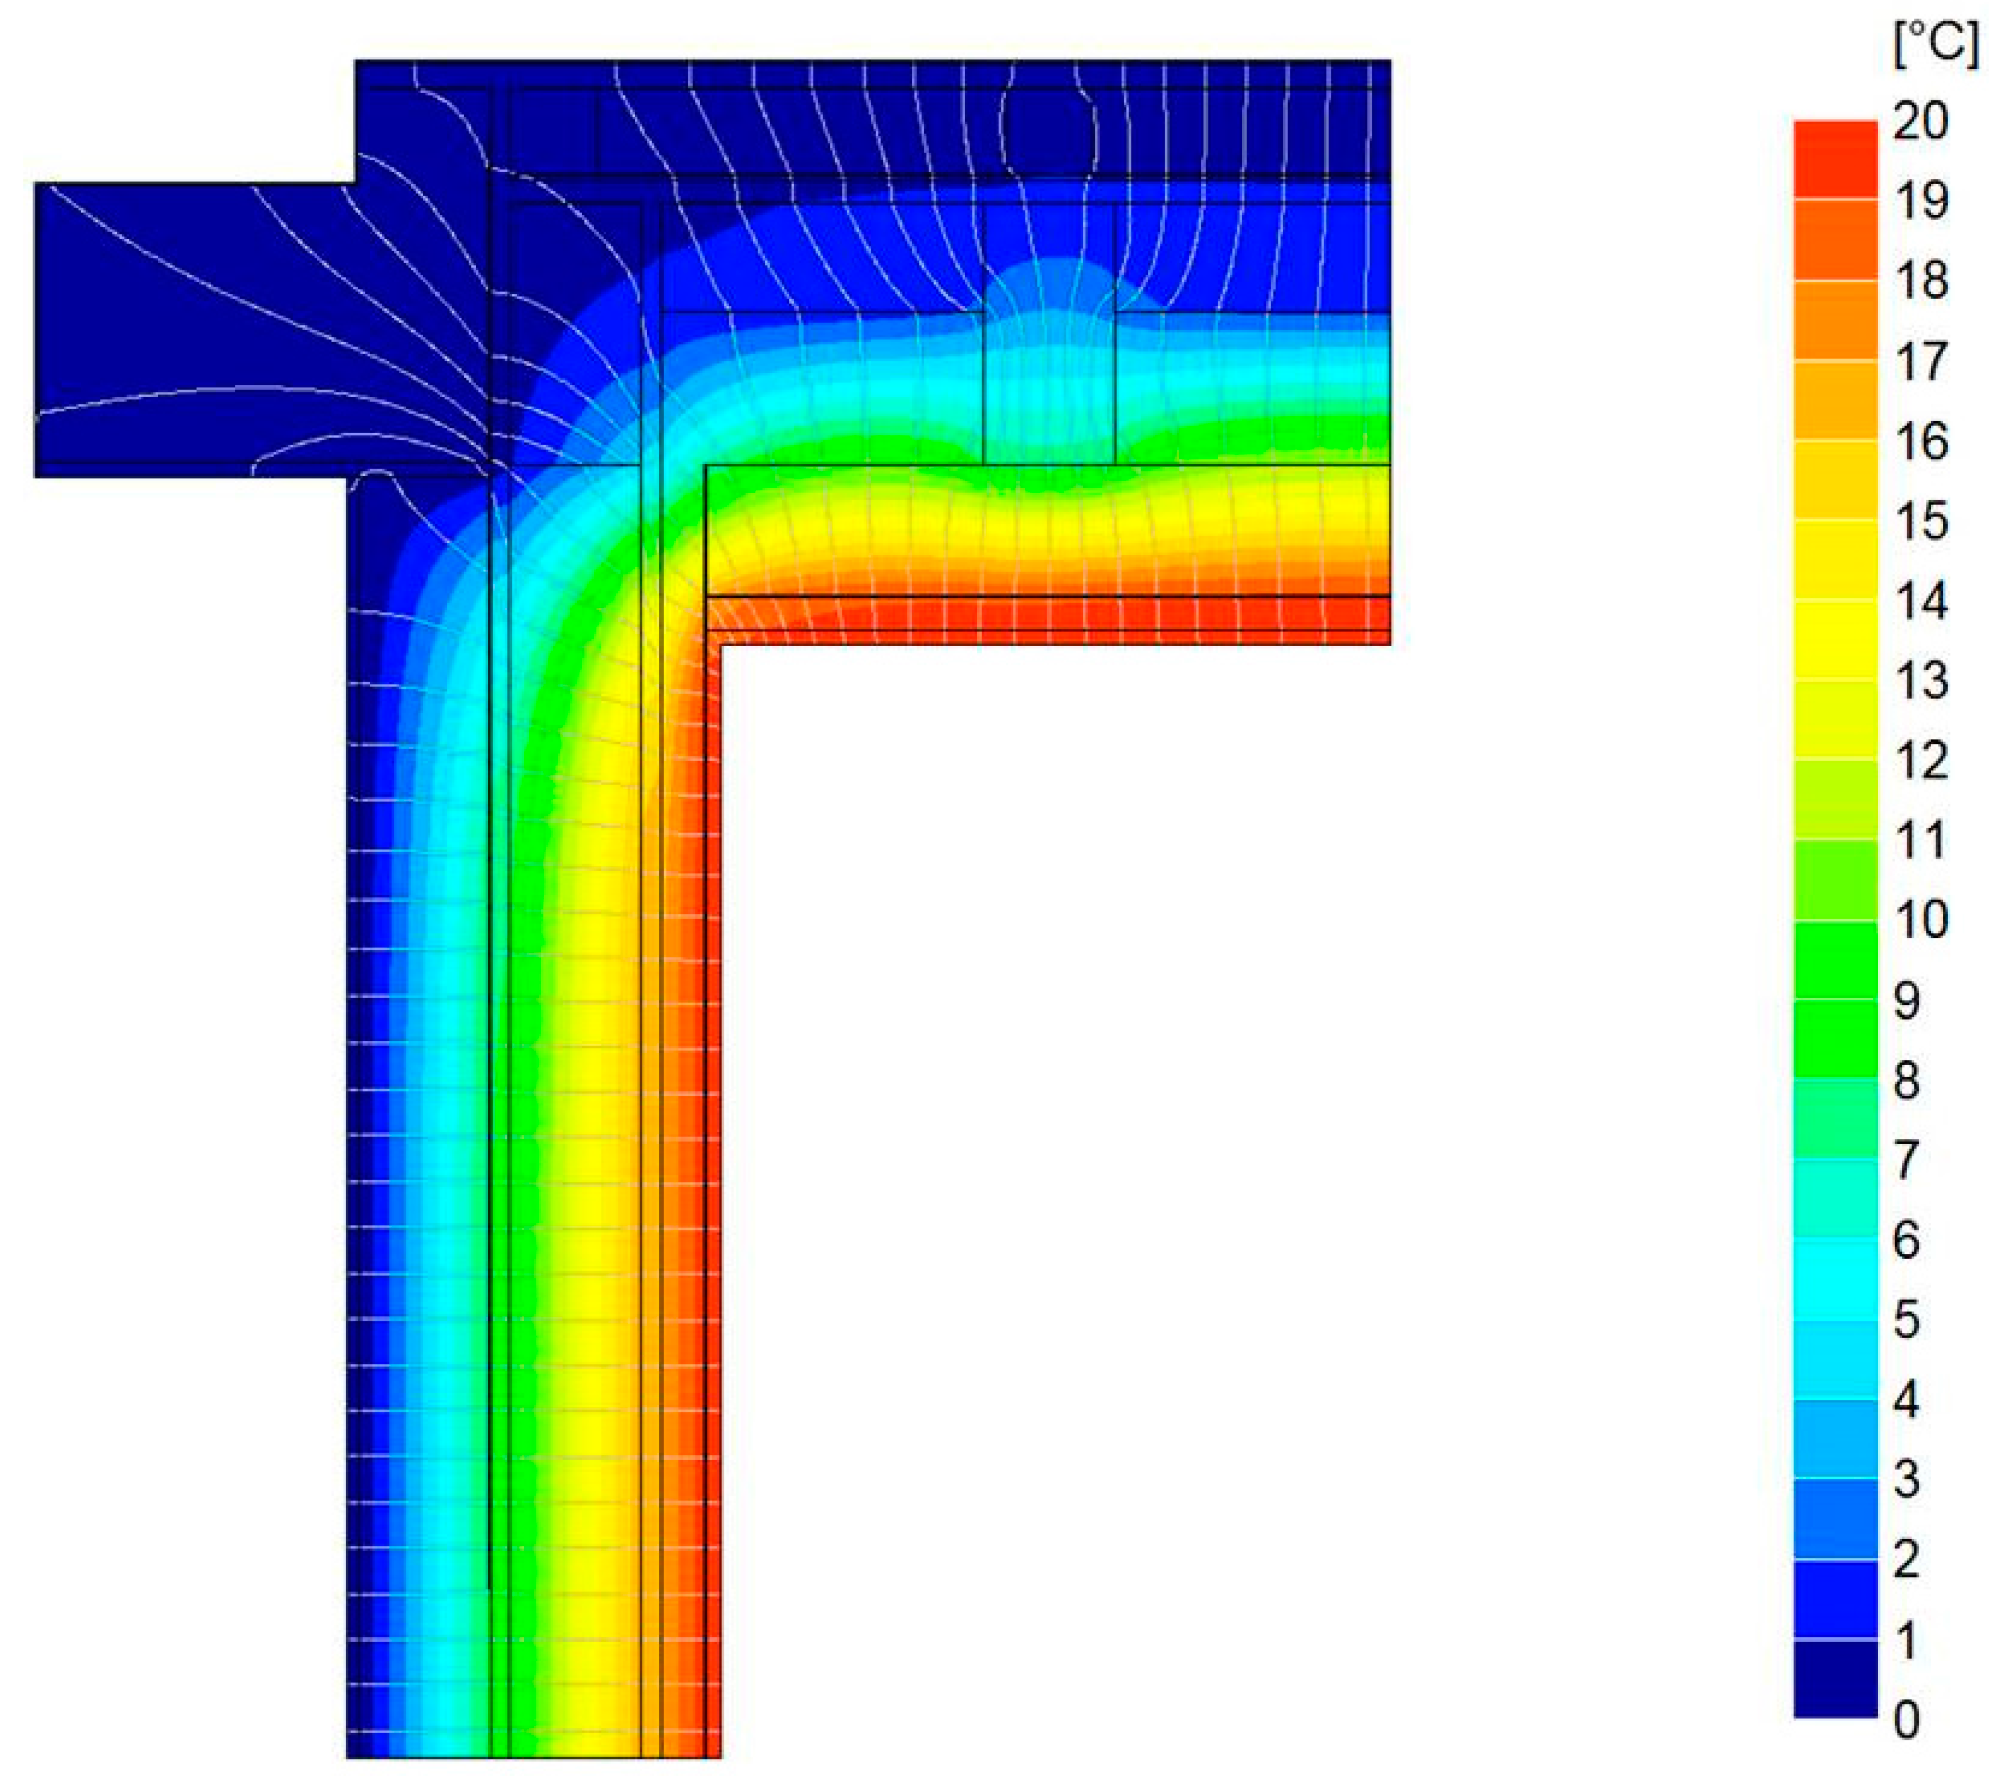
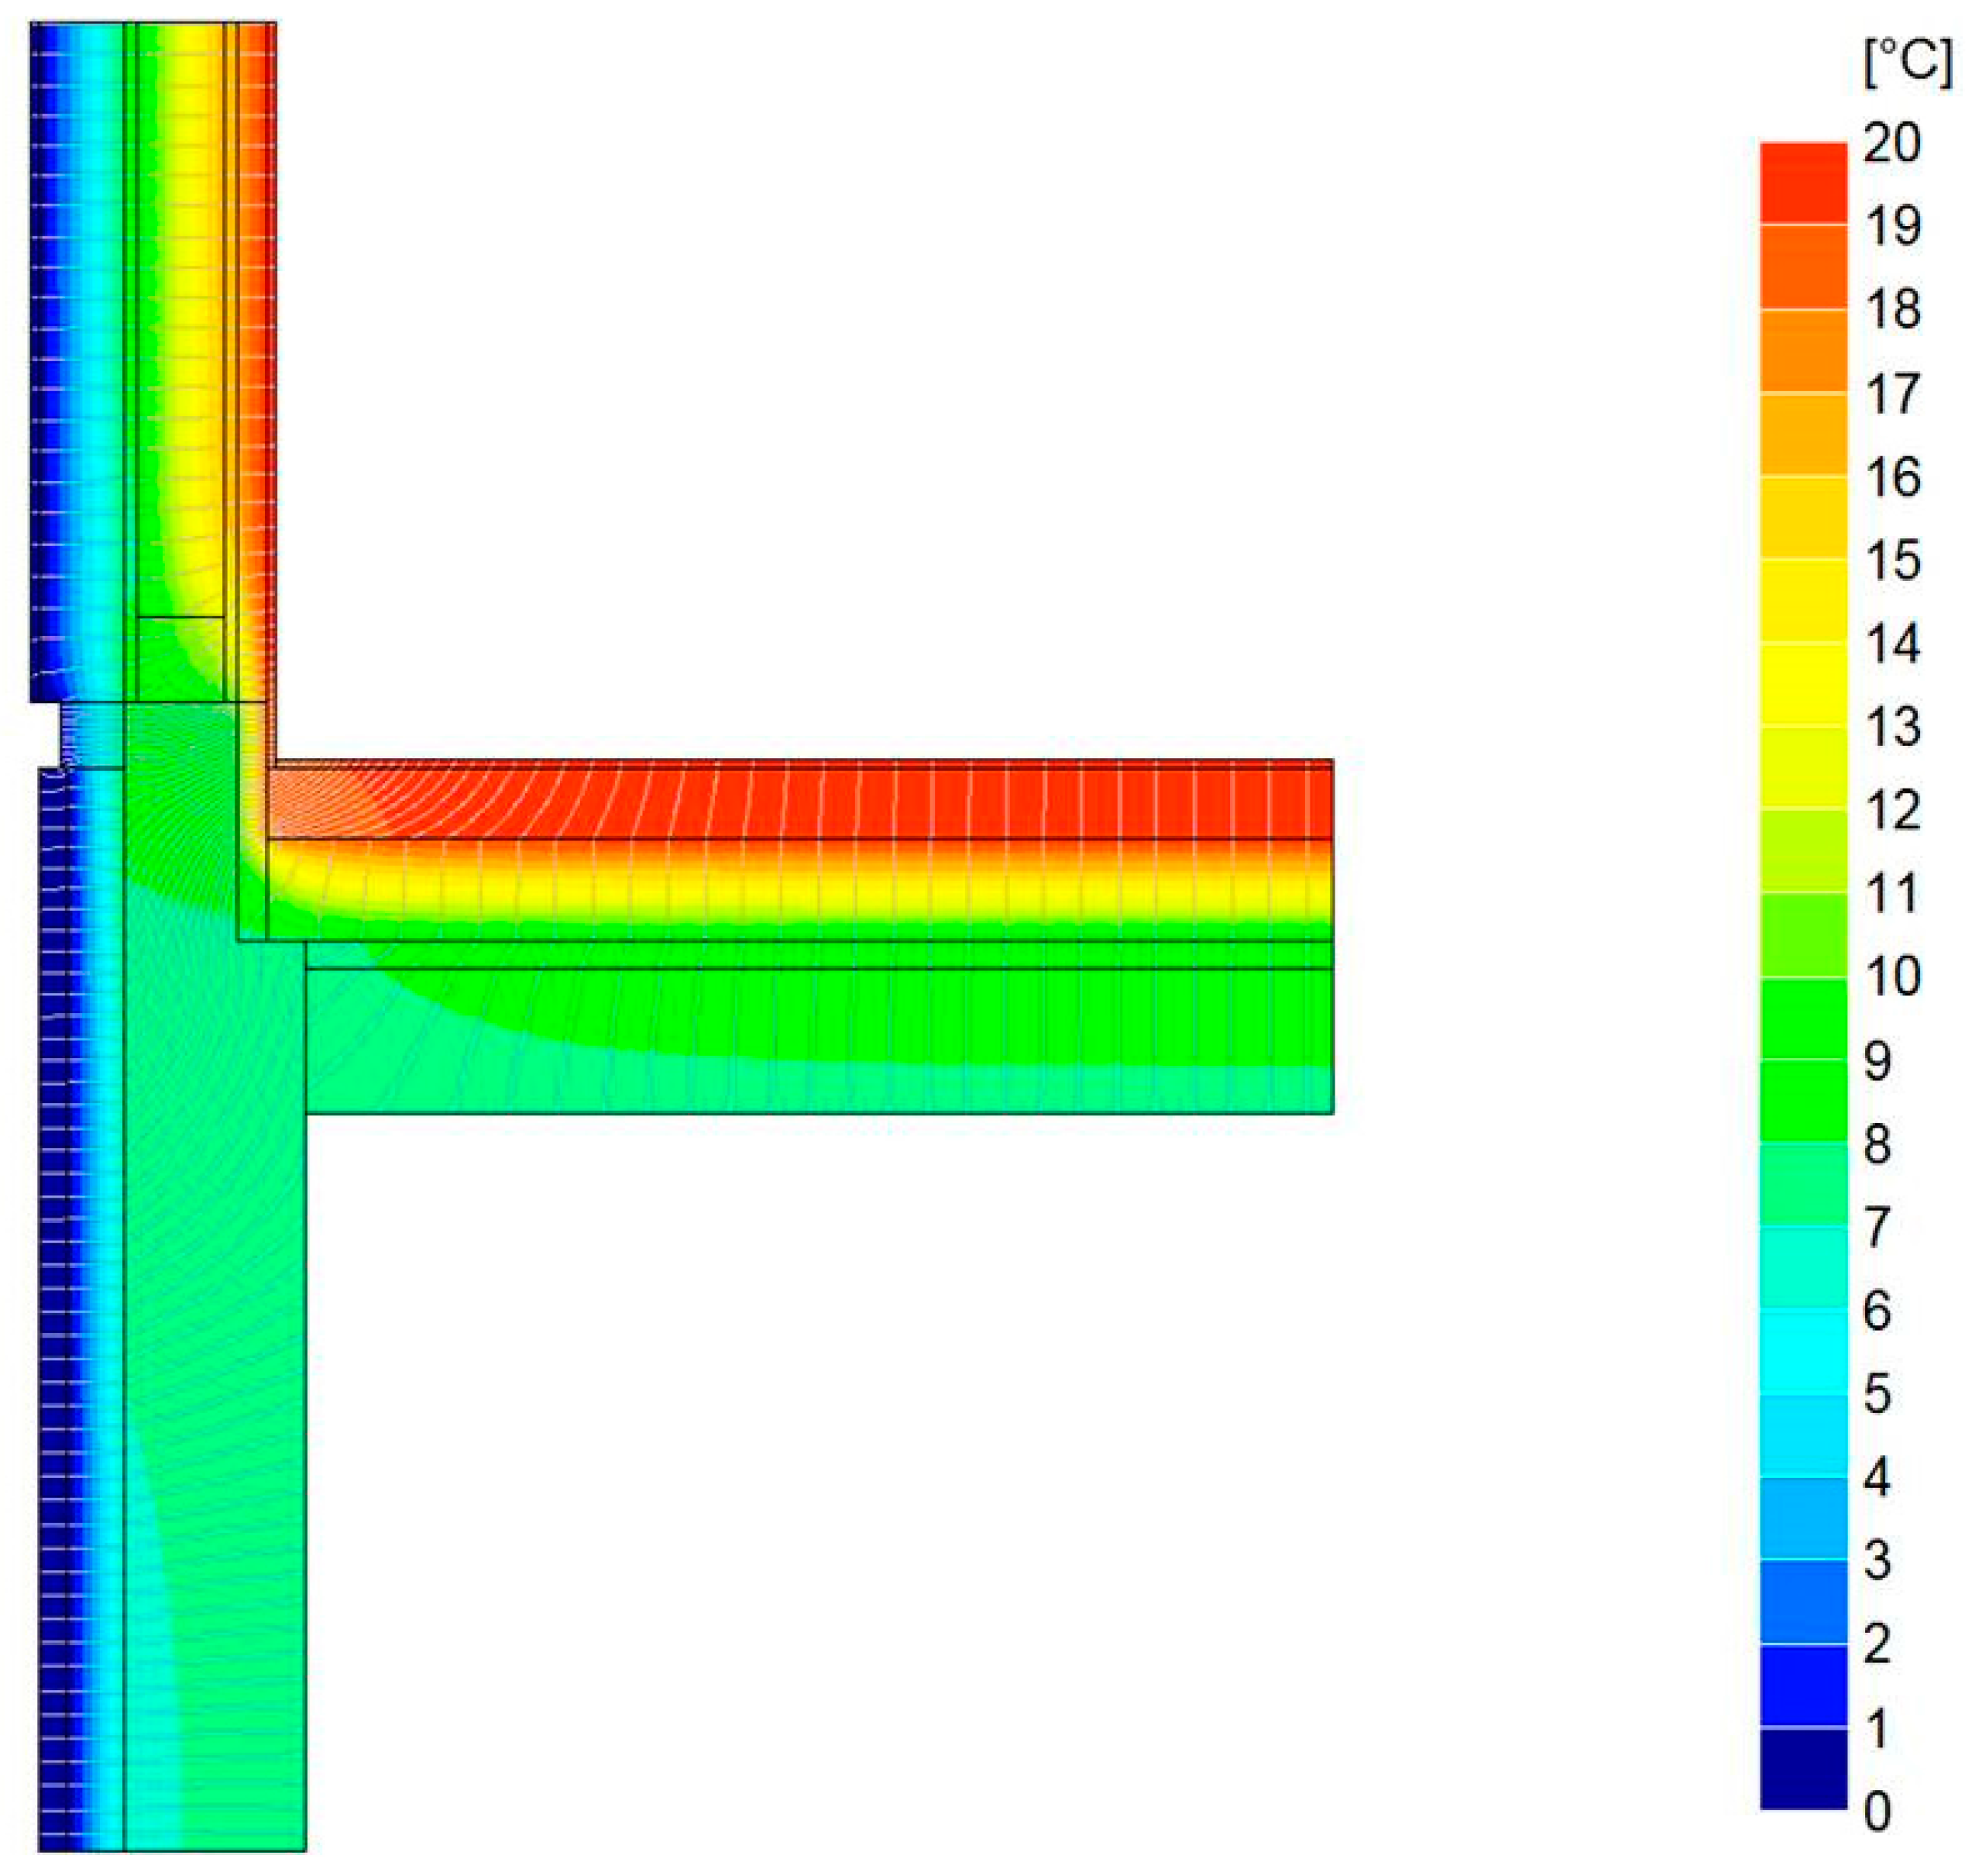
  • connection between external wall and roof;
  • connection between wall and window frame;
  • connection between external wall and basement floor; and
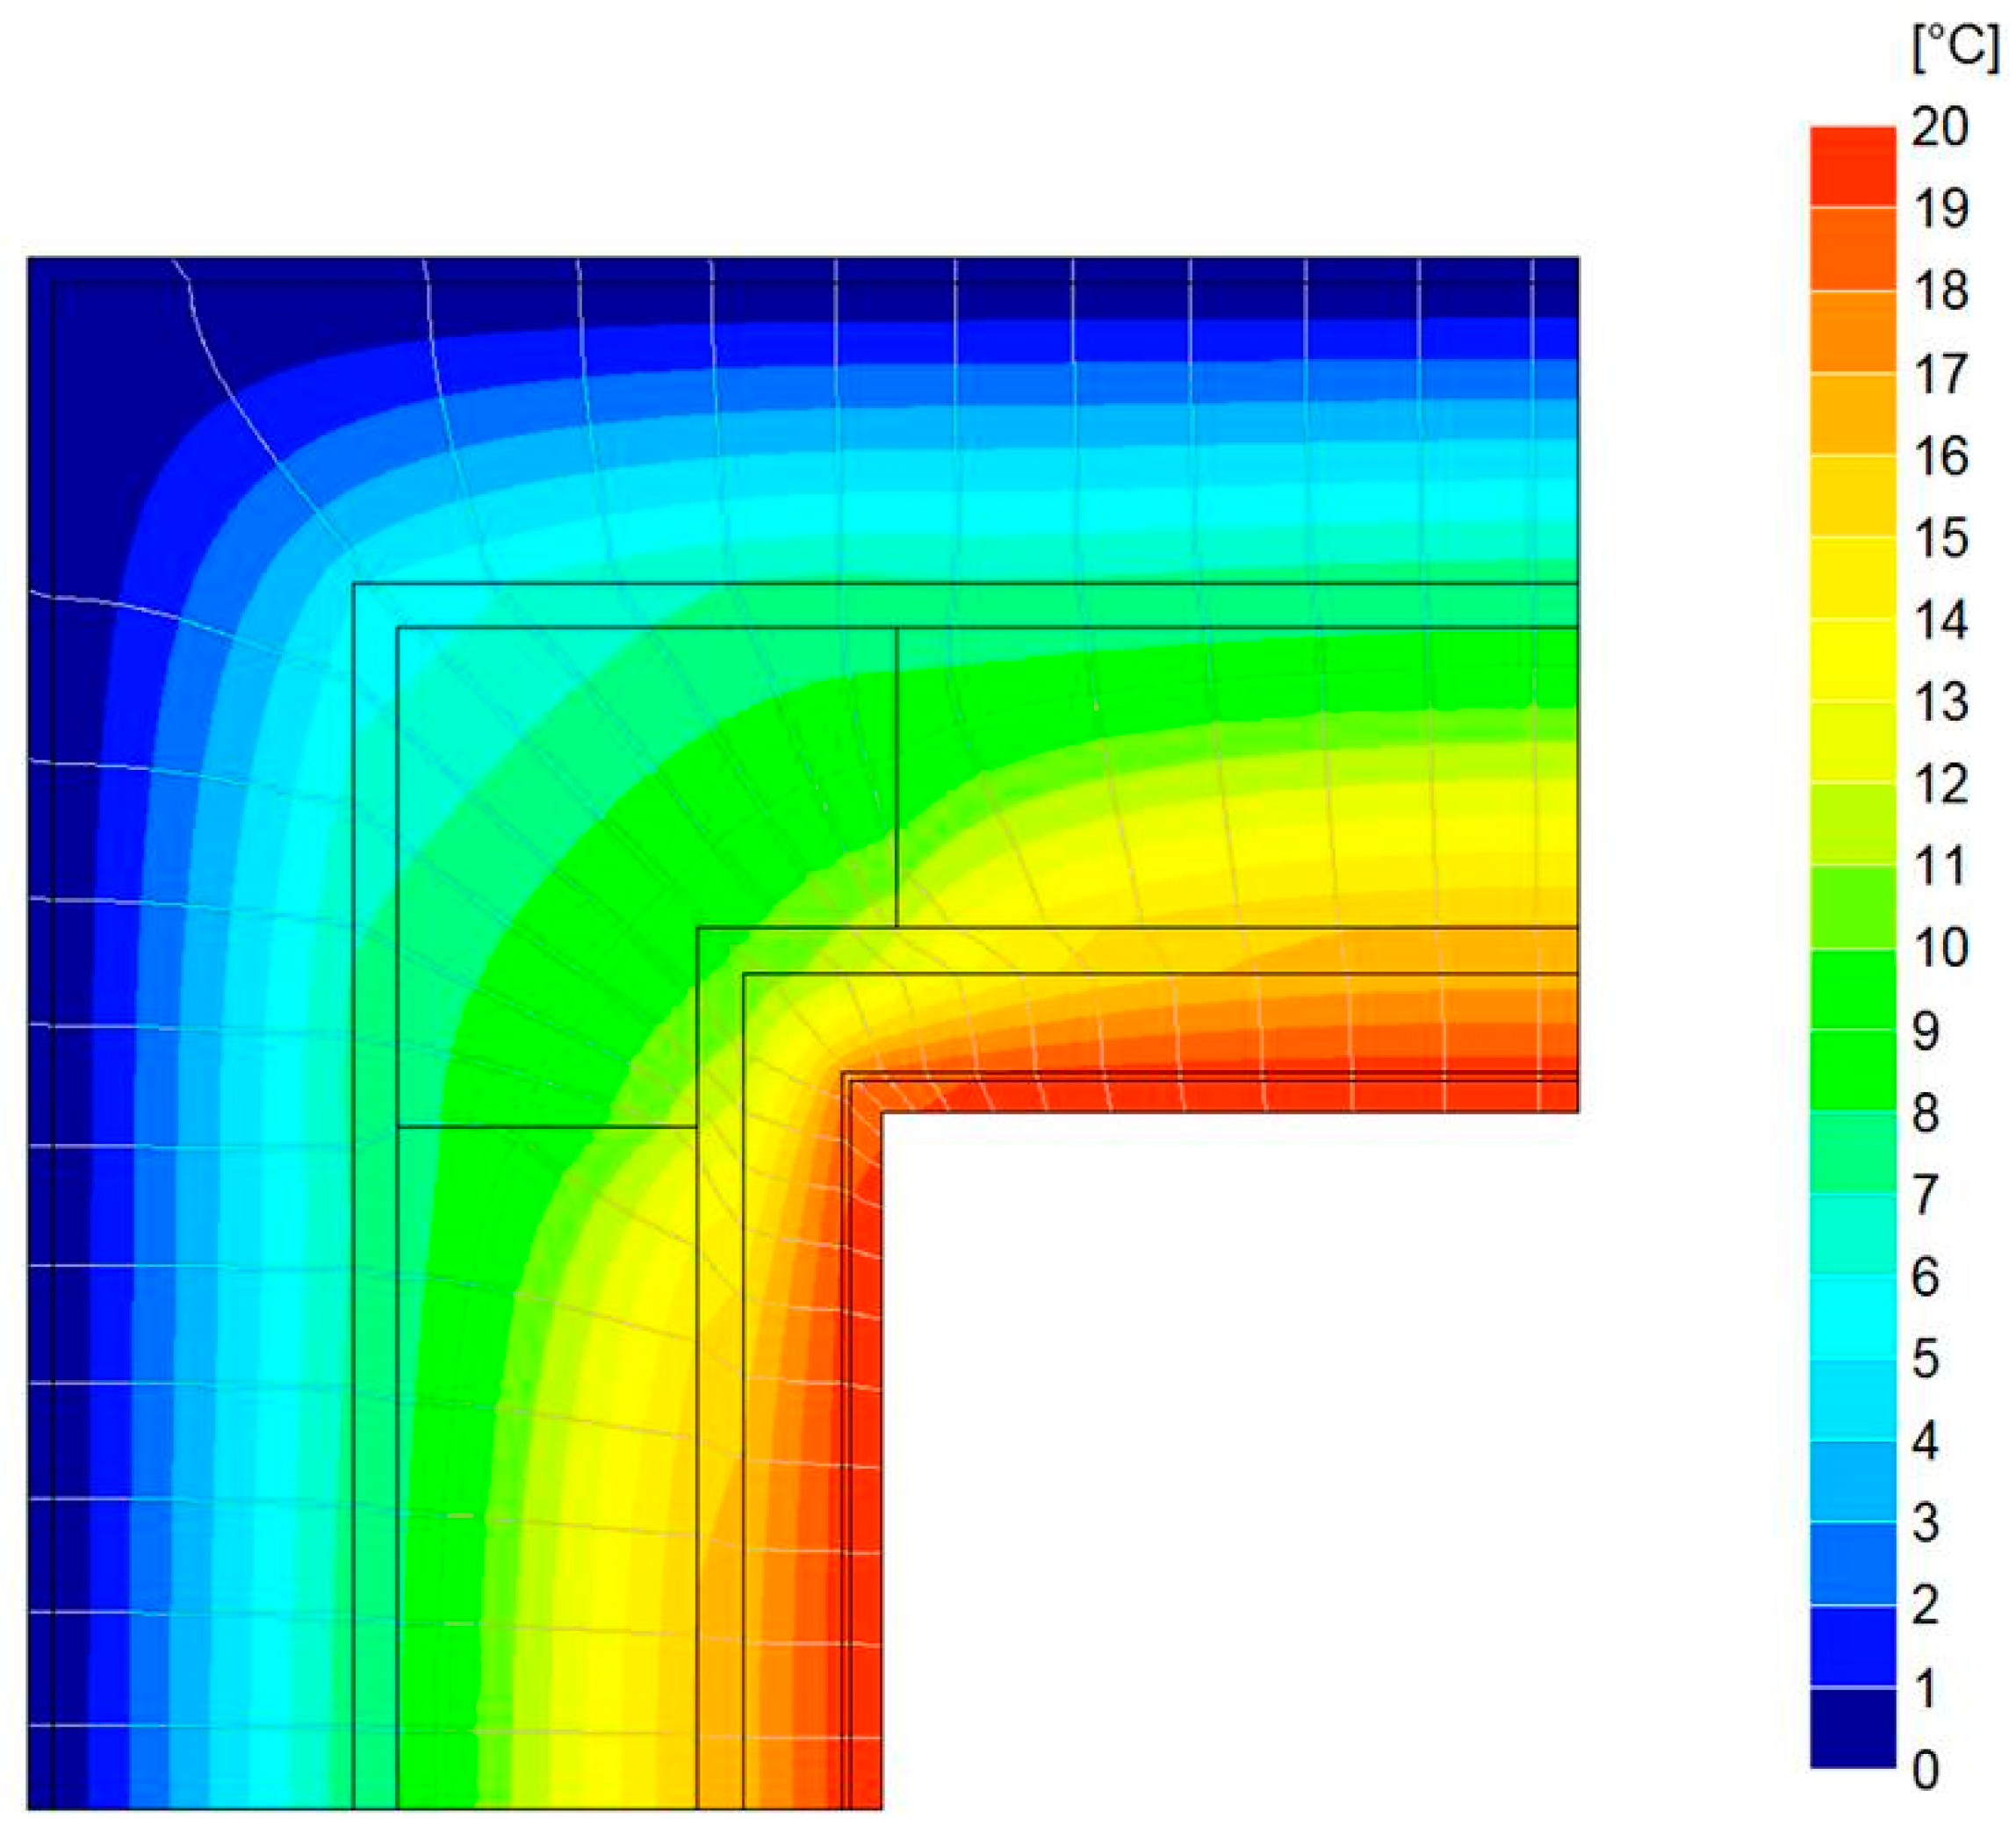
  • convex angle of the external wall.
In Figure 9, Figure 10, Figure 11, Figure 12 and Figure 13, calculation results from Bisco® are reported. Moreover, temperature trends and heat fluxes lines are highlighted.

2.3. Preliminary Evaluation of Different Shading Systems

This analysis has been carried out to calculate and evaluate the specific energy need for space heating and cooling:
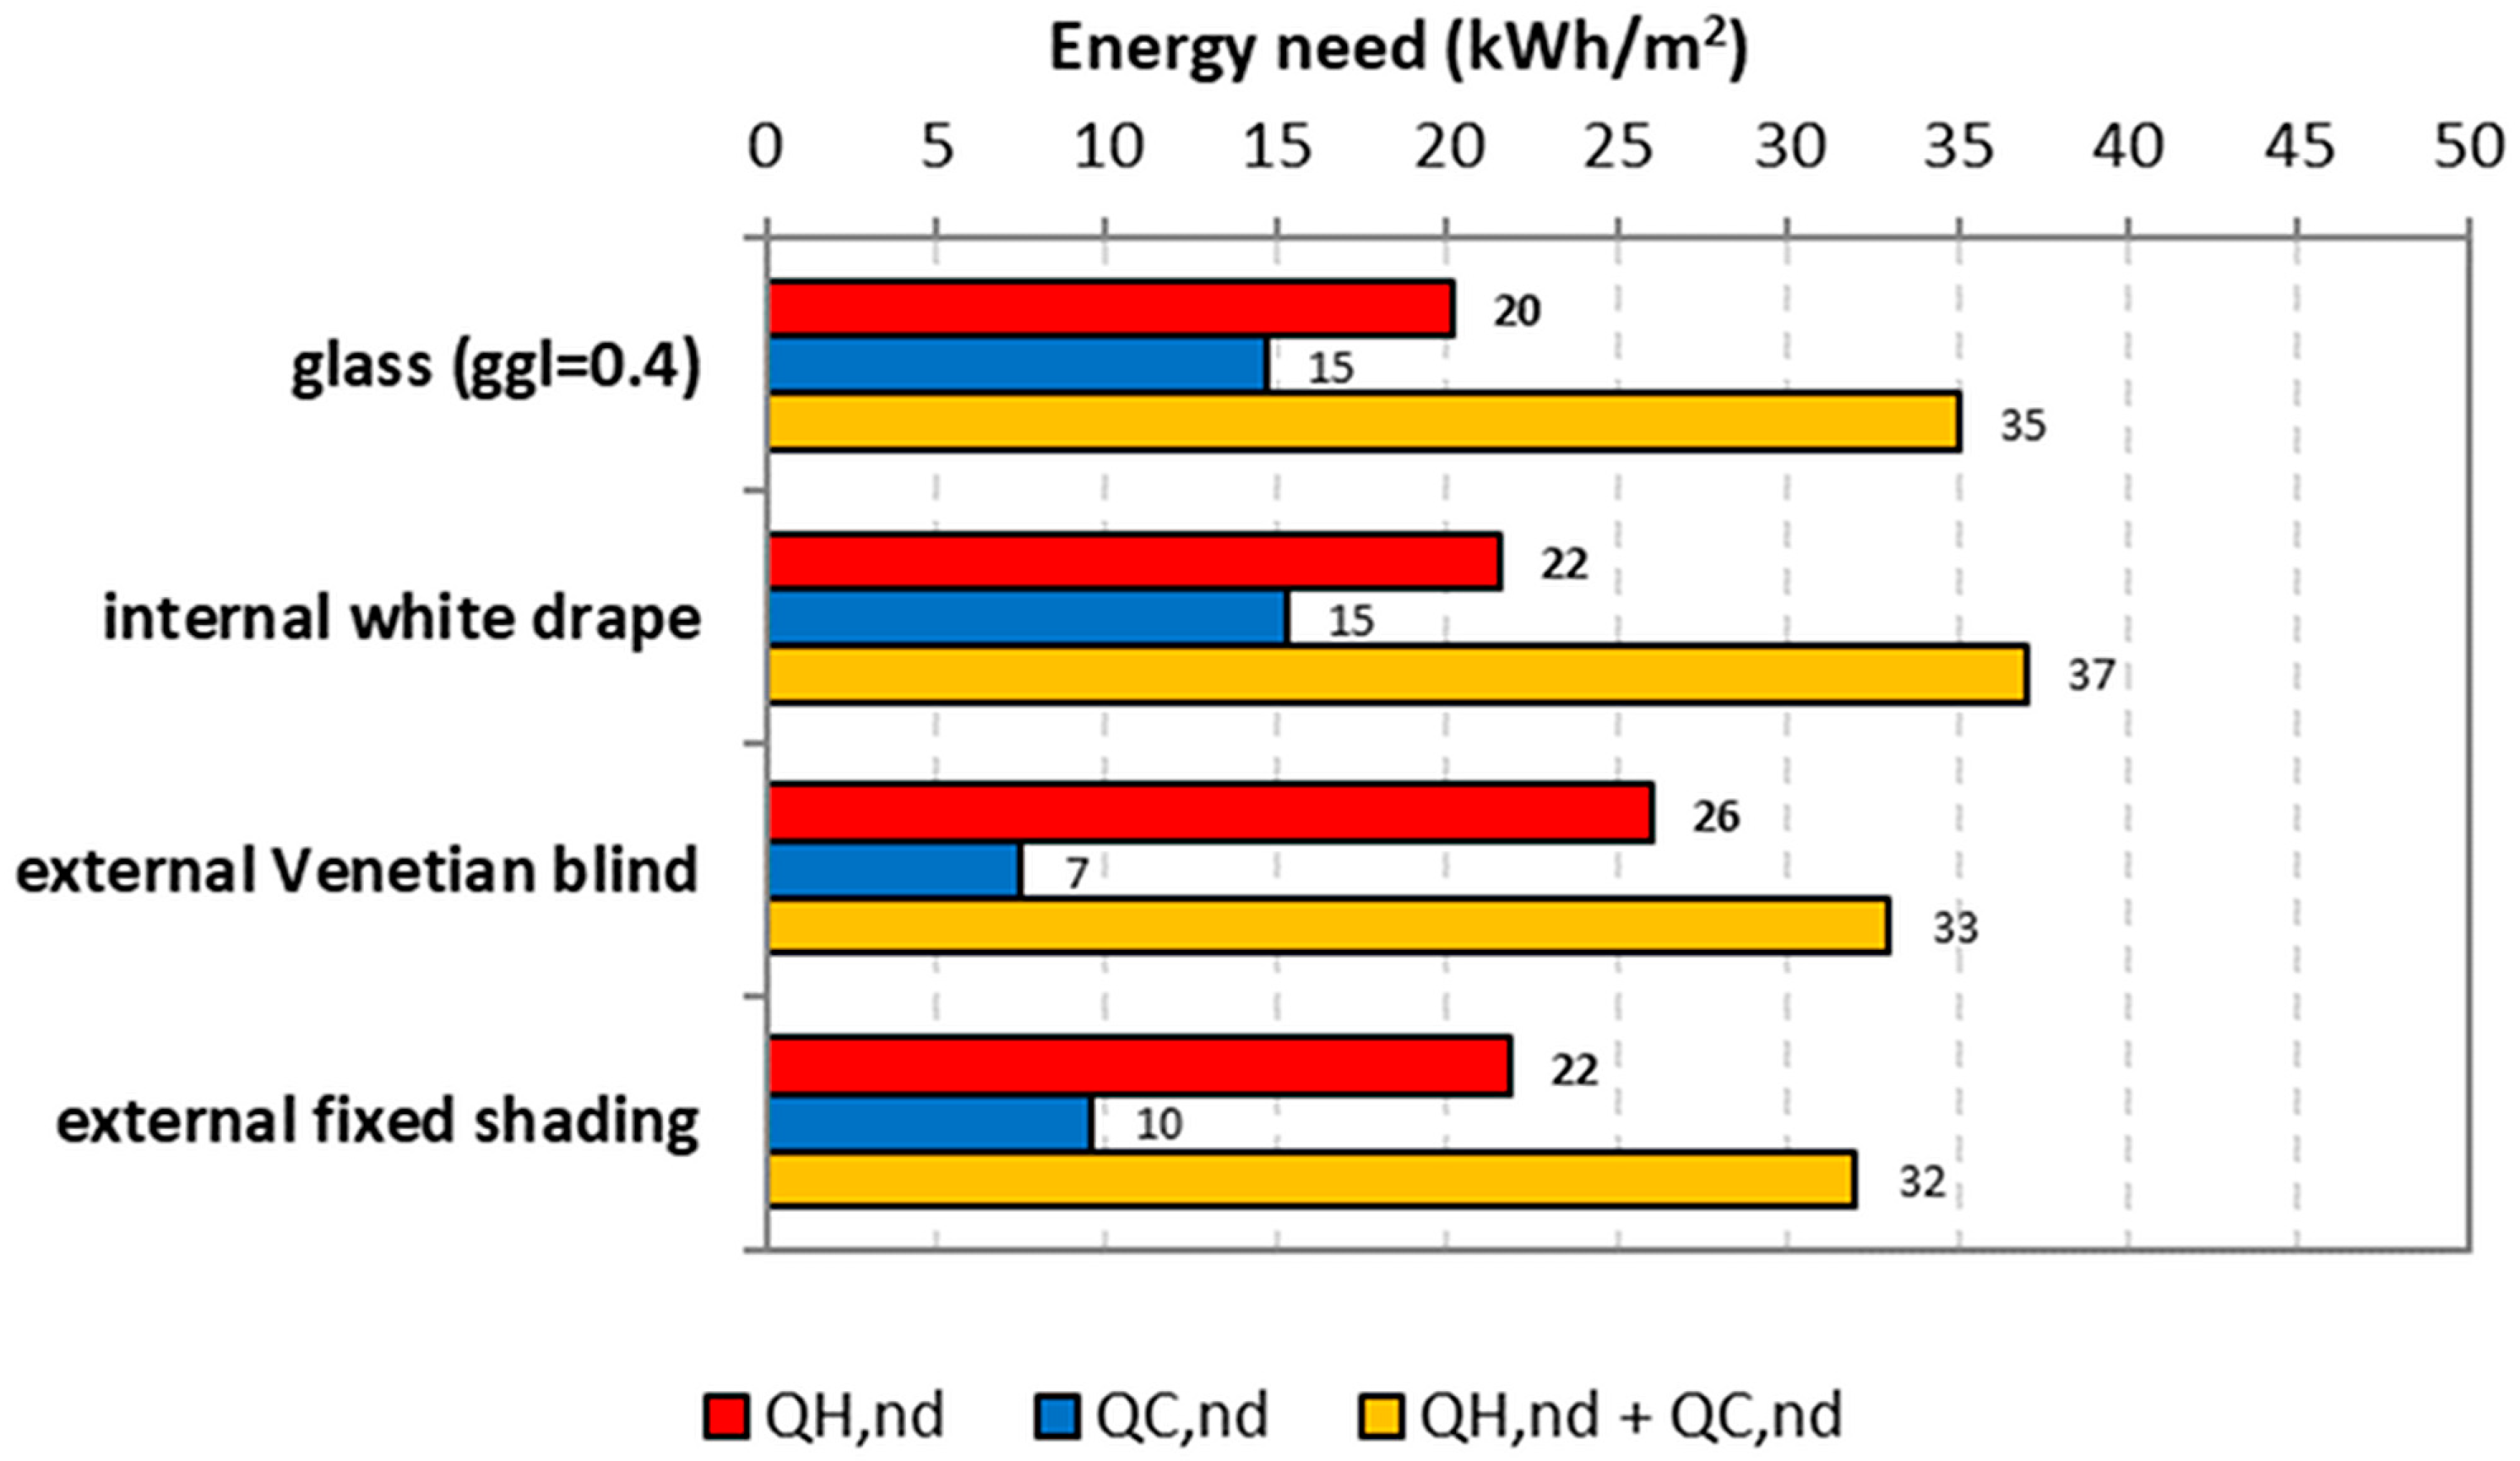
  • QH,nd: specific energy need for space heating (kWh/m2); and
  • QC,nd: specific energy need for space cooling (kWh/m2).
To choose the more performing shading systems, to enhance energy building performances, the following strategies have been assessed. All strategies, reported in Table 8, have to be combined with the window glasses (solar factor ggl = 0.4 and a thermal transmittance Ug = 0.6 W/m2 K).

3. Simulation Results

Energy analysis has been carried out by means of an official calculation code in steady state conditions (Aermec MC11300) and standardized procedures according to Italian Energy Performance Certificate regulations [2].
This simulation analysis is articulated in three steps:
  • first step: energy analysis of the built house taking into account the thermal performance of components and thermal bridges assessed with simplified methodology (UNI EN ISO 6946:2008 and UNI EN ISO 14683:2008);
  • second step: energy analysis of the built house taking into account the presence of heterogeneous components and thermal bridges assessed with a 2D finite element analysis tool (Bisco®); and
  • third step: energy analysis of the building carried out taking into account different solar shading strategies preliminary described in Section 2.3.

3.1. Energy Analysis of the nZEB Building—First Step

In Figure 14, Figure 15, Figure 16, Figure 17 and Figure 18, results dealing with the built house are presented. They refer to:
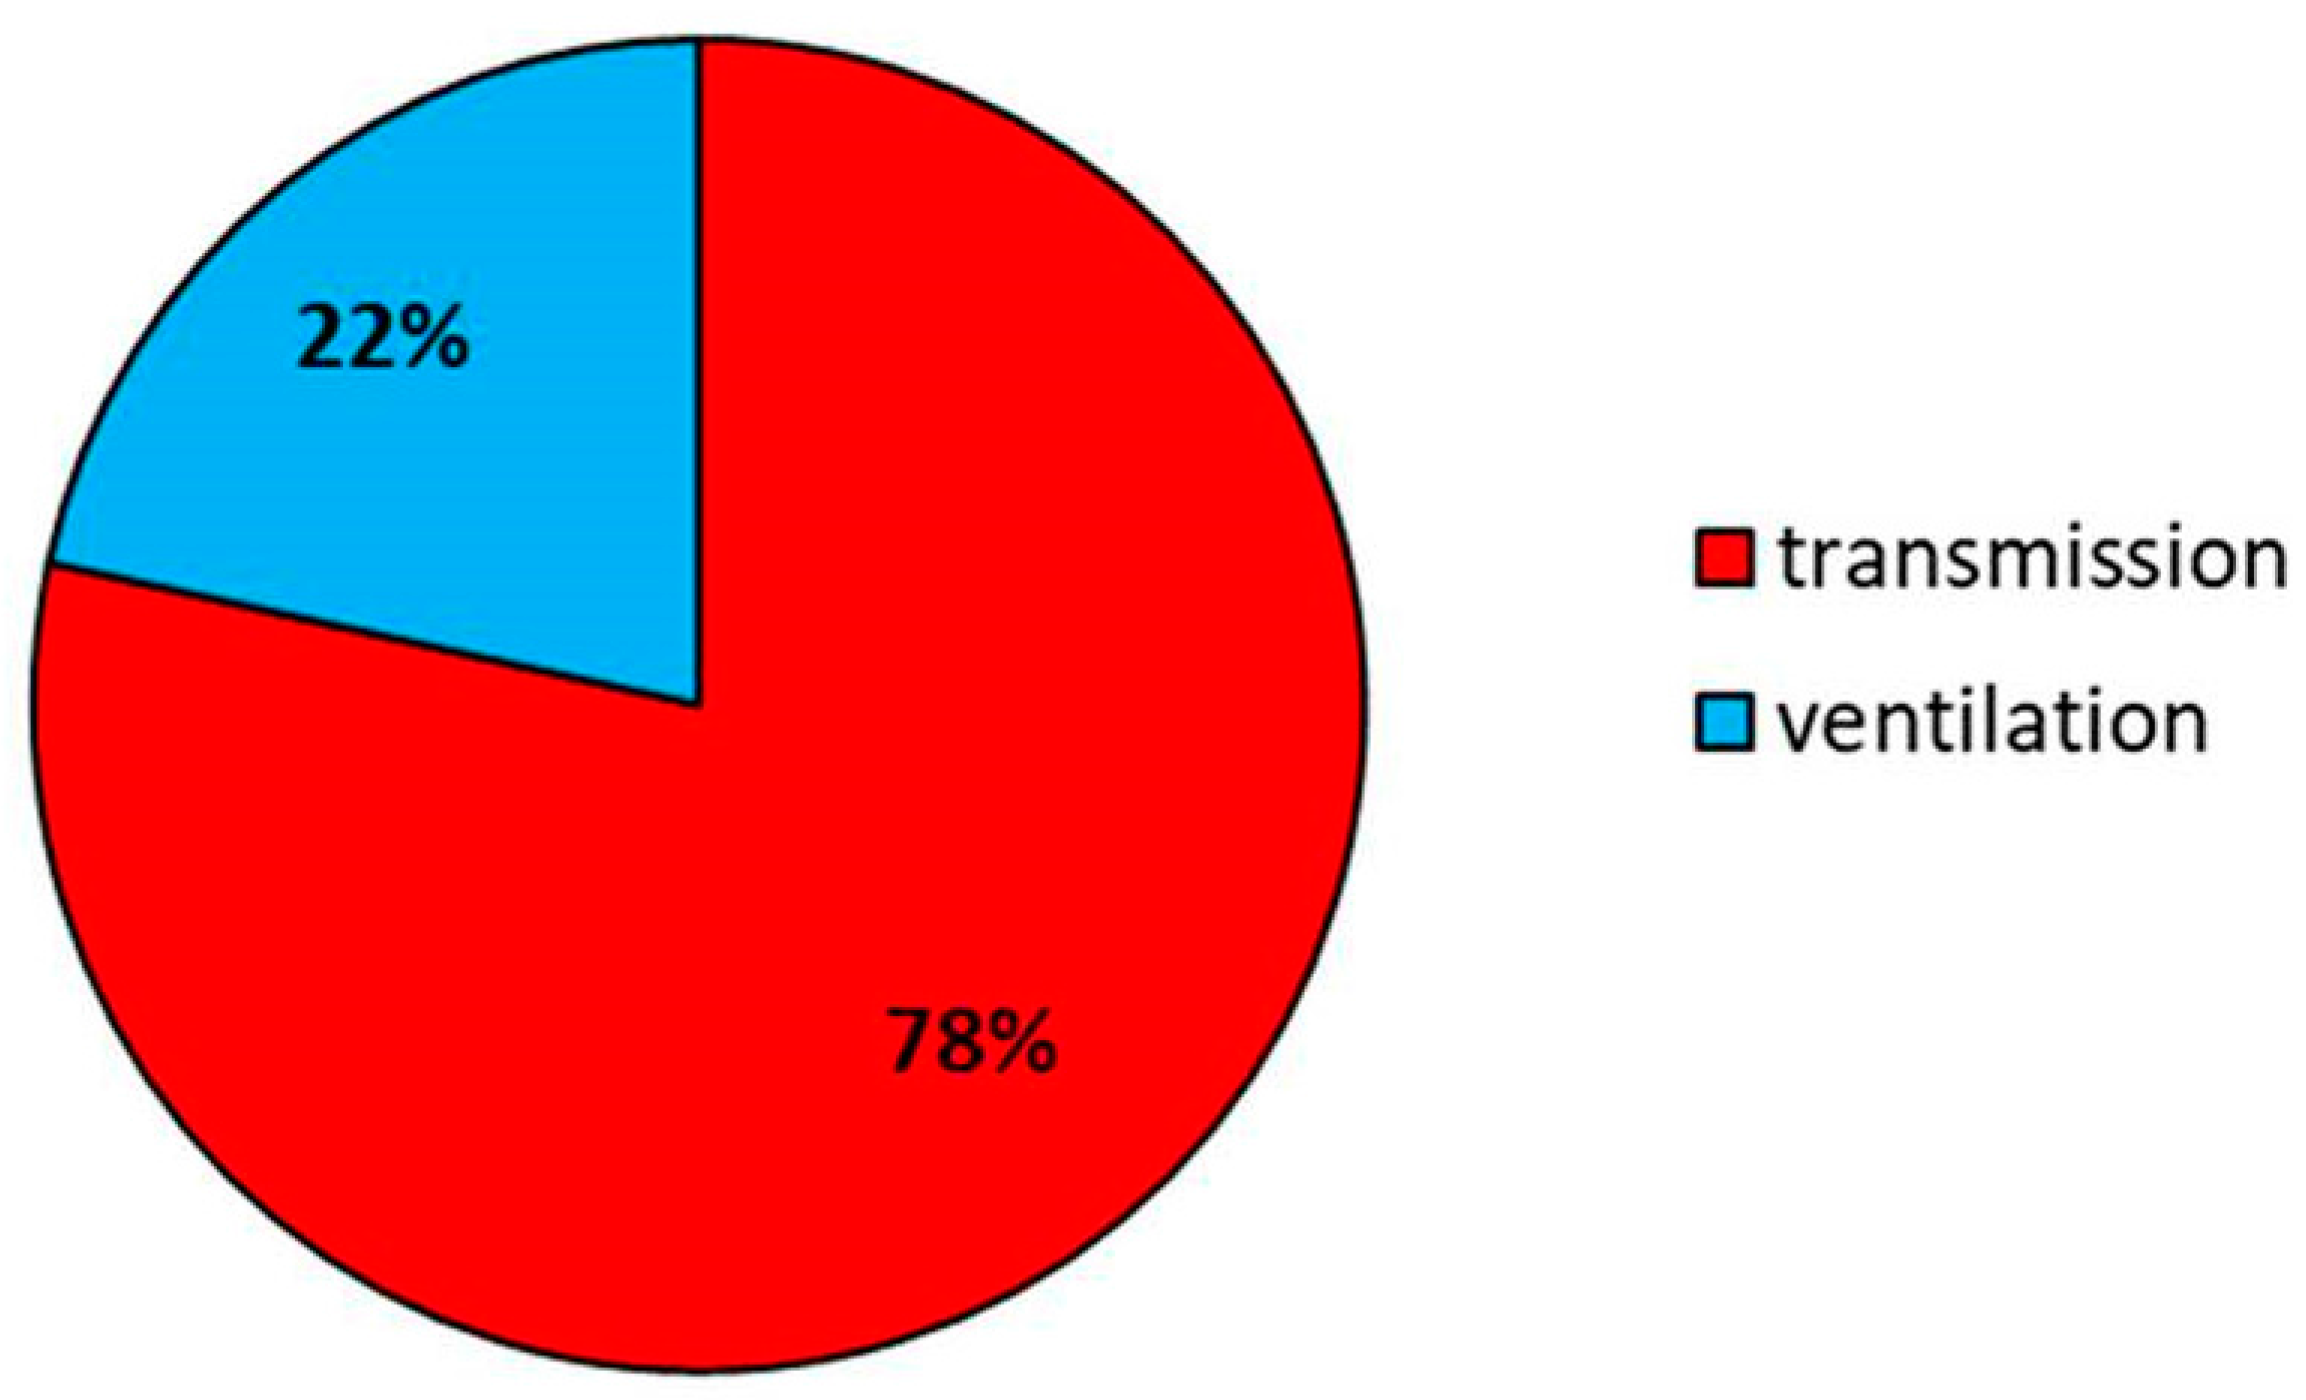
  • design transmission and ventilation heat loss for heated space (in percentage) (Figure 14);
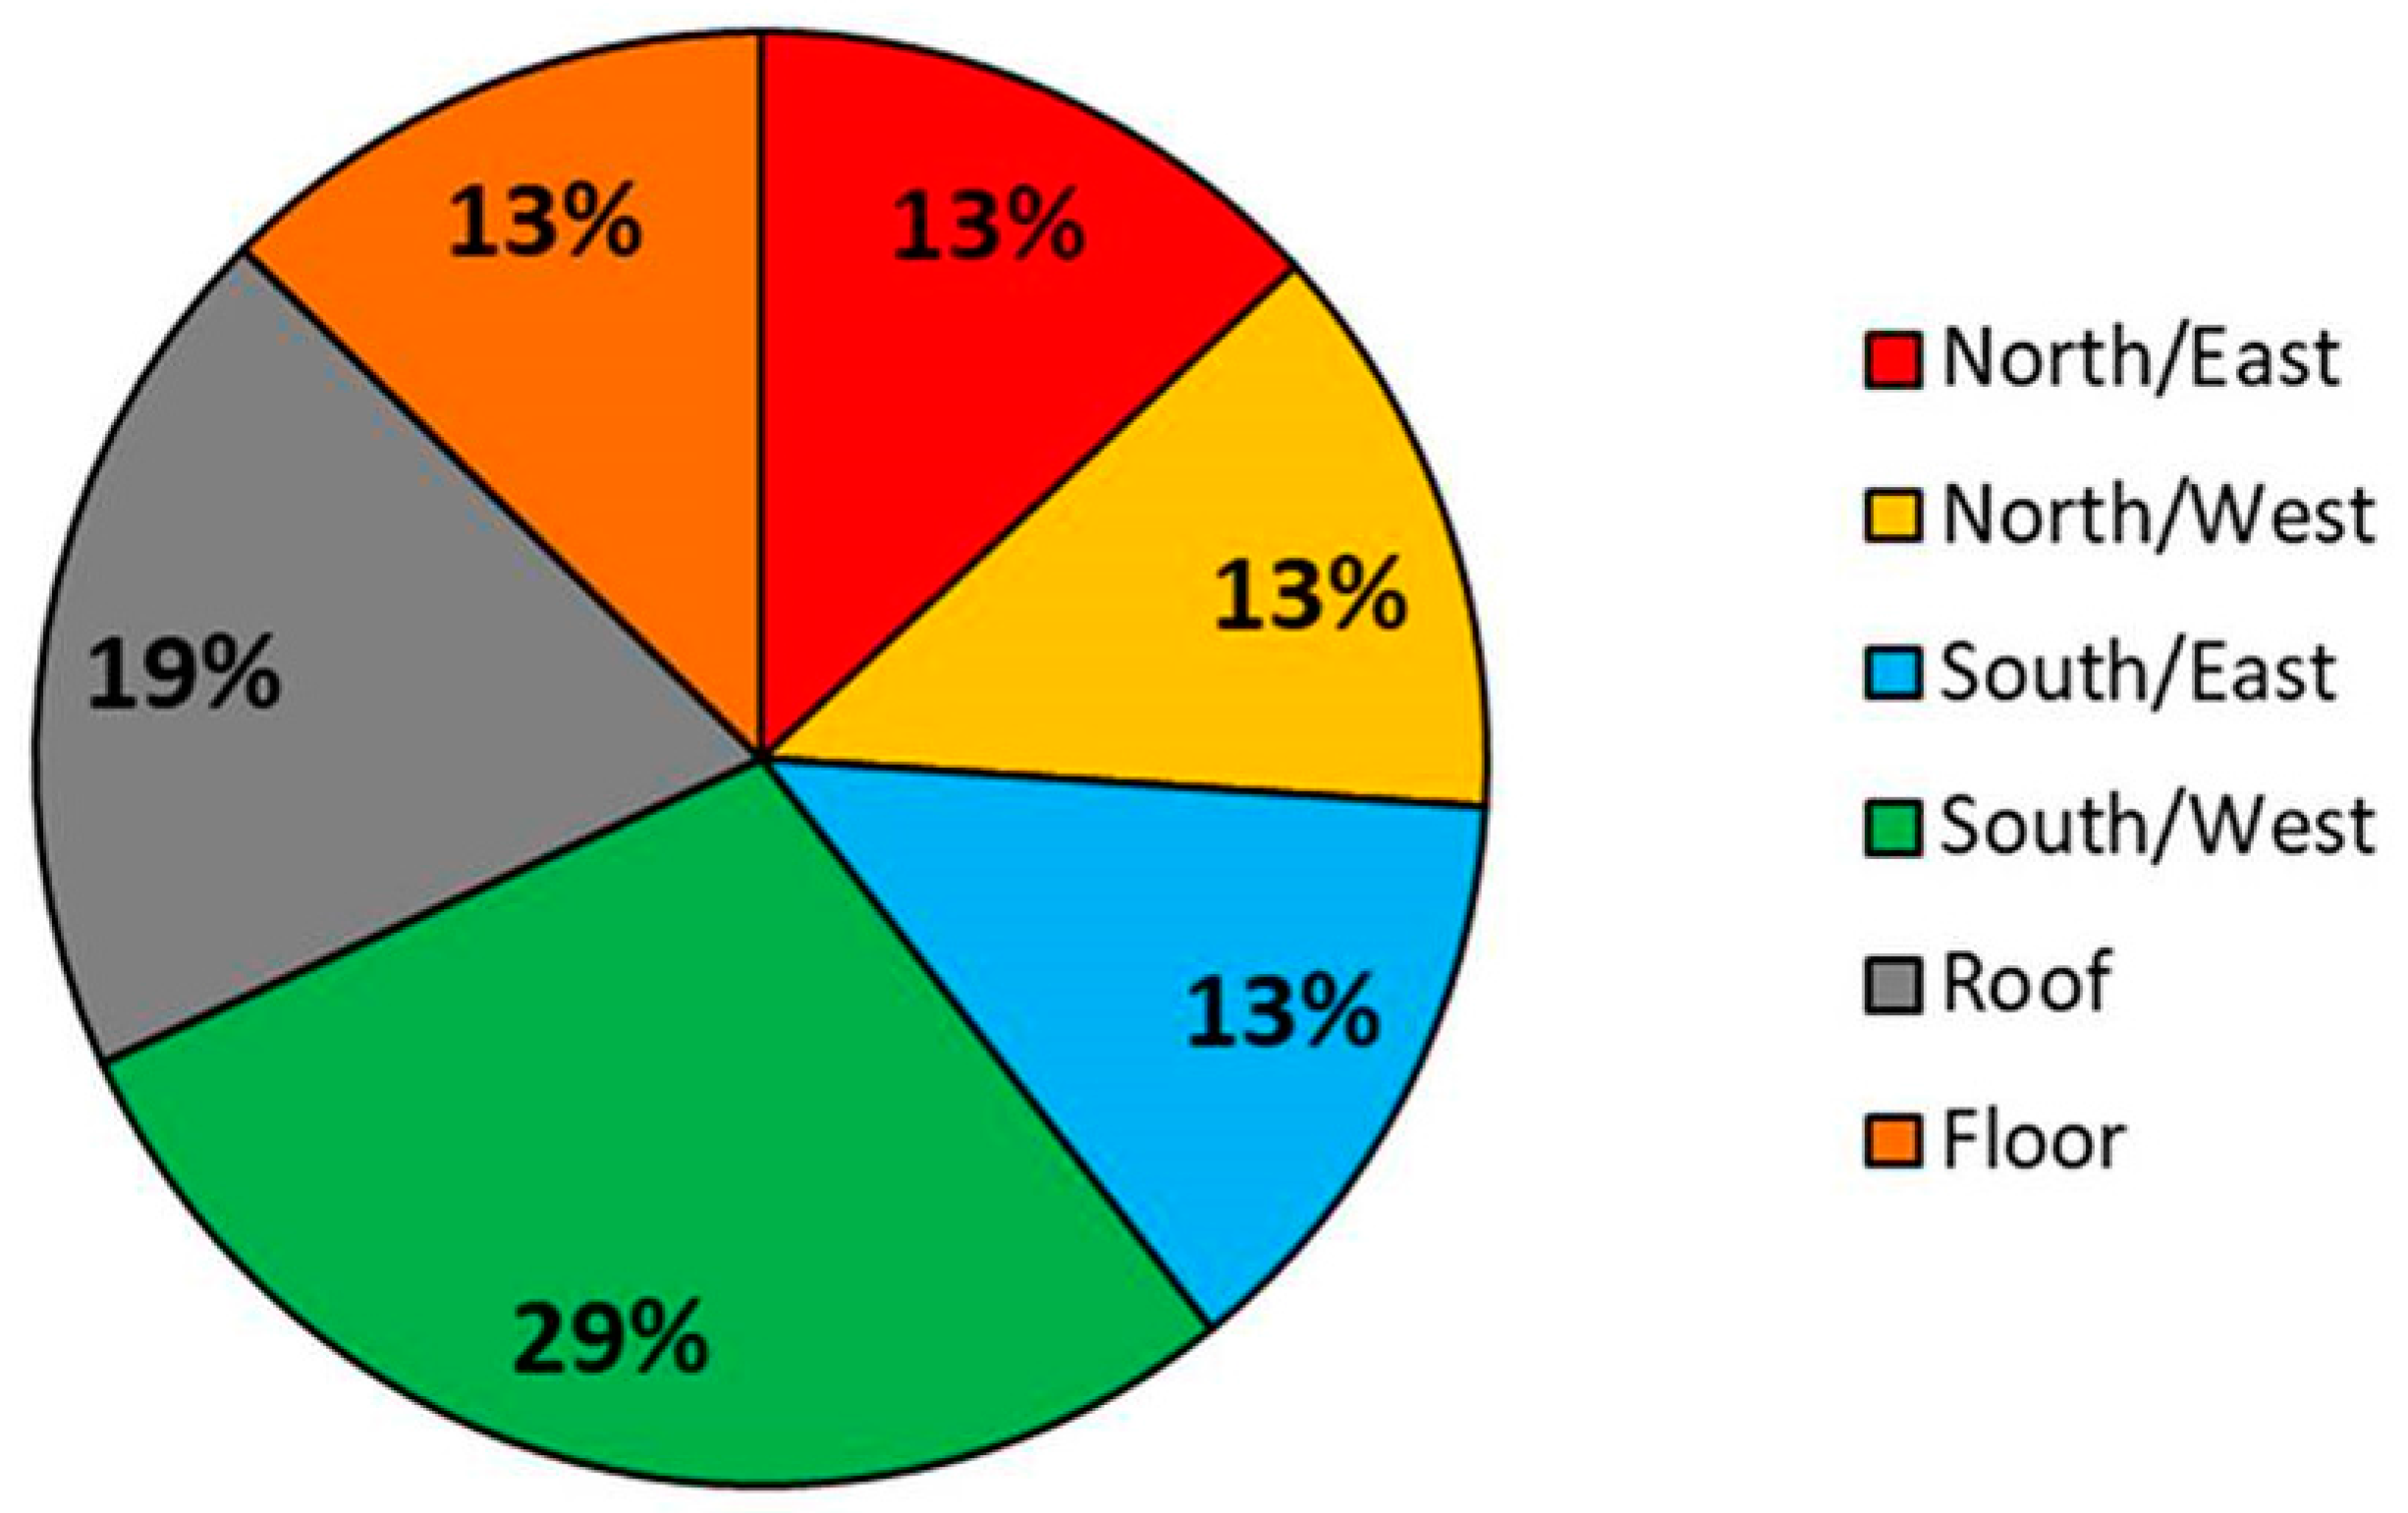
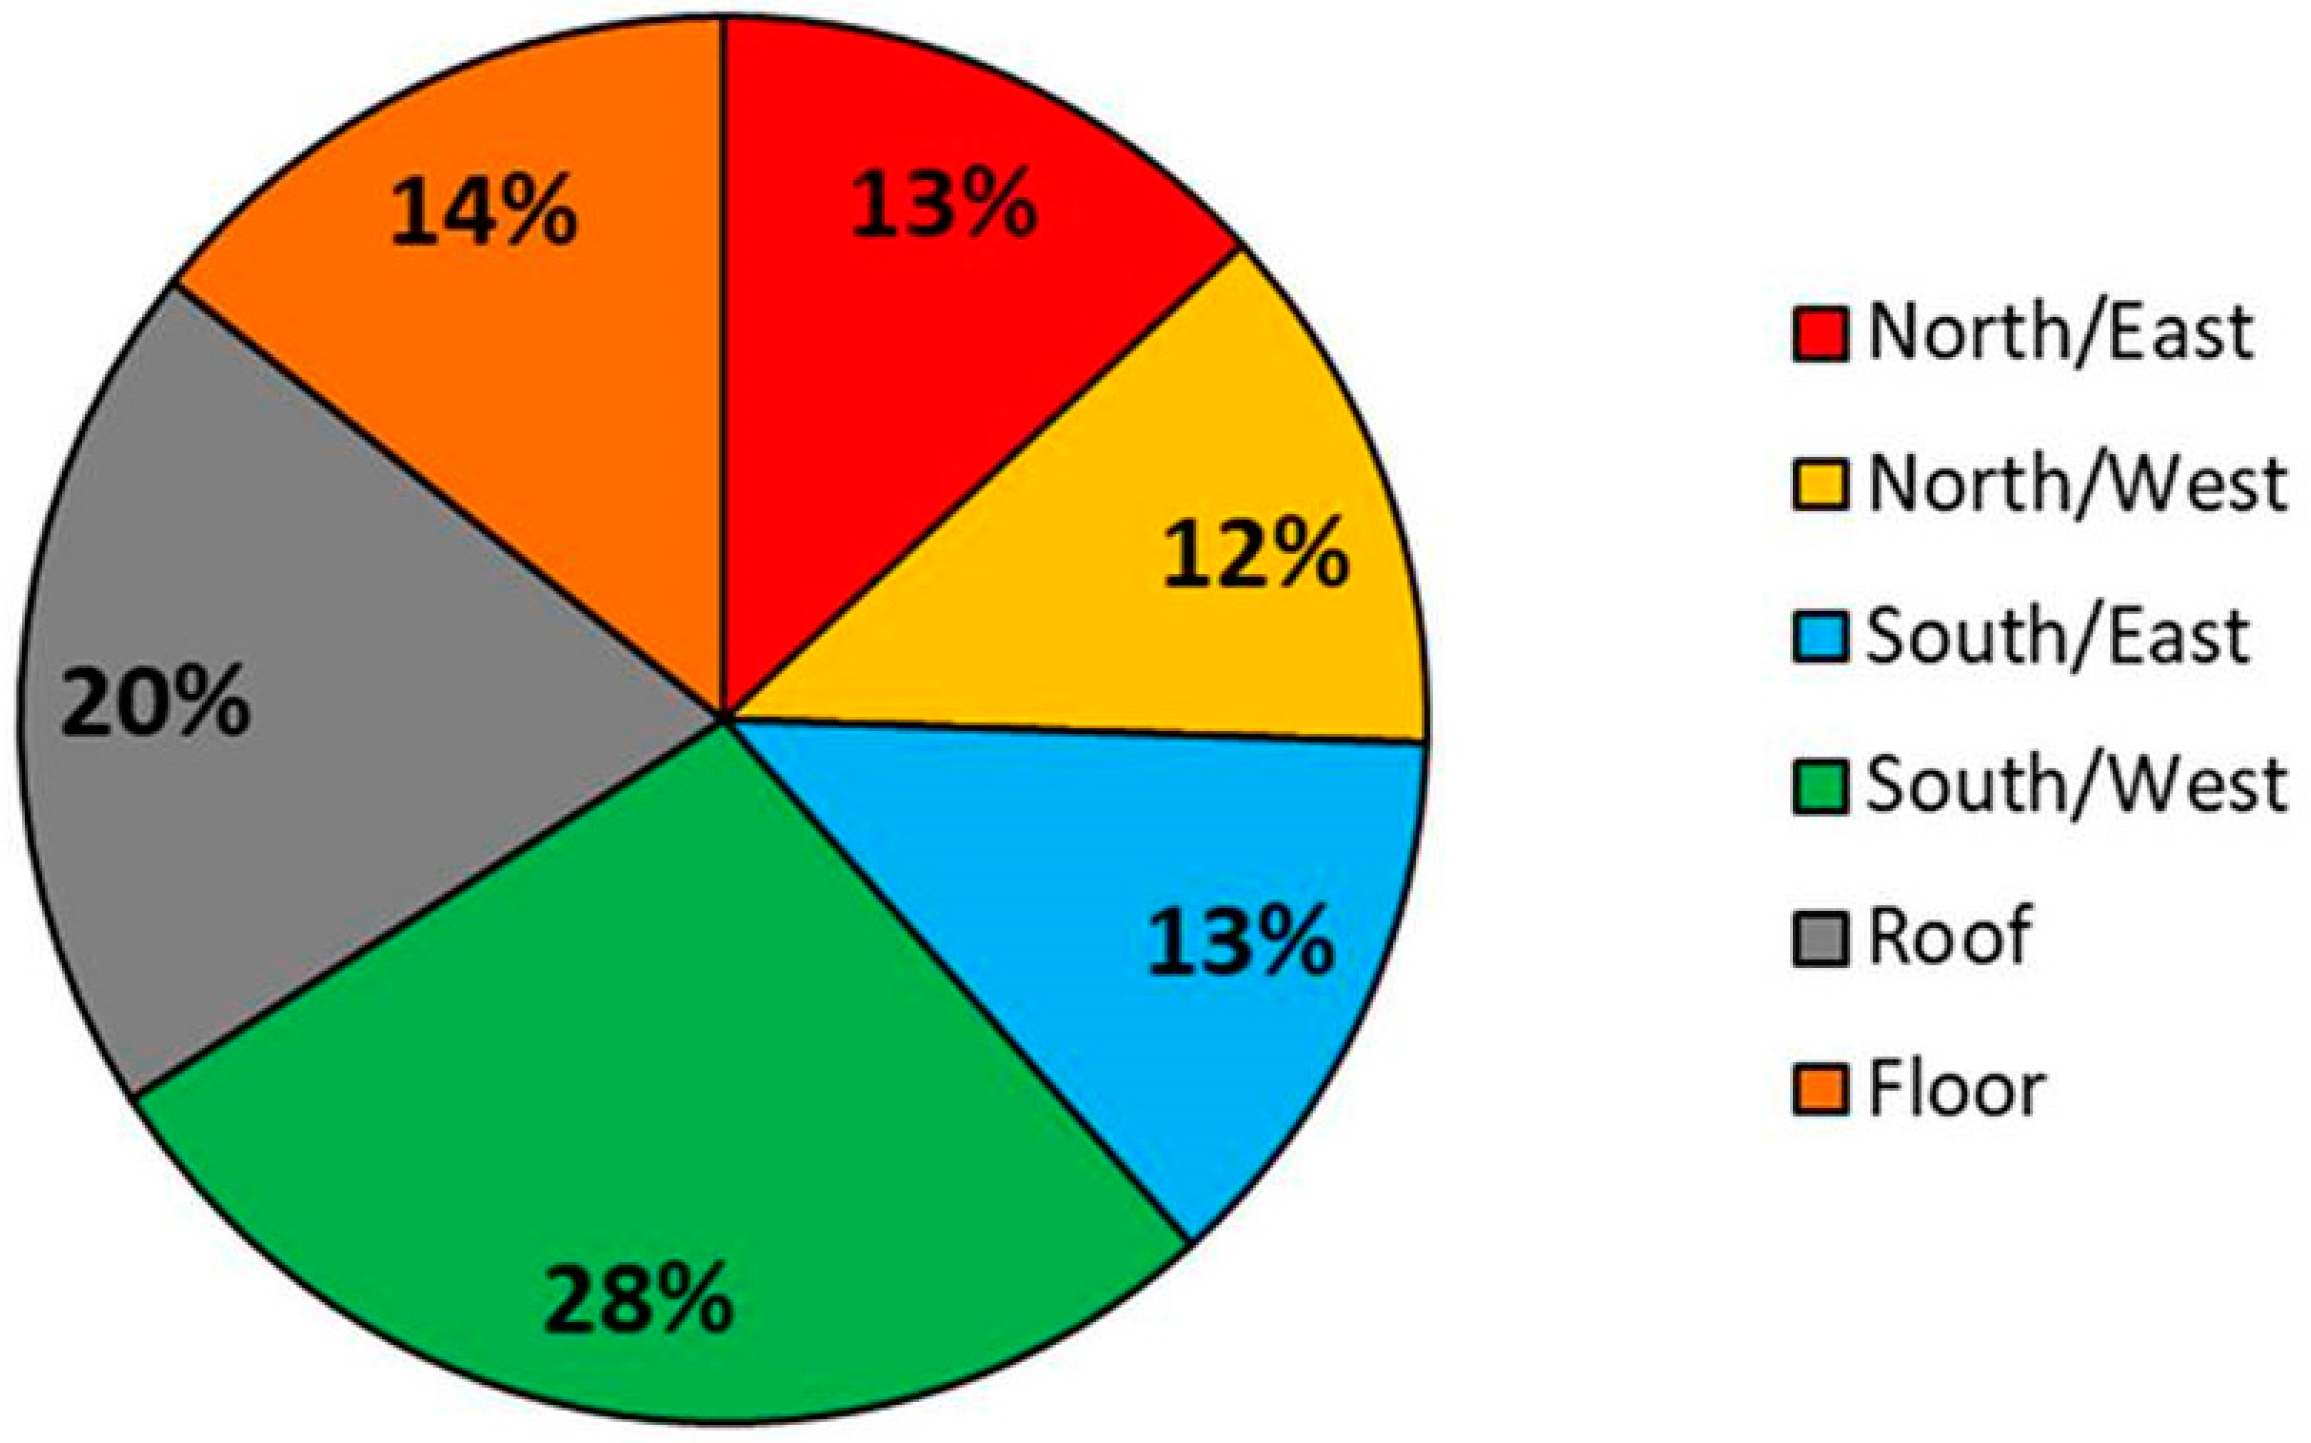
  • design transmission heat loss for heated space analysed according to exposure, such as NE, NW, SE, SW, roof and floor (in percentage) (Figure 15);
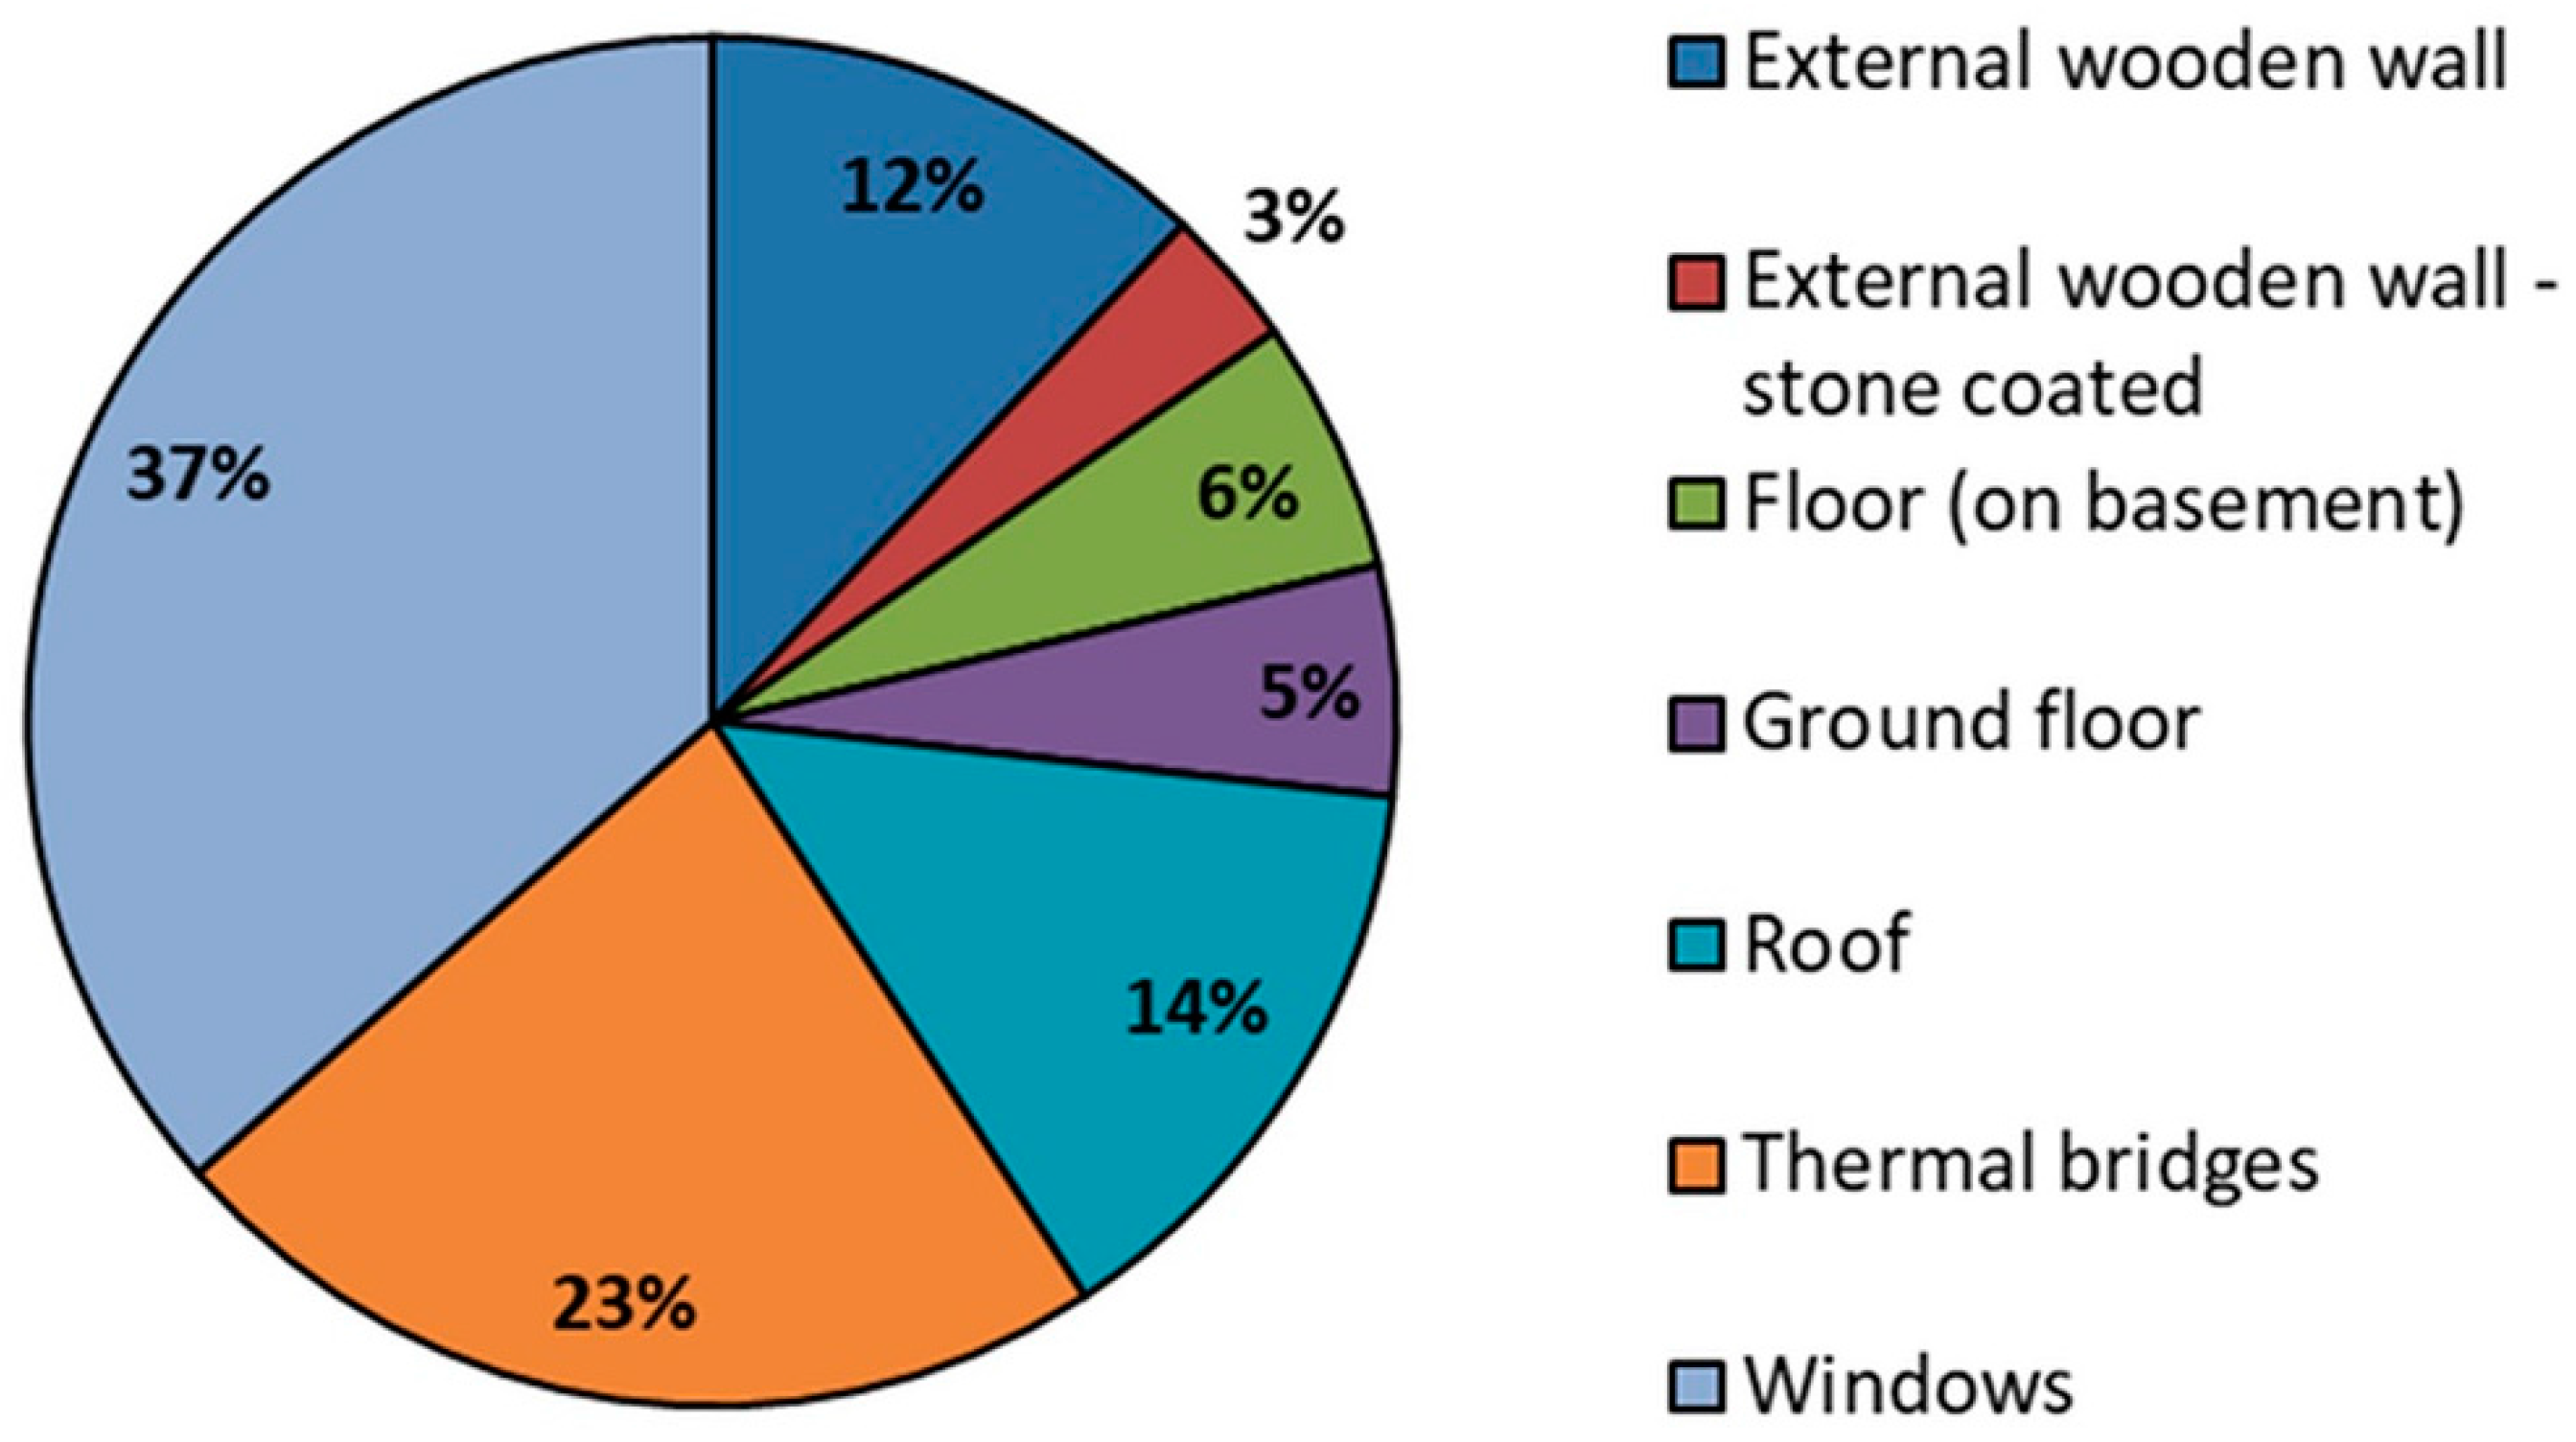
  • design transmission heat loss for heated space analysed according to different technological component, such as external wooden wall, external wooden wall—stone coated, floor on basement, ground floor, roof, windows and thermal bridges (in percentage) (Figure 16);
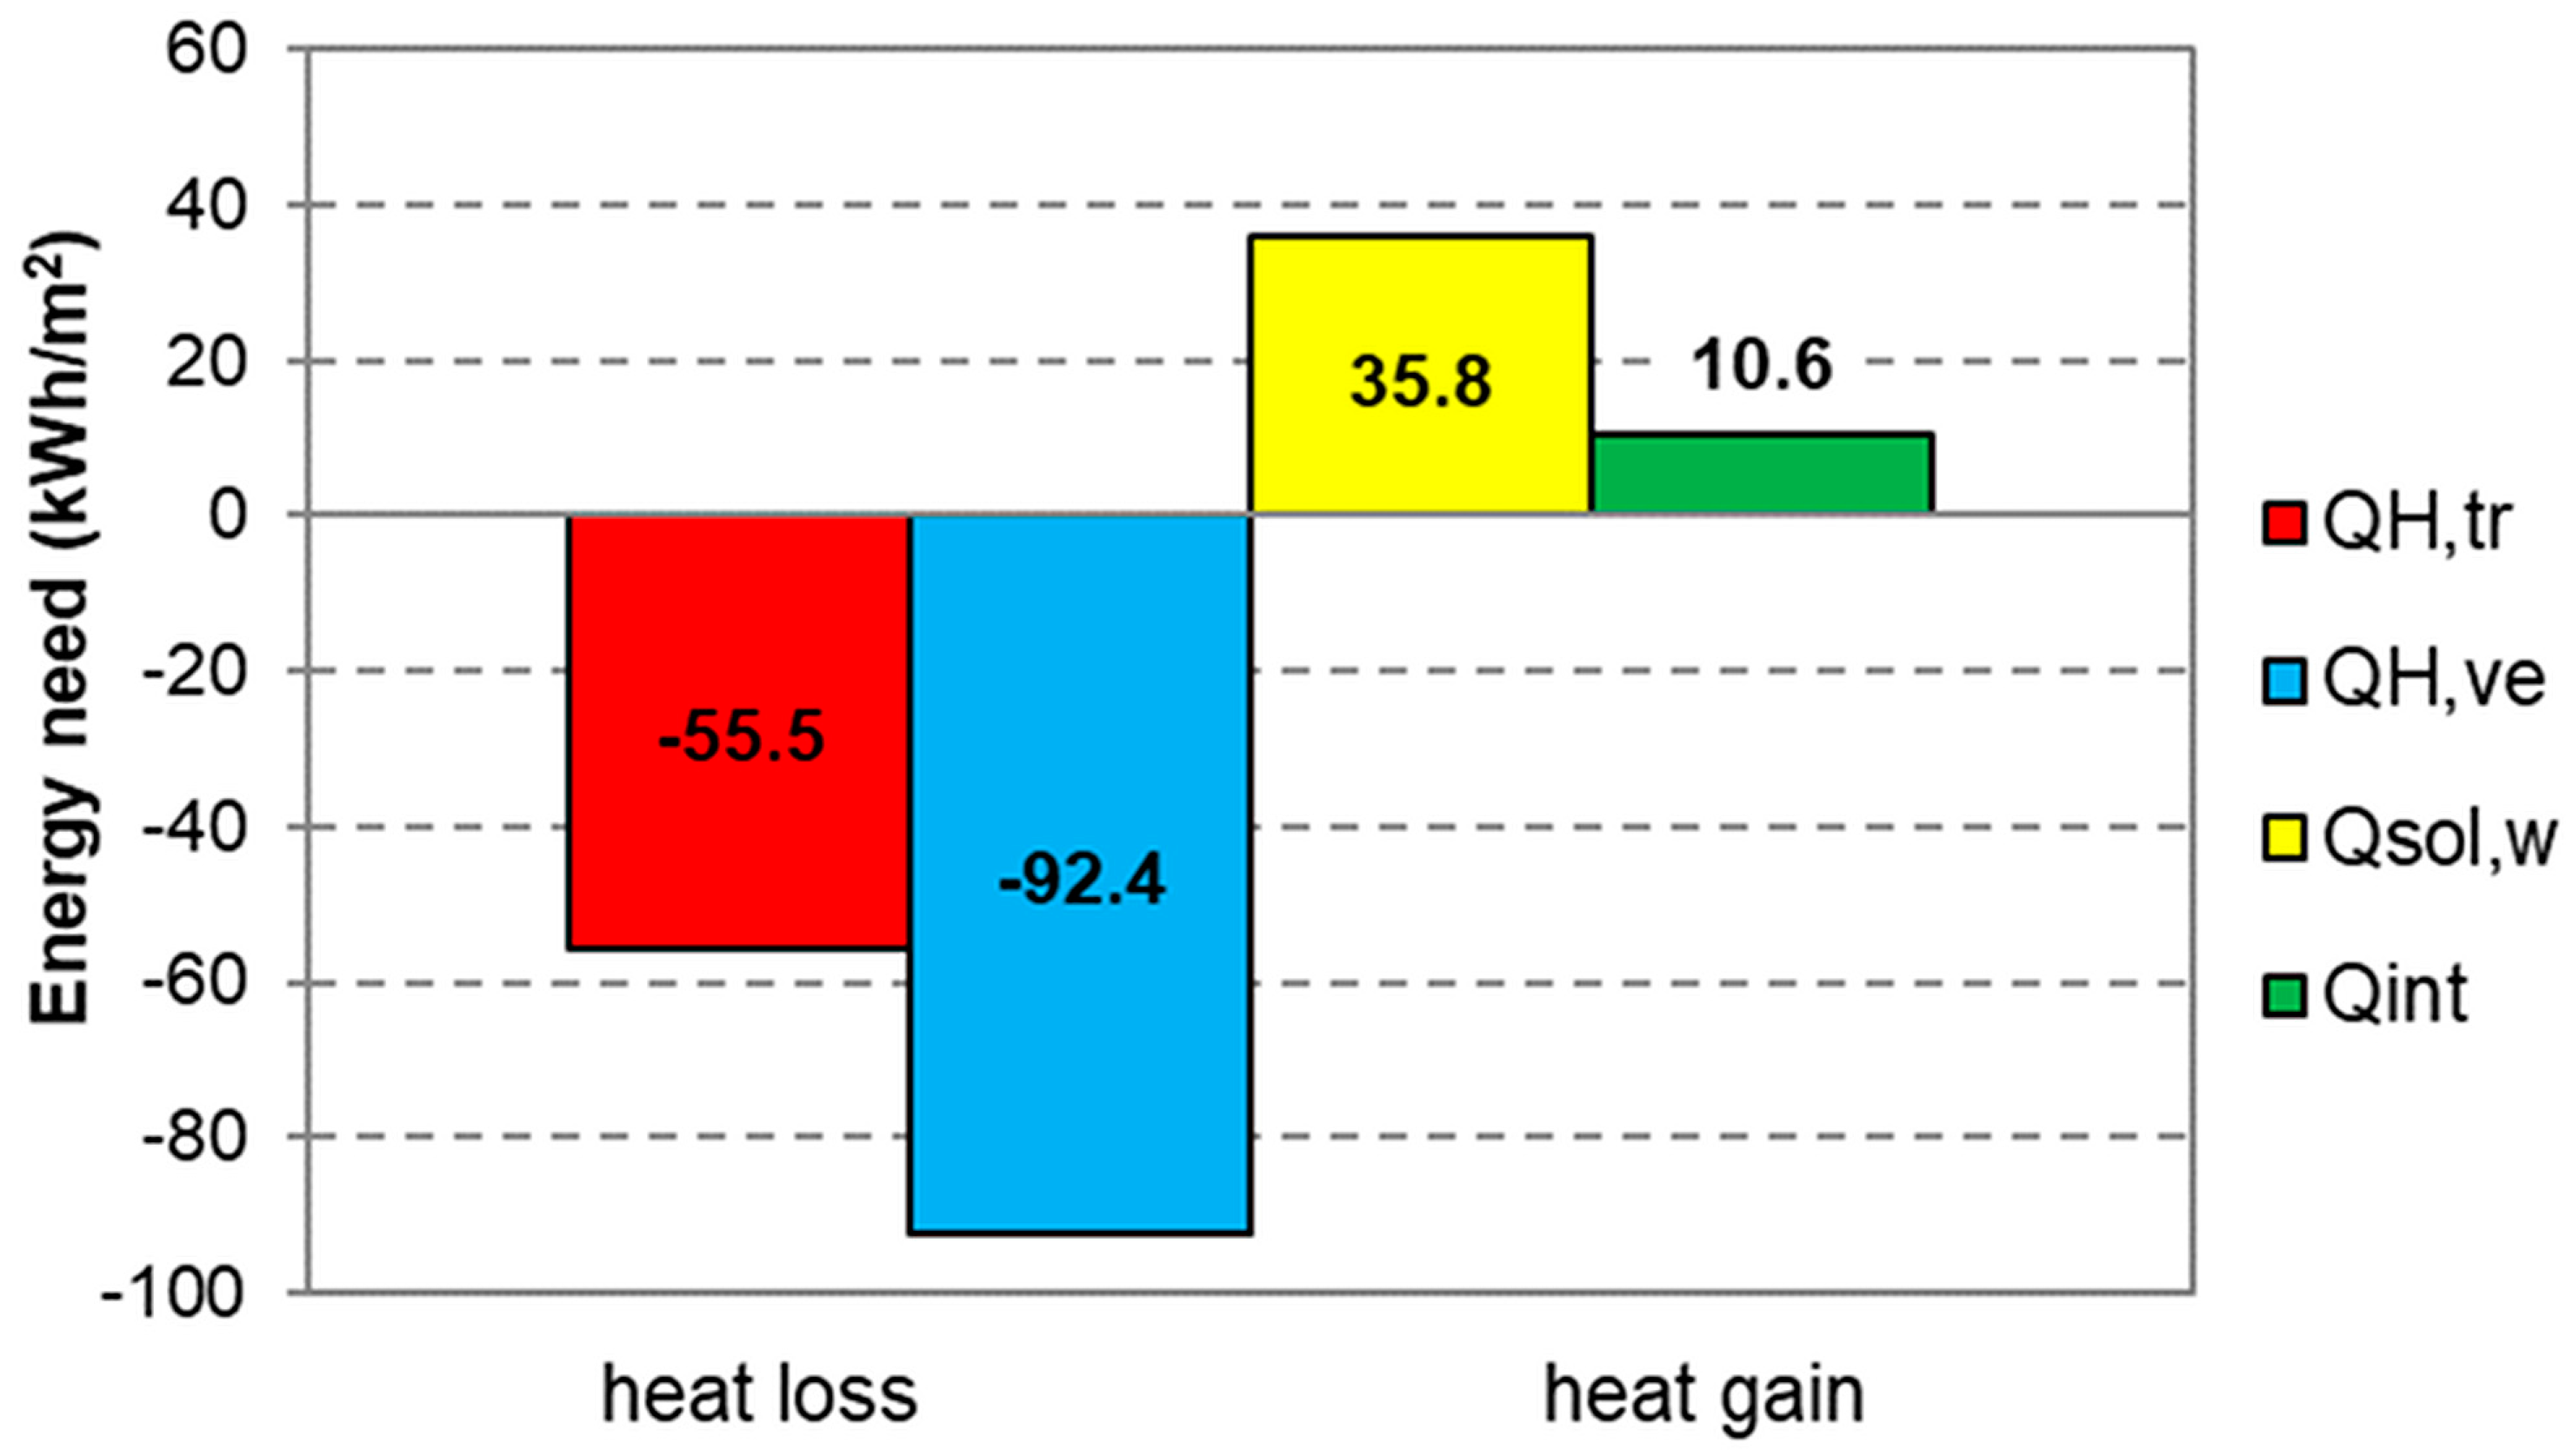
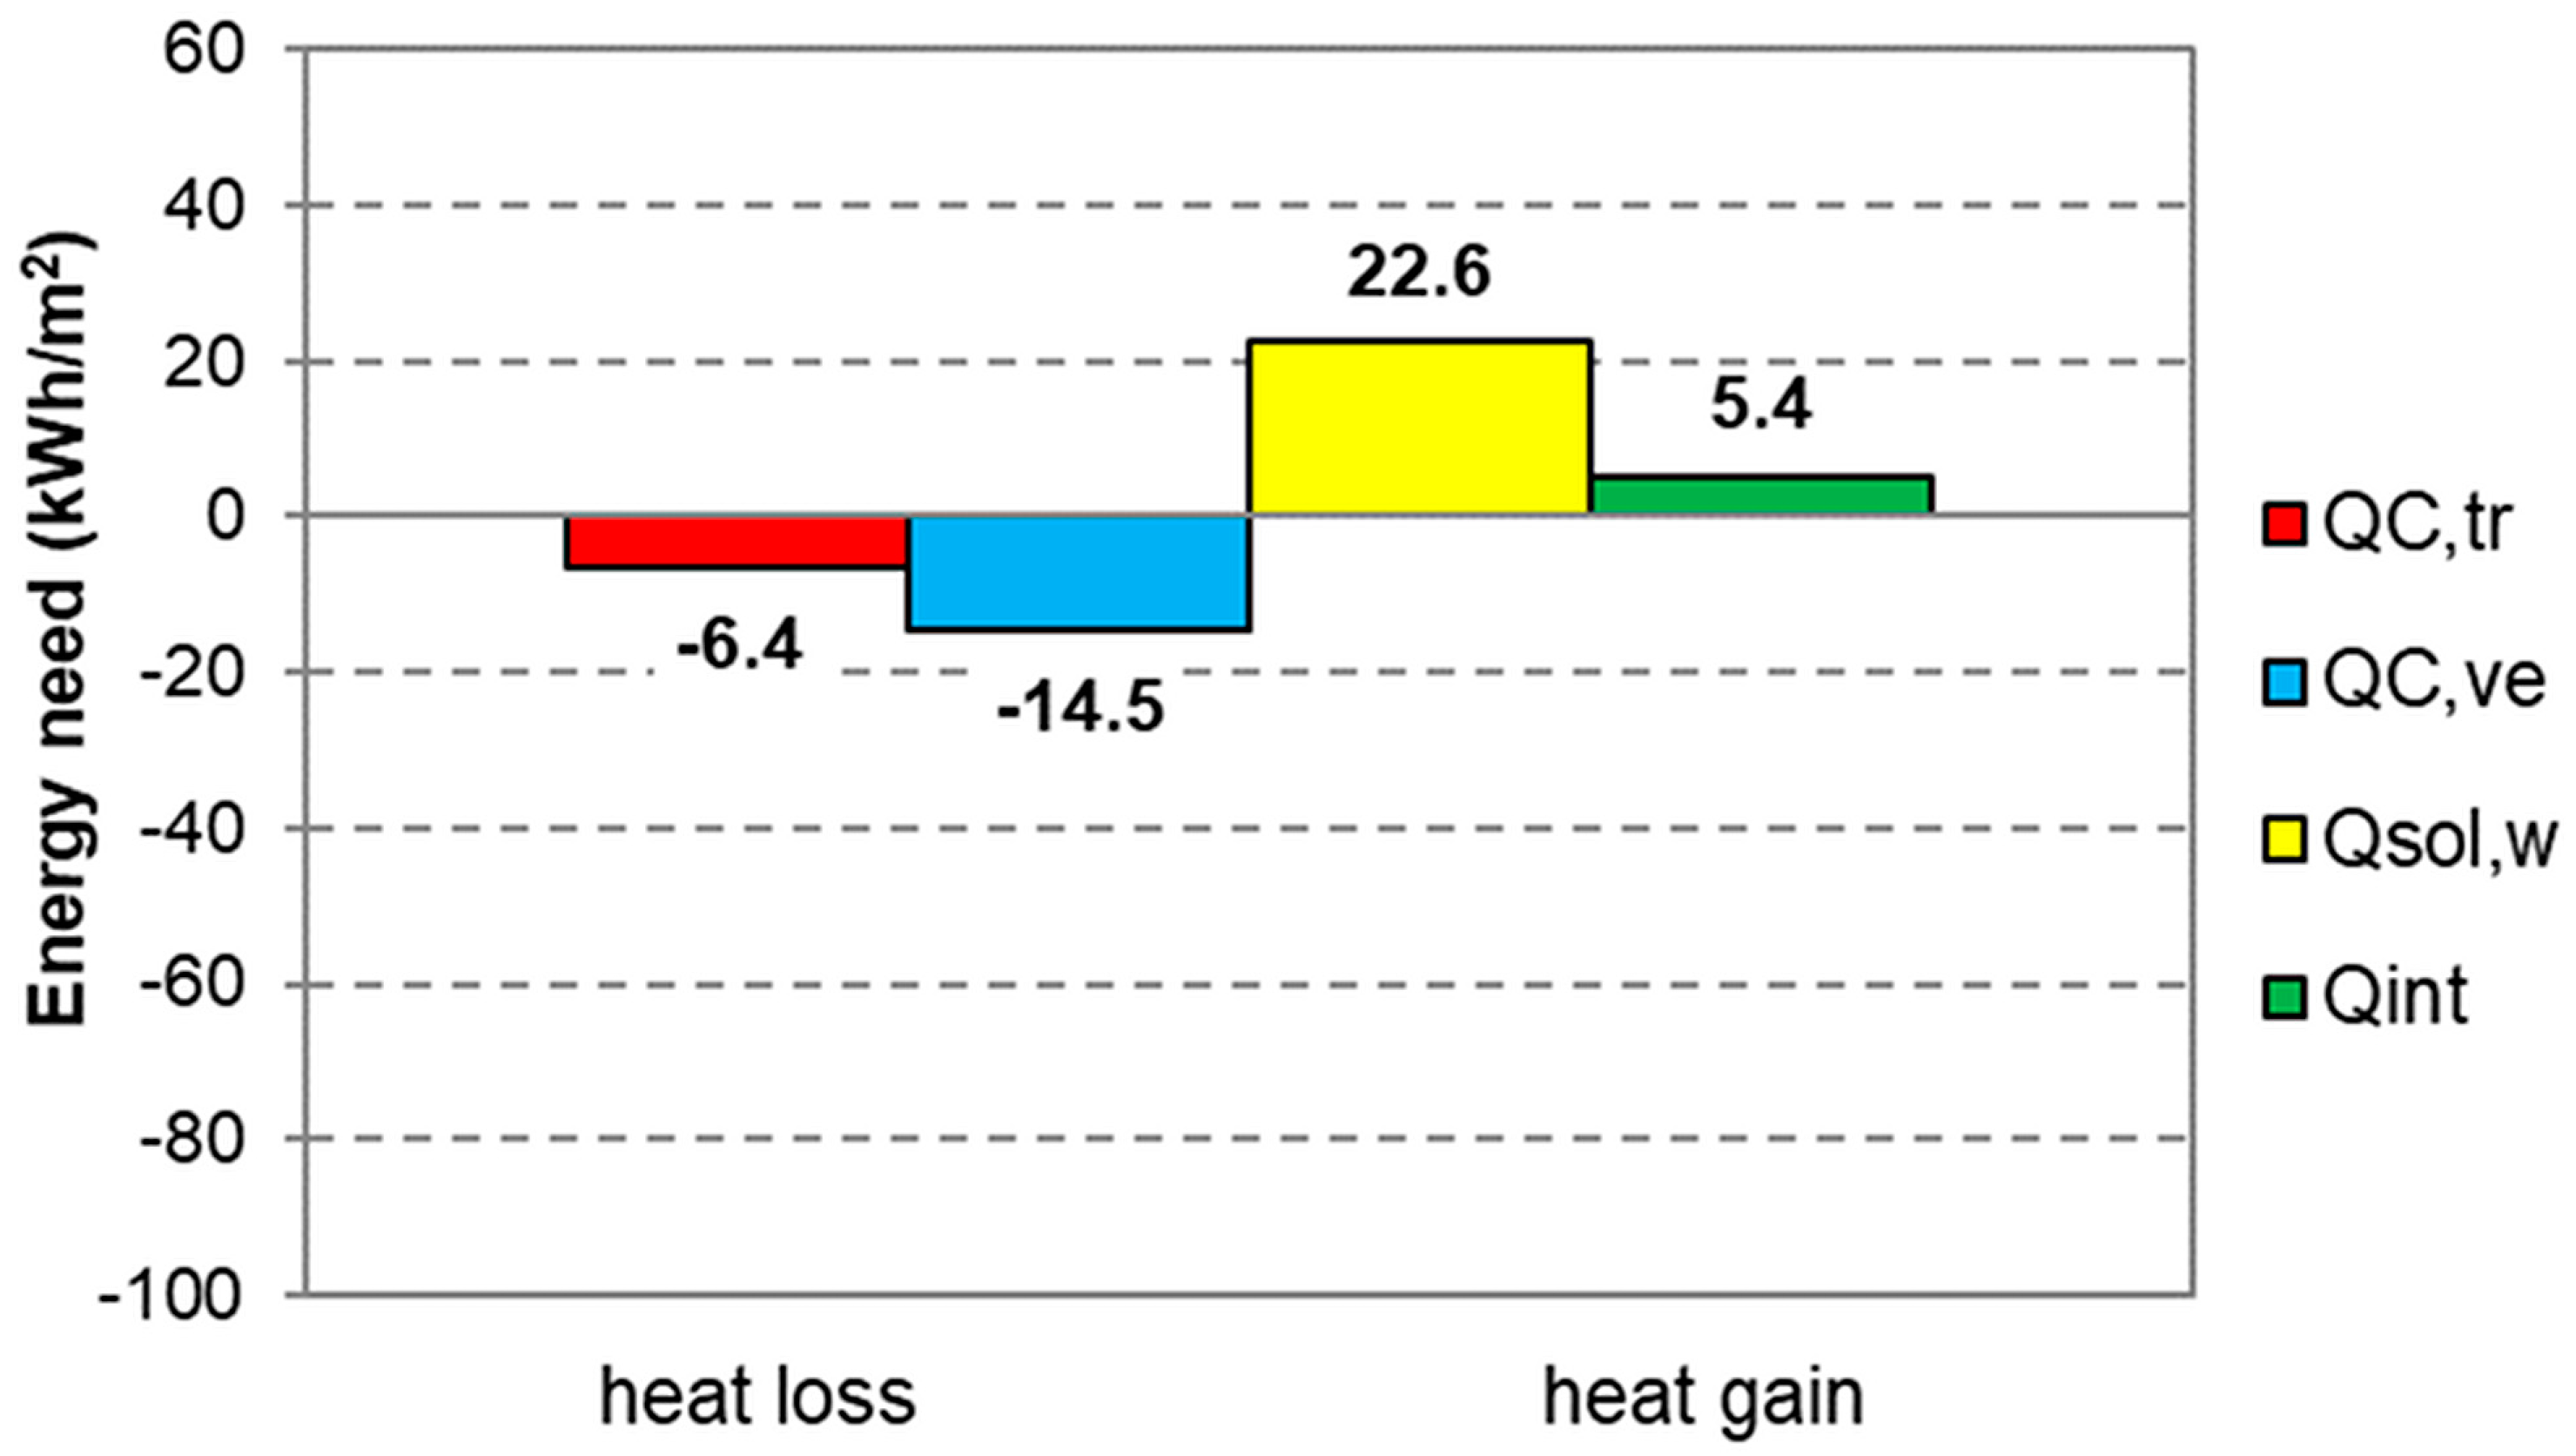
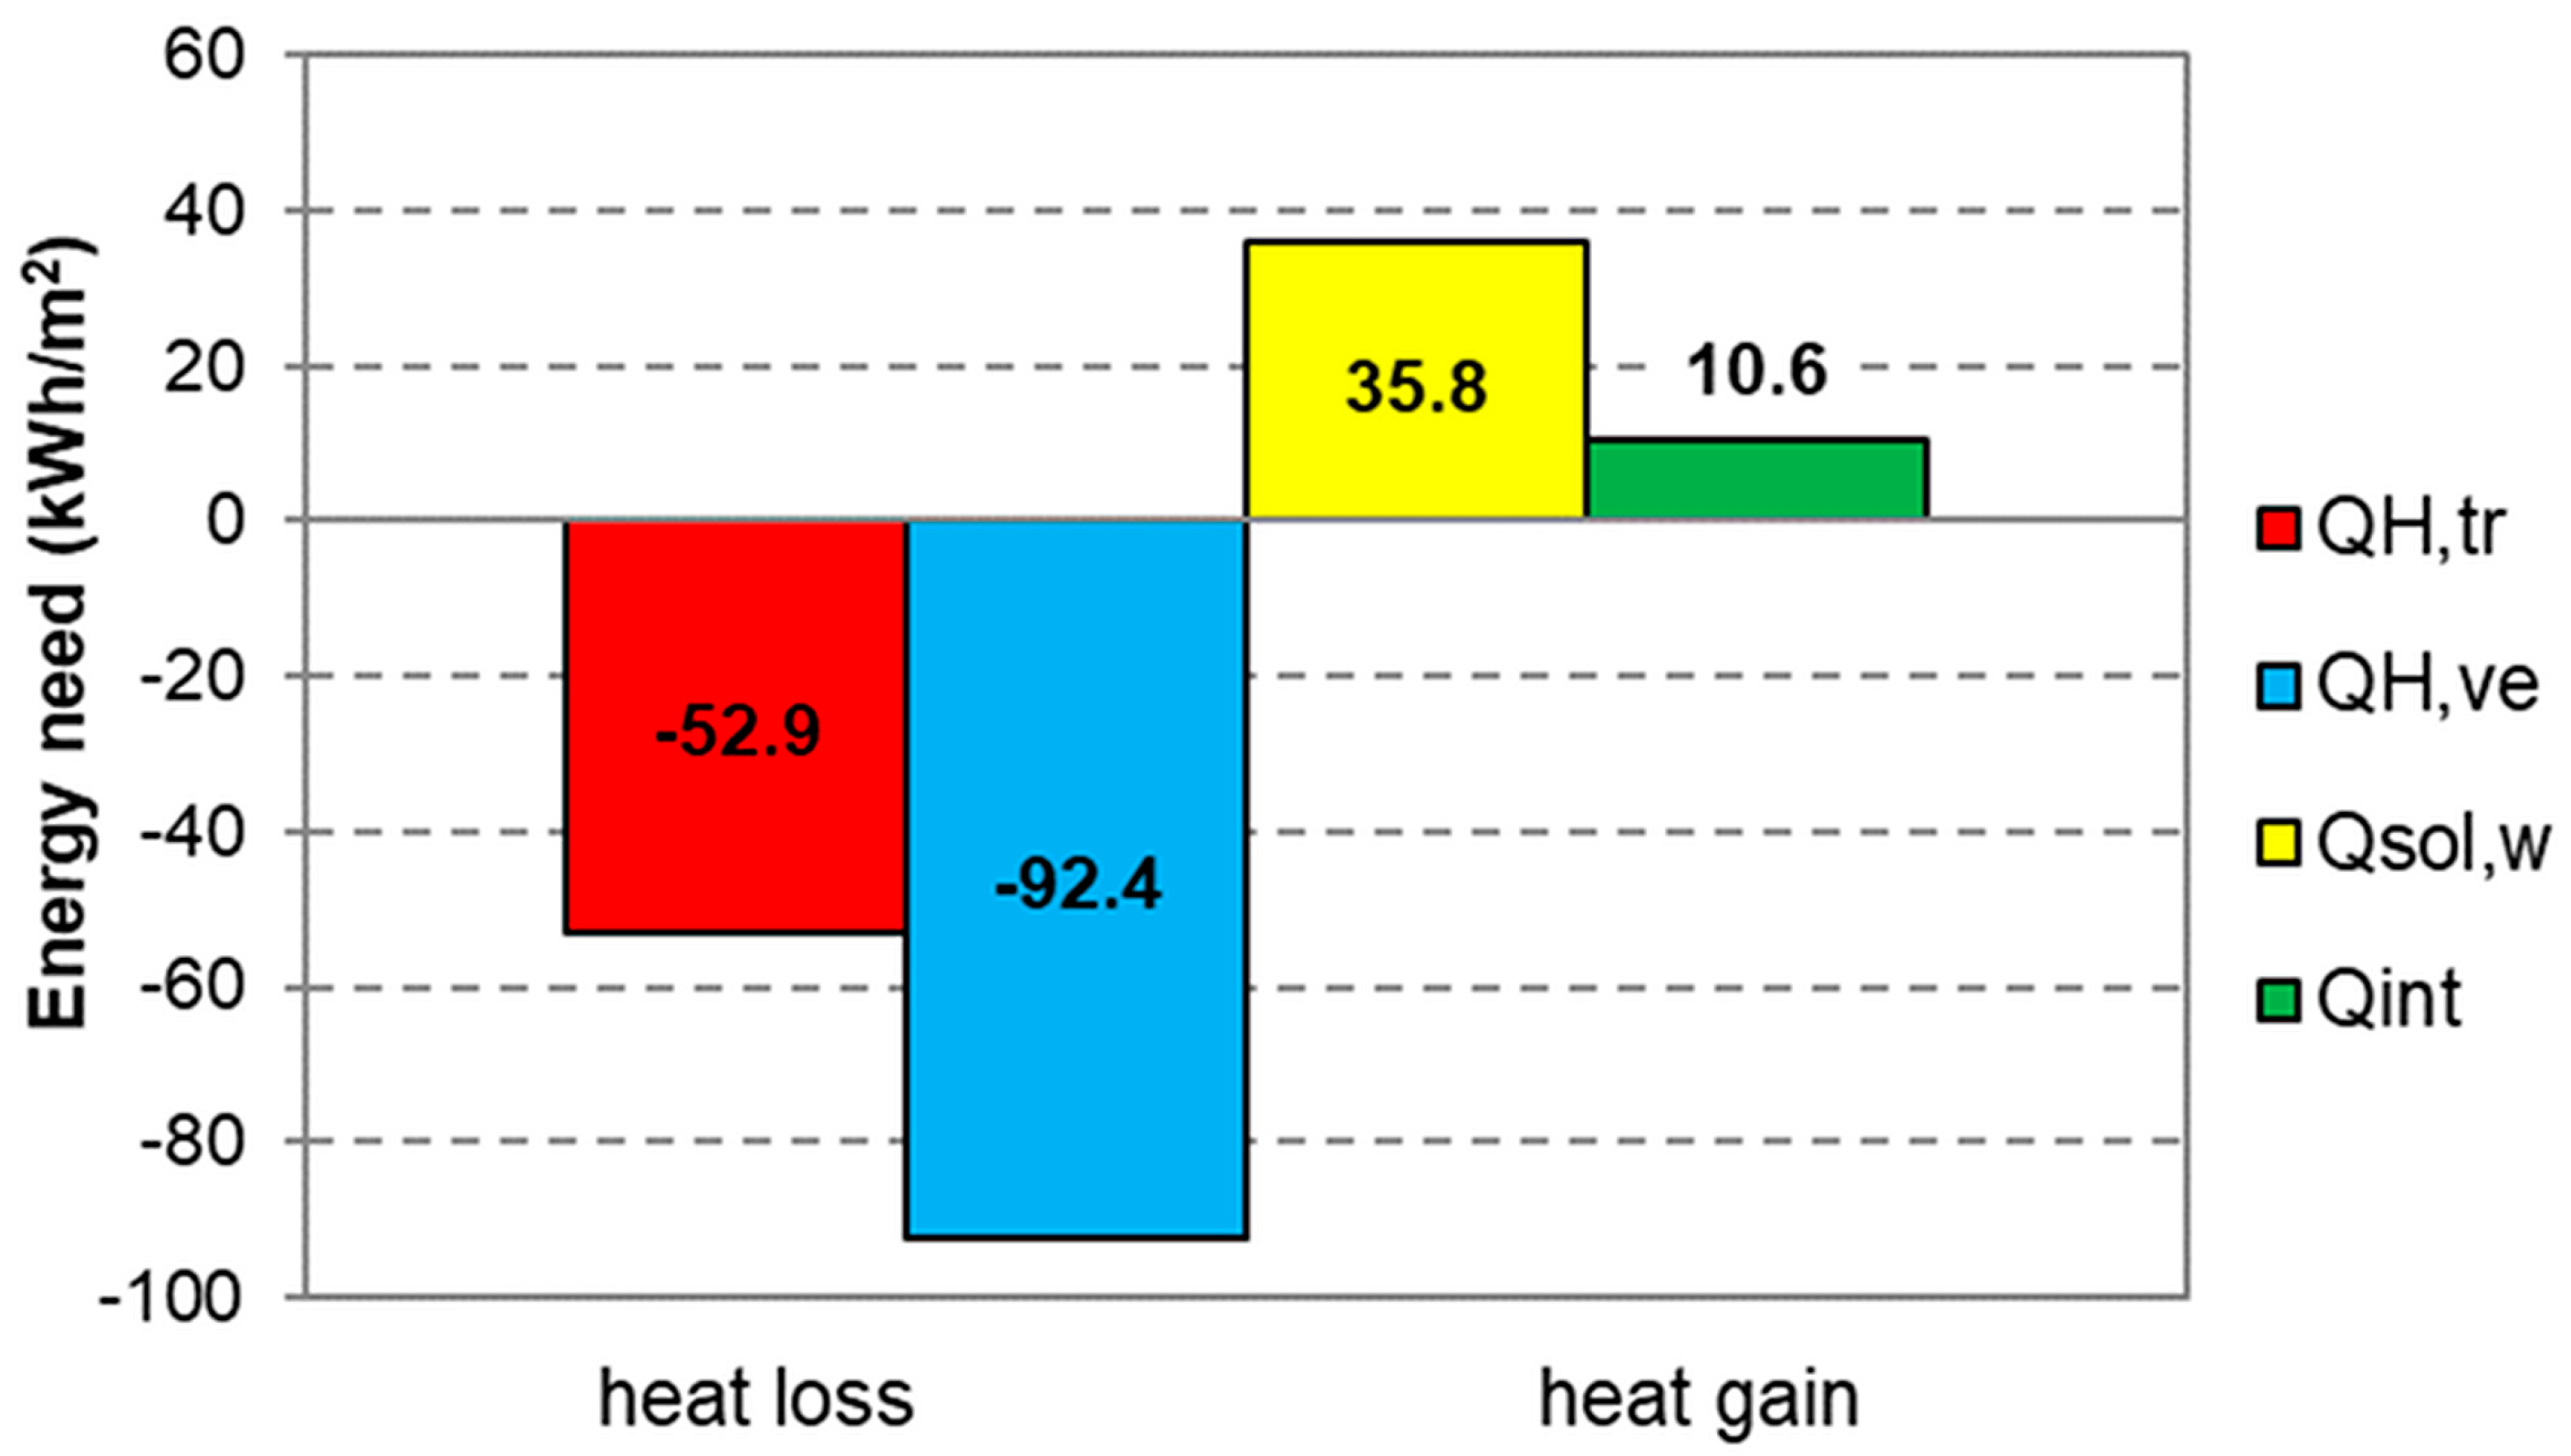
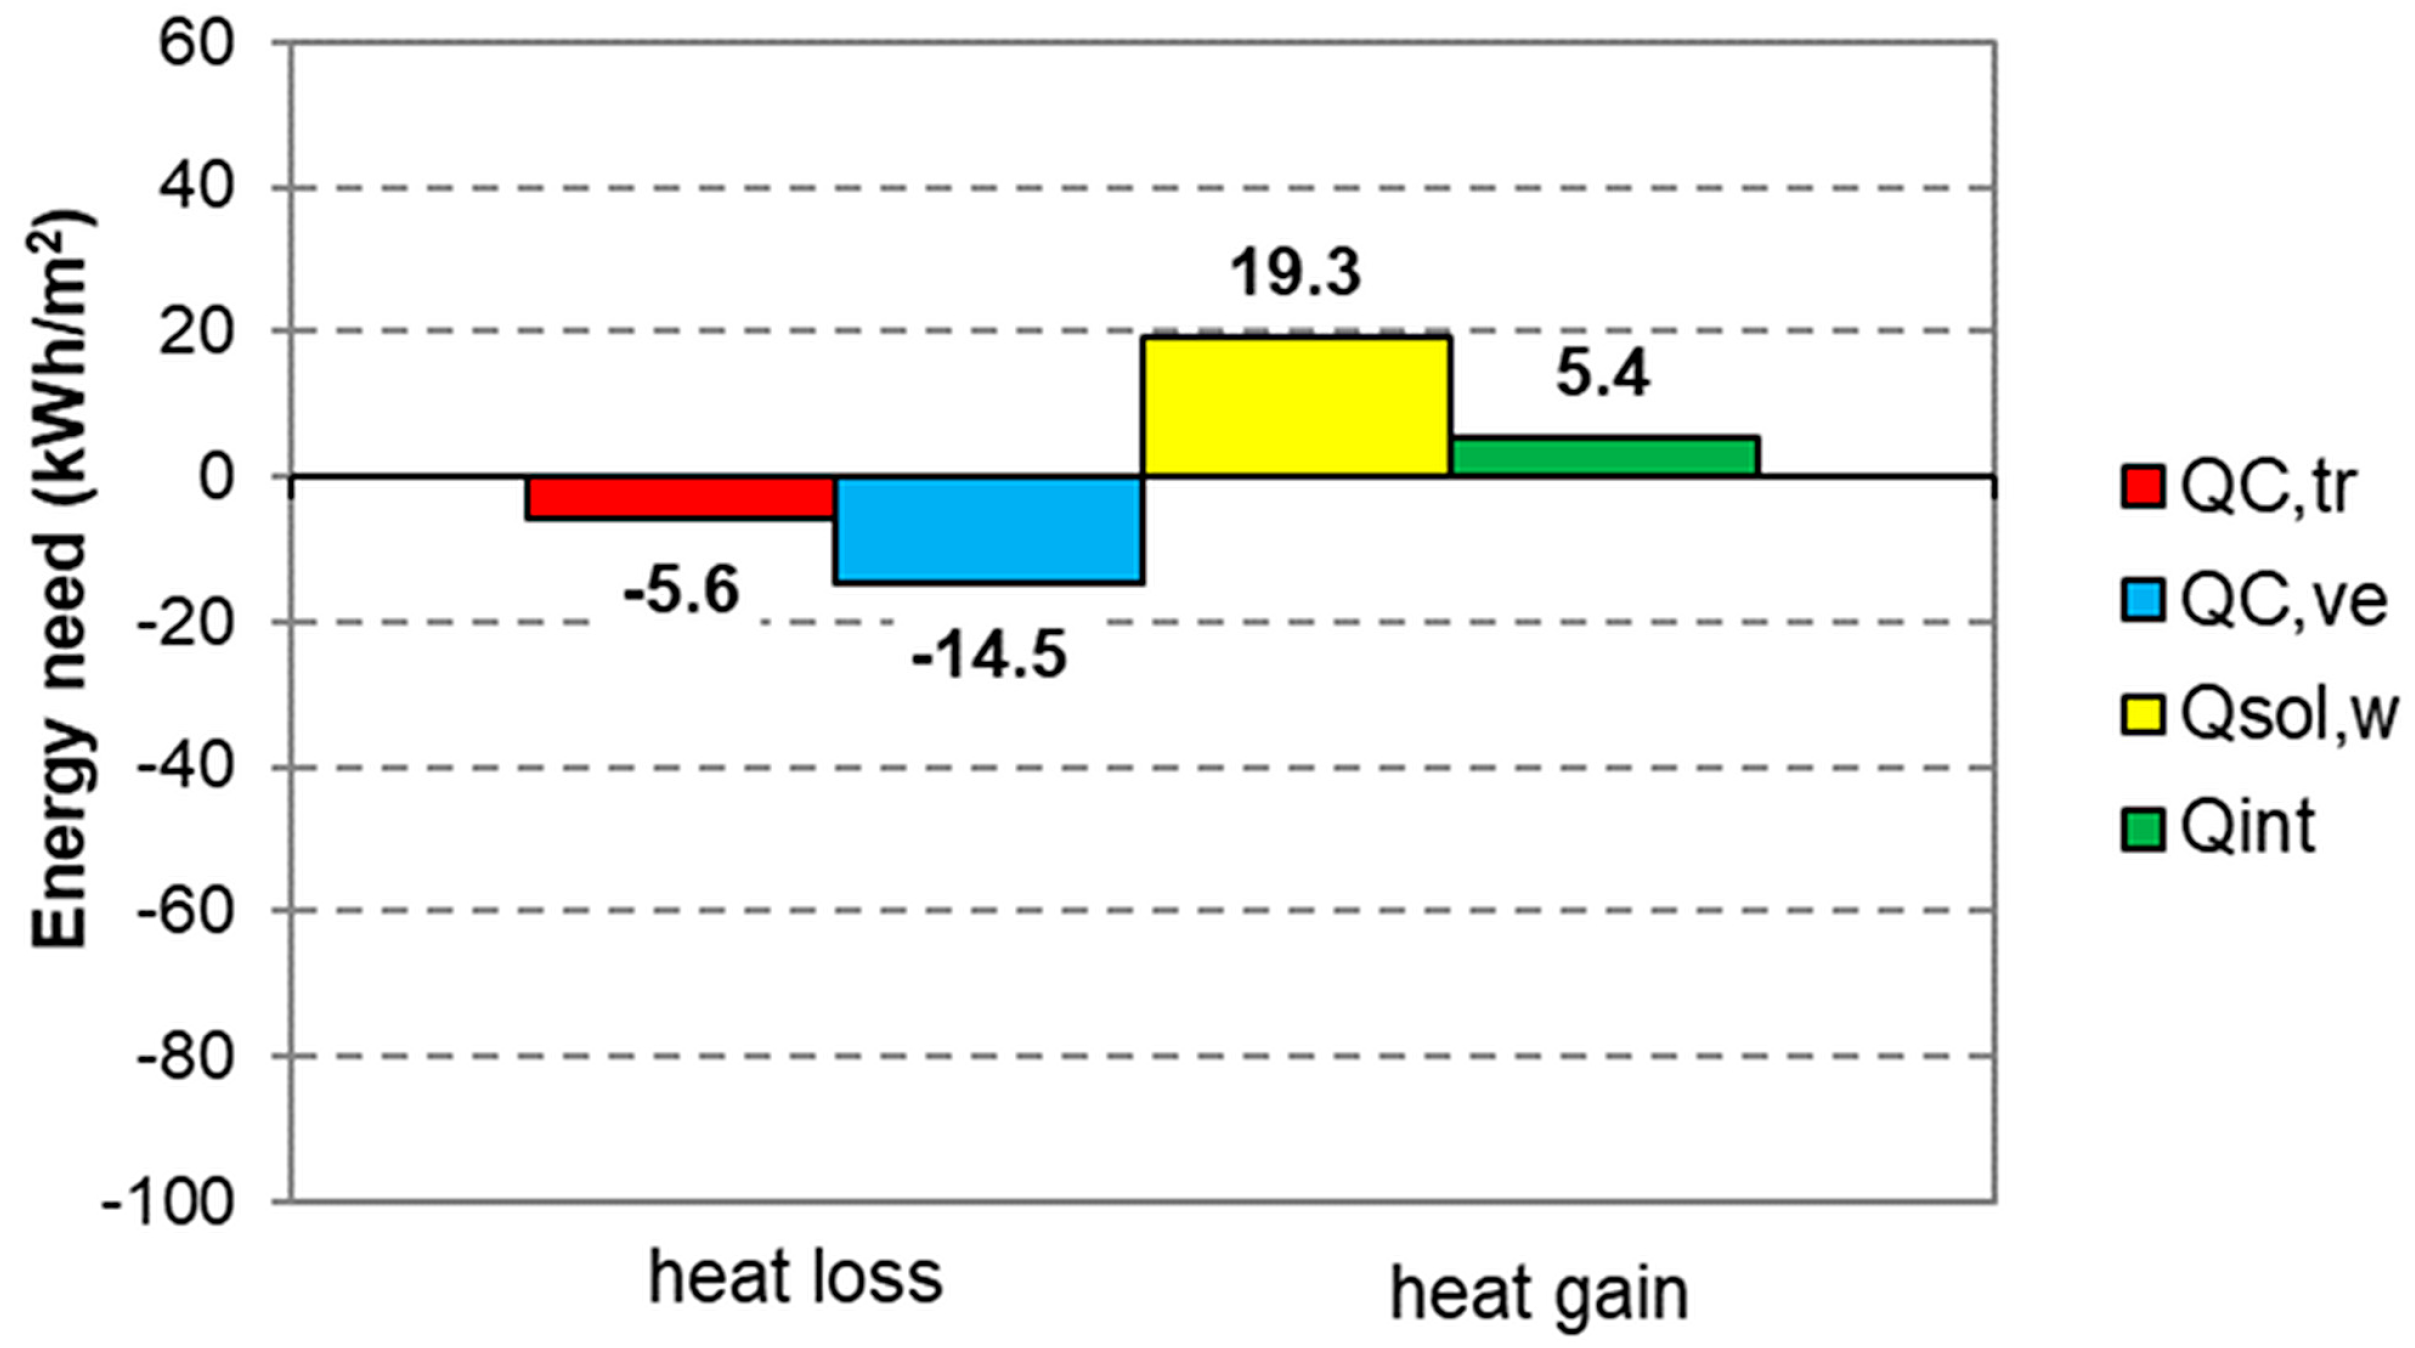
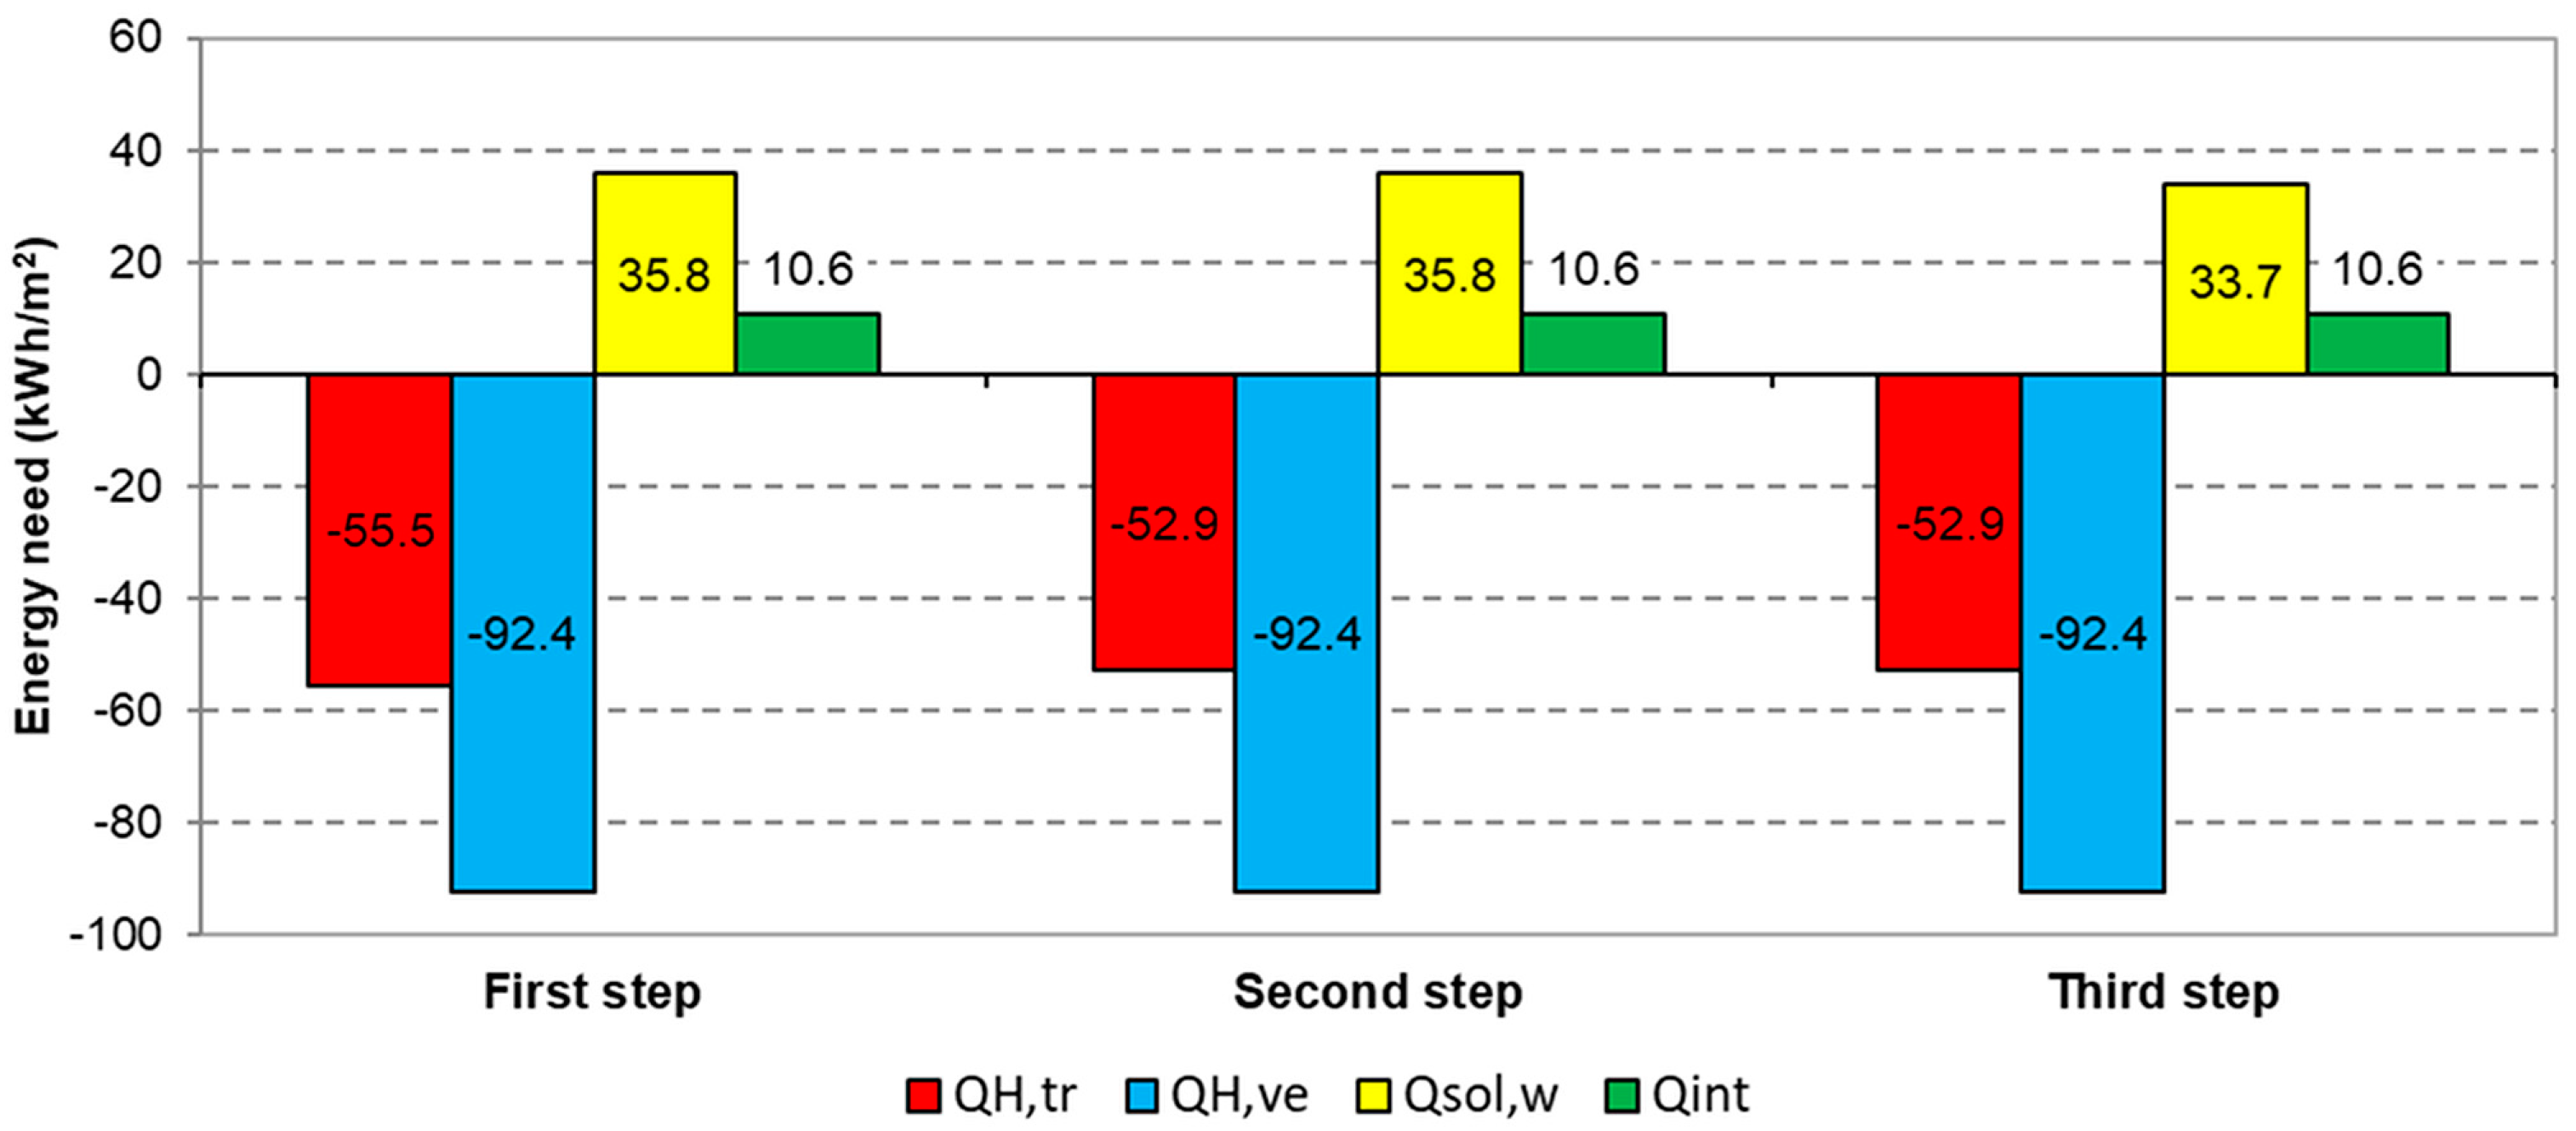
  • energy analysis of the building envelope (in kWh/m2) subdivided as: heat transfer by transmission for the heating mode (QH,tr) and for the cooling mode (QC,tr), heat transfer by ventilation for the heating mode (QH,ve) and for the cooling mode (QC,ve), internal heat gains (Qint) and solar heat gains through windows (Qsol,w) (Figure 17 and Figure 18); and
  • calculation of specific energy need for space heating (QH,nd) and cooling (QC,nd) (in kWh/m2).
Figure 15 shows a substantial homogeneity among the different transmission losses; the higher percentage is for SW orientation due to the presence of large windows.
This result is according to data reported in Figure 16, where a higher percentage of transmission losses due to thermal transmittance of windows (Uw between 0.77 and 1.09 W/m2 K) is highlighted. The windows thermal transmittances, although very small for these component types, are larger than those of opaque ones (U between 0.119 and 0.153 W/m2 K).
Data reported in Figure 17 and Figure 18 are related to climatic data of the site, Arezzo (climatic zone E [12]), where the conventional heating season goes from 15 October to 15 April (six months) while the conventional cooling season goes from 9 June to 10 September (three months).
The different duration of the heating and cooling seasons amplifies the difference of heat transfer by transmission and solar gains in heating and cooling mode.
Moreover, it is noted that good winter solar gain values are due to a proper design of the SW overhang that does not excessively reduces solar irradiation on the façade.

3.2. Energy Analysis of the nZEB Building—Second Step

Based on the new values of the thermal transmittance and of thermal bridge coefficient, assessed with a 2D finite element analysis tool (Bisco®), a new analysis of the simulation results has been carried out.
In this step of the analysis, regarding design transmission and ventilation heat loss for heated space (in percentage), no significant differences come out with respect to Figure 14.
From the comparison of Figure 15 and Figure 19, the following differences come out:
  • thermal transmission losses of the roof slightly increase from 19% to 20% due to the new value of transmittance calculated with Bisco®; and
  • SW wall decreases from 29% to 28% due to the new thermal bridge coefficient value from 0.138 W/mK to 0.061 W/mK.
From the comparison of Figure 16 and Figure 20, a different contribution of thermal bridges from 23% to 15% comes out.
From the new energy analysis (Figure 21 and Figure 22 compared, respectively, with Figure 17 and Figure 18), the following elements come out:
  • heat transfer by transmission for the heating mode (QH,tr) goes from 55.5 kWh/m2 to 52.9 kWh/m2 (a decrease of about 5%);
  • heat transfer by transmission for the cooling mode (QC,tr) goes from 6.4 kWh/m2 to 5.6 kWh/m2 (a decrease of about 12%); and
  • other values do not change.
The specific energy need for space heating (QH,nd) is 109.40 kWh/m2, while for space cooling (QC,nd) is 11.80 kWh/m2.

3.3. Energy Analysis of the nZEB Building—Third Step

This step of energy analysis is composed of two parts:
  • preliminary evaluation of the different shading systems described in Section 2.3 to choose, among those assessed, the more performing shading strategy to improve the nZEB energy performances; and
  • assessment of the nZEB building energy performances with selected shading devices.

3.3.1. Preliminary Evaluation of the Different Shading Systems

Based on the shadings features described in Section 2.3, the specific energy need for heating (QH,nd), cooling (QC,nd) and global (QH,nd + QC,nd) have been calculated with a dynamic code (Design Builder) [21] to choose the better performing shading strategy [22,23,24]. In Figure 23, simulation results are reported for the analysed shading systems and compared with the sole glass (ggl = 0.4).
Figure 23 shows that an internal white drape determines a slight increase of global energy need of about 6%, reduces winter solar gains and does not produce any significant reduction in term of specific energy need for space cooling.
The external Venetian blind causes a significant increase of the specific energy need for space heating of 30%, a reduction of specific energy need for space cooling of about 46% and a reduction of global energy need of about 6%.
The external fixed shading causes an increase of the specific energy need for space heating of 10%, a reduction of specific energy need for space cooling of about 33% and a reduction of global energy need of about 11%.
The best performances are those of the external Venetian blind and of the external fixed shading. As the external Venetian blind in the living area could reduce visual comfort and restrict the view of the surrounding landscape, the chosen solar shading strategy is the combination of the external fixed shading on SW façade and the external Venetian blind for all the other windows of the nZEB building.
To evaluate the performance of the chosen solar shading strategy in thesteady state software, the reduction factor related to solar gain (ggl/ggl+sh) has been calculated. This parameter represents the ratio between the solar factor of the sole glass (ggl) and the solar factor of the glass combined with a specific shading device (ggl+sh). It has been calculated, by means of Design Builder software, as the ratio of the solar gain (Qsol,w) due to the sole glass to those due to the combined window and shading systems.

3.3.2. Energy Simulations of the nZEB Building with the Chosen Solar Shading Strategy

In this section, the assessment of the nZEB building energy performances with the chosen solar shading strategy is reported and discussed (Figure 24 and Figure 25).
From the comparison between results of the third step of energy analysis (Figure 24 and Figure 25) and the results of the second step (Figure 21 and Figure 22), the following elements come out:
  • solar heat gains through windows (Qsol,w) for the heating mode decrease from 35.8 kWh/m2 to 33.7 kWh/m2 (about 6%);
  • solar heat gains through windows (Qsol,w) for the cooling mode decrease from 22.6 kWh/m2 to 19.3 kWh/m2 (about 15%); and
  • other values do not change.
The energy simulation of the chosen shading strategy added to the nZEB building produces the following energy indices: 110.76 kWh/m2 for the heating mode (QH,nd) and 9.01 kWh/m2 for the cooling mode (QC,nd).
The results of the simulations carried out in the first, second and third steps are presented in Figure 26 and Figure 27, respectively.
As regards the results shown in Figure 26 and Figure 27, it can be noted that, moving from a simplified analysis to a detailed one, the heat transfer by transmission for the heating mode is reduced by 5% and the heat transfer by transmission for the cooling mode is reduced by 12%. Heat transfer by ventilation for the heating mode and for the cooling mode as well as internal heat gains are unchanged. Solar heat gains through windows are reduced of 6% in winter and of 15% in summer.
Since the aim of the paper is to assess the differences between steady state conditions analysis (UNI/TS 11300) and detailed calculations methods (Bisco® and Design Builder) for the assessment of thermal bridges, heterogeneous components and the effectiveness of complex shading systems, the gap between the results obtained by means of different calculation methodologies is not negligible, in particular when residential highly insulted buildings are involved.

4. Conclusions

The design process and the construction of nZEB building in Southern Europe is an important challenge for the reduction of energy consumption of civil buildings.
The use of wooden high insulated technologies to reach the nZEB target presents some critical issues regarding the correct envelope heterogeneous components thermal evaluation and the proper control of solar radiation.
The complexity of the design process of this kind of technologies needs to be supported by detailed analysis of the component performances considering also the cooling mode with an accurate evaluation of shading strategies to control indoor overheating.
Calculation methodologies must be adapted to heterogeneous components, as platform frame, and a dynamic evaluation is necessary to verify the effectiveness of shading device systems to achieve a better design process.
In this paper, a methodology to correctly assess the energy performance of a nZEB building is presented and it is applied to a platform frame detached house recently built in central Italy.
This methodology includes two main phases: in the first phase, the building components and solar shading systems are analysed with both simplified and detailed calculation methods; and, in the second phase (articulated in three steps), starting from the results of the first phase, energy simulation of the building are carried out with a dedicated steady state software also assessing the effectiveness of different solar shadings.
In the second phase of the methodology, switching from a simplified analysis of the thermal performance of the building components (first step) to a detailed analysis (second step), a substantial difference in the performance of the building due to more accurate transmittance values arises. Such a methodology is suitable when the presence of heterogeneous components, such as platform frame technology, has to be assessed.
To obtain accurate values to be entered in the steady state calculation code for the energy performance certification, the use of a 2D finite elements calculation code for building components assessment (U and ψ) and a dynamic code for different shading systems evaluation (ggl/ggl+sh) is of strategic importance.
In the cooling mode, complex shading strategies are properly evaluated and entered into the energy performance certification software, giving useful information about the improvement of the energy performance of the nZEB residential building under analysis. Among different shading systems assessed, the chosen solar shading strategy is the combination of the external fixed shading on SW façade and the external Venetian blind for all the other windows of the building.
In particular, moving from a simplified analysis to a detailed one, the heat transfer by transmission for the heating mode is reduced by 5% and for the cooling mode is reduced by 12%. Solar heat gains through windows are reduced by 6% in winter and 15% in summer. While the specific energy need for heating increases by 1%, the specific energy need for cooling strongly decreases by about 22%.
As a result of the performed evaluation, it comes out that the complexity of the wooden technology nZEB design process in Mediterranean climate must be successfully supported by a detailed analysis of the building performances (components and shadings) aimed at an energy evaluation properly fitted with the real buildings features. All these elements are of fundamental importance to improve a correct design process of these technologies when the nZEB target is aimed.

Acknowledgments

The author acknowledge “Arredoline” Construction Company for supporting the research and the Property for providing the case study.

Author Contributions

In this paper, Cristina Carletti, Leone Pierangioli and Fabio Sciurpi contributed to the research design and to data analysis and interpretation. All authors contributed to develop the case study simulations and to write the paper.

Conflict of Interest

The authors declare no conflict of interest.

References

  1. Directive 2010/31/EU of The European Parliament and of the Council of 19 May 2010 on the Energy Performance of Buildings (Recast). 2010. Available online: http://eur-lex.europa.eu/legal-content/en/TXT/?uri=CELEX:32010L0031 (accessed on 8 February 2018).
  2. Decree of the Italian Ministry of Economic Development 26/06/2015—Applicazione Delle Metodologie di Calcolo Delle Prestazioni Energetiche e Definizione Delle Prescrizioni e dei Requisiti Minimi Degli Edifici—Adeguamento del Decreto del Ministro Dello Sviluppo Economico, 26 Giugno 2009—Linee Guida Nazionali per la Certificazione Energetica Degli Edifici. 2015. Available online: http://www.gazzettaufficiale.it/eli/id/2015/07/15/15A05198/sg (accessed on 08 February 2018). (In Italian).
  3. Legislative Decree 03/03/2011, n. 28—Attuazione Della Direttiva 2009/28/CE Sulla Promozione Dell’uso Dell’energia da Fonti Rinnovabili, Recante Modifica e Successiva Abrogazione Delle Direttive 2001/77/CE e 2003/30/CE. 2011. Available online: http://www.gazzettaufficiale.it/eli/id/2011/03/28/011G0067/sg (accessed on 08 February 2018). (In Italian).
  4. Thalfeldt, M.; Pikas, E.; Kurnitski, J.; Voll, H. Facade design principles for nearly zero energy buildings in a cold climate. Energy Build. 2013, 67, 309–321. [Google Scholar] [CrossRef]
  5. Kolokotsa, D.; Rovas, D.; Kosmatopoulos, E.; Kalaitzakis, K. A road map towards intelligent net zero and positive energy buildings. Sol. Energy 2011, 85, 3067–3084. [Google Scholar] [CrossRef]
  6. AlAjmi, A.; Abou-Ziyan, H.; Ghoneim, A. Achieving annual and monthly net-zero energy of existing building in hot climate. Appl. Energy 2016, 165, 511–521. [Google Scholar] [CrossRef]
  7. Wang, L.; Gwilliam, J.; Jones, P. Case study of zero energy house design in UK. Energy Build. 2009, 41, 1215–1222. [Google Scholar] [CrossRef]
  8. Becchio, C.; Dabbene, P.; Fabrizio, E.; Monetti, V.; Filippi, M. Cost optimality assessment of a single family house: Building and technical systems solutions for the NZEB target. Energy Build. 2015, 90, 173–187. [Google Scholar] [CrossRef]
  9. ZEBRA Project. Available online: http://www.zebra-monitoring.enerdata.eu/ (accessed on 30 October 2017).
  10. Bruno, R.; Carpino, C.; Arcuri, N. The passive house in Mediterranean area: parametric analysis and dynamic simulation of the thermal behaviour of an innovative prototype. Energy Procedia 2015, 82, 533–539. [Google Scholar] [CrossRef]
  11. Ascione, F.; De Masi, R.F.; de Rossi, F.; Ruggiero, S.; Vanoli, G.P. Optimization of building envelope design for nZEBs in Mediterranean climate: Performance analysis of residential case study. Appl. Energy 2016, 183, 938–957. [Google Scholar] [CrossRef]
  12. Decree of the President of the Italian Republic 26/08/1993 n.412—Regolamento Recante Norme per la Progettazione, L’installazione, L’esercizio e la Manutenzione Degli Impianti Termici Degli Edifici ai Fini del Contenimento dei Consumi di Energia, in Attuazione dell’art. 4, Comma 4, della Legge 9 Gennaio 1991, n. 10. 1993. Available online: http://www.gazzettaufficiale.it/eli/id/1993/10/14/093G0451/sg (accessed on 8 February 2018). (In Italian).
  13. UNI. UNI EN ISO 6946, Building Components and Building Elements—Thermal Resistance and Thermal Transmittance—Calculation Method; UNI: Milan, Italy, 2008. [Google Scholar]
  14. UNI. UNI EN ISO 13786, Thermal Performance of Building Components—Dynamic Thermal Characteristics—Calculation Methods; UNI: Milan, Italy, 2008. [Google Scholar]
  15. Legislative Decree 29/12/2006, n. 311—Disposizioni Correttive ed Integrative al Decreto Legislativo 19 Agosto 2005, n. 192, Recante Attuazione Della Direttiva 2002/91/CE, Relativa al Rendimento Energetico Nell’edilizia. 2006. Available online: http://www.gazzettaufficiale.it/eli/id/2007/02/01/007G0007/sg (accessed on 8 February 2018). (In Italian).
  16. UNI. UNI EN ISO 13788, Hygrothermal Performance of Building Components and Building Elements—Internal Surface Temperature to Avoid Critical Surface Humidity and Interstitial Condensation—Calculation Methods; UNI: Milan, Italy, 2013. [Google Scholar]
  17. UNI. UNI EN ISO 10211, Thermal Bridges in Building Construction—Heat Flows and Surface Temperatures—Detailed Calculations; UNI: Milan, Italy, 2008. [Google Scholar]
  18. Physibel Software, Bisco Version 9.0w, 2008. Available online: http://www.physibel.be/ (accessed on 8 February 2018).
  19. UNI. UNI EN ISO 14683, Thermal Bridges in Building Construction—Linear Thermal Transmittance—Simplified Methods and Default Values; UNI: Milan, Italy, 2008. [Google Scholar]
  20. UNI. UNI/TS 11300-1, Prestazioni Energetiche Degli Edifici. Parte 1: Determinazione del Fabbisogno di Energia Termica per la Climatizzazione Invernale ed Estiva; UNI: Milan, Italy, 2014. (In Italian) [Google Scholar]
  21. Design Builder Software Ltd., Design Builder Version 4.6.0.015, 2016. Available online: http://www.designbuilder.co.uk (accessed on 8 February 2018).
  22. Cellai, G.; Carletti, C.; Sciurpi, F.; Secchi, S. Transparent Building Envelope: Windows and Shading Devices Typologies for Energy Efficiency Refurbishments. In Building Refurbishment for Energy Performance; Magrini, A., Ed.; Springer International Publishing: Berlin, Germany, 2014; pp. 61–118. ISBN 9783319030739. [Google Scholar]
  23. Carletti, C.; Sciurpi, F.; Pierangioli, L. The Energy Upgrading of Existing Buildings: Window and Shading Device Typologies for Energy Efficiency Refurbishment. Sustainability 2014, 6, 5354–5377. [Google Scholar] [CrossRef]
  24. Carletti, C.; Sciurpi, F.; Pierangioli, L.; Asdrubali, F.; Pisello, A.L.; Bianchi, F.; Sambuco, S.; Guattari, G. Thermal and lighting effects of an external venetian blind: Experimental analysis in a full scale test room. Build. Environ. 2016, 106, 45–56. [Google Scholar] [CrossRef]
Figure 1. Building plan.
Sustainability 10 00476 g001
Figure 2. Building section A–A.
Sustainability 10 00476 g002
Figure 3. Building section B–B.
Sustainability 10 00476 g003
Figure 4. Living room of the building under construction.
Sustainability 10 00476 g004
Figure 5. Hallway of the building under construction.
Sustainability 10 00476 g005
Figure 6. General view of the SW façade.
Sustainability 10 00476 g006
Figure 7. Isothermal and thermal flux lines (in grey) for the external wall (calculated with Bisco®).
Sustainability 10 00476 g007
Figure 8. Isothermal and thermal flux lines (in grey) for the roof (calculated with Bisco®).
Sustainability 10 00476 g008
Figure 9. Connection between external wall and ground floor. Temperature trends and heat fluxes lines (in grey).
Sustainability 10 00476 g009
Figure 10. Connection between external wall and roof. Temperature trends and heat fluxes lines (in grey).
Sustainability 10 00476 g010
Figure 11. Connection between wall and window frame. Temperature trends and heat fluxes lines (in grey).
Sustainability 10 00476 g011
Figure 12. Connection between external wall and basement floor. Temperature trends and heat fluxes lines (in grey).
Sustainability 10 00476 g012
Figure 13. Convex angle of the external wall. Temperature trends and heat fluxes lines (in grey).
Sustainability 10 00476 g013
Figure 14. Design transmission and ventilation heat loss for heated space (in percentage).
Sustainability 10 00476 g014
Figure 15. Design transmission heat loss for heated space analysed according to exposure (in percentage).
Sustainability 10 00476 g015
Figure 16. Design transmission heat loss for heated space analysed according to different technological component (in percentage).
Sustainability 10 00476 g016
Figure 17. Energy analysis for the heating mode (in kWh/m2).
Sustainability 10 00476 g017
Figure 18. Energy analysis for the cooling mode (in kWh/m2).
Sustainability 10 00476 g018
Figure 19. Design transmission heat loss for heated space analysed according to exposure (in percentage).
Sustainability 10 00476 g019
Figure 20. Design transmission heat loss for heated space analysed according to different technological component (in percentage).
Sustainability 10 00476 g020
Figure 21. Energy analysis for the heating mode (in kWh/m2).
Sustainability 10 00476 g021
Figure 22. Energy analysis for the cooling mode (in kWh/m2).
Sustainability 10 00476 g022
Figure 23. Specific energy need for space heating (QH,nd), cooling (QC,nd) and global (QH,nd + QC,nd) with different solar shading systems.
Sustainability 10 00476 g023
Figure 24. Energy analysis for the heating mode (in kWh/m2).
Sustainability 10 00476 g024
Figure 25. Energy analysis for the cooling mode (in kWh/m2).
Sustainability 10 00476 g025
Figure 26. Comparison between energy analysis of the three different steps for the heating mode (in kWh/m2).
Sustainability 10 00476 g026
Figure 27. Comparison between energy analysis of the three different steps for the cooling mode (in kWh/m2).
Sustainability 10 00476 g027
Table 1. Data refereed to the location and the building.
Geographic LocationArezzo (Italy)
Climatic zone [12]E
Heating Degree Days (HDD)2014
Heating season [12]from 15/10 to 15/4 (183 days)
Floor area186 m2
Heated volume631 m3
Surface area to Heated volume ratio (S/V)0.82 m2/m3
Table 2. Components description (from inside to outside).
LayerThickness (s) (m)Thermal Conductivity λ [W/(m·K)]Density ρ (kg/m³)Specific Heat Capacity cp [J/(kg·K)]
External wooden wall
Gypsum plasterboard0.01250.2509001000
PVC vapour barrier0.00300.1601390900
Rockwool “211”0.04000.035401030
Oriented strand board0.01800.1306501700
Rockwool “211”0.12000.035401030
Oriented strand board0.01800.1306501700
Expanded polystyrene “EPS 100”0.12000.036201500
Cement/lime plaster0.01000.90018001000
External wooden wall—stone coated
Gypsum plasterboard0.01250.2509001000
PVC vapour barrier0.00300.1601390900
Rockwool “211”0.04000.035401030
Oriented strand board0.01800.1306501700
Rockwool “211”0.12000.035401030
Oriented strand board0.01800.1306501700
Expanded polystyrene “EPS 100”0.04000.036201500
Stone cladding0.08001.50020001000
Floor (on basement)
Laminate wood flooring0.01000.1435001500
Reinforced concrete screed0.10001.4902200880
Polyurethane foam insulation “Stiferite GT”0.14000.024361450
Reinforced concrete screed0.04001.4902200880
Concrete/brick slab0.20000.6601100840
Cement/lime plaster0.01000.90018001000
Ground floor
Ceramic tiles0.01001.3002300840
Reinforced concrete screed0.10001.4902200880
Polyurethane foam insulation “Stiferite GT”0.14000.024361450
Reinforced concrete screed0.04001.4902200880
Concrete/brick slab0.20000.6601100840
Cement/lime plaster0.01000.90018001000
Roof
Gypsum plasterboard0.01250.2509001000
Unventilated air layer0.03000.1881.31000
PVC vapour barrier0.00300.1601390900
Rockwool “Hard Rock Energy”0.12000.0362201030
Rockwool “211”0.14000.035401030
Unventilated air gap (upwards)0.10000.0001.31008
Oriented strand board0.02200.1306501700
Vapour retarder0.00400.23011001000
Slightly ventilated air layer0.08000.5201.31008
Oriented strand board0.02200.1306501700
Bitumen0.00400.17012001000
Table 3. Thermal performances of the opaque envelope.
ComponentThickness (s) (m)U [W/(m2 K)]YIE [W/(m2 K)] Ms (kg/m2) f (-) Δt (h)Vapour Condensation RiskU nZEB Reference Values [W/(m2 K)]
External wooden wall0.3410.119YIE = 0.017
Ms = 36.370
f = 0.142
Δt = 11.170
No0.260
External wooden wall—stone coated0.3410.136YIE = 0.023
Ms = 115.570
f = 0.167
Δt = 11.900
No0.260
Floor (on basement)0.5000.152YIE = 0.006
Ms = 556.040
f = 0.041
Δt = 16.410
No0.260
Ground floor0.5000.153YIE = 0.009
Ms = 538.040
f = 0.056
Δt = 15.540
No0.260
Roof0.5370.119YIE = 0.028
Ms = 74.243
f = 0.237
Δt = 12.960
No0.220
ComponentUw [W/(m2 K)]Vapour Condensation Risk (Internal Surface Temperature)U nZEB Reference Values [W/(m2 K)]
Windows (triple glazing with aluminium frame—thermal brake)0.77–1.09No1.40
Table 4. Surface temperatures in the different layers of the external wall.
LayersExternal Wall, Homogeneous—Superficial Temperatures (°C)External Wall, Wooden Stud—Superficial Temperatures (°C)External Wall Scheme
te00 Sustainability 10 00476 i001
tse0.100.11
ts10.120.16
ts28.2210.12
ts38.5410.67
ts416.5014.87
ts516.8715.44
ts619.5819.41
tsi19.6919.58
ti2020
Table 5. Surface temperatures in the different layers of the roof.
LayersRoof, Homogeneous—Superficial Temperatures (°C)Roof, Wooden Stud—Superficial Temperatures (°C)Roof Scheme
te00 Sustainability 10 00476 i002
tse0.120.08
ts10.610.43
ts20.901.12
ts31.381.46
ts41.873.18 (wooden stud)
ts511.037.72
ts619.1118.91
ts719.5519.45
tsi19.6719.60
ti2020
Table 6. Comparison between the calculated thermal transmittance values.
ComponentsTransmittance UNI EN ISO 6946:2008 W/(m2 K)Transmittance UNI EN ISO 10211:2008—Bisco® W/(m2 K)
External wooden wall0.1190.130
External wooden wall—stone coated0.1360.145
Roof0.1190.140
Table 7. Comparison between the calculated thermal bridge coefficients.
Thermal Bridge TypologiesThermal Bridge Coefficient UNI EN ISO 14683:2008 W/(m K)Thermal Bridge Coefficient UNI EN ISO 10211:2008—Bisco® W/(m K)
connection between external wall and ground floor0.0340.069
connection between external wall and roof0.1150.045
connection between wall and window frame0.1380.061
connection between external wall and basement floor0.0490.064
convex angle of the external wall-0.040
Table 8. Different shading strategies assessed.
Internal white drape with the following features:
  • solar transmittance t = 0.7
  • solar reflectance r = 0.2
  • solar absorptance a = 0.1
White drape has been considered closed when solar irradiation on the glass Isol is bigger than 300 W/m2 in accordance to UNI/TS 11300-1:2014 [20]
External venetian blind with aluminium slats with the following features:
  • white colour (VSR 901)
  • r = 0.75
  • a = 0.25
  • width = 80 mm
  • distance between slats = 75 mm
  • slat tilt = 30°
Venetian blind is considered closed when solar irradiation on the glass Isol is bigger than 300 W/m2 in accordance to UNI/TS 11300-1:2014
External fixed shading put on SW façade. It consists of a light frame connected with the portico columns with 4 wooden blinds with the following features:
  • r = 0.4
  • a = 0.6
  • slat length equal to the façade
  • slat width = 35 cm
  • distance between slats = 25 cm
  • slat tilt = 0°

