Article

Effects of Irrigation Regime and Nitrogen Fertilizer Management on CH4, N2O and CO2 Emissions from Saline–Alkaline Paddy Fields in Northeast China

1
Key Laboratory of Groundwater Resources and Environment, Ministry of Education, Jilin University, Changchun 130012, China
2
College of Environment and Resources, Jilin University, Changchun 130012, China
*
Author to whom correspondence should be addressed.
Sustainability 2018, 10(2), 475; https://doi.org/10.3390/su10020475
Submission received: 30 November 2017 / Revised: 26 January 2018 / Accepted: 6 February 2018 / Published: 11 February 2018

Abstract

:
Irrigation regime and fertilizer nitrogen (N) are considered as the most effective agricultural management systems to mitigate greenhouse gas (GHG) emissions from crop fields, but few studies have involved saline–alkaline paddy soil. Gas emitted from saline–alkaline paddy fields (1-year-old and 57-year-old) was collected during rice growing seasons by the closed chamber method. Compared to continuous flooding irrigation, lower average CH4 flux (by 22.81% and 23.62%), but higher CO2 flux (by 24.84% and 32.39%) was observed from intermittent irrigation fields. No significant differences of N2O flux were detected. Application rates of N fertilizer were as follows: (1) No N (N0); (2) 60 kg ha−1 (N60); (3) 150 kg ha−1 (N150); and (4) 250 kg ha−1 (N250). The cumulative emissions of GHG and N fertilizer additions have positive correlation, and the largest emission was detected at the rate of 250 kg N ha−1 (N250). Global warming potential (GWP, CH4 + N2O + CO2) of the 57-year-old field under the N250 treatment was up to 4549 ± 296 g CO2-eq m−2, approximately 1.5-fold that of N0 (no N application). In summary, the results suggest that intermittent irrigation would be a better regime to weaken the combined GWP of CH4 and N2O, but N fertilizer contributed positively to the GWP.

1. Introduction

The burgeoning population and increasing future rice demands have created tremendous concerns about agricultural greenhouse gas (GHG) emissions, which account for about one-tenth of total global anthropogenic GHG emissions [1]. The greenhouse warming potential (GWP) of rice crop fields is approximately 4.6 times and 1.6 times that of wheat and maize, respectively [2]. It is reported that paddies cover nearly 153 million ha., approximately 11% of the world’s farmland and 50% of the people on the earth are supported by rice [3]. China is the most important producer of rice, of which cultivated areas and rice yields both account for about 1/5 of the world’s planting area [4].
CO2, which serves as the major greenhouse gas contributor, supplies 60% of the greenhouse effect from humans, CH4 and N2O contribute 15% and 5%, respectively [5]. In the global warming potential for the one hundred year horizon in terrestrial ecosystems, the contribution of CH4 and N2O is 25 and 298 times larger than CO2 respectively [6]. CH4 and N2O fluxes from paddies contribute approximately 30% and 11% of rural emissions, and paddies also can be either a source or sink of CO2 [7,8,9]. Soil microbial activities have an effect on the production and uptake of GHG [10] and are impacted by soil characters (e.g., soil temperature, water content and content of NH4+ and NO3) [11,12,13,14,15]. Water regimes and N fertilizer application affect soil moisture, nutrient content and the soil’s physicochemical properties and could be effective crop management tools to mitigate GHG emissions.
Single spring paddy rice is widely cultivated in northeast China, and phenological developments affected by climate change include green, tillering, booting, heading and maturity [16]. CO2 is assimilated and stored in the soil by plants and roots via rice growth. In addition, the labile carbon (C) pool with easily decomposable soil organic matter is decomposed and utilized for crop growth or emission as CH4 or CO2 into the air. Watanabe et al., covered that the translocation of carbon assimilated by rice into the soil organic matter (SOM) with crop growth and that the content of carbon absorbed by rice and emitted as CH4 tended to increase by 0.003%, 0.26%, and 0.30% at the tillering, booting, and maturity stage, respectively [17]. The fluxes of GHGs, including CO2, CH4 and N2O, are highly variable during the five phenophases and are strongly affected by agricultural management.
Continuous flooding irrigation (CF) and intermittent flooding irrigation (IF) are common watering management systems during rice cultivation in northeast China. Methanogenic bacteria which decompose the dissolved organic carbon and produce CH4, are active in the CF pattern due to the anaerobic conditions made by a flooded water layer [18]. Intermittent flooding irrigation, with drying-wetting alternation during the rice-growing period, has been recognized as a valid way of mitigating CH4 emission in rice-production [19,20]. Less CH4 fluxes were monitored in IF pattern than CF paddies [21]. However, other reports have found that the role of intermittent irrigation could be not obvious, compared to flooding irrigation [19]. The effects of different irrigation regimes on crop production and gas fluxes may diverge from various practices or exhaust gas emissions for the same practice in different regions [22].
Nitrogen (N) fertilizer is an effective measure to enhance rice production which will feed more than a billion people worldwide over the next 30 years [23]. Crop-growth is escalated by nitrogenous fertilizer; sufficient substrates are accommodated for methanogens and the transport of GHG emissions to the air is easier due to the larger aerenchyma [24]. As reported, CH4 emissions could be significantly induced by N fertilization. The size and structure of NH4+ and CH4 are similar, thus CH4 monooxygenase adheres and works on NH4+ in place of CH4, inhibiting CH4 consumption and increasing gas emissions [25]. Zheng et al., evaluated that approximately 3/4 of the annual freeings of N2O from the plow land of China was caused by anthropogenic N-input [26]. As more fertilizer is used, higher amounts of N2O and CH4 are emitted [27,28]. Nevertheless, other studies have shown a substantial decrease in CH4 emissions due to N fertilization. CH4 emissions from microcosms displayed a strong inverse relationship with NH4+ availability. The application of urea fertilizer enhanced rice biomass, leading to greater soil O2 input from roots, combined with higher NH4+ availability which stimulated methane oxidation, leading to a reduction in emissions [29]. In addition, Banger et al., discovered that CH4 emissions were stimulated at a rate lower than 140 kg N ha−1, above which the fluxes were inhibited in rice-based cropping systems [30]. These discrepancies may be related to the climate conditions and the physical and chemical properties of soil from different region [31,32,33].
Salinization is an enormous threat to environmental resources, and the area would account for more than 50% of the arable land by mid-century [34]. Fields in western Jilin were barely covered with vegetation due to the land salinization before 1960s, when large-scale reclamation and rice cultivation were carried out. Nowadays, the region is a major rice-producing area and has made great contributions to grain production and food security in the Jilin province. Fields are still being reclaimed to paddies, especially after the project of irrigation from the Nen River was accomplished. Thus, newly and long-term tillage saline–alkaline paddies are chosen to estimate the impact of tillage on GHG emissions and global climate change during different reclamation years.
In the current study, we monitored the GHG fluxes from 1-year-old and 57-year-old saline–alkaline paddies in 2012 and 2013 in Qianguo. The objectives of this study were to (i) identify the difference of GHG fluxes between intermittent irrigation and continuous flooding irrigation in two tillage year paddies during rice-growing stages; (ii) ascertain the cumulative GHG emissions under different N fertilization rates during five rice-growing periods in two tillage year paddies; (iii) estimate the GWP of 1-year-old and 57-year-old paddies under different tillage treatment, comprehensively. We expected that a reasonable tillage management would be predicted for rice paddies and their reclamation which would benefit the minimization of GHG emissions.

2. Materials and Methods

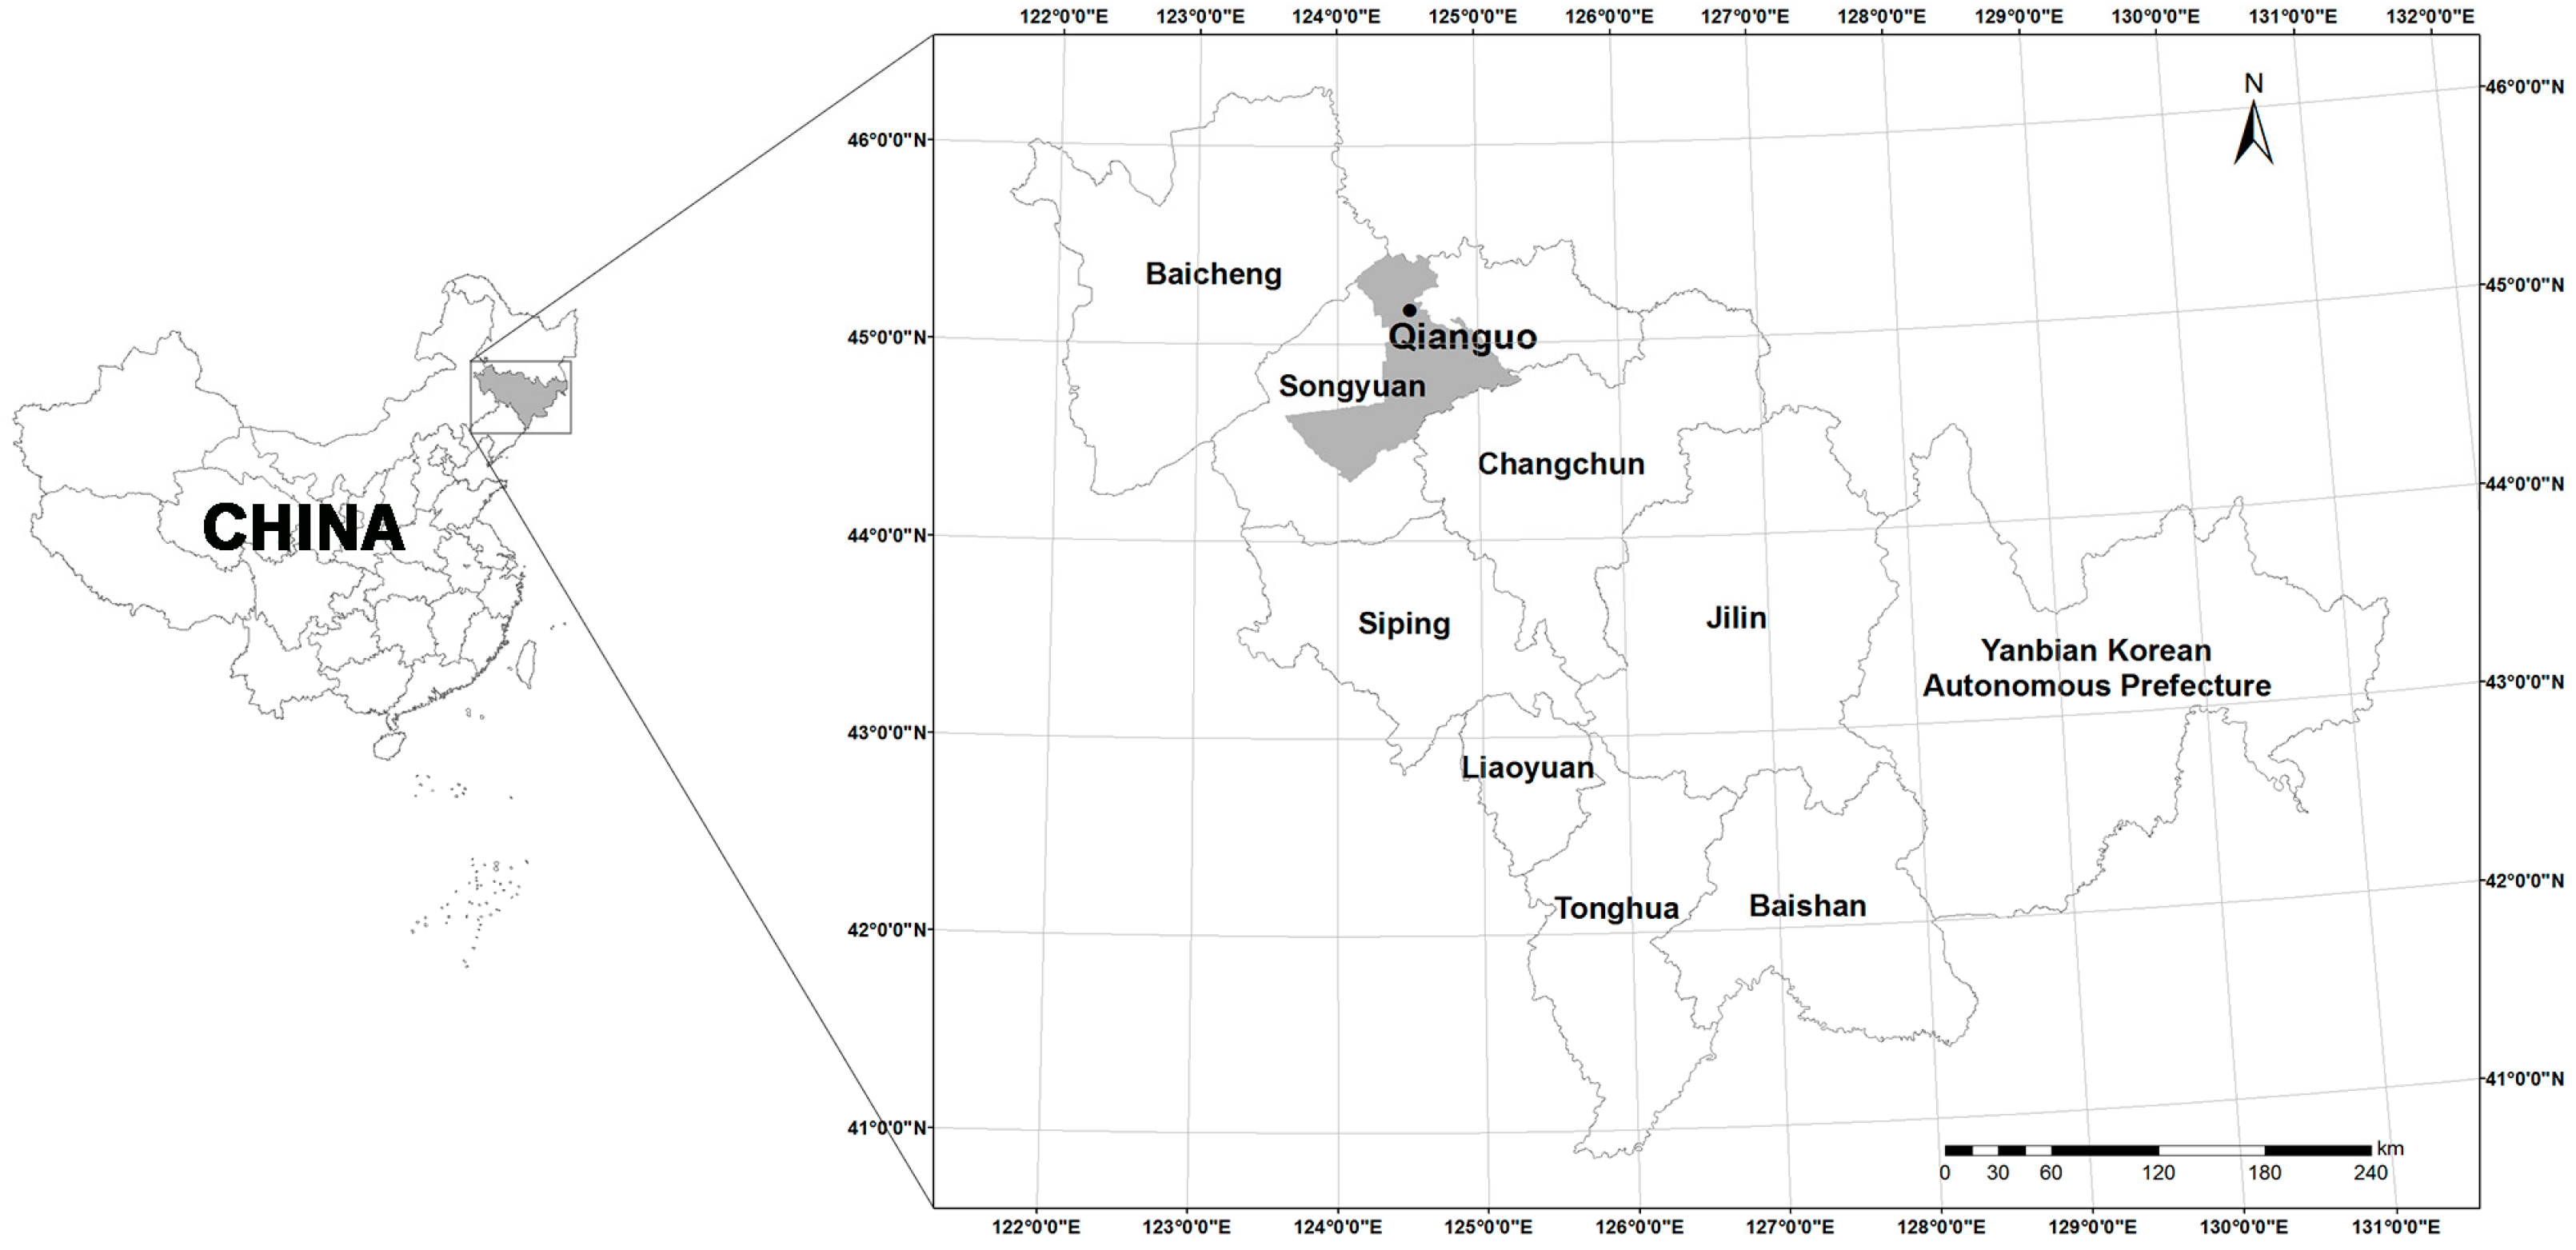
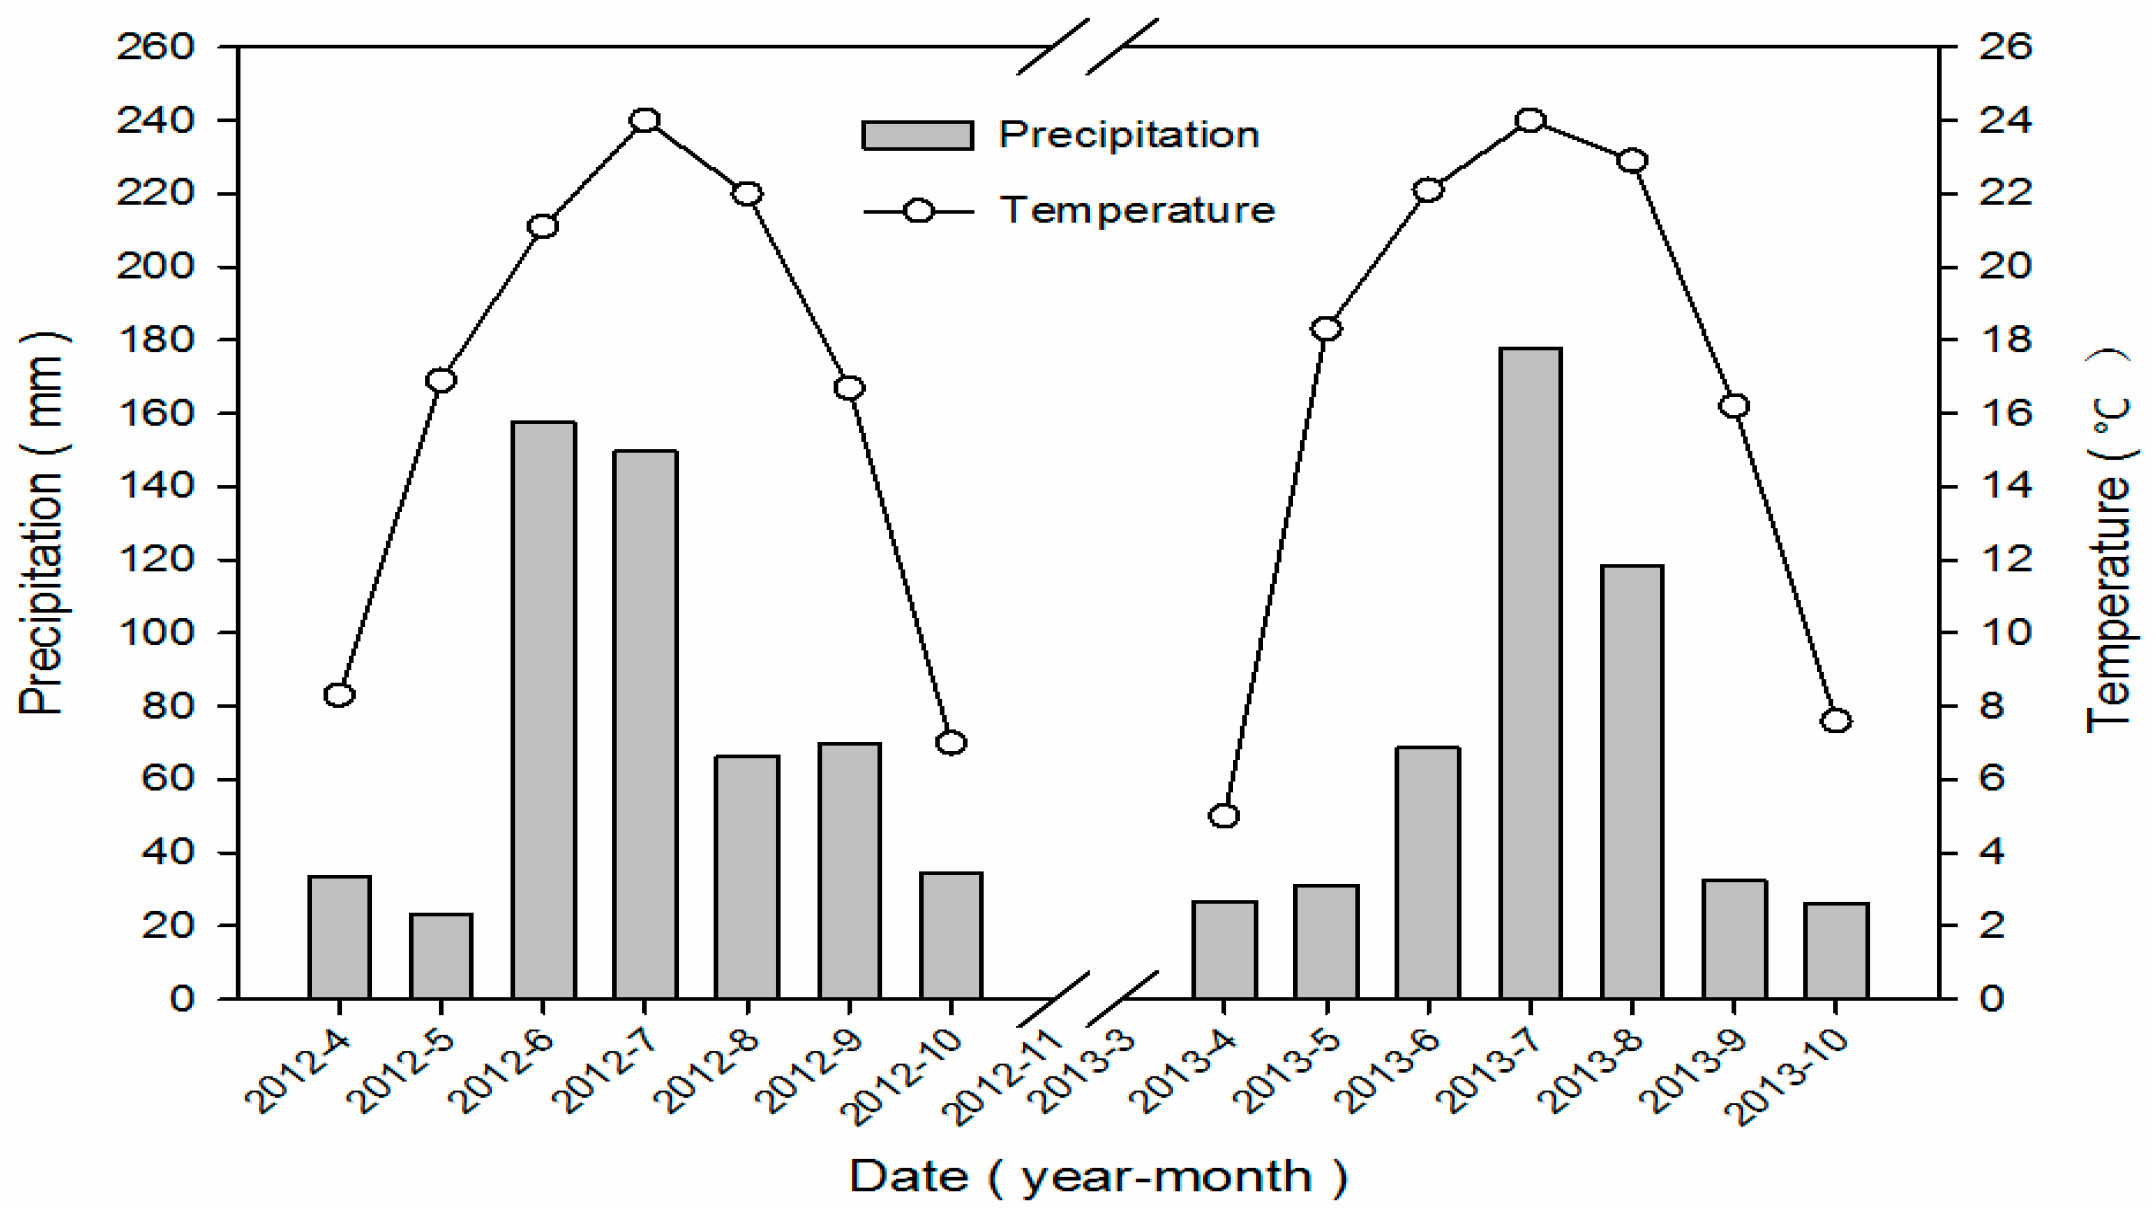
2.1. Site Description

Field experiments were carried out during the rice-growing period of 2012 and 2013 in Qianguo town (123°35′~125°18′E, 44°17′~45°28′N)(Figure 1), in the west of Jilin province south of the Songnen Plain. The climate is a typical semi-arid. Monthly precipitation and air temperature during experimental period is shown in Figure 2 [35]. The freezing period is between late October and mid-April (approximately 165 days) each year. Single-season rice is planted in the study area on 26 May and harvested on 2 October. The fertilizer N rate is between 60 and 250 kg N ha−1, the mean rate is 150 kg N ha−1, and the rice variety is Jijing88 (Super-rice I).

2.2. Experimental Design

The land (124°43′03″E, 45°00′19″N, 42.7 m × 20.4 m), barely covered with vegetation due to the soil salinization, has been reclaimed as a rice paddy since 1955, irrigated and fertilized every year. The bare land (124°42′27″E, 45°00′05″N, 43.6 m × 21.8 m) without artificial disturbance before rice plantation was reclaimed in 2012. Land plots were plowed in late April before irrigation and then rice seedlings were transplanted in mid-May by machinery.
Experiment I was operated in 2012 to test the impact of water management systems continuous flooding irrigation (CF) and intermittent flooding irrigation (IF) on GHG emission. An earthen row was built into a ridge in each paddy to divide the patty into two parts (20 m × 20 m) before plowing, where CF and IF irrigations would be used. The water layer was always kept at 3 to 5 cm in CF treatment before the mature stage and drained for harvest. Under the IF irrigation mode, the water depth was 3–4 cm during the green stage, drained and rewetted, and maintained at 1 to 2 cm until the mature stage. To ensure that the nutrients were not limited, N fertilizers (150 kg N ha−1) were applied four times, accounting for 10%, 50%, 25% and 15% of the total amount, respectively. The fertilizer was applied before transplant seedlings (basal fertilizer), added in the third day after transplanting (green-tiller fertilizer), and broadcasted in the beginning and the end of July (booting fertilizer), respectively. The rice variety is Jijing88 (Super-rice I). Crops were planted and managed according to local farmers.
Experiment II was carried out in 2013 to find the influence of N fertilizer management on GHG. Each field was separated into four parts (10 m × 20 m) by artificial ridges before plowing. Local fertilizer application rates were ranged from 60 to 250 kg N ha−1. Thus, four gradients were set: Control group (N0, no N fertilizer added), low N fertilizer (N60, 60 kg N ha−1), medium N fertilizer (N150, 150 kg N ha−1) and high N fertilizer (N250, 250 kg N ha−1). Plots were plowed and cropped (under IF) according to the methods mentioned above.

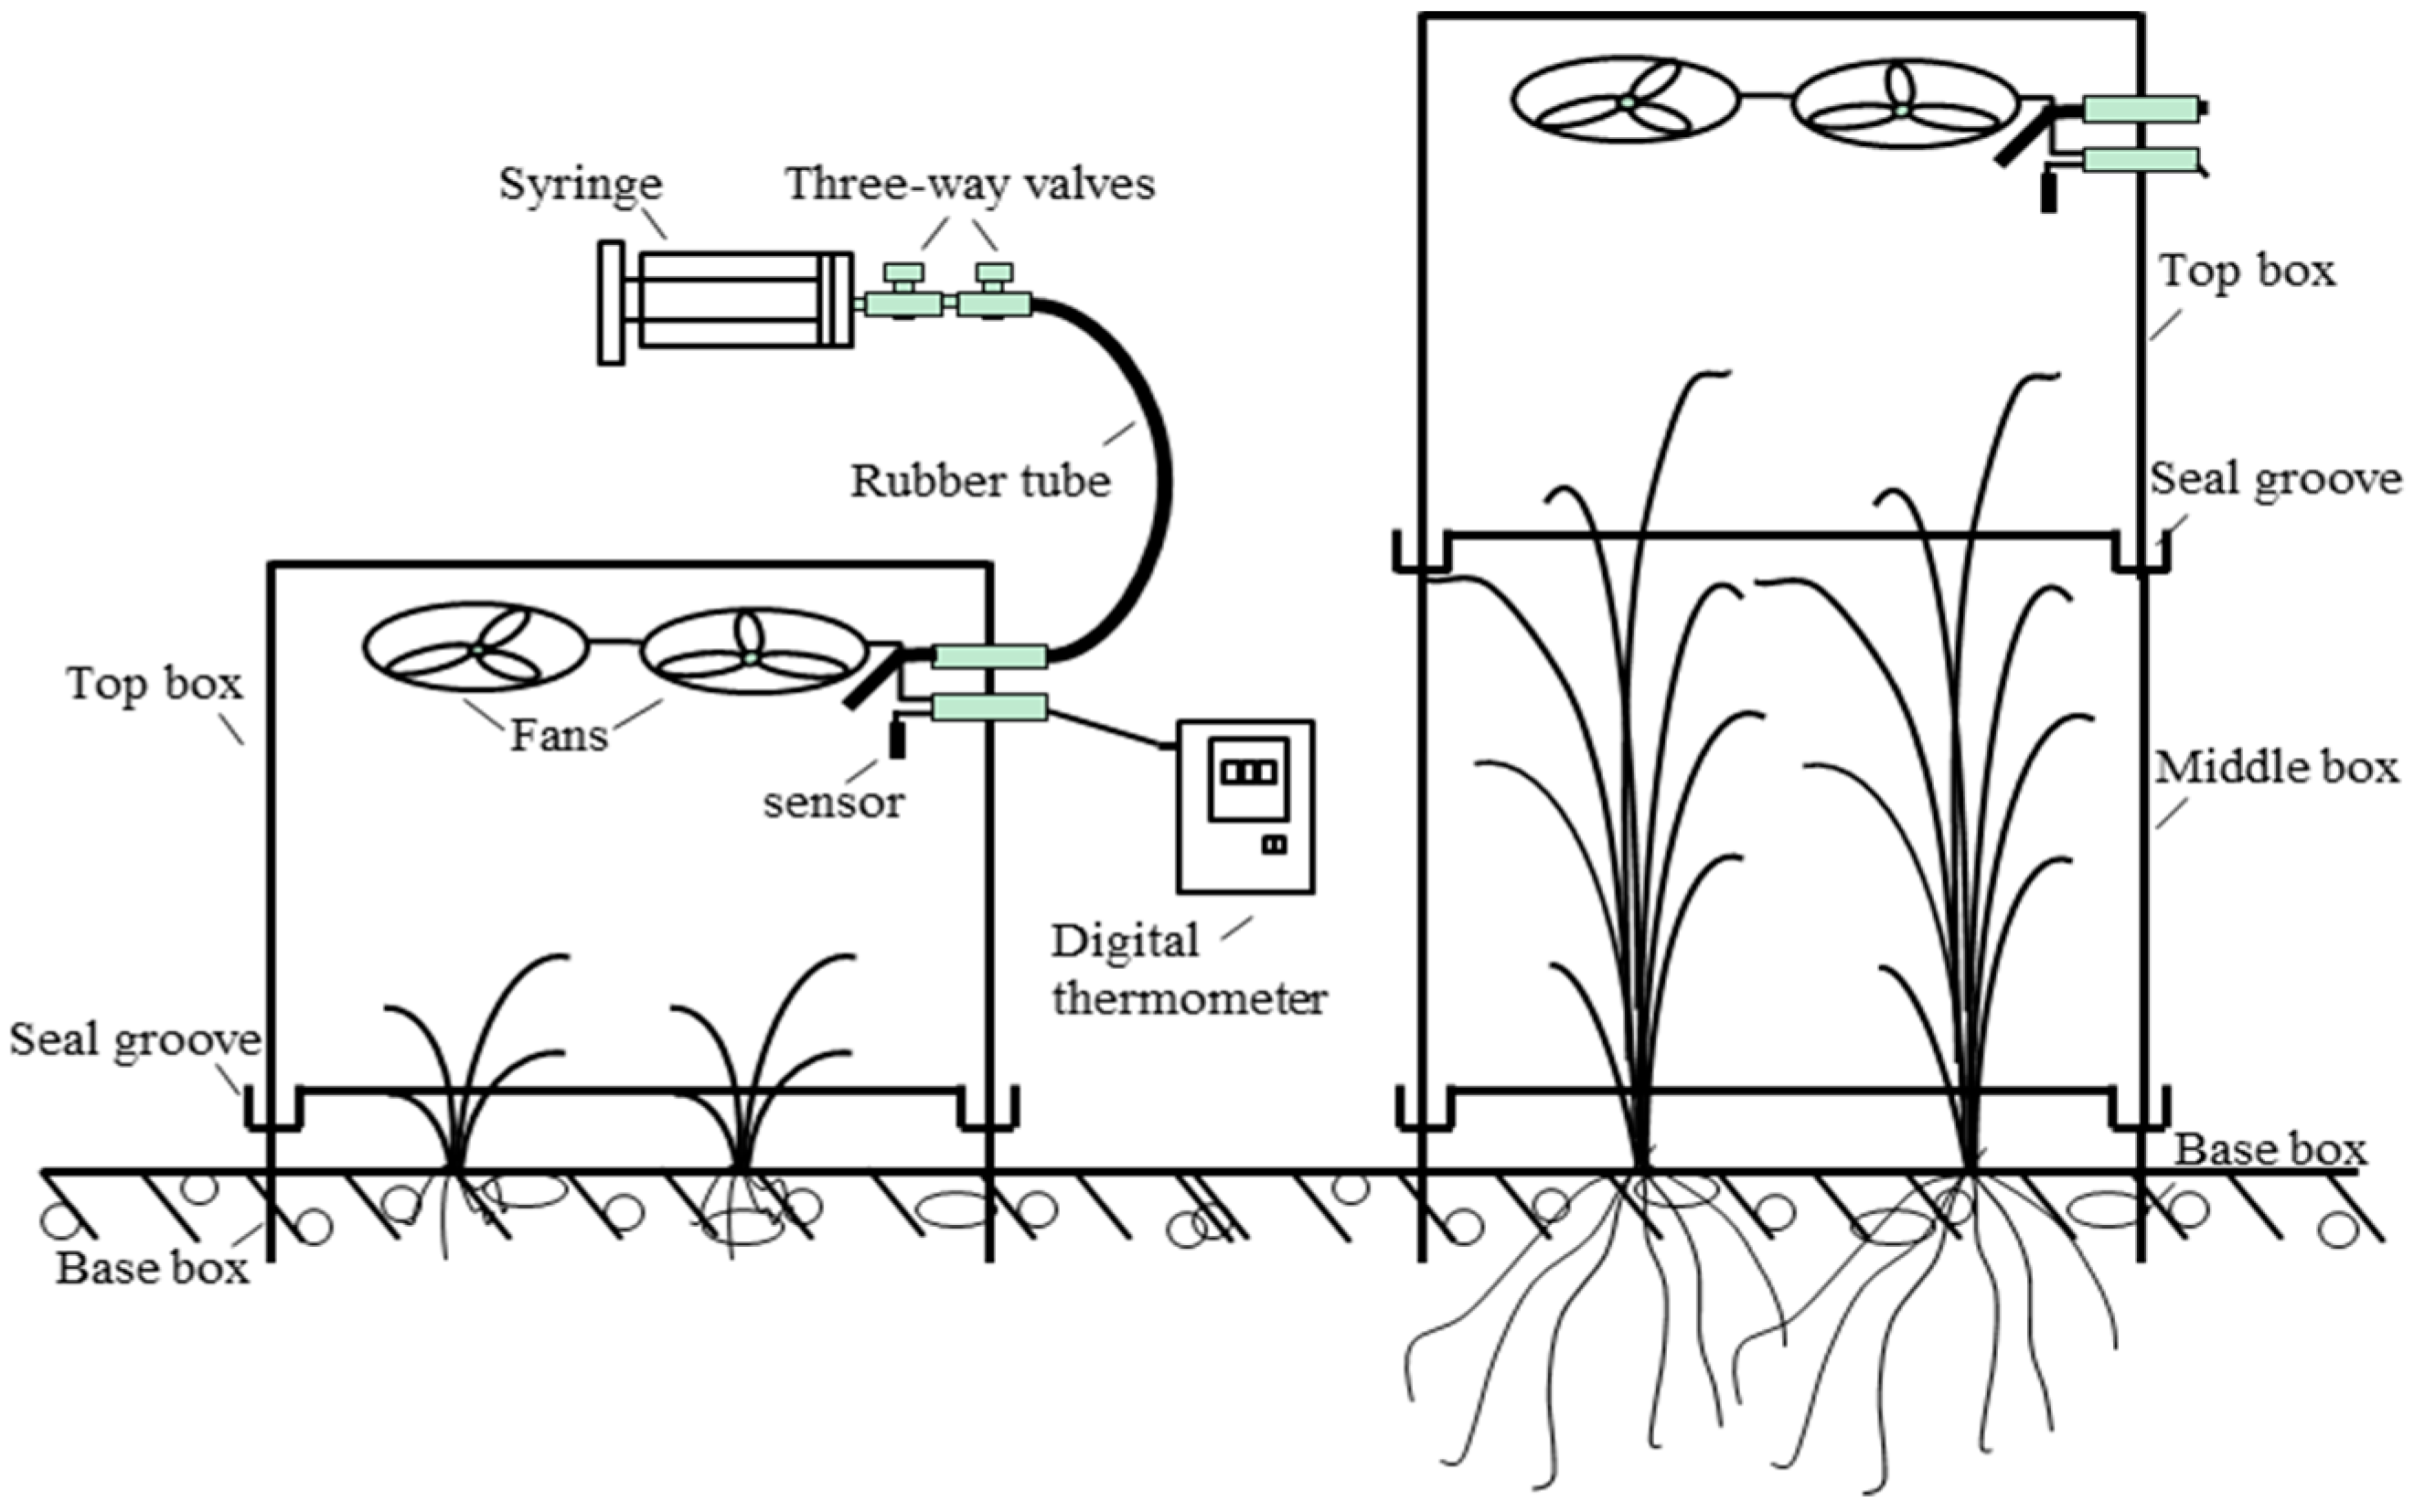
2.3. Emissions Measurements

Closed chamber technique was used to collect gas samples [36]. The base (50 cm × 50 cm × 30 cm) made of acrylic sheets (6 mm) were put in the fields ahead of rice transplanting and enclosed six plants. Chambers of 50 cm (Length) × 50 cm (Width) × 50 cm (Height) were placed on the base. Grooves were designed on the top of base and middle chambers and replete with water to make the system gas-tight. Fans were fixed to homogenize the air inside [37]. Holes on the chamber were used for temperature testing and gas sampling. The middle chamber was put on the pedestal and under the top box from the booting stage to maturity, when rice was growing faster and taller than 50 cm (Figure 3). Gas samples were collected every half-hour at 9:00~11:00 a.m. two times a week throughout the cropping season. Samples were drawn with an air-tight syringe and injected to pro-evacuate 50 mL vacuum bags immediately. Gas was sent to the lab of Northeast Institution of Geography and Agro-ecology, Chinese Academy of Sciences. The contents of gases were subsequently tested with a gas chromatograph (GC, Agilent 7820A, Santa Clara, CA, USA) [22].

2.4. Soil Properties Analysis

Fifteen samples from each paddy were collected in metal cylinders (100 cm3) before the field experiment, and dried at 105 °C for 48 h to calculate water content and report soil bulk density on a dry basis. Twenty-five samples taken with soil auger (7 cm) from each field were mixed and air dried at room temperature, then passed sequentially through a sieve (2 or 1 mm) and stored for physical—chemical analysis (Table 1). Soil organic carbon (SOC) was tested using a total organic carbon (TOC) analyzer (Shimadzu TOC-V, Japan). Total nitrogen was determined using Kjeldahl method. Total phosphorus was measured according the method of Andetsen (1975) [38]. PH and EC were measured using PHS-3C (08) pH meter and DDS-307 conductivity meter (Rex China) at a ratio of 5:1 (water to soil). CEC (cation exchange capacity) was tested using an EDTA-ammonium acetate exchange method, and a flame emission photometric method was used for exchangeable sodium. ESP is the percentage of exchangeable sodium to CEC. Experiments were performed in triplicate.

2.5. Calculation of CH4, N2O and CO2 Emission

Fluxes were computed from the following formula [39,40].
F = ρ × (V/A) × (Δct) × (273/T)
F cal ¯ = c × F ¯
where F is the flux of CH4, N2O or CO2 (mg m−2 h−1), ρ is the density of gas (mg cm−3), V and A are the volume (m3) and surface area (m2), ∆c/∆t is the rate of gas increase inside of chamber (mg m−2 h−1), and T is the absolute temperature in-house. ( F c a l ¯ ) is the calibration of the average emission of CH4, N2O or CO2, F is the mean flux of a certain gas (mg m−2 h−1), and C is the calibration coefficient (1.24) [41].
Seasonal GHG emission was computed as follows:
F C ¯ = F c a l ¯ × 24 × D i / 1000
where FC is the accumulative fluxes in every rice-growing season (g m−2) and Di is the days of the ith period.
Global warming potential of main GHG was calculated using the following equation [6]:
F c = 25 F CH 4 + 298 F N 2 O + F CO 2
where Fc is the accumulative flux (g CO2-eqv m−2), F CH 4 is the cumulative flux of CH4 (g m−2), FN2O is the cumulative flux of N2O (g m−2), F CO 2 is the cumulative flux of CO2 (g m−2).

2.6. Statistical Analysis

SPSS 19.0 software (SPSS Inc., Chicago, IL, USA) was used for statistical analyses. One-way and two-way analyses of variance (ANOVA) were performed to analyze the differences of average and cumulative CH4, N2O and CO2 flows in different irrigation regimes and N fertilization managements (LSD; p < 0.05). Microsoft Excel 2003 software was used to cypher the standard deviation of means. SigmaPlot 12.5 (Systat Software, Inc., San Jose, CA, USA) was applied for plots.

3. Results

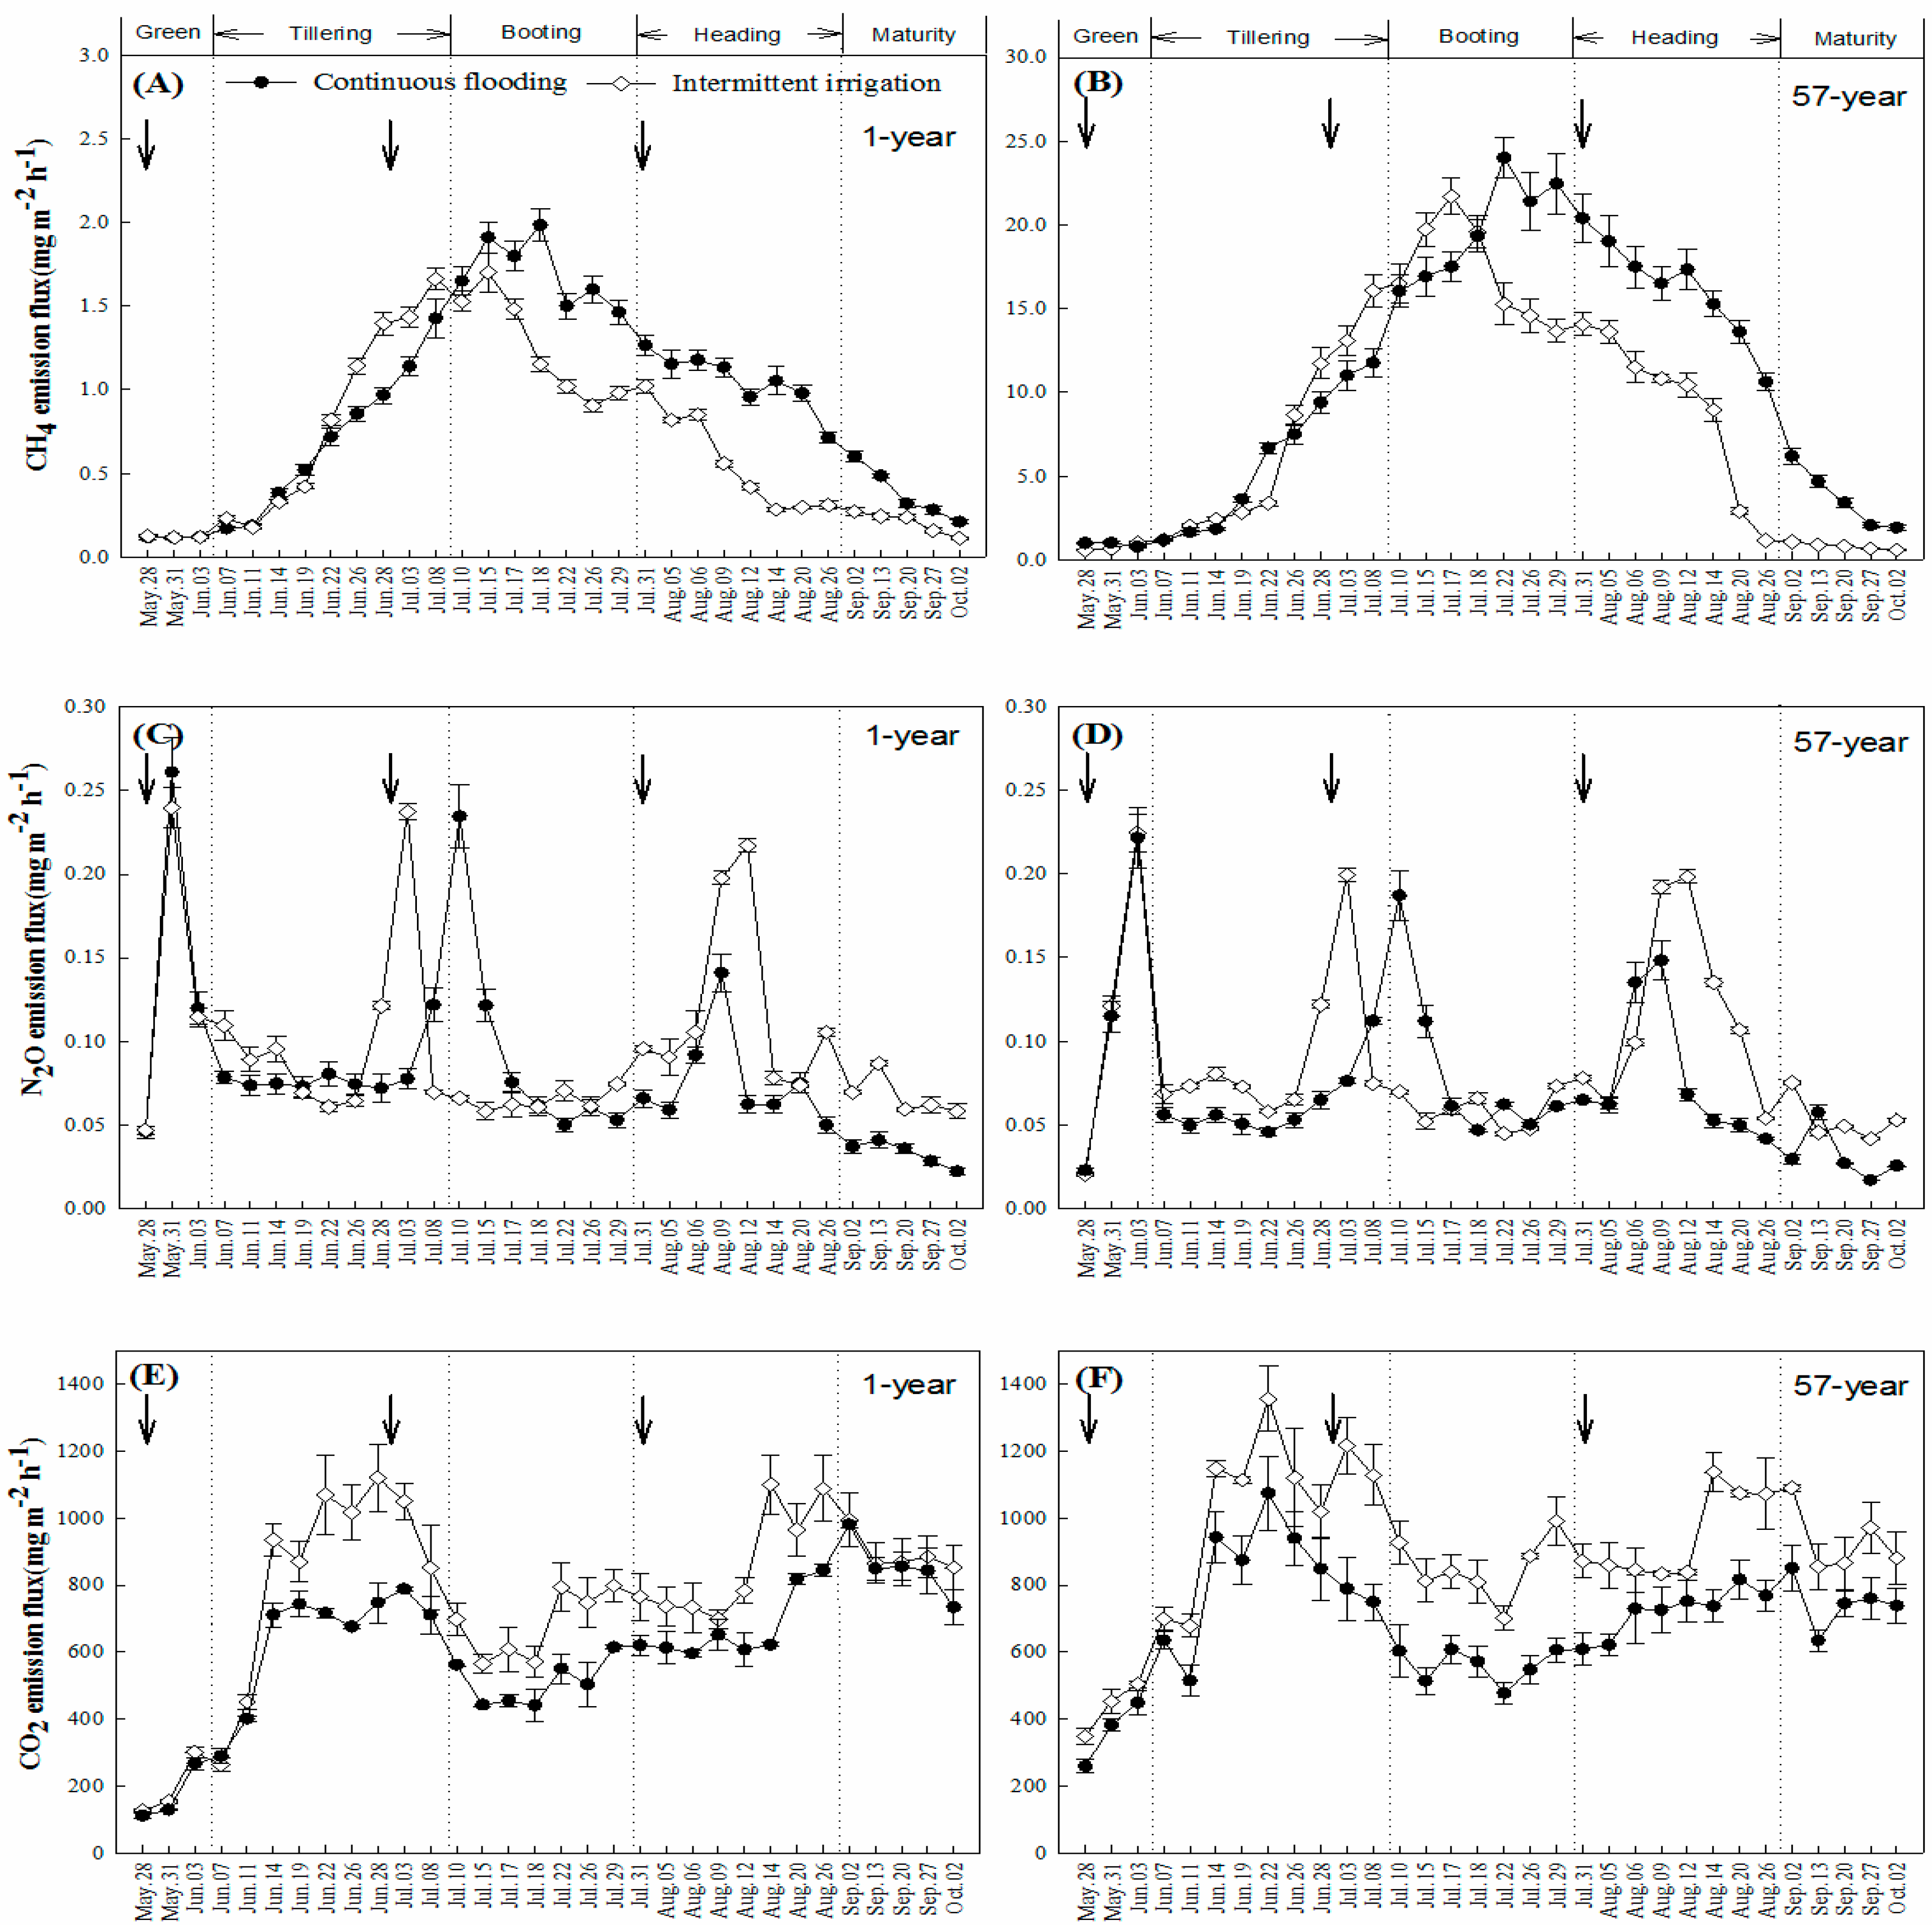
3.1. GHG Emissions under IF and CF Regime

CH4 showed single-peak emission during the rice growing period. The peak values under intermittent irrigation were lower but earlier (4 days) than in the continuous flooding condition, with crest values of 1.98 mg m−2 h−1 and 24.02 mg m−2 h−1 from 1-year-old and 57-year-old paddies, respectively (Figure 4A,B). The largest average flux appeared in the booting stage, i.e., 1.70 ± 0.16 mg m−2 h−1 (1-year-old, CF) and 1.25 ± 0.25 mg m−2 h−1 (1-year-old, IF), but the lowest mean value was observed in the green period. Comparatively, CH4 from long-term tillage paddy had higher emission flux, with cumulative emissions of approximately 9.21- (CF) and 8.36- (IF) fold higher than that of new fields. CH4 was sensitive to irrigation regimes during booting, heading and mature stages, which was susceptible to tillage year (Table 2).
In the time of the rice-growing season, N2O flux from CF was low, with a mean rate of 0.08 mg m−2 h−1 (1-year-old) and 0.07 mg m−2 h−1 (57-year-old). Three peaks appeared in the green, booting and heading stages and then dropped speedily to low levels (0.02~0.09 mg m−2 h−1). N2O flux from IF showed similar emission trends, although the peak appeared in the tillering stage, earlier than booting, and the maximum rate in heading was much higher (0.22 mg m−2h−1, 1-year-old; and 0.19 mg m−2 h−1, 57-year-old) (Figure 4C,D). No significant differences of N2O fluxes between the two treatments (IF and CF) were observed except for the mature stage, and the total cumulative emissions were 0.23 mg m−2 (1-year-old, CF), 0.29 mg m−2 (1-year-old, IF) and 0.20 mg m−2 (57-year-old, CF), 0.24 mg m−2 (57-year-old, IF) (Table 2).
CO2 emissions in CF condition were lower than that from IF fields. During the green stage, the emission flux was lowest, with an average value of 169.03 to 435.65 mg m−2 h−1. The maximum was observed in tillering stage for the 57-year-old field, 818.75 mg m−2 h−1 (CF) and 1053.95 mg m−2 h−1 (IF), and maturity for the 1-year-old paddy, 852.78 mg m−2 h−1 (CF) and 893.70 mg m−2 h−1 (IF) (Figure 4E,F). There were significant differences in soil carbon dioxide during growing periods between water regimes, except for green and mature period, while cumulative emissions from the 57-year-old paddies were significantly higher than from the 1-year-old paddy (Table 2).

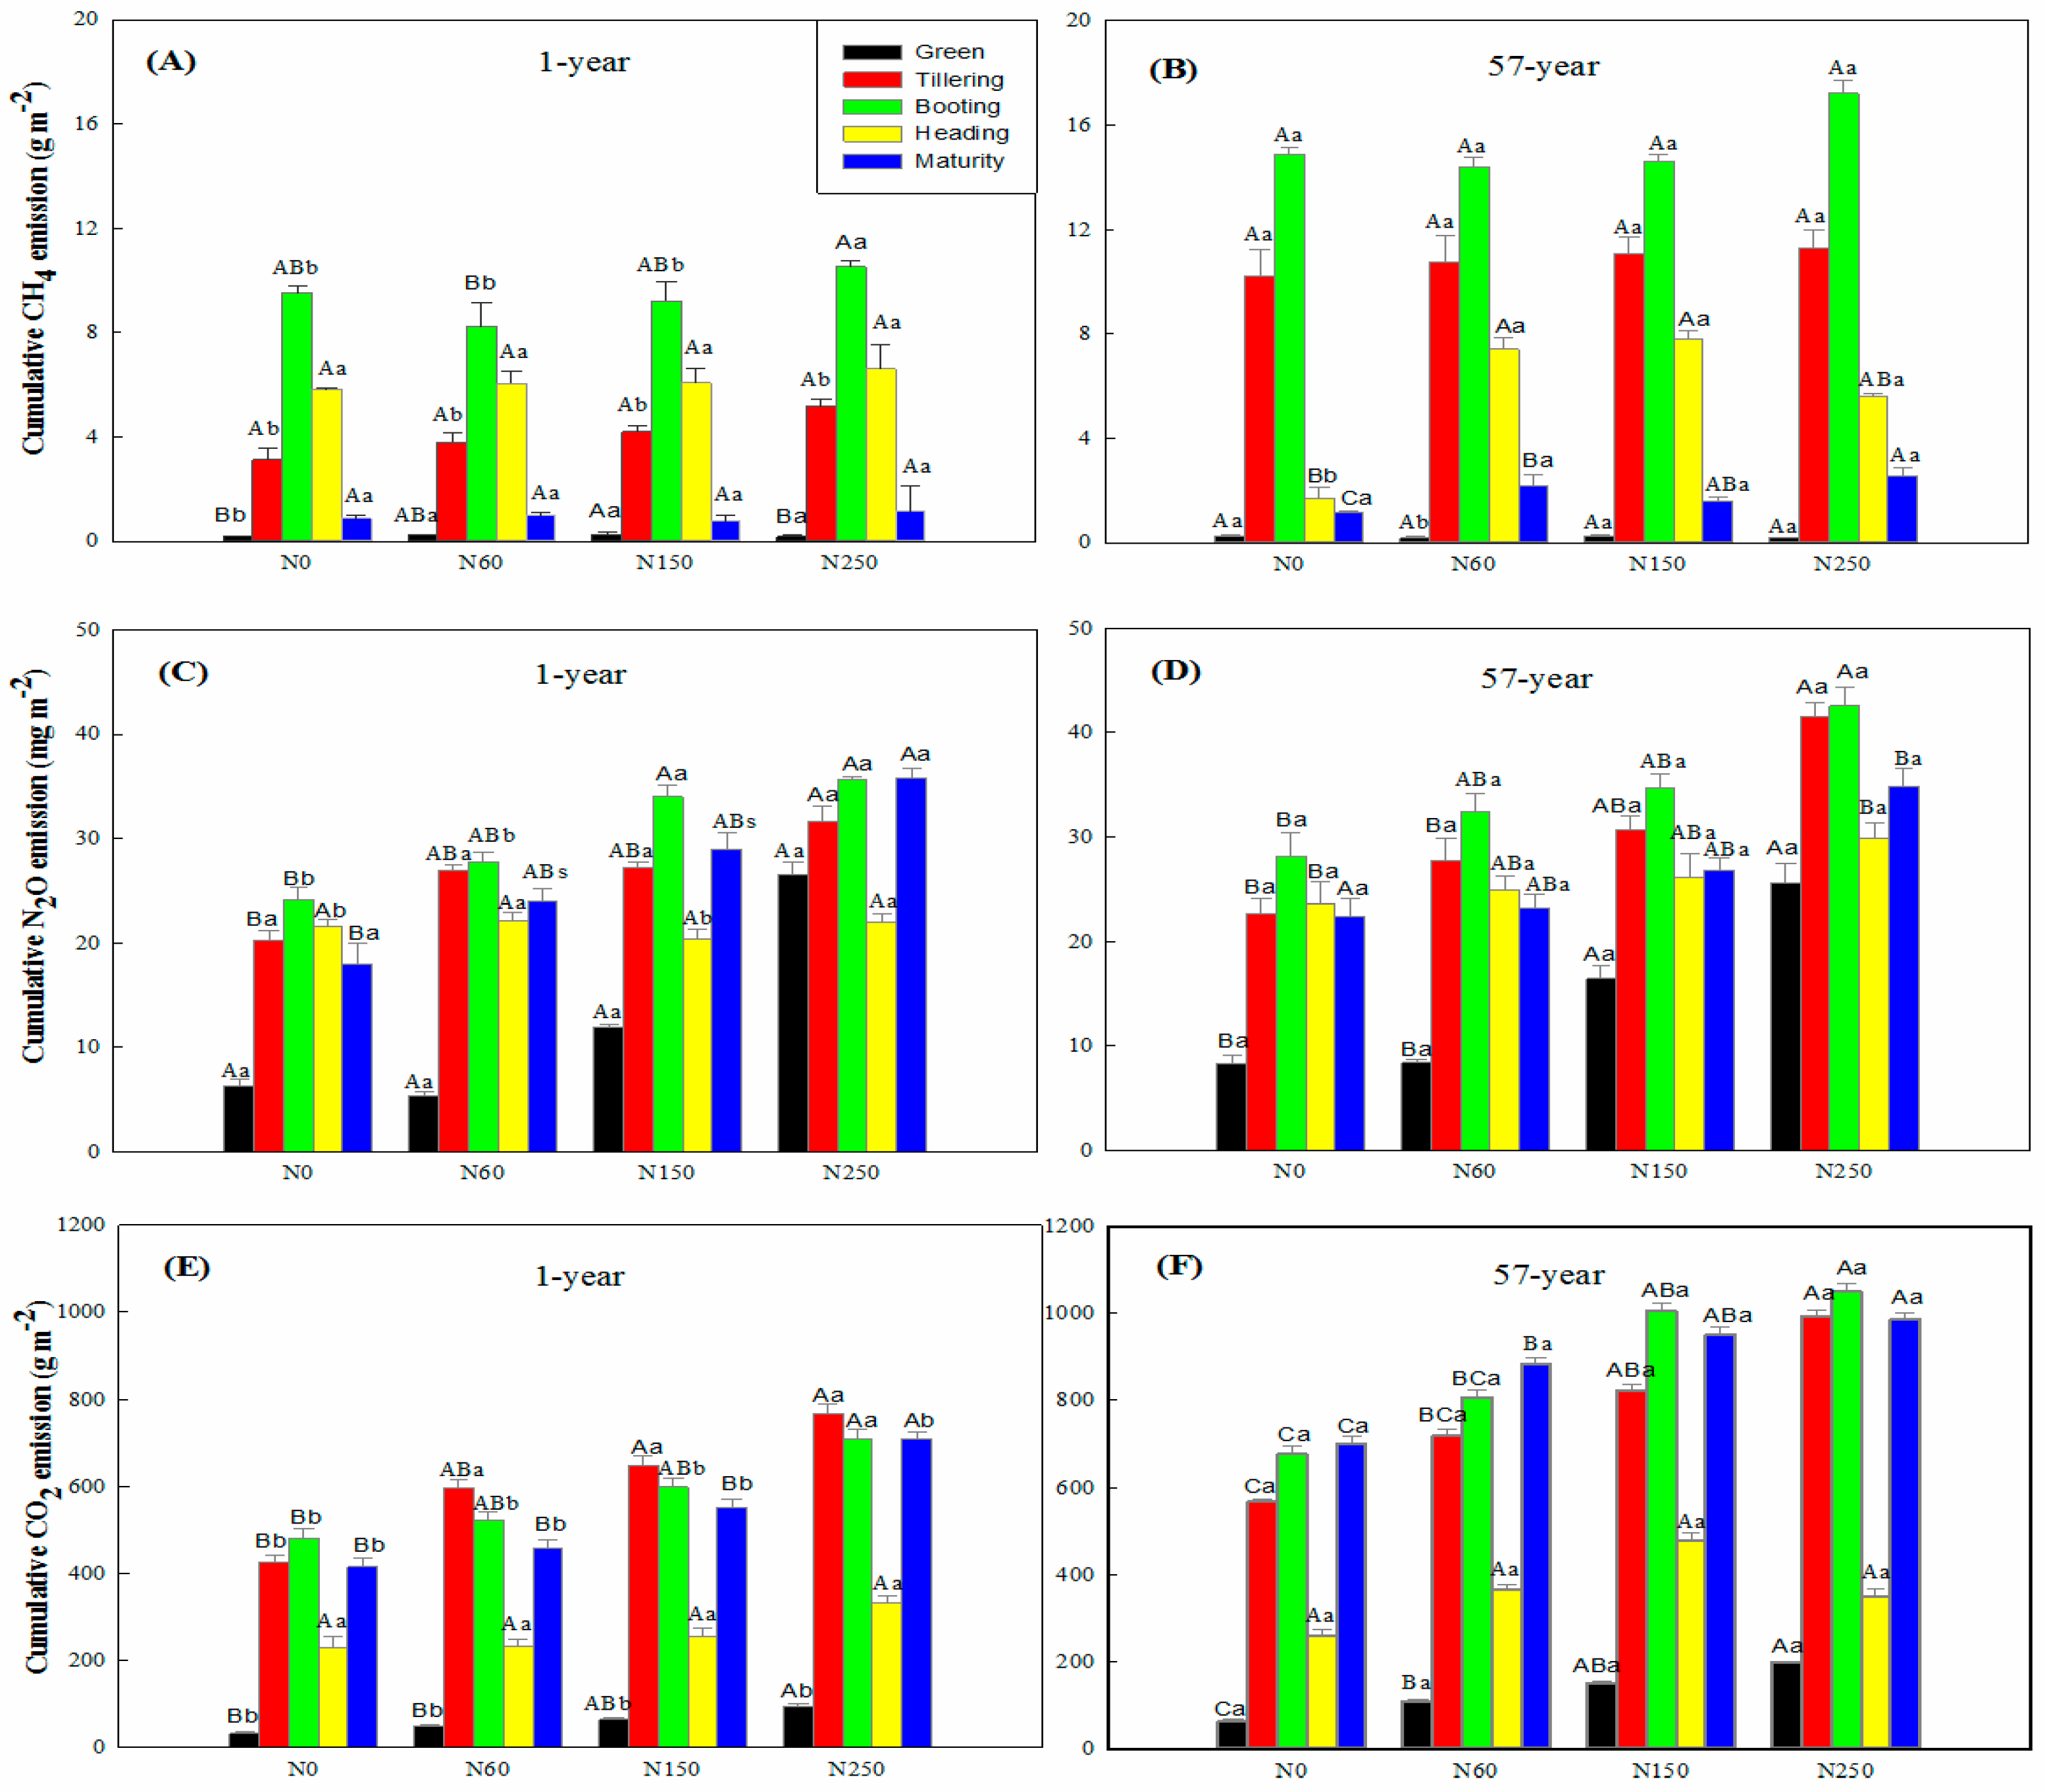
3.2. GHG Emissions under Fertilizer N Addition

Total cumulative CH4 fluxes ranged from 19.32–36.88 g m−2 and were positive correlated with N addition rates; the maximum was observed in the N250 treatment of 57-year-old paddy. Emissions in the booting stage were the highest, accounting for 41.25–52.67%, and in the green stage, the lowest, the emissions accounted for 0.48–1.27%. The cumulative fluxes were also positively correlated to N fertilization at different stages, but exceptions appeared in booting when the cumulative emissions in the N60 and N150 treatments were lower than the control (N0). More emissions were detected from long-term tillage paddy, approximately 1.56- to 1.75-fold higher than newly developed field in booting period (Figure 5A,B).
N2O fluxes were promoted by the application of nitrogen fertilizers, increasing with seasonal cumulative emissions of 90.34 mg m−2–174.42 mg m−2. Cumulative N2O fluxes reached a peak in the booting stage in all fields and were significantly higher in N250 treatment than N0 from long-term tillage fields during growing periods (Figure 5C,D). N2O emissions were lower in 1-year-old paddy soil than in the long-term tillage fields.
N fertilizer stimulated CO2 emissions, and the responses of seasonal cumulative CO2 emissions ranged from 1584.72 to 3575.02 g m−2 (Figure 5E,F). The contributions of CO2 emissions in the green stage and in the heading stage were less than others, accounting for 2.05–5.55% and 9.80–14.83% of total, respectively. The cumulative emissions from 57-year-old soils were always more than of 1-year-old fields, at a maximum of 1.5-fold higher in the booting period.

3.3. Area-Scaled Global Warming Potential

GWPs of CH4 and N2O from CF were much taller than that from IF: 1112 ± 18 g CO2-eq m−2 for 57-year paddy throughout rice growth (Table 3). In contrast, the total GWPs of IF were higher than that of CF when CO2 was considered, at 2813 ± 23 g CO2-eq m−2 (1-year-old) and 4271 ± 241 g CO2-eq m−2 (57-year-old). GWPs were larger in the long-term paddy than the new paddy.
The GWPs of paddy soils increased with N application rate in all treatments (N0, N60, N150, N250). Moreover, the greatest values were reported among 57-year-old paddies. Annual GWP of CH4 and N2O was highest in N250 treatments from long-term tillage fields (974 ± 132 g CO2-eq m−2), but the value was more than four-fold higher than the former if CO2 was taken into account.

4. Discussion

4.1. Seasonal Emissions of CH4, N2O and CO2

CH4 emissions fluctuated with rice-growth. The flux was high from middle tillering to the end of the heading stage, observing a peak value in the booting stage in which the cumulative CH4 emissions accounted for approximate half of the flux. The lowest cumulative gas flux was in the green and mature stages, with just 6% of the total proportion. CH4 production can be influenced by many factors, like rainfall, temperature and crop growth [33,42]. In July and August, the temperature is high, rice plants grow fast and roots develop rapidly, producing more H2 with the help of fermentative bacteria and producing acetic acid bacteria. More root exudates accelerate the decomposition of SOC and provide adequate substrate for microbes. The relatively high soil temperature increases the methanogenic activity, and the flooding layer creates a strict anaerobic condition for soil, promoting the production of CH4 [5]. However, during the mature stage the field drained and soil permeability was better, increasing methanotroph activities and inhibiting methanogens, and thus less CH4 emission flux was observed.
Throughout the entire rice-growing season, N2O emission flux showed minor fluctuations except for three drastic changes. In the green stage, the cumulative N2O emissions were lowest, but they were highest in the booting period. N2O gas produced from nitrification and denitrification, susceptible to temperature, soil moisture and fertilizer [43]. Rapid growth was primarily stimulated by the application of urea, increasing the concentration of the reaction substrate and promoting the formation and emission of gas.
The emission curves of CO2 changed with rice growing, increasing gradually from transplanting and reaching a maximum in tillering, decreasing slightly in booting, and recovering to a high level in the late heading period. The highest emissions were detected in tillering and late-heading stages, and the highest cumulative emissions of CO2 were detected in tillering, booting and maturity periods. CO2 in paddy fields mainly comes from plant and soil respiration [8]. In the green period, plant respiration is weak due to the limitation of biological factors, such as plant height and leaf area. In the tillering stage, the air temperature gradually increased, plants grew quickly, soil microbial activities were enhanced and root exudates production increased, providing suitable conditions for soil respiration. The rate of respiration could be the reason for decrease in booting, when the photosynthetic rate is low. During the mature period, litter provides favorable conditions for the transformation of soil organic matter, promoting soil respiration and gas emissions [44].

4.2. Effects of Irrigation Regimes on GHG Emissions

Soil moisture is one of the great significance indicators of soil properties during rice-growing seasons and has impacts on greenhouse gas emissions by changing soil permeability, microbial activity and Eh (soil redox potential) [45]. Water content did not change significantly in continuous flooding conditions; the water layer had a constant height of 3–5 cm. This level changed drastically in certain periods during the entire season in IF treatments.
CH4 emissions, showing a single peak pattern in all fields, were sensitive to irrigation regimes, and the annual cumulative CH4 fluxes in IF were approximately 23% lower than that of CF (Table 2). These results are consistent with records showing that intermittent irrigation management can reduce CH4 emissions [46,47]. Diffusion rates of O2 and CH4 and activities of methane-oxidizing bacteria are impressed by soil water content [47]. Intermittent irrigation provides better habitat for the growth of methanotroph (obligate aerobic bacteria), beneficial to bacterial reproduction [48], increasing CH4 oxidation capability relative to CF (Figure 4). The impact of water regime on CH4 emissions differs with rice-growing stages, and gas fluxes were more sensitive in booting, heading and mature stages, when soil water content changed considerably in the intermittent irrigation mode (Table 2).
N2O emissions under two water regimes were the same as in previous studies, except for the rapidly increased peaks [36,46]. The lowest peak value was noted in the heading stages under CF conditions, with no significance differences between CF and IF treatments (Table 2). Over rice-growing periods, three peaks came out instantly following nitrogen application, compliance with the fact that pulses of N2O emission are commonly induced by N fertilization addition [24]. With the application of booting fertilizer, the peaks in intermittent irrigation appeared much earlier than in CF conditions, mainly due to the gradual drainage of paddy fields at the late tillering period, promoting the synergistic effects of nitrification and denitrification. N fertilizer addition increased the concentration of substrate, thereby promoting the formation and discharge of gas. During heading stages denitrification (N2 to N2O) was impeded because of the relatively high floodwater depth (3–5 cm) under CF conditions, with high water content and strictly anaerobic conditions, lowering the release of N2O [49]. However, no significant differences between two water regimes were noticed over the entire rice-growing period (Table 2).
CO2 emissions were more likely influenced by water management, especially in the tillering, booting and heading stages (Table 2). CO2 emissions from flooding treatment are always lower than in intermittent irrigation treatment. During rice-growth stages, the paddy field is drained on occasion, supplying rice roots with sufficient oxygen and strengthening root respiration which can possibly promote the activity of aerobic microorganisms in the soil, decomposing soil organic matter [49]. CO2 from soil and plant root respiration can be more easily released into the atmosphere due to good soil permeability under IF treatments. In contrast, soil water content in long-term submerged paddy soil is higher, and the relatively anaerobic environment suppresses the aerobic activity of aerobic soil, decreasing soil respiration intensity and the production of CO2 gas. The flooded layer promotes the dissolution of CO2 hinders its diffusion into the atmosphere.

4.3. Impacts of N Fertilization Rate on Regulating GHG Emissions

Application of N fertilizer can promote crop growth and increase food production while affecting CH4 emissions. Three processes are involved in CH4 emissions from paddy soil, which can be influenced by nitrogen fertilizer addition, increase or decrease production, and consumption, and release gas at various ecosystems [42]. Application of N fertilizer could increase crop size and provide rich organic matter for methanogens, utilizing roots and root exudates as a carbon source [50]. In addition, researchers reported that the use of N fertilizer in paddy fields promoted the growth and activity of methanogens, promoting CH4 emissions [25,51,52]. In the present study, the total cumulative CH4 fluxes were encouraged by fertilizer additions; in contrast CH4 emissions were inhibited in N60 and N150 treatments during the booting stage, in contrast to some reports showing that lower N rates tend to increase CH4 emissions but higher N rates could potentially inhibit CH4 emissions [25]. The reason for the difference may be severe soil salinization, lower SOM content and high pH value [53].
Due to nitrification and denitrification processes, the emission of N2O from cropland was caused predominantly by nitrogenous fertilizers put on fields [54]. In the current research, the reaction substrate concentration was increased through urea application, promoting the emission of N2O [55,56]. As more N fertilizer was used, more cumulative N2O emissions were detected at each rice-growing stage. The positive effect is consistent with other reports [4,57,58].
It is reported by Burton et al., that CO2 was inhibited by N fertilizer application as the decreased activities of extracellular enzyme and depletion in fungal populations [59,60,61]. In contrast, the increased emissions of CO2 attributed to N fertilizer were caught by Iqbal et al. [62]. However, in the current study, the cumulative CO2 emissions had a positive correlation with N fertilizer rate; as more urea was added, more CO2 gas emitted. Nitrogen fertilizer increased the activity of roots, improved soil nutrient content, enhanced the biological activity in paddy soil, and promoted the mineralization of organic matter which increased soil respiration [63]. In addition, the carbon source and available nitrogen increased. The appropriate C/N ratio not only ensures soil microbial activities but also promotes the vigorous growth of rice plants, thereby enhancing the respiration of soil and plant populations, promoting CO2 emissions from paddy fields.

4.4. Relationships between GHG Emissions and Tillage Year

GHG emissions from two paddy fields showed similar trends, and the gas emissions from 57-year-old paddies were much higher; GWPs are always higher (1.4–1.8 times) than for the 1-year-old paddy field (Figure 4A,B, Table 2 and Table 3). In the current study, CH4 and CO2 emissions were significantly influenced by tillage year, and N2O by N fertilizer (Table 2, Figure 4).
Previous studies have reported that GHG can be easily affected by soil chemical-physical properties such as pH value, soil organic matter and salinity [14,38]. Microbial growth and activities are strongly influenced by pH. The optimum pH-value for methanogens is more than four and less than seven [64]. The pH was as high as 9.72 in the 1-year-old paddy, reducing methanogenic archaea and methanotroph bacteria, thus lowering CH4 and CO2 production. However, no significant differences in total N2O emissions from the paddy fields were caught, mainly being ascribable to the weak influences of pH on the nitrification and dentrification process [65].
It has reported that CH4 and CO2 were influenced by soil organic matters [66]. SOC also could be the reason why there were more greenhouse gas emissions in longtime tillage paddies [8]. The 57-year-old paddy had a long tillage history, planted rice for many years and accumulated more organic matter [18]. The soil was fertile and SOC content was five-fold higher than in the new tillage field, providing a superior growth environment for rice plants, root and soil microorganisms and more available organic carbon substrate for microorganism by root exudation and microbial decomposition (Table 1). Rice plants were tall and sturdy, and photosynthesis and respiration processes were stronger, transforming more oxide into soil for N2O and CO2 production [67]. Moreover, more gases escaped via rice tissue from paddies to atmosphere with the help of well-developed aerenchyma in roots, rhizomes and stems [62]. In addition, plant respiration may increase GHG emissions from 57-year-old paddies, where above-ground biomass was much higher.

5. Conclusions

We measured CH4, N2O and CO2 fluxes in saline—alkaline paddy fields with typical Chinese irrigation regimes, continuous flooding irrigation and intermittent flooding irrigation, and nitrogen fertilizer managements (N0, N60, N150 and N250). Relative to continuous flooding, intermittent irrigation reduced CH4 but promoted CO2, and had little effect on N2O emissions from rice paddy soils. The N fertilizer showed a positive effect on greenhouse gases compared to no N addition. The cumulative emissions of CH4, N2O and CO2 all increased with the supply of urea, with a maximum at the rate of 250 kg N ha−1. The fluxes in the 57-year-old paddy were higher than in the 1-year-old soil, with higher pH and lower SOC. Intermittent irrigation versus continuous flooding irrigation would mitigate the GWP of CH4 and N2O, and N fertilizer contributes to the GWP of net CH4, N2O and CO2 fluxes.

Acknowledgments

This study was supported by the National Natural Science Foundation of China (No. 51179073, 41471152) and Specialized Research Fund for Doctoral Program of Higher Education (20130061110065).

Author Contributions

J.T., J.W. and Z.L. drafted the manuscript and designed the experiments; J.W., S.W. and Y.Q. collected and tested the samples.

Conflicts of Interest

The authors declare no conflict of interest.

References

  1. Burney, J.A.; Davis, S.J.; Lobell, D.B. Greenhouse gas mitigation by agricultural intensification. Proc. Natl. Acad. Sci. USA 2010, 107, 12052–12057. [Google Scholar] [CrossRef] [PubMed]
  2. Linquist, B.; Van Groenigen, K.J.; Adviento-Borbe, M.A.; Pittelkow, C.; Van Kessel, C. An agronomic assessment of greenhouse gas emissions from major cereal crops. Glob. Chang. Biol. 2012, 18, 194–209. [Google Scholar] [CrossRef]
  3. Stocker, T.F.; Qin, D.; Plattner, G.-K.; Tignor, M.; Allen, S.K.; Boschung, J.; Nauels, A.; Xia, Y.; Bex, V.; Midgley, P.M. The Physical Science Basis. Contribution of Working Group I to the Fifth Assessment Report of the Intergovernmental Panel on Climate Change; Cambridge University Press: Cambridge, UK, 2013; ISBN 9781107661820. [Google Scholar]
  4. Yao, Z.; Zheng, X.; Dong, H.; Wang, R.; Mei, B.; Zhu, J. A 3-year record of N2O and CH4 emissions from a sandy loam paddy during rice seasons as affected by different nitrogen application rates. Agric. Ecosyst. Environ. 2012, 152, 1–9. [Google Scholar] [CrossRef]
  5. Serrano-Silva, N.; Sarria-Guzmán, Y.; Dendooven, L.; Luna-Guido, M. Methanogenesis and Methanotrophy in Soil: A Review. Pedosphere 2014, 24, 291–307. [Google Scholar] [CrossRef]
  6. Alley, R.B.; Berntsen, T.; Bindoff, N.L.; Chen, Z.; Chidthaisong, A.; Friedlingstein, P.; Gregory, J.M.; Hegerl, G.C.; Heimann, M.; Hewitson, B.; et al. The Physical Science Basis. Contribution of Working Group I to the Fourth Assessment Report of the Intergovernmental Panel on Climate Change; Cambridge University Press: Cambridge, UK, 2007; p. 18. ISBN 9291691216. [Google Scholar]
  7. Rowlings, D.W.; Grace, P.R.; Kiese, R.; Weier, K.L. Environmental factors controlling temporal and spatial variability in the soil-atmosphere exchange of CO2, CH4 and N2O from an Australian subtropical rainforest. Glob. Chang. Biol. 2012, 18, 726–738. [Google Scholar] [CrossRef]
  8. Ibrahim, M.; Cao, C.G.; Zhan, M.; Li, C.F.; Iqbal, J. Changes of CO2 emission and labile organic carbon as influenced by rice straw and different water regimes. Int. J. Environ. Sci. Technol. 2015, 12, 263–274. [Google Scholar] [CrossRef]
  9. Yang, P.; He, Q.; Huang, J.; Tong, C. Fluxes of greenhouse gases at two different aquaculture ponds in the coastal zone of southeastern China. Atmos. Environ. 2015, 115, 269–277. [Google Scholar] [CrossRef]
  10. Conrad, R. Microbiological and Biochemical Background of Production and Consumption of NO and N2O in Soil; Springer: Dordrecht, The Netherlands, 2002. [Google Scholar]
  11. Zheng, X.; Wang, M.; Wang, Y.; Shen, R.; Gou, J.; Li, J.; Jin, J.; Li, L. Impacts of soil moisture on nitrous oxide emission from croplands: A case study on the rice-based agro-ecosystem in Southeast China. Chemosphere Glob. Chang. Sci. 2000, 2, 207–224. [Google Scholar] [CrossRef]
  12. Bhowmik, A.; Cloutier, M.; Ball, E.; Bruns, M.A. Underexplored Microbial Metabolisms for Enhanced nutrient cycling in agricultural Soils. AIMS Microbiol. 2017, 3, 826–845. [Google Scholar] [CrossRef]
  13. Linn, D.M.; Doran, J.M. Effect of water filled pore space on carbon dioxide and nitrous oxide production in tilled and non-tilled soil. Soil Sc. Soc. Am. J. 1984, 48, 1267–1272. [Google Scholar] [CrossRef]
  14. Firestone, M.K.; Davidson, E.A. Microbiological basis of NO and N2O production and consumption in soil. In Exchange of Trace Gases between Terrestrial Ecosystems and the Atmosphere; Wiley: New York, NY, USA, 1989; Volume 47, pp. 7–21. [Google Scholar]
  15. Bhowmik, A.; Fortuna, A.M.; Cihacek, L.J.; Rahman, S.; Borhan, M.S.; Carr, P.M. Use of laboratory incubation techniques to estimate greenhouse gas footprints from conventional and no-tillage organic agroecosystems. Soil Biol. Biochem. 2017, 112, 204–215. [Google Scholar] [CrossRef]
  16. Liu, Y.; Jiang, W.L.; Xiao, B.L.; Lei, B. Observed climatic variations in the growing season of field crops in northeast China from 1992 to 2012. J. Integr. Agric. 2014, 13, 1451–1461. [Google Scholar] [CrossRef]
  17. Watanabe, A.; Machida, N.; Takahashi, K.; Kitamura, S.; Kimura, M.T. Flow of photosynthesized carbon from rice plants into the paddy soil ecosystem at different stages of rice growth. Plant Soil 2004, 258, 151–160. [Google Scholar] [CrossRef]
  18. Kögel-Knabner, I.; Amelung, W.; Cao, Z.; Fiedler, S.; Frenzel, P.; Jahn, R.; Kalbitz, K.; Kölbl, A.; Schloter, M. Biogeochemistry of paddy soils. Geoderma 2010, 157, 1–14. [Google Scholar] [CrossRef]
  19. Corton, T.M.; Bajita, J.B.; Grospe, F.S.; Pamplona, R.R.; Assis, J.A.; Wassmann, R.; Lantin, R.S.; Buendia, L.V. Methane emission from irrigated and intensively managed rice fields in Central Luzon (Philippines). Nutr. Cycl. Agroecosyst. 2000, 58, 37–53. [Google Scholar] [CrossRef]
  20. Yan, X.; Yagi, K.; Akiyama, H.; Akimoto, H. Statistical analysis of the major variables controlling methane emission from rice fields. Glob. Chang. Biol. 2005, 11, 1131–1141. [Google Scholar] [CrossRef]
  21. Li, X.; Yuan, W.; Xu, H.; Cai, Z.; Yagi, K. Effect of timing and duration of midseason aeration on CH4 and N2O emissions from irrigated lowland rice paddies in China. Nutr. Cycl. Agroecosyst. 2011, 91, 293–305. [Google Scholar] [CrossRef]
  22. Wang, W.J.; Reeves, S.H.; Salter, B.; Moody, P.W.; Dalal, R.C. Effects of urea formulations, application rates and crop residue retention on N2O emissions from sugarcane fields in Australia. Agric. Ecosyst. Environ. 2016, 216, 137–146. [Google Scholar] [CrossRef]
  23. Zhu, Z.; Xiong, Z.; Xing, G. Impacts of population growth and economic development on the nitrogen cycle in Asia. Sci. China Ser. C Life Sci. 2005, 48 (Suppl. 2), 729–737. [Google Scholar]
  24. Snyder, C.S.; Bruulsema, T.W.; Jensen, T.L.; Fixen, P.E. Review of greenhouse gas emissions from crop production systems and fertilizer management effects. Agric. Ecosyst. Environ. 2009, 133, 247–266. [Google Scholar] [CrossRef]
  25. Linquist, B.A.; Adviento-Borbe, M.A.; Pittelkow, C.M.; van Kessel, C.; van Groenigen, K.J. Fertilizer management practices and greenhouse gas emissions from rice systems: A quantitative review and analysis. Field Crops Res. 2012, 135, 10–21. [Google Scholar] [CrossRef]
  26. Zheng, X.; Han, S.; Huang, Y.; Wang, Y.; Wang, M. Re-quantifying the emission factors based on field measurements and estimating the direct N2O emission from Chinese croplands. Glob. Biogeochem. Cycles 2004, 18, 1–19. [Google Scholar] [CrossRef]
  27. Cheng-Fang, L.; Dan-Na, Z.; Zhi-Kui, K.; Zhi-Sheng, Z.; Jin-Ping, W.; Ming-Li, C.; Cou-Gui, C. Effects of tillage and nitrogen fertilizers on CH4 and CO2 emissions and soil organic carbon in paddy fields of central China. PLoS ONE 2012, 7, e34642. [Google Scholar] [CrossRef] [PubMed]
  28. Zhang, X.; Yin, S.; Li, Y.; Zhuang, H.; Li, C.; Liu, C. Comparison of greenhouse gas emissions from rice paddy fields under different nitrogen fertilization loads in Chongming Island, Eastern China. Sci. Total Environ. 2014, 472, 381–388. [Google Scholar] [CrossRef] [PubMed]
  29. Zhong, Y.; Wang, X.; Yang, J.; Zhao, X.; Ye, X. Exploring a suitable nitrogen fertilizer rate to reduce greenhouse gas emissions and ensure rice yields in paddy fields. Sci. Total Environ. 2016, 565, 420–426. [Google Scholar] [CrossRef] [PubMed]
  30. Banger, K.; Tian, H.Q.; Lu, C.Q. Do nitrogen fertilizers stimulate or inhibit methane emissions from rice fields? Glob. Chang. Biol. 2012, 18, 3259–3267. [Google Scholar] [CrossRef] [PubMed]
  31. Cai, Z.C.; Tsuruta, H.; Minami, K. Methane emission from rice fields in China: Measurements and influencing factors. Journal of Geophysical Research Atmospheres. 2000, 105, 231–242. [Google Scholar] [CrossRef]
  32. Tang, X.; Liu, S.; Zhou, G.; Zhang, D.; Zhou, C. Soil-atmospheric exchange of CO2, CH4, and N2O in three subtropical forest ecosystems in southern China. Glob. Chang. Biol. 2006, 12, 546–560. [Google Scholar] [CrossRef]
  33. Liu, H.; Zhao, P.; Lu, P.; Wang, Y.S.; Lin, Y.B.; Rao, X.Q. Greenhouse gas fluxes from soils of different land-use types in a hilly area of South China. Agric. Ecosyst. Environ. 2008, 124, 125–135. [Google Scholar] [CrossRef]
  34. Shrivastava, P.; Kumar, R. Soil salinity: A serious environmental issue and plant growth promoting bacteria as one of the tools for its alleviation. Saudi J. Biol. Sci. 2015, 22, 123–131. [Google Scholar] [CrossRef] [PubMed]
  35. China Meteorological Data Service Center (CMDC). Data of Monthly Temperature and Precipitation (2012–2013). Available online: http://data.cma.cn/en (accessed on 25 January 2018).
  36. Liu, S.; Zhang, L.; Jiang, J.; Chen, N.; Yang, X.; Xiong, Z.; Zou, J. Methane and nitrous oxide emissions from rice seedling nurseries under flooding and moist irrigation regimes in Southeast China. Sci. Total Environ. 2012, 426, 166–171. [Google Scholar] [CrossRef] [PubMed]
  37. Wang, W.; Dalal, R.C.; Reeves, S.H.; Butterbach-Bahl, K.; Kiese, R. Greenhouse gas fluxes from an Australian subtropical cropland under long-term contrasting management regimes. Glob. Chang. Biol. 2011, 17, 3089–3101. [Google Scholar] [CrossRef]
  38. Andersen, J.M. An ignition method for determination of total phosphorus in lake sediments. Water Res. 1976, 10, 329–331. [Google Scholar] [CrossRef]
  39. Adviento-Borbe, M.A.A.; Linquist, B. Assessing fertilizer N placement on CH4 and N2O emissions in irrigated rice systems. Geoderma 2016, 266, 40–45. [Google Scholar] [CrossRef]
  40. Nigussie, A.; Bruun, S.; Kuyper, T.W.; de Neergaard, A. Delayed addition of nitrogen-rich substrates during composting of municipal waste: Effects on nitrogen loss, greenhouse gas emissions and compost stability. Chemosphere 2017, 166, 352–362. [Google Scholar] [CrossRef] [PubMed]
  41. Nishimura, S.; Yonemura, S.; Minamikawa, K.; Yagi, K. Seasonal and diurnal variations in net CO2 flux throughout the year from soil in paddy field. J. Geophys. Res. Biogeosci. Res. 2014, 120, 63–76. [Google Scholar]
  42. Wassmann, R.; Aulakh, M.S. The role of rice plants in regulating mechanisms of methane missions. Biol. Fertil. Soils 2000, 31, 20–29. [Google Scholar] [CrossRef]
  43. Guo, J.; Zhou, C. Greenhouse gas emissions and mitigation measures in Chinese agroecosystems. Agric. For. Meteorol. 2007, 142, 270–277. [Google Scholar] [CrossRef]
  44. Trumbore, S. Age of soil organic matter and soil respiration: Radiocarbon constraints on belowground C dynamics. Ecol. Appl. 2000, 10, 399–411. [Google Scholar] [CrossRef]
  45. Sanz-Cobena, A.; Lassaletta, L.; Aguilera, E.; del Prado, A.; Garnier, J.; Billen, G.; Iglesias, A.; Sánchez, B.; Guardia, G.; Abalos, D.; et al. Strategies for greenhouse gas emissions mitigation in Mediterranean agriculture: A review. Agric. Ecosyst. Environ. 2017, 238, 5–24. [Google Scholar] [CrossRef]
  46. Yue, J.; Shi, Y.; Liang, W.; Wu, J.; Wang, C.; Huang, G. Methane and nitrous oxide emissions from rice field and related microorganism in black soil, northeastern China. Nutr. Cycl. Agroecosyst. 2005, 73, 293–301. [Google Scholar] [CrossRef]
  47. Zhang, G.; Ji, Y.; Ma, J.; Xu, H.; Cai, Z.; Yagi, K. Intermittent irrigation changes production, oxidation, and emission of CH 4 in paddy fields determined with stable carbon isotope technique. Soil Biol. Biochem. 2012, 52, 108–116. [Google Scholar] [CrossRef]
  48. Gilbert, B.; Frenzel, P. Methanotrophic bacteria in the rhizosphere of rice microcosms and their effect on porewater methane concentration and methane emission. Biol. Fertil. Soils 1995, 20, 93–100. [Google Scholar] [CrossRef]
  49. Zou, J.; Huang, Y.; Zheng, X.; Wang, Y. Quantifying direct N2O emissions in paddy fields during rice growing season in mainland China: Dependence on water regime. Atmos. Environ. 2007, 41, 8030–8042. [Google Scholar] [CrossRef]
  50. Schimel, J. Global change: Rice, microbes and methane. Nature 2000, 403, 375–377. [Google Scholar] [CrossRef] [PubMed]
  51. Bodelier, P.L.E.; Laanbroek, H.J. Nitrogen as a regulatory factor of methane oxidation in soils and sediments. FEMS Microbiol. Ecol. 2004, 47, 265–277. [Google Scholar] [CrossRef]
  52. Cai, Z.; Shan, Y.; Xu, H. Effects of nitrogen fertilization on CH4 emissions from rice fields. In Soil Science and Plant Nutrition; Taylor and Francis: Tokyo, Japan, 2007; Volume 53, pp. 353–361. [Google Scholar]
  53. Wang, W.; Lai, D.Y.F.; Wang, C.; Tong, C.; Zeng, C. Effects of inorganic amendments, rice cultivars and cultivation methods on greenhouse gas emissions and rice productivity in a subtropical paddy field. Ecol. Eng. 2016, 95, 770–778. [Google Scholar] [CrossRef]
  54. Akiyama, H.; Tsuruta, H. Nitrous oxide, nitric oxide, and nitrogen dioxide fluxes from soils after manure and urea application. J. Environ. Qual. 2003, 32, 423–431. [Google Scholar] [CrossRef] [PubMed]
  55. Dobbie, K.E.; McTaggart, I.P.; Smith, K.A. Nitrous oxide emissions from intensive agricultural systems: Variations between crops and seasons, key driving variables, and mean emission factors. J. Geophys. Res. Atmos. 1999, 104, 26891–26899. [Google Scholar] [CrossRef]
  56. Yao, Z.; Zhou, Z.; Zheng, X.; Xie, B.; Mei, B.; Wang, R.; Butterbach-Bahl, K.; Zhu, J. Effects of organic matter incorporation on nitrous oxide emissions from rice-wheat rotation ecosystems in China. Plant Soil 2010, 327, 315–330. [Google Scholar] [CrossRef]
  57. Ma, J.; Li, X.L.; Xu, H.; Han, Y.; Cai, Z.C.; Yagi, K. Effects of nitrogen fertiliser and wheat straw application on CH4 and N2O emissions from a paddy rice field. Aust. J. Soil Res. 2007, 45, 359–367. [Google Scholar] [CrossRef]
  58. Zou, J.; Huang, Y.; Jiang, J.; Zheng, X.; Sass, R.L. A 3-year field measurement of methane and nitrous oxide emissions from rice paddies in China: Effects of water regime, crop residue, and fertilizer application. Glob. Biogeochem. Cycles 2005, 19, 1–9. [Google Scholar] [CrossRef]
  59. Burton, A.J.; Pregitzer, K.S.; Crawford, J.N.; Zogg, G.P.; Zak, D.R. Simulated chronic NO-3 deposition reduces soil respiration in northern hardwood forests. Glob. Chang. Biol. 2004, 10, 1080–1091. [Google Scholar] [CrossRef]
  60. DeForest, J.L.; Zak, D.R.; Pregitzer, K.S.; Burton, A.J. Atmospheric Nitrate Deposition, Microbial Community Composition, and Enzyme Activity in Northern Hardwood Forests. Soil Sci. Soc. Am. J. 2004, 68, 132. [Google Scholar] [CrossRef]
  61. Wilson, H.M.; Al-Kaisi, M.M. Crop rotation and nitrogen fertilization effect on soil CO2 emissions in central Iowa. Appl. Soil Ecol. 2008, 39, 264–270. [Google Scholar] [CrossRef]
  62. Iqbal, J.; Hu, R.; Lin, S.; Hatano, R.; Feng, M.; Lu, L.; Ahamadou, B.; Du, L. CO2 emission in a subtropical red paddy soil (Ultisol) as affected by straw and N-fertilizer applications: A case study in Southern China. Agric. Ecosyst. Environ. 2009, 131, 292–302. [Google Scholar] [CrossRef]
  63. Allen, A.S.; Schlesinger, W.H. Nutrient limitations to soil microbial biomass and activity in loblolly pine forests. Soil Biol. Biochem. 2004, 36, 581–589. [Google Scholar] [CrossRef]
  64. Oertel, C.; Matschullat, J.; Zurba, K.; Zimmermann, F.; Erasmi, S. Greenhouse gas emissions from soils—A review. Chem. Erde Geochem. 2016, 76, 327–352. [Google Scholar] [CrossRef]
  65. Pilegaard, K.; Skiba, U.; Ambus, P.; Beier, C.; Bruggemann, N.; Butterbach-Bahl, K.; Dick, J.; Dorsey, J.; Duyzer, J.; Gallagher, M.; et al. Factors controlling regional differences in forest soil emission of nitrogen oxides (NO and N2O). Biogeosciences 2006, 3, 651–661. [Google Scholar] [CrossRef]
  66. Tang, J.; Liang, S.; Li, Z.; Zhang, H.; Wang, S.; Zhang, N. Emission laws and influence factors of greenhouse gases in Saline-Alkali paddy fields. Sustainability 2016, 8, 163. [Google Scholar] [CrossRef]
  67. Wassmann, R.; Lantin, R.S.; Neue, H.U.; Buendia, L.V.; Corton, T.M.; Lu, Y. Characterization of methane emissions from rice fields in Asia. III. Mitigation options and future research needs. Nutr. Cycl. Agroecosyst. 2000, 58, 23–36. [Google Scholar] [CrossRef]
Figure 1. Location of Jilin province in China and Qianguo in Jilin province.
Sustainability 10 00475 g001
Figure 2. Monthly mean precipitation and air temperature during the rice-growing period from 2012 to 2013.
Sustainability 10 00475 g002
Figure 3. Structure of static chamber monitored greenhouse gas (GHG) fluxes in paddy fields.
Sustainability 10 00475 g003
Figure 4. Seasonal variations in GHG (CH4, N2O and CO2) fluxes from two paddies, i.e., 1st tillage (1-year-old) and 57th tillage (57-year-old), with different irrigation treatments: Continuous flooding irrigation and intermittent irrigation. Error bars denote standard deviation. The vertical arrows indicate N fertilizer application except for the base fertilization before transplant of seedlings.
Sustainability 10 00475 g004
Figure 5. Cumulative GHG (CH4, N2O and CO2) emissions from two paddies affected by different N fertilizer treatments over five growing stages. Capital letters over the bars showed significant differences among different N fertilizer rates (kg N ha−1), whereas lowercase letters indicate differences between 1-year-old and 57-year-old paddies.
Sustainability 10 00475 g005
Table 1. Physical-chemical characteristics of study soil (0–20 cm).
Tillage YearBD (g cm−3) 1pHEC (ms cm−1)SOC (g kg−1)TN (g kg−1)TP (g kg−1)ESP (%)
11.32 ± 0.25 29.72 ± 0.431.27 ± 0.384.29 ± 1.030.78 ± 0.210.57 ± 0.1417.11 ± 0.22
571.26 ± 0.278.31 ± 0.290.31 ± 0.1123.06 ± 2.152.24 ± 0.651.14 ± 0.226.35 ± 0.75
1 BD: Bulk density; EC: Electric conductivity; SOC: Soil organic carbon; TN: Total nitrogen; TP: Total phosphorus; ESP: Exchangeable sodium percentage; 2 Mean Value ± Standard Error.
Table 2. Cumulative emission of GHG from continuous flooding irrigation (CF) and intermittent flooding irrigation (IF) of two tillage paddies during rice-growing seasons (n = 3).
Growing Period1-Year57-YearAnalysis of Variance
CFIFCFIFTillage Year (Y)Irrigation Regime (I)Y × I
CH4 (gm−2)Green0.13 ± 0.01 20.13 ± 0.010.22 ± 0.030.22 ± 0.06** 1NSNS
Tillering0.61 ± 0.120.71 ± 0.134.37 ± 0.864.92 ± 1.43**NSNS
Booting1.79 ± 0.011.49 ± 0.0716.11 ± 0.5214.21 ± 0.64****
Heading0.65 ± 0.130.45 ± 0.039.39 ± 0.345.36 ± 0.53******
Mature0.33 ± 0.040.23 ± 0.021.83 ± 0.880.51 ± 0.04******
Total3.51 ± 0.053.01 ± 0.1132.34 ± 0.5925.18 ± 2.46******
N2O (gm−2)Green0.03 ± 0.010.03 ± 0.010.03 ± 0.010.03 ± 0.01NSNSNS
Tillering0.06 ± 0.010.07 ± 0.020.05 ± 0.010.07 ± 0.01NSNSNS
Booting0.07 ± 0.020.05 ± 0.010.07 ± 0.010.05 ± 0.01NSNSNS
Heading0.05 ± 0.020.07 ± 0.020.04 ± 0.010.07 ± 0.01NSNSNS
Mature0.02 ± 0.010.04 ± 0.010.02 ± 0.010.03 ± 0.01NS**NS
Total0.23 ± 0.020.29 ± 0.060.20 ± 0.010.24 ± 0.01NSNSNS
CO2 (gm−2)Green40.57 ± 5.3346.52 ± 12.2987.21 ± 13.15104.56 ± 19.13**NSNS
Tillering462.95 ± 28.44620.59 ± 26.18589.50 ± 16.64758.85 ± 50.11****NS
Booting401.56 ± 9.69542.02 ± 21.13451.77 ± 31.36677.22 ± 41.13****NS
Heading352.58 ± 2.52472.28 ± 49.10389.41 ± 36.65532.34 ± 41.04NS**NS
Mature489.12 ± 51.77552.68 ± 72.04465.76 ± 13.41576.59 ± 81.05NSNSNS
Total1746.77 ± 111.232224.09 ± 215.902120.15 ± 285.092649.55 ± 112.36****NS
1 * indicates p < 0.05; ** indicates p < 0.01, NS indicates not significant; 2 Mean Value ± Standard Error.
Table 3. Area-scaled GWP (global warming potential, g CO2-eqm−2) under different water regimes, continuous flooding (CF) and intermittent irrigation (IF), and N fertilization application rates over entire rice-growing season.
TreatmentArea-Scaled GWP (CH4 + N2O, g CO2-eq m−2)Area-Scaled GWP (CH4 + N2O + CO2, g CO2-eq m−2)
1-year-old57-year-old1-year-old57-year-old
Water RegimeCF678 ± 26 11112 ± 182516 ± 263630 ± 138
IF546 ± 23.56916 ± 802813 ± 234271 ± 241
Nitrogen applicationN0515 ± 74a737 ± 41a2130 ± 62b3003 ± 125c
N60515 ± 88a907 ± 76a2420 ± 192b3789 ± 256b
N150551 ± 58a923 ± 99a2669 ± 271ab4332 ± 220ab
N250637 ± 43a974 ± 132a3252 ± 353a4549 ± 296a
1 Mean Value ± Standard Error. Different lowercase letters indicate significantly different at significance level of p < 0.05 among four N fertilization application rates.

