Abstract
With the development of the diversified economic union, the power grid enterprises’ auxiliary industries are continuing to grow and develop faster. However, in the process of development, power grid enterprises are still faced with the problem of low efficiency of the management of main and auxiliary and resource allocation and utilization. Thus, the synergistic development evaluation for power grid enterprises’ main and auxiliary industries has a strong practical significance. It can help the managers to find the short board of each industry and search for the exploration direction for improvement to promote the sustainable development of the main and auxiliary industries comprehensively. It can also provide the reference for improving the management level of power grid enterprises. Information fusion technology, as a process of information processing for decision making, can make use of multi-source information synergistically to get a more objective and more essential understanding of the same thing or the same goal. It has been applied to many fields in a mature way. Based on the characteristics of each industry, this paper constructs a synergistic effect evaluation index system of the main and auxiliary industries from the aspects of management foundation, resource integration, operational efficiency and effectiveness. The variable precision fuzzy rough set (VPFRS) is introduced to screen the index system, eliminate redundant indexes, retain key indexes and improve the efficiency and accuracy of evaluation effectively. Meanwhile, based on the characteristic of dealing with the imprecise problem of the vague set, this paper establishes the evaluation model based on information fusion technology of the variable precision fuzzy rough set and vague set (VPFRS-Vague). In order to verify the validity of the model, five typical companies belonging to power grid enterprises are selected as examples for analysis to prove the validity and applicability of the evaluation method.
1. Introduction
In the early 1980s, China’s enterprise groups began to develop gradually towards the lateral economic association of enterprises [1,2]. In recent years, with the rapid economic growth, as a special economic union, the enterprise groups have been developing rapidly and playing an increasingly important role in the national economy [3,4,5]. Among them, the power grid enterprise, as an important energy state-owned enterprise, has the characteristics of a large scale and diversified operation. It has made great contributions to the adjustment of industrial structure and the promotion of economic benefits and plays an important role in the process of industrial internationalization [6,7]. The coordinated and orderly development of power grid enterprise’s main and auxiliary industries is conducive to exerting the scale benefit and the overall benefit of enterprise group and promoting the sustainable development of the main and auxiliary industries. The power grid enterprise’s main and auxiliary industries cover scientific research, electrical equipment manufacturing, logistics and many other fields. With the development of auxiliary units and continuous improvement of group management systems, the power enterprise’s growth and development is facing new difficulties and challenges. Finding the main obstacle factors for synergistic development and putting forward the solving measures are conducive for the auxiliary units to better integrate into the group management system and improve the level of collaborative development [8,9].
Strengthening the synergistic development level of main and auxiliary industries is an important way to improve the competitiveness and sustainable development capacity of China’s power grid enterprise. However, the power grid enterprise is often lacking understanding and research on enterprise synergistic development theory and has not yet established effective evaluation mechanisms for the synergistic development. It has influenced the operation efficiency to a certain extent and is not conducive for the rapid, steady and sustainable development of the power grid enterprise [10].
Recently, domestic and foreign scholars have done some research on evaluation for enterprise collaborative effects. Studies [11,12] construct synergistic effect evaluation index system from strategy, culture, human resource, supply chain and finance and use Analytic Hierarchy Process (AHP) to evaluate the synergistic effect. Literature [13] makes a comprehensive investigation of enterprise groups from five aspects of operating synergy, management synergy, intangible assets synergy, financial synergy and human resource synergy and determines the interval index value subjectively to build synergetic effect comprehensive evaluation model. Literature [14] uses the grey correlation degree to evaluate the synergistic effect of enterprises. However, because of numerous indexes, evaluation results of discrimination are not strong. Literature [15] uses fuzzy comprehensive evaluation for the synergistic effect on strategic alliance, but it neglects a part of fuzzy information.
The existing research results do not aim at the evaluation of the synergistic effect for the power grid enterprise, which lacks pertinence. The numerous evaluation indexes have the defect of overlapping, redundant information and inferior independence, which cannot reflect the synergic effect. In addition, the dominant evaluation model is focused on expert scoring and fuzzy theory methods to construct evaluation model. However, the expert scoring method often leads to poor adaptability and generalization. Additionally, with the fuzzy theory, it is easy to lose the fuzzy information in the process of quantification index. It may cause distortion of the evaluation result and lack science and innovation.
Information fusion technology was formed with the development of radar information processing and command automation system and it was first reflected in the sonar signal understanding system developed by the US Department of Defense in 1973. It is a comprehensive information processing method and technology for synergistically making use of multi-source information to get a more objective and essential understanding of the same thing or goal, which is a decision-making process in itself [16]. At present, information fusion technology has a mature application in the military, medical image processing, system simulation and other fields [17,18,19,20,21]. As a representative of non-probabilistic information fusion, rough sets [22,23,24,25] and vague sets [26,27,28,29] have been widely used in the prediction, evaluation and other fields.
The main idea of the rough set is to deduce the decision rules by knowledge reduction under the premise of keeping the classification ability unchanged. It is a mathematical tool for dealing with fuzziness and uncertain data [25]. Literature [30] identifies and detects an anomaly point using the rough set theory. Literature [31] uses the rough set for data clustering and computes complexity and clustering purity to obtain the high purity of final classification results. Literature [24,25] combine fuzzy theory with rough set theory and use the fuzzy rough set theory for the index reduction and weight distribution. The vague set is a multiple valued logic. It is the extension of fuzzy sets and can fully consider the positive, negative and unknown information. Vague set theory can directly add the uncertainty to reasoning process. It is closer to a human thinking mode. Vague set theory has a wide application in the field of information fusion, fuzzy decision-making and so on [27]. When the vague set theory is applied to deal with the fuzzy multiple attribute decision problems, it represents the property index of candidate solutions. The score function is constructed to express the degree of the decision-maker’s satisfaction of the project. In general, the greater the score function is, the more the project meets the decision-makers’ requirements. The best project can be selected from it. In the intelligent fields, in order to carry out the decision more effectively, some scholars have improved on the basis of the vague set. Literature [32,33] organically combine the vague set and soft set to form a fuzzy decision-making method based on the vague–soft relationship. Literature [34] presents the project decision-making evaluation method based on vague set. Literature [35] extends the vague set and studies the similarity between the two possible intervals of the fuzzy vague set.
In view of this, this paper studies the synergistic effect evaluation of the power grid enterprise’s main and auxiliary industries development. The results are helpful for the power grid enterprise to master the status of each auxiliary industry and manage and improve them purposefully. This paper makes full use of basic research on synergistic effect evaluation of general enterprise groups and constructs a systemic evaluation index system from the angle of management foundation, integration of resources, operational efficiency and benefit contribution. In addition, the variable precision fuzzy rough set (VPFRS) is used to screen the index system, eliminate redundant indexes and retain key indexes. Vague set theory is applied to the assessment. In light of the deficiency of the unclear vague value and the same score function value, the fuzzy value is introduced in this paper. The evaluation method of vague sets based on the fuzzy linear order method is constructed for the synergistic effect on power grid enterprises. In this paper, five typical companies are selected to carry out empirical analysis to verify the applicability of the model. In the empirical analysis, the index system is summarized through literature summary, and index system is reduced through field research and interviews. At the same time, the specific data of quantitative indexes are obtained, and the scoring of qualitative indexes is obtained through the Delphi method. The results show that the improved model in this paper improves the efficiency of evaluation and obtains higher accuracy results. It has clear significance for the management of power grid enterprises.
According to the above ideas, the main contents of this paper are as follows: Section 1 reviews and summarizes the development status of the main and auxiliary power grid and proposes the research methods and contents of this paper; Section 2 outlines the basic theory of the variable precision fuzzy rough set and vague set and describes the principle of the methods; Section 3 introduces the optimization method of the variable precision fuzzy rough set and vague set (VPFRS-Vague) and establishes the calculation process of the VPFRS-Vague method; Section 4 reports our experiments and relevant discussion; Concluding remarks are presented in Section 5.
2. Basic Theory and Method
2.1. Variable Precision Fuzzy Rough Set (VPFRS)
(1) Rough Sets and Fuzzy Rough Sets
Classical rough set theory [36] is a mathematical analysis tool proposed by Polish mathematician Z. Pawlak. It is mainly used for handling uncertain and incomplete information. It has been widely used in knowledge acquisition, attribute reduction, pattern recognition and many other fields. Among them, attribute reduction is one of the most important subjects in rough set theory [37]. It maintains the ability of information systems classification unchanged. The theory is applied to deal with clear and discrete attribute values. For the continuous attribute values, we must firstly manipulate and process the discretization, which may cause different degrees of information loss. Based on clearing equivalence relations, only attribute values with a precise equivalence relation between different objects can constitute an equivalence class. However, in practical applications, people’s knowledge or concepts are generally ambiguous.
Therefore, taking people’s fuzzy awareness of knowledge and information loss arising from the process of discretization into account, many scholars have focused on the introduction of fuzzy set theory [38] into rough set. They replace equivalence relations of the classical rough set with fuzzy similar relations for classification, which can deal with fuzzy and continuous attributes effectively, and preserve the information of original data to the greatest extent [39].
(2) Variable Precision Rough Set
The fuzzy rough set is easily influenced by noise data. While the variable precision rough set model (VPFRS) [40] proposed by Ziarko introduces the concept of correct classification rate β to effectively overcome misclassification problems arising from the noise data or human errors.
Based on the above analysis, to improve the model’s ability to adapt to noisy data, this paper integrates fuzzy rough sets and variable precision rough sets. The real value attributes are blurred by constructing the membership function and transformed into the corresponding fuzzy membership degree. The object is classified by the fuzzy similarity relation, and the method of index reduction based on VPFRS information fusion technology is formed. The related definitions are as follows.
Assuming that information system , are a non-empty and finite object set; is a non-empty and finite attribute set; is an attribute value, and for , is the range of attribute . The property value of object under the condition attribute is ; is an information function, which means that, for each and , there is .
Definition 1.
For any object , its fuzzy value of a certain attribute is ; For and , the fuzzy similarity relation is defined as follows:
where, is defined as the similarity between object and object .
Definition 2.
All the object sets, which are fuzzily similar to , are known as fuzzy similar class . They constitute a fuzzy set on the domain. can be expressed as follows.
Definition 3.
In the fuzzy similar relation R, the definition of fuzzy membership between object and object is described as follows.
Definition 4.
For the fuzzy similar relation , which is in and U, we respectively define as the lower approximation set and upper approximation set of variable precision of rough set with the given threshold .
where is the number of elements in the set, which is also called the radix of the set. upper approximation set is also known as positive domain of , which is denoted as .
Definition 5.
Assuming that, for any attribute subset , determines a binary in distinguishable relationship . , called a knowledge of , is a division of . Each of the equivalent classes is called 1 knowledge particle. Divide all indicator attributes into , and the classification after deleting some indicator attributes is knowledge R.
Definition 6.
is a partition of , and this classification is independent from the knowledge . lower approximation set and upper approximation set are as follows.
Definition 7.
Assuming that , is the division of all attributes and . We can define the approximation classified quality as follows.
According to the Equation (8), we know that, relative to itself, the approximation classification quality, generated from classification of all indexes, is 1. To keep the same classification of all attributes, the approximation classified quality of reduced attributes set also must be 1. Therefore, in the case of , we can cut attributes gradually until the removal of any attribute can give rise to in the reduced set. In this case, we stop the calculation. The reduced set is the minimal attribute set of the information system, and it cannot be reduced any more.
Definition 8.
Assuming that the information system is and is the division of all attributes, the attribute significance of attribute is defined as follows.
The weight of each index can be processed by normalization of attribute significances.
2.2.Vague Sets
Gau and Buehrer first put forward the vague set theory in 1993. Based on fuzzy sets, vague set theory gives full consideration of the positive, negative and neutral aspect of information. It more conforms to people’s thinking, and has been effectively applied in multi-objective decision-making and comprehensive evaluation fields [41].
Assuming that, is a theory domain. A vague set of is expressed by the membership functions and , satisfying the following constraints:
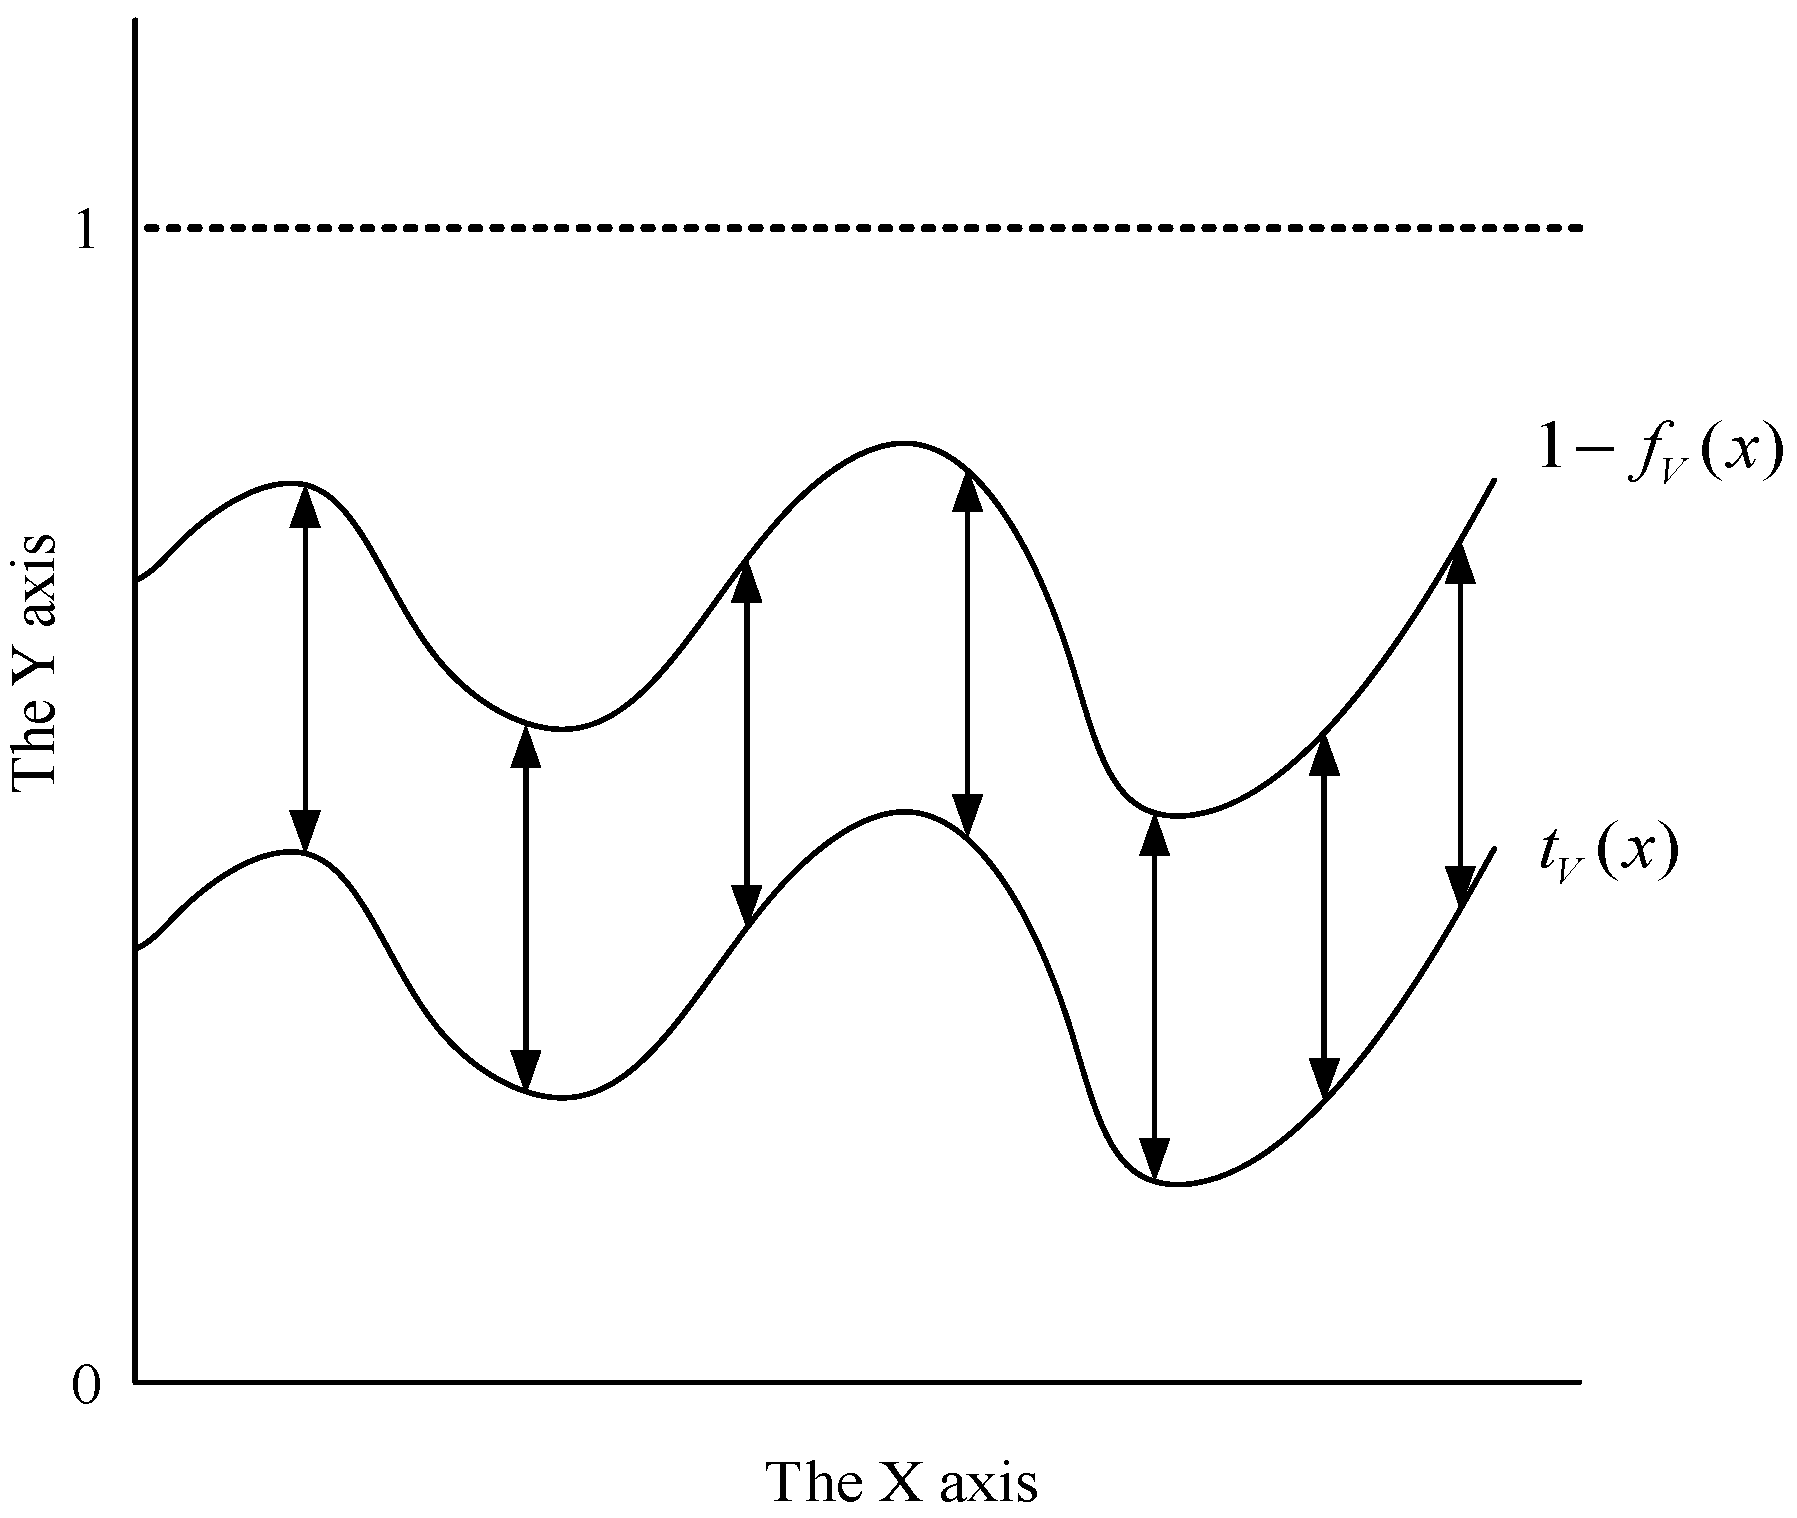
where, is called the true membership function of vague set , expressing the necessary degree of supporting evidence for ; is called the false membership function of vague set , expressing the necessary degree of opposing evidence for ; means the possible degree of supporting evidence for ; If is the vague degree of relative to the vague set , then, it means the degree of hesitation of relative to the vague set . It is a measure of the unknown information of relative to . The greater the value, the more unknown information relative to , as shown in Figure 1 [42].
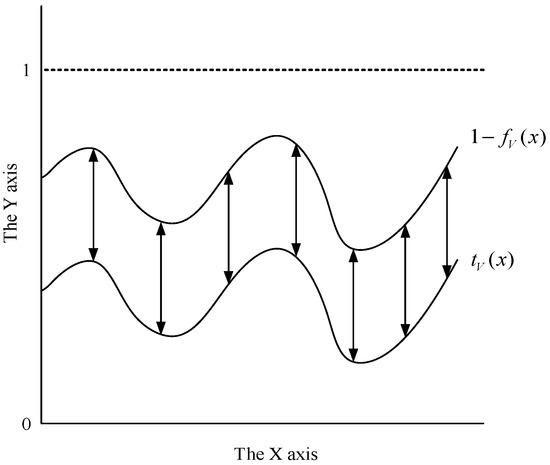
Figure 1.
Diagram of vague sets.
Assuming that is a vague set, can be expressed as follows when is discrete.
When is continuous, can be expressed as follows.
In the voting model, when candidate has seven votes in favor, three against and five abstentions and candidate has six votes in favor, zero against and nine abstentions, in this case, which one should be voted? So does the synergistic evaluation of main and auxiliary industries in power grid enterprises. For example, if there is a certain unit performs moderately in all aspects, while another unit is particularly excellent in some indexes but very poor in other indexes, then, it will be difficult to make an objective evaluation under this circumstance. Luckily, the vague set theory can help us solve this kind of decision-making problems effectively. Therefore, compared with fuzzy sets, vague sets can be more natural and effective to describe imprecise data in many cases.
3. Synergistic Evaluation Model Based on the Improved VPFRS-Vague Sets
Synergistic effect evaluation of power grid enterprises involves many factors, which brings many inevitable issues of over lapping indexes, information redundancy and so on. All those will affect the efficiency of the evaluation work and the accuracy of the evaluation results. Additionally, the rough set can reduce indexes effectively on the basis of retaining critical information.
In addition, most of the synergistic evaluation indexes of power grid enterprises are qualitative. We will usually encounter some fuzzy factors and uncertain information in the evaluation process [43]. On the one hand, it is difficult for evaluators to express their preferences and judgments exactly; on the other hand, the traditional comprehensive evaluation methods cannot express this kind of information. As a result, the evaluation work will run into difficulties. As the nature of the synergistic evaluation is a multi-attribute decision-making problem, this paper tries to apply the vague set theory of information fusion technique to the synergistic evaluation work.
Currently, the vague set theory uses scoring function methods and similarity measure methods to solve decision-making problems. However, the problem often emerges that the selection of vague values is not clear and the score function is the same. To avoid these weaknesses, this paper selects the fuzzy value linear sequence method based on the vague set [34] to evaluate the reduced indicator system.
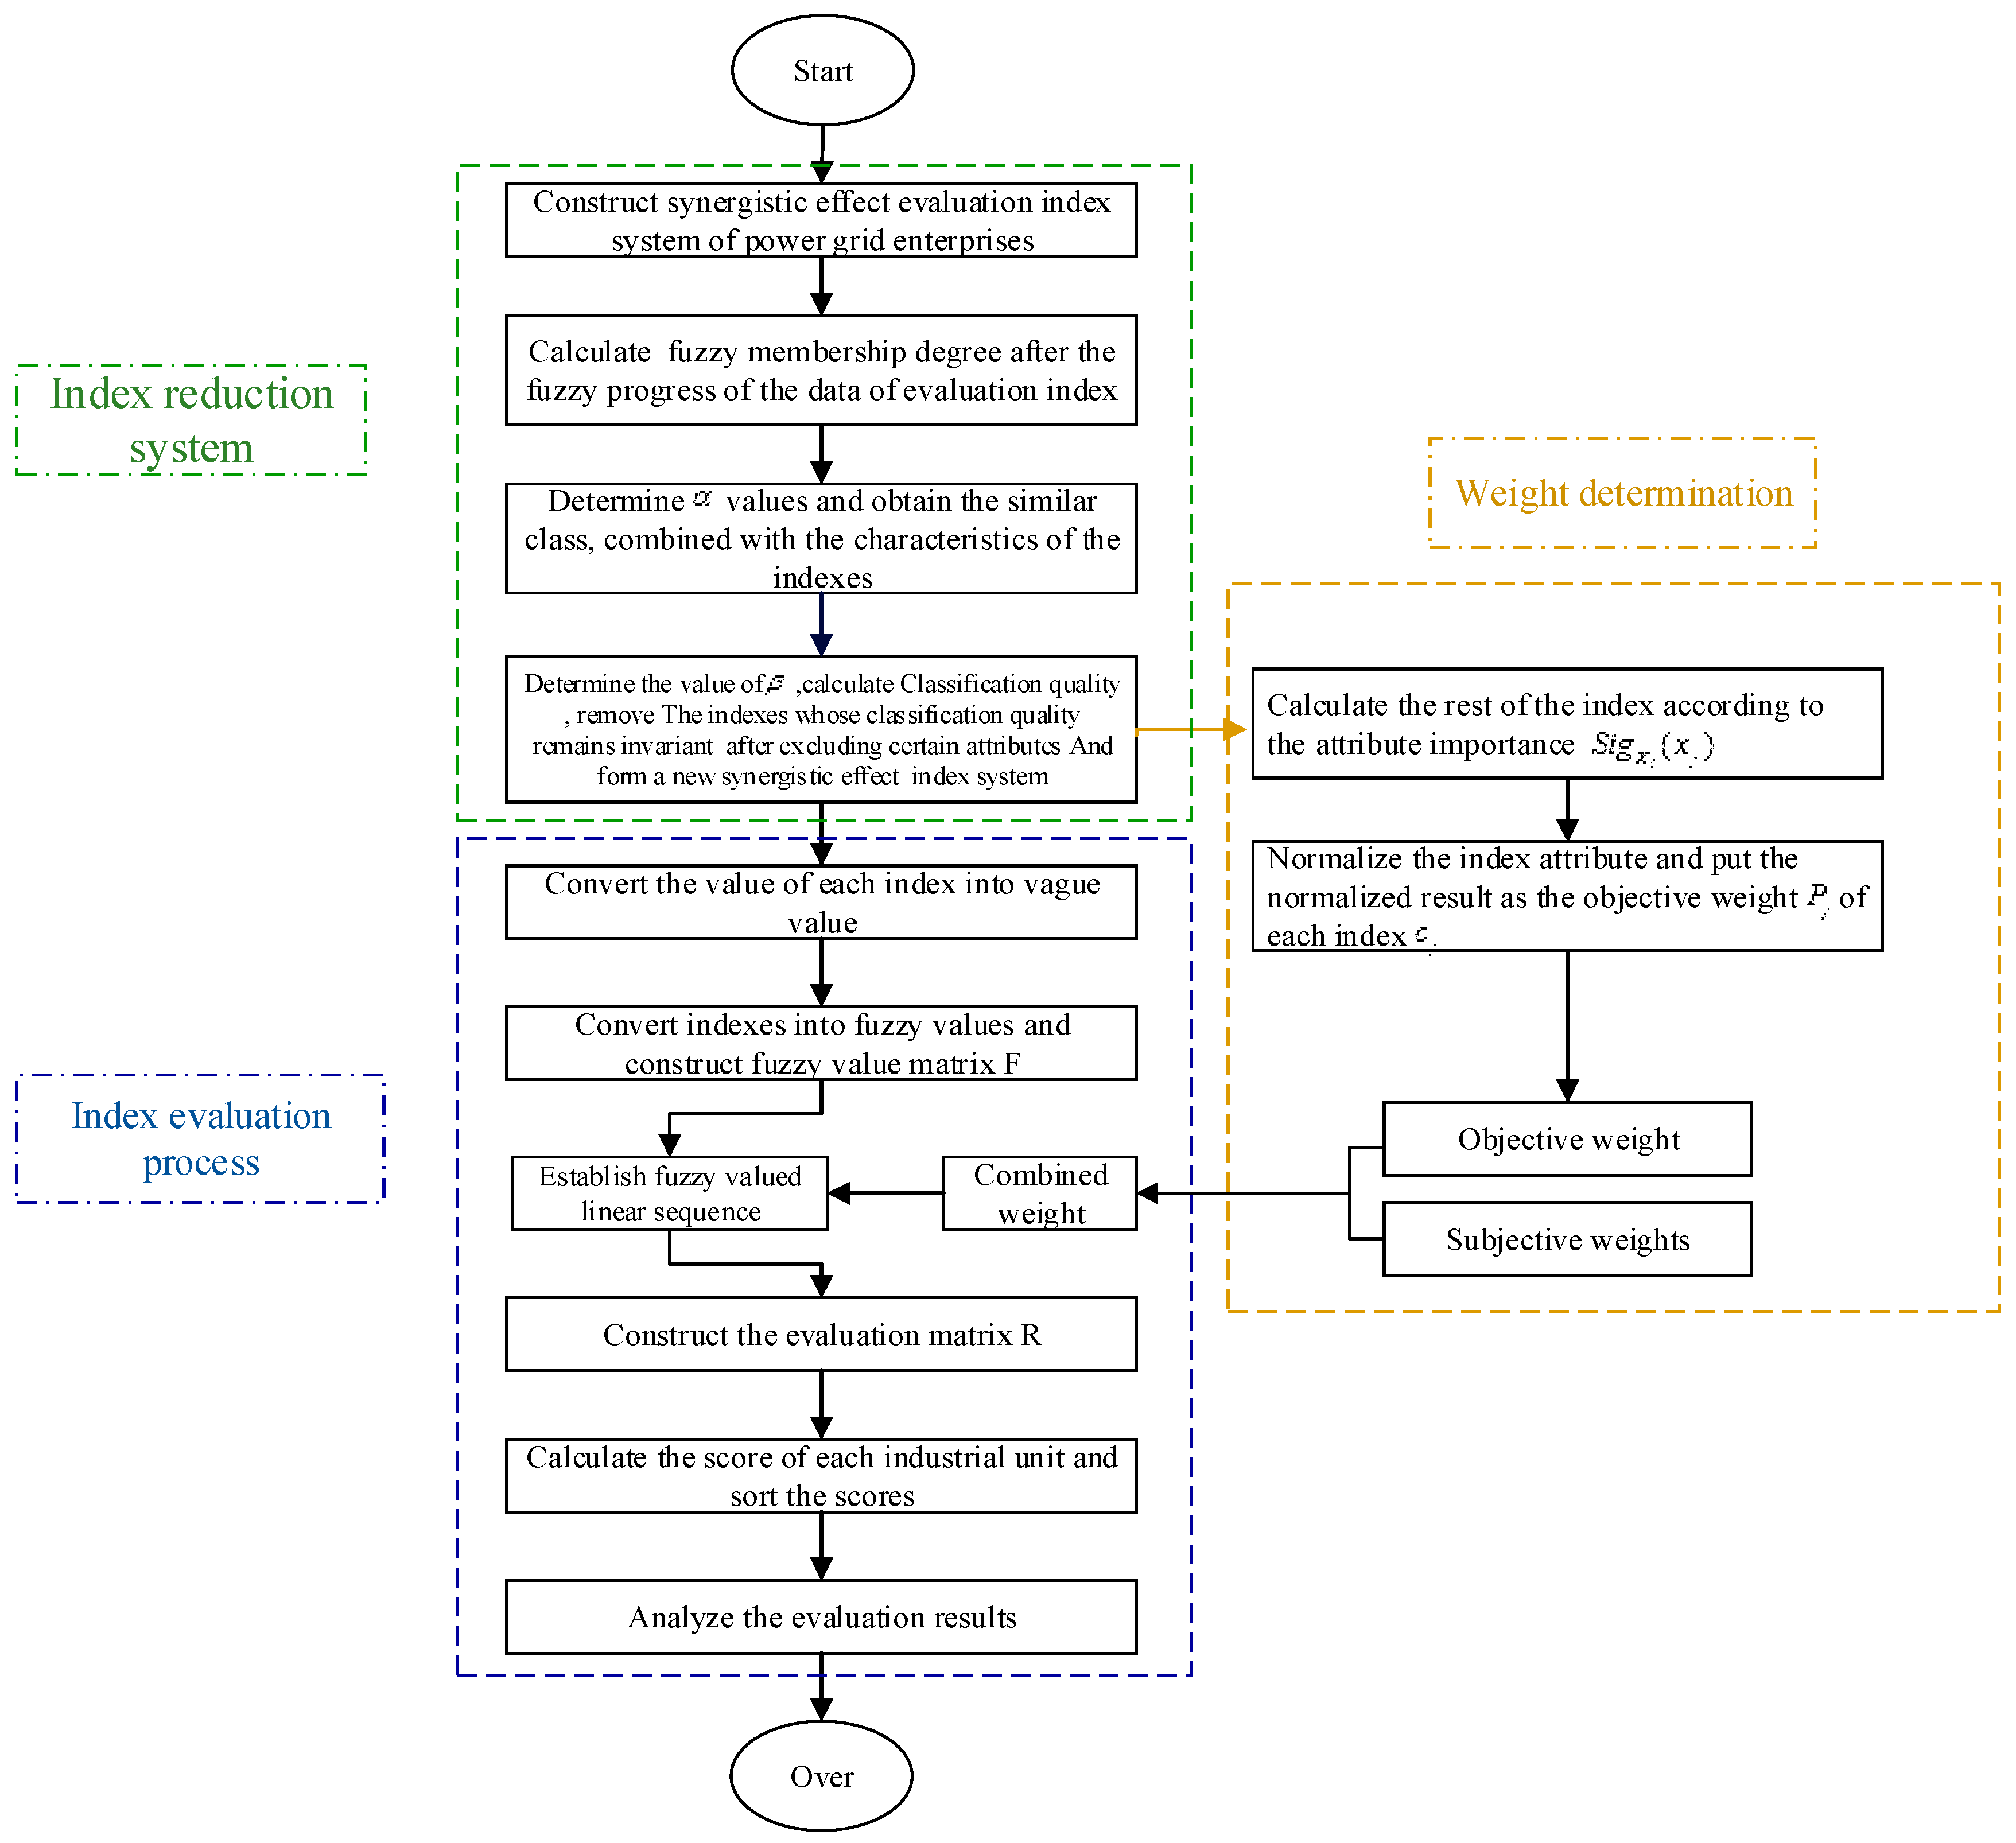
This paper constructs the synergistic evaluation model of power grid enterprises based on variable precision fuzzy rough set and improved vague set. The concrete steps are shown as follows.
- Step 1
- Obfuscate the evaluation indicator data, and compute the corresponding fuzzy membership according to Equation (1).
- Step 2
- Combining the characteristics of the object index data, determine the value of , i.e., objects whose fuzzy similarity is greater than or equal to , should be classified as a class, called similar class.
- Step 3
- Determine the value of , calculate the lower approximation set according to the Equation (6), and get the classification quality.
- Step 4
- Calculate the rest of the index according to the attribute importance calculated by Equation (9).
- Step 5
- Normalize the index attribute importance based on the Equation (14), and put the normalized result as the objective weight of each index .
- Step 6
- Convert the value of each index into vague value. The evaluation indexes after reduction contain qualitative and quantitative indexes, whose vague value data are not determined. This paper uses the single value standardization method [36] to determine the corresponding vague value of each index’s data.
Set is the theory domain, where the index of is a non-negative and single-valued datum . The value and respectively represent the minimum and maximum of evaluation index . The vague set standardized formula of efficiency indicator is () set as follows.
The standardized formula of the vague set of costindicator is () set as follows.
- Step 7
- Construct fuzzy value matrix by converting the original indexes into fuzzy values, according to Equations (19) and (20).
When , then
When , then
- Step 8
- Sort all units to form a fuzzy value linear sequence according to the fuzzy value matrix F, abiding by the following rules.
If , then is prior to . If and , then is prior to ;
If , and , then is prior to . If , and , then and are in the same position.
Thus, the sequence of each industrial unit corresponding to each index is constructed, recorded as , respectively.
- Step 9
- Construct the evaluation matrix , according to the fuzzy value linear sequence and the final weight of reduced indexes based on VPFRS information fusion technology.
where equals to 0.
- Step 10
- Calculate the score of each industrial unit and sort the scores. A higher score indicates a better synergy.
The flowchart of the model is shown in Figure 2.
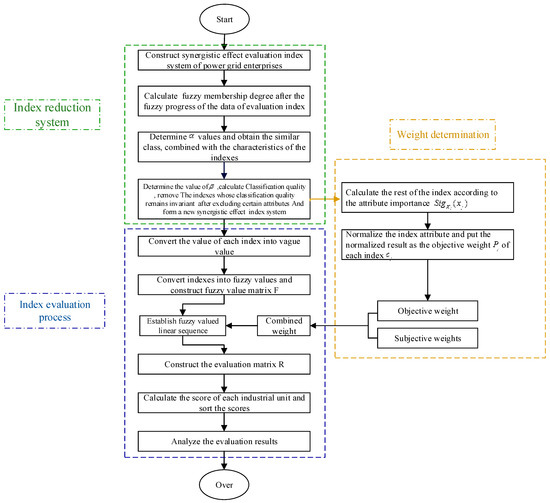
Figure 2.
Synergistic effect evaluation process based on the rough set and the improved vague set.
4. Empirical Analysis and Discussion
This paper uses the VPFRS-Vague method to evaluate the synergistic effect of main and auxiliary industry of the power grid enterprises. The empirical part includes the following steps: firstly, according to the characteristics of the power grid enterprise, the index system is constructed. Secondly, the VPFRS method is introduced to reduce the index system to find the minimum attribute set. Thirdly, the improved vague set is used to evaluate the synergistic effect.
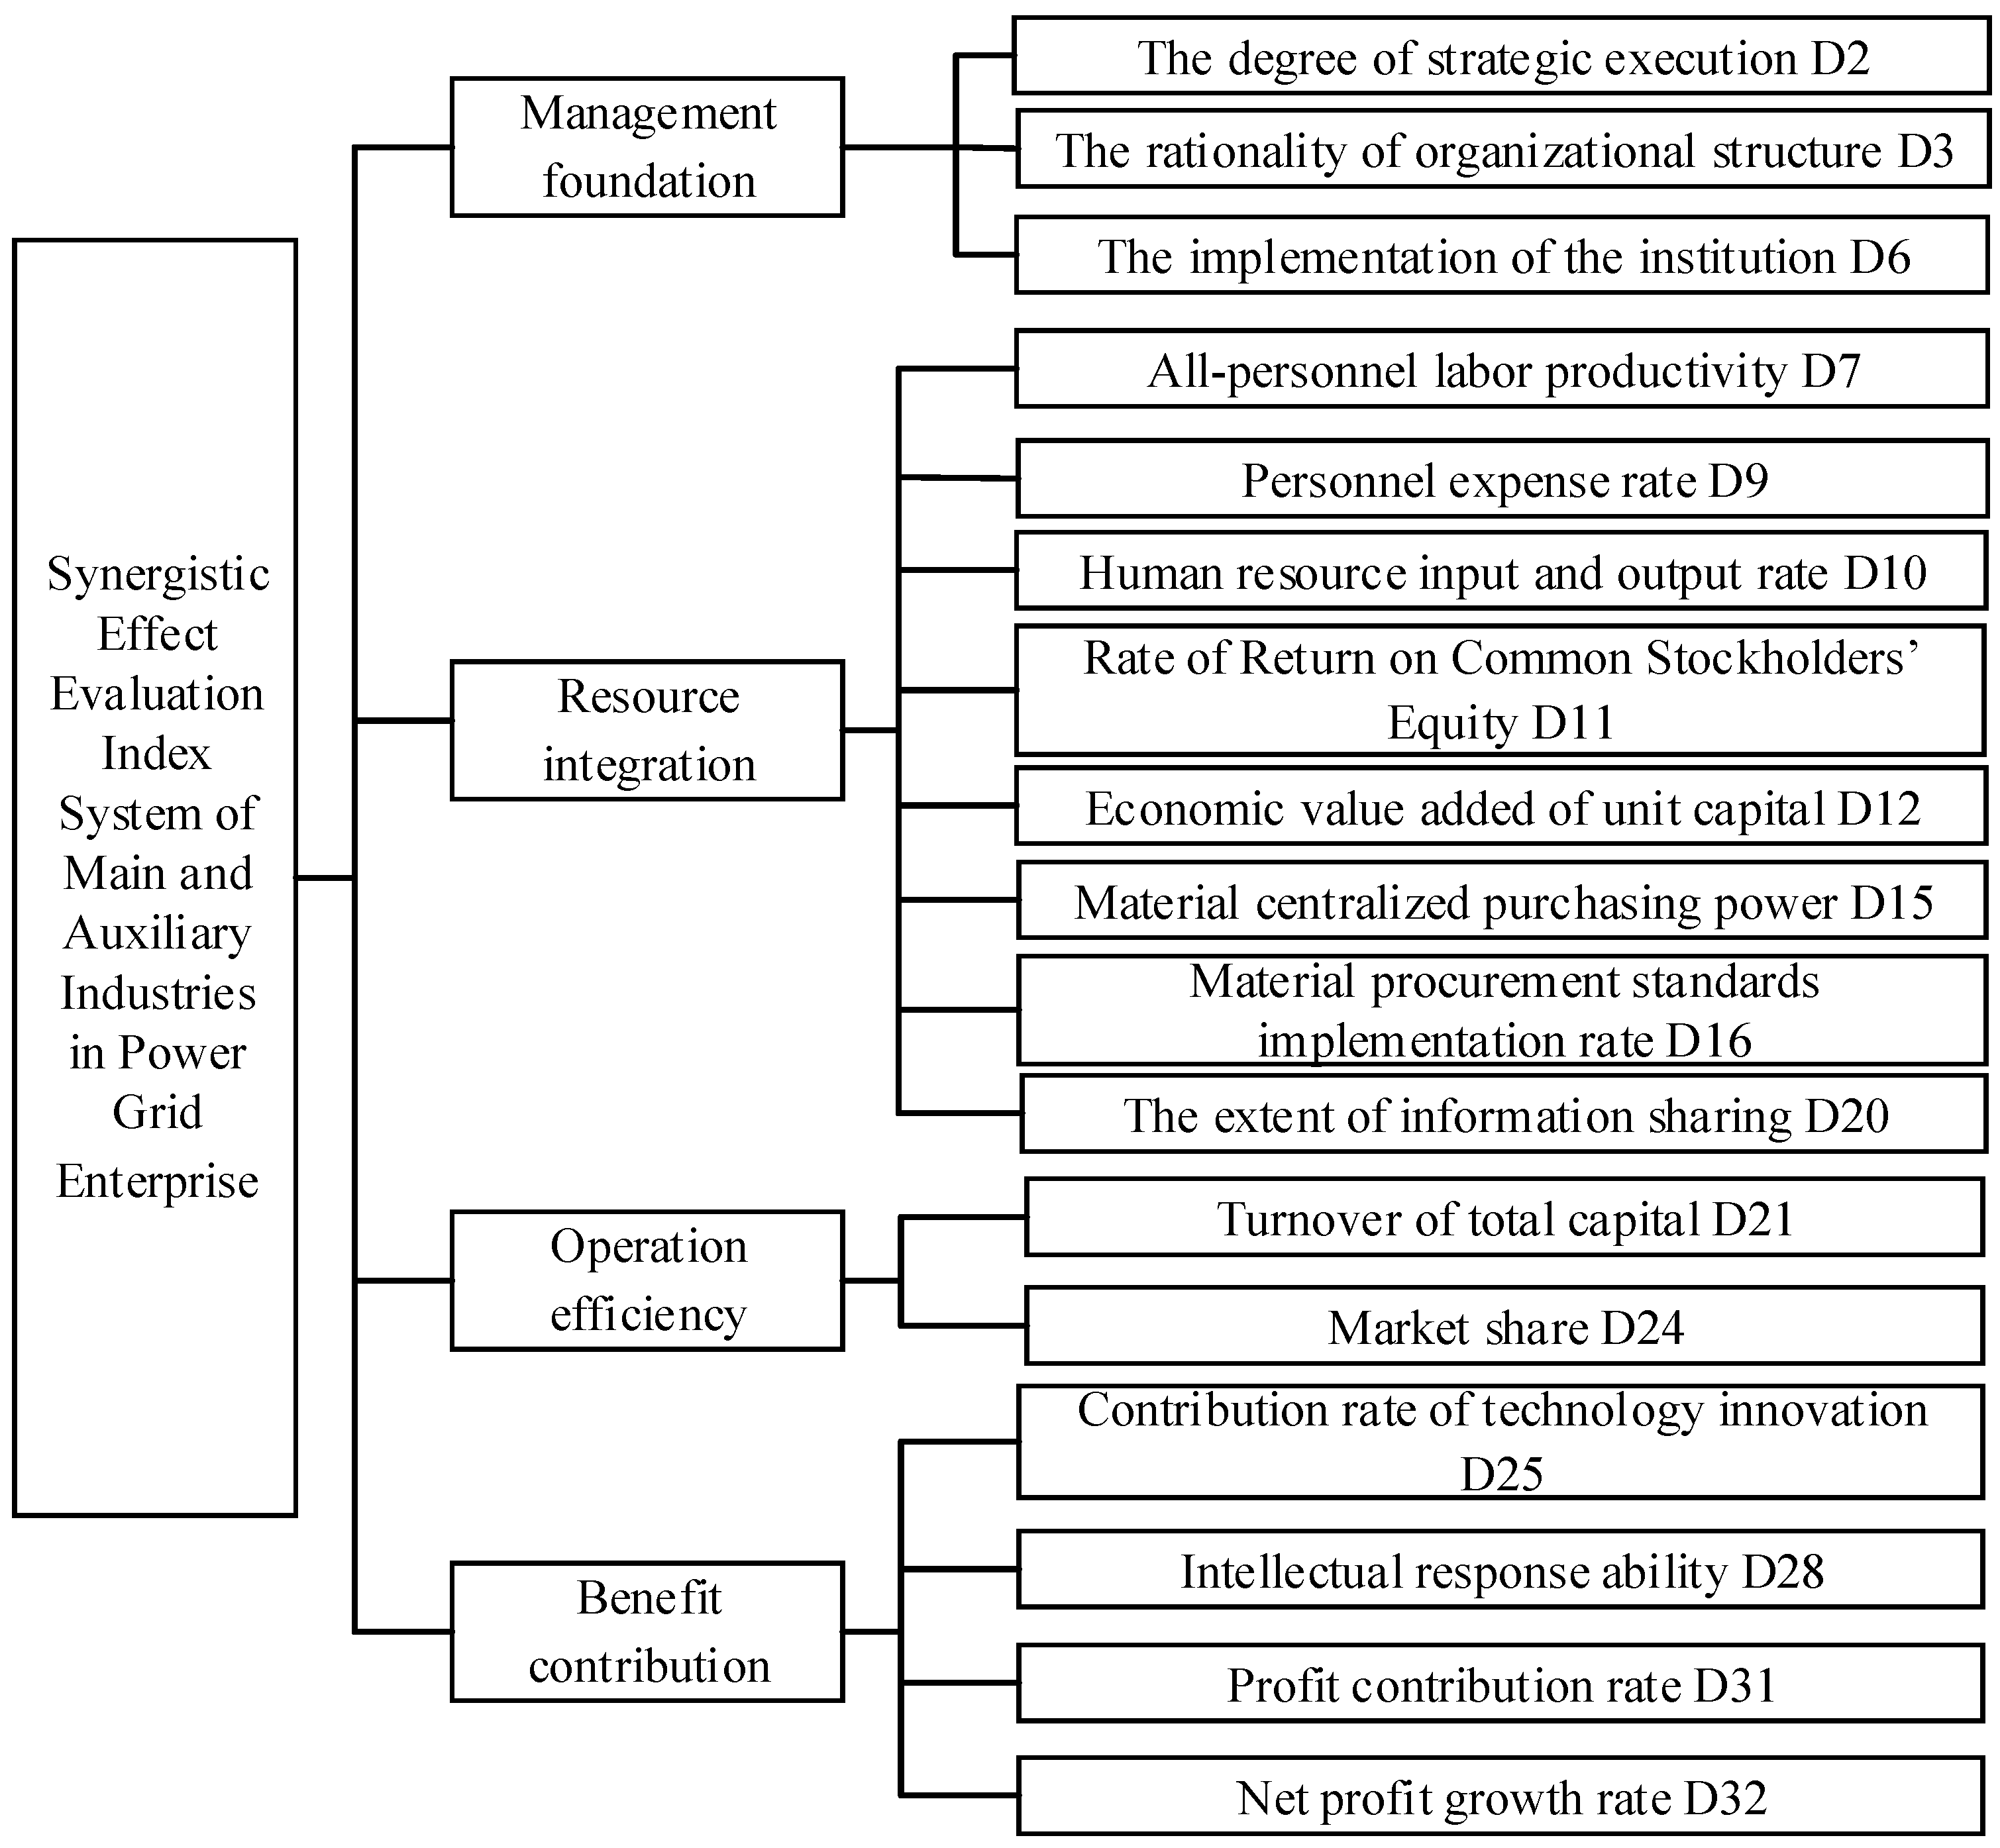
4.1. Construction of Synergistic Effect Evaluation Index System of Power Grid Enterprise
The synergistic effect evaluation of power grid enterprises is a composite system, which involves many factors. The evaluation should be done multi-dimensionally and multi-perspectivally, and a multi-level comprehensive index system needs to be established. The indexes in Table 1 are identified in a variety of ways, such as literature induction, field research, and interviews. Specifically, firstly, by reading the literatures, we summarize and conclude the relevant indexes that affect the synergistic development of group enterprises from a comprehensive perspective, and initially construct an index system containing 53 three-level indexes. After that, we enter the five typical enterprises that selected for empirical analysis to investigate and interview. On the one hand, through investigation and research, we obtain the specific value of quantitative indexes in the index system; on the other hand, through interviews with experts, the index system is reduced and adjusted. The redundant and unimportant indexes are also removed. Finally, an index system consisting of 32 three-level indexes is constructed from the perspectives of management foundation, resource integration, operational efficiency and effectiveness. At the same time, the Delphi method is used to score the qualitative indexes of the 32 indexes. The actual data of quantitative indexes are selected from 2012 to 2016 and the final value are obtained by the weighted average processing. The specific values of the qualitative indexes are integrated with the score of multiple experts. The final index system is shown in Table 1.

Table 1.
Evaluation index system of the grid enterprise synergy.
4.2. Reduction of Index System Based on VPFRS Method
Although the synergistic evaluation system of power grid enterprises is clear, there are too many underlying indexes. Some indexes are important but may not play a necessary role in the evaluation process. The existence of these indexes will increase the complexity of the evaluation and affect the efficiency and results of the evaluation. To solve these problems, we utilize the variable precision fuzzy rough set (VPFRS) theory to select the key indexes from the underlying indexes, which lay the foundation for the subsequent evaluation.
The quantitative indexes data are obtained through field investigation in five selected units , , , and . Through the investigation, we can see that the auxiliary industry of the power grid is divided into three sections: scientific research and education sector, professional company sector and industrial company sector. Companies in the scientific research and education sector provide intellectual support; Companies in the professional company sector provide technical support; Companies in the industrial company sector provide service guarantee and benefit contribution. This paper selects five typical units for analysis, among them, units and belong to the professional company sector, unit belongs to the scientific research and education sector, units and belong to the industrial company sector.
Qualitative indexes data are obtained by scoring from the relevant senior experts. The indexes data are shown in Table 2. Before evaluating, this paper uses VPFRS method to reduce the index system to improve the efficiency of the evaluation. Due to the length of the article, we take the resource synergy as an example of the index reduction and the remaining three aspects are not discussed here. The specific process is as follows.
Table 2.
Data of synergistic effect development evaluation of the main and auxiliary industries of power grid enterprise.
- Step 1
- According to Equation (1), we calculate the corresponding fuzzy membership degree. The results are shown in Table 3.
Table 3. The fuzzy membership degree of each unit.
- Step 2
- Taking the reasonable classification into account, the paper uses α = 0.3 to divide the units whose value of fuzzy membership degree is greater than or equal to 0.7 into a class. Thus, we get the similar categories as follows.
As the similar classes of fuzzy rough sets are not in an equivalence relation in the strict sense, thus, there are overlapping relationships between different similarity classes. Similarly, removing the indexes , we can get the similar class of the remaining 13 indexes as shown.
- Step 3
- We assign 0.9 as the value of correct classification rate and compute the approximate quality classification according to Equations (4) and (8). The results are as follows.
We can see from the above results that after removing any attribute of the attribute set , the similar class classification results remain unchanged and the approximate quality classification still stay at 1. While after removing any attribute of the attribute set , the approximate quality classification is less than 1. Therefore, the smallest attribute set can be considered as .
- Step 4
- The similar class after reduction is shown as follows.
The weight calculation for the remaining eight indexes are shown as follows.
- Step 5
- The weight of each index is obtained respectively by the normalization treatment based on Equation (10).
Similarly, we can get reduction results of management foundation, operation effect, and benefit, which are shown in Table 4.
Table 4.
Index system after the reduction for management foundation, operation effect, and benefit.
The final weight can be obtained by normalization of the remaining index after reduction.
The evaluation index system after reduction is shown in Figure 3. From Figure 3, we can see that the evaluation index system which is composed of 32 indexes initially streamlines into 17 indexes, which has effectively eliminated the redundant information.
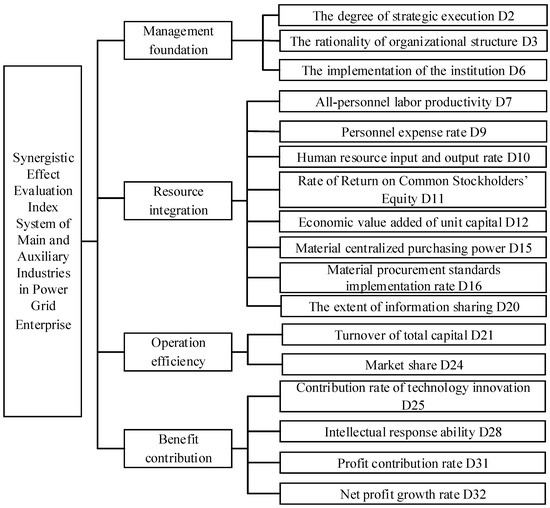
Figure 3.
Synergistic effect evaluation index system of the main and auxiliary industries in power grid enterprise after reduction.
4.3. Synergistic Effect Evaluation Model for the Main and Auxiliary Industries of Power Grid Based on the Improved Vague Set
This paper applies vague sets based on the fuzzy valued linear order method for evaluation. By calculating the scores of auxiliary units, we can analyze the realization degree of synergistic effects. Specific process is as follows.
- Step 1
- Conversion of Vague values.
The Vague values of each unit after conversion are as shown below.
- Step 2
- The calculation of the fuzzy value matrix .
In order to write neatly, we transpose the matrix , which is shown as follows.
- Step 3
- The establishment of fuzzy valued linear sequence.
We sort the values in each column of fuzzy value matrix from large to small. The results are shown as follows.
- (Sorted by the index d2): ;
- (Sorted by the index d3): ;
- (Sorted by the index d6): ;
- (Sorted by the index d7): ;
- (Sorted by the index d9): ;
- (Sorted by the index d10): ;
- (Sorted by the index d1): ;
- (Sorted by the index d12): ;
- (Sorted by the index d15): ;
- (Sorted by the index d16): ;
- (Sorted by the index d20): ;
- (Sorted by the index d21): ;
- (Sorted by the index d24): ;
- (Sorted by the index d25): ;
- (Sorted by the index d28): ;
- (Sorted by the index d31): ;
- (Sorted by the index d32): .
Among them, the elements in parentheses represent at the same position in the corresponding index.
- Step 4
- The calculation of weight of each evaluation index and fuzzy preference matrix R.
- Step 5
- The calculation of the evaluation score of each unit.
According to Equation (24), we calculate the evaluation score of the various units and rank them, which are shown in Table 5.
Table 5.
The synergistic evaluation results of the five typical enterprises.
Seen from Table 5, we can get that the final result of synergistic degree is . Unit has the best synergistic effect, whose score reached 2.608. Scores of units and are very close: respectively 2.436, 2.405. This means that their synergistic effect is close and the achievement degree of synergistic development are similar. Units and have lower scores than other units, respectively 1.203 and 1.754, showing a poor synergistic effect. Their synergistic development degree is not ideal enough. Additionally, it can be seen from the results that unit , on behalf of scientific research and education sector, has the highest degree of synergy. It provides better intellectual support for power grid enterprise. Units and , on behalf of the professional company sector, have a better degree of synergy. They provide some technical support for power grid enterprise, while units and , on behalf of industrial company sector, have the lowest degree of synergy. This shows that the power grid enterprise needs further improvement in service and efficiency.
On the basis of the synergistic effect, we carry out the traceability analysis of each unit. Units and have lower data in operational efficiency, benefit and financial synergy. For example, the unit E has the minimum sample data of the rate of the net asset returns and total assets turnover, which influence the overall synergistic effects. This indicates that the unit has a short board in financial synergy and to a certain extent in efficiency contribution and more attention should be paid to the synergistic management in the future, and corresponding measures should be taken to improve it. In addition, the synergistic effect of unit is more prominent. It has better sustainable development ability. In the last few years, the power grid enterprise has taken some strategic control of the scientific research and education sector. The group not only pays attention to its financial benefit, but also focus more on the integrated sustainable development in this sector.
5. Conclusions
With the increasing scale of the power grid enterprise, the synergistic effects of enterprises have played a decisive role for its future development. Evaluation of synergistic effects of the main and auxiliary in the power grid is propitious for examining the synergistic effect of each subsidiary company. It can find the existing problems for the promotion of the synergistic and sustainable development of main and auxiliary industries. Firstly, this paper constructs the index system from the four aspects of management foundation, resource integration, operation efficiency and benefit contribution. Then, it proposes the variable precision fuzzy rough set to reduce the indexes, remove the redundancy and repetition indexes, and keep the key indexes. Finally, this paper carries out the overall evaluation by using the improved vague set. Five typical auxiliary companies belonging to power grid enterprises are selected as examples for analysis to prove the validity and applicability of the evaluation method based on the variable precision fuzzy rough sets and improved based on the vague set (VPFRS-Vague).
According to the proposed evaluation model and empirical analysis, we can finally draw the following conclusions:
- (1)
- By analyzing the characteristics of power grid enterprises, this paper constructs a set of evaluation index system of synergic effect for power grid enterprises from four aspects: management, resources, operation and efficiency. It has strong pertinence and applicability. Different from the general enterprise, as the large state-owned enterprises, the auxiliary units of power grid enterprises cover scientific research, electrical equipment manufacturing, logistics and other fields. They have the characteristics of wide range, great difficulty in synergic development and so on. Therefore, the construction of a set of targeted index systems can lay a good foundation for the evaluation of the synergic development of power grid enterprises.
- (2)
- Attribute reduction is one of the core contents of rough sets. In order to solve the problem of redundancy in traditional method reduction, this paper proposes a reduction method of variable precision fuzzy rough set. The results of empirical analysis show that this method eliminates unnecessary indexes, reduces the attribute dimension effectively and preserves key indexes without reducing classification accuracy. It reduces the original 32 indexes to 17 key indexes, are duction rate of 46.875%. The minimum subset of attributes obtained by variable precision fuzzy rough set can be used for further evaluation research, which can improve the efficiency of evaluation and the accuracy of evaluation results.
- (3)
- Vague sets can deal with fuzzy and uncertain information caused by qualitative indexes. In this paper, the fuzzy linear order method is used to improve the traditional vague set, which can effectively improve the objective effect of quantitative qualitative indexes. Through the transformation of vague value, the calculation of the fuzzy value matrix, the establishment of a fuzzy linear sequence and the calculation of the fuzzy priority matrix, the final synergy effect evaluation results are obtained. From the results of empirical analysis, it can be seen that the evaluation results can accurately reflect the synergic development status between main and auxiliary industries. It is conducive to better management by decision makers.
- (4)
- The auxiliary units of power grid enterprises are divided into three major business segments. Since different types of companies have differences in management and operation, they also have different degrees of synergism. According to the final results, the scientific research and education sector has the highest synergic degree in the power grid enterprise, while the industrial sector has the lowest degree of synergy, especially in the aspect of operation and finance. The evaluation model of VPFRS-Vague constructed in this paper is simple and applicable, and provides a clear direction for power grid enterprises to carry out targeted management and improvement in the future.
Acknowledgments
This study is supported by the National Natural Science Foundation of China (Project No.71471059). It is also supported by China Postdoctoral Science Foundation (Project No. 2017M620714). It is also supported by the Fundamental Research Funds for the Central Universities (Project No. 2018QN067).
Author Contributions
Xiaomin Xu designed this research, wrote and revised this paper; Qiong Wang carried out the data processing and analysis and revised part of this paper; Dongxiao Niu and Lihui Zhang provided professional guidance.
Conflicts of Interest
The authors declare no conflict of interest.
References
- De Man, A.P.; Duysters, G. Collaboration and innovation: A review of the effects of mergers, acquisitions and alliances on innovation. Technovation 2005, 25, 1377–1387. [Google Scholar] [CrossRef]
- Zhen, Z.H.; Zhu, N. Industrial Policy under Social Construction: The Merger and Acquisition of Carlyle and Xuzhou Construction Machinery Group. China Int. J. 2016, 14, 56–73. [Google Scholar]
- Yoon, S.G.; Park, S.; Lee, J. Evaluation of synergy effect in the merger of companies in a petrochemical complex. Comput. Aided Chem. Eng. 2009, 27, 2061–2066. [Google Scholar]
- Majumdar, S.K.; Yaylacicegi, U.; Moussawi, R. Mergers and synergy: Lessons from contemporary telecommunications history. Telecommun. Policy 2012, 36, 140–154. [Google Scholar] [CrossRef]
- Brock, D.M. Multinational acquisition integration: The role of national culture in creating synergies. Int. Bus. Rev. 2005, 14, 269–288. [Google Scholar] [CrossRef]
- Sirower, M. The Synergy Trap: How Companies Lose the Acquisition Game; Free Press: New York, NY, USA, 1997. [Google Scholar]
- Chen, J.L. The synergistic effects of IT-enabled resources on organizational capabilities and firm performance. Inf. Manag. 2012, 49, 142–150. [Google Scholar] [CrossRef]
- Wang, X.Y. The Knowledge-Intensive Industries Synergetic Development and Enterprise Technology Innovation: Mechanism and Empirical Study. Sci. Sci. Manag. S.T. 2017, 38, 96–104. [Google Scholar]
- Manouselis, N.; Verbert, K. Layered Evaluation of Multi-Criteria Collaborative Filtering for Scientific Paper Recommendation. Procedia Comput. Sci. 2013, 18, 1189–1197. [Google Scholar] [CrossRef]
- O’Sullivan, R.G. Collaborative Evaluation within a framework of stakeholder-oriented evaluation approaches. Eval. Program Plan. 2012, 35, 518–522. [Google Scholar] [CrossRef] [PubMed]
- Chen, Z.J.; Liu, X. Establish evaluation model for parent-subsidiary companies’ synergy effects. Econ. Manag. J. 2010, 32, 51–56. [Google Scholar]
- Li, M.M. Study on the Collaborative Development Pattern of Enterprise Group; Shandong University: Jinan, China, 2008. [Google Scholar]
- Liu, X.Z. The Research on Synergistic Effect of Luyin Group; Shandong University: Jinan, China, 2011. [Google Scholar]
- Zhang, T.N.; Cao, H.L.; Ma, W.J.; Tang, S.L. Research on synergy effect appraisal of adaptive enterprise strategy implementation based on BSC theory. J. Univ. Sci. Technol. Beijing 2010, 26, 37–43. [Google Scholar]
- Chen, J.H.; Zou, S.L.; Liu, B.; Liu, W.J. The Index System and Fuzzy Comprehensive Evaluation of Strategic Alliance Based on the Value Chain Theory. J. Univ. South China 2005, 6, 46–49. [Google Scholar]
- Yuan, J. The Development Status on Multi-source of Information Fusion and Application. Ind. Econ. Rev. 2017, 4, 42–47. [Google Scholar]
- Susmaga, R. Reduction and construction in classic and dominance-based rough sets approach. Inf. Sci. 2014, 271, 45–64. [Google Scholar] [CrossRef]
- Zhou, J.; Wang, S.C.; Zhao, X.; Zhang, H.; Zhang, J. The evaluation of integrated navigation algorithm based on vague sets theory. J. Proj. Rockets Missiles Guid. 2013, 33–38. [Google Scholar]
- Fu, L.; He, Z.Y.; Mai, R.K.; Qian, Q.Q.; Zhang, P. Application of wavelet entropy evidence of information fusion in fault diagnosis of power system. Chin. Soc. Electr. Eng. 2008, 13, 64–69. [Google Scholar]
- Chen, L.; Wang, W.; Zhang, W. Risk evaluation of regional collapses geological hazard based on DS evidence theory-A case study of Haiyuan active fault belt in Ningxia Province. Energy Procedia 2012, 16, 371–376. [Google Scholar] [CrossRef]
- Ye, J. Improved method of multi-criteria fuzzy decision-making based on vague set. Comput. Aided Des. 2007, 39, 164–169. [Google Scholar] [CrossRef]
- He, Z.; Han, J.D.; Sun, B. Research on Index Reduction Method for Commercialization of Research Findings Based on Rough Set. Soft Sci. 2011, 25, 28–31. [Google Scholar]
- Liu, X.L.; Chen, G.M.; Li, F.X.; Zhang, Q. Research and application of information fusion method based on Bayesian network and rough set. Mod. Manuf. Eng. 2013, 1, 125–129. [Google Scholar]
- Wang, S.Q.; Zhang, F.D.; Bi, D.Y.; Zhang, L.D. Two steps methods of attribute reduction based on dependency degree of the fuzzy rough set. J. Beijing Univ. Technol. 2013, 6, 828–834. [Google Scholar]
- Tang, F.; Lin, J.; Long, W.L.; He, Y. The weight distribution of factor of highway geological disaster based on the fuzzy rough set. J. Hunan Univ. Sci. Technol. 2012, 1, 73–78. [Google Scholar]
- Yi, X.; Zhang, F.L.; Qiu, H. A comprehensive evaluation method for the urban subway operation safety based on ANP and vague sets theory. J. Saf. Environ. 2013, 13, 238–242. [Google Scholar]
- Qian, Y.; Zhang, Z.W.; Xia, J.B.; Ma, Z.Q. Study of simple value indices normalization methods for comprehensive evaluation based on vague sets. Math. Pract. Theory 2013, 43, 126–131. [Google Scholar]
- Khemiri, R.; Elbedoui-Maktouf, K.; Grabot, B.; Zouari, B. A fuzzy multi-criteria decision-making approach for managing performance and risk in integrated procurement-production planning. Int. J. Prod. Res. 2017, 55, 5305–5329. [Google Scholar] [CrossRef]
- Ye, J. Using an improved measure function of vague sets for multi-criteria fuzzy decision-making. Expert Syst. Appl. 2010, 37, 4706–4709. [Google Scholar] [CrossRef]
- Jiang, F.; Chen, Y.M. Outlier detection based on granular computing and rough set theory. Appl. Intell. 2015, 42, 303–322. [Google Scholar] [CrossRef]
- Park, I.K.; Choi, G.S. Rough set approach for clustering categorical data using information-theoretic dependency measure. Inf. Syst. 2015, 48, 289–295. [Google Scholar] [CrossRef]
- Selvachandran, G.; Maji, P.K.; Abed, I.E.; Salleh, A.R. Relations between complex vague soft sets. Appl. Soft Comput. 2016, 47, 438–448. [Google Scholar] [CrossRef]
- Wang, C.; Qu, A. Entropy, similarity measure and distance measure of vague soft sets and their relations. Inf. Sci. 2013, 244, 92–106. [Google Scholar] [CrossRef]
- Wang, J.; Xu, W.; Ma, J.; Wang, S. A vague set based decision support approach for evaluating research funding programs. Eur. J. Oper. Res. 2013, 230, 656–665. [Google Scholar] [CrossRef]
- Zhang, H.D.; Shu, L.; Liao, S.L. Possibility interval-valued fuzzy soft set and its application in decision making. J. Comput. Anal. Appl. 2015, 18, 492–505. [Google Scholar]
- Pawlak, Z. Rough Sets. Int. J. Comput. Inf. Sci. 1982, 11, 341–356. [Google Scholar] [CrossRef]
- Wang, X.E.; Han, C.Z.; Han, D.Q.; Fan, Q. A Survey on Rough Sets Theory. Control Eng. China 2013, 20, 1–8. [Google Scholar]
- Zadeh, L.A. Fuzzy sets as a basis for a theory of possibility. Fuzzy Sets Syst. 1999, 100, 9–34. [Google Scholar] [CrossRef]
- Men, B.H.; Liu, H.L.; Tian, W.; Liu, H.Y. Evaluation of Sustainable Use of Water Resources in Beijing Based on Rough Set and Fuzzy Theory. Water 2017, 9, 852. [Google Scholar] [CrossRef]
- Ziarko, W. Variable precision rough set model. J. Comput. Syst. Sci. 1993, 46, 39–59. [Google Scholar] [CrossRef]
- Gau, W.L.; Buehrer, D.J. Vague sets. IEEE Trans. Syst. Man Cybern. 1993, 23, 610–614. [Google Scholar] [CrossRef]
- Jin, L.; Yang, Y.; Niu, C.Y. Vague sets and its new similarity measure. Comput. Eng. Appl. 2009, 45, 31–33. [Google Scholar]
- Sun, B.Z.; Ma, W.M. Fuzzy rough set over multi-universes and its application in decision making. J. Intell. Fuzzy Syst. Appl. Eng. Technol. 2017, 32, 1719–1739. [Google Scholar]
© 2018 by the authors. Licensee MDPI, Basel, Switzerland. This article is an open access article distributed under the terms and conditions of the Creative Commons Attribution (CC BY) license (http://creativecommons.org/licenses/by/4.0/).