Article

Economic and Emission Dispatch Using Ensemble Multi-Objective Differential Evolution Algorithm

1
Collaborative Innovation Center on Forecast and Evaluation of Meteorological Disasters, Nanjing University of Information Science & Technology, Nanjing 210044, China
2
School of Management and Engineering, Nanjing University of Information Science & Technology, Nanjing 210044, China
*
Author to whom correspondence should be addressed.
Sustainability 2018, 10(2), 418; https://doi.org/10.3390/su10020418
Submission received: 16 January 2018 / Revised: 26 January 2018 / Accepted: 1 February 2018 / Published: 6 February 2018
(This article belongs to the Special Issue Transition from China-Made to China-Innovation )

Abstract

:
In the past two decades, China’s manufacturing industry has achieved great success. However, pollution and environmental impacts have become more serious while this industry has grown. The economic and emission dispatch (EED) problem is a typical multi-objective optimization problem with conflicting fuel costs and pollution emission objectives. An ensemble multi-objective differential evolution (EMODE) is proposed to tackle the EED problem. First, the equality constraints of the problem have been transformed into inequality constraints. Next, two mutation strategies DE/rand/1 and DE/current-to-rand/1 have been implemented to improve the conventional DE. The performance of the proposed algorithm is evaluated on six test functions and the numerical results have indicated that the proposed algorithm is effective. The proposed algorithm EMODE is used to solve a series of six generators and eleven generators in the EED problem. The experimental results obtained are compared with those reported using single optimization algorithms and multi-objective evolutionary algorithms (MOEAs). The results have revealed that the proposed algorithm EMODE either matches or outperforms those algorithms. The proposed algorithm is an effective candidate to optimize the manufacturing industry of China.

1. Introduction

Currently, every country has enacted strict regulations and laws to protect the environment from pollution [1]. For example, the US Clean Air act was implemented in 1990. This act mandates that power companies should reduce NOX by 2 million ton/year and SO2 emission by 10 million ton/year from 1980 levels [2,3]. In the past decades, China’s government has also enacted related laws and regulations to protect the environment [1,3,4,5,6,7]. However, when power companies generate electricity, they produce harmful pollutants. Thus, these companies have to reduce the emissions of these harmful pollutants, such as CO2, CO and NOx [8]. Therefore, the economic and emission dispatch (EED) problem is a highly critical problem for power companies. The problem consists of two objectives, including minimization costs and emissions with the constraints. It is a typical non-linear constrained multi-objective optimization problem (CMOP).
This problem has to deal with linear/nonlinear, equality/inequality constraints, concave feasible region, et al. Consequently, many traditional optimization approaches may not be attractive since they are computationally expensive or easily get stuck at local optima. In the past decade, evolutionary algorithms have been obtained increasingly attention for solving the problem due to their adaptability and flexibility to the task [9]. Currently, there are many approaches proposed to handle the economic and emission dispatch (EED) problem. These approaches can be classified into two categories.
The first one is to transform the problem into a single optimization problem [10]. Generally, different objectives are combined by the relative weights among these objectives. This category generally applies the following method to form a new objective function:
min i = 1 N G [ w F i + ( 1 w ) λ E i ]
where w is the relative weight between fuel costs F i ($/h) and emissions E i (ton/h), λ is a scaling factor and Ng is the number of generators [8,11,12,13,14,15,16,17,18,19,20,21]. The EED problem is converted into single objective function using the penalty factor. The main advantage of the method is that it is easy to implement. However, it is highly difficult to identify suitable weights among different objectives. Multiple runs are often required for the sake of obtaining non-dominated solutions. In the past decades, multi-objective evolutionary algorithms (MOEAs) have made considerable progress. These algorithms are widely applied to solve the EED problem.
The second category addresses the EED problem of MOEAs. These population-based optimization algorithms can obtain multiple non-dominated solutions in a single run. This approach can overcome the main disadvantage of the first category. As the performances of MOEAs are attractive, they have been widely employed to solve the EED problem. A multi-strategy ensemble biogeography-based optimization algorithm is proposed to solve the EED problem [22]. A new MOEA based on an enhanced firefly algorithm is proposed to acquire a set of non-dominated solutions and to solve various EED problems [23]. The differential evolution (DE) algorithm and PSO (particle swarm optimization) algorithm are combined to form a new hybrid algorithm called DEPSO. The proposed hybrid algorithm is used to address the EED problem [24]. A trust region algorithm based on the MOEA is presented to cope with the problem [25]. A time varying acceleration PSO is proposed to improve the solutions of the EED problem [26]. A quantum-behaved PSO algorithm is introduced to address the EED problem [27]. A new bare-bones multi-objective PSO algorithm is designed to solve the EED problem [28]. An extended NSGA-II algorithm is presented for the EED problem [2]. A new two-archive multi-objective grey wolf algorithm is presented to solve reactive power dispatch problems [29].
From the above discussion, it is noticed that MOEAs are widely used in the field of EEDs. In the recent years, the DE as one EA has attracted increasing attention due to its attractive performance. It is a simple powerful optimization algorithm created by Storn and Price [30]. Many multi-objective differential evolution (MODE) algorithms have been proposed and achieved remarkable performances compared to other MOEAs when solving the EED problem. A modified version of MODE is used to tackle the extended dynamic EED problem. In MODE, an ensemble of selection method is implemented [31]. A new extended adaptive MODE algorithm is adopted by double selection and adaptive random restart operators to solve the EED problem. The efforts can avoid premature. Moreover, a new constraint handling technique is also implemented [32]. A DE algorithm based on the orthogonal design method and e-domination is implemented to solve the EED problem for the purpose of saving energy and protecting environment [33]. A summation based on the multi-objective differential evolution (SMODE) algorithm is used to optimize the EED problem with stochastic wind power [34]. An extended multi-objective binary DE algorithm is presented to solve the EED problem. A marginal correction is used to handle various constraints [35]. An enhanced multi-objective DE algorithm is presented to solve the EED problem to realize the aim of the minimization of fuel costs and emission effects. The operators of DE are modified and an elitist archive technique is used to retain the non-dominated solutions during the evolution [36]. The MODE algorithm is proposed to solve the EED problem, which uses an external elitist archive to retain non-dominated solutions during the evolution [37]. The modified differential evolution (MDE) uses five differential solutions instead of three like the conventional DE to solve the EED problem [38]. An improved multi-objective differential evolution algorithm contains the chaos initialization strategy, the parameter adaptive strategy and the dynamic non-dominated sorting strategy to address the EED problem [39]. A DE combined with Gaussian mutation (DEGM) is implemented to handle the EED problem [40].
In fact, the EED problem is a typical constraint multi-objective problem (MOP). Multi-objectives have to be solved and constraints have to be satisfied. Balancing objective optimization and constraint satisfaction are two equally important goals. In the above proposed algorithms based on the DE, there is only one mutation strategy used. In fact, the mutation strategy plays an important role during evolution. In the light of the no free lunch theorem, no single mutation strategy can outperform all others on every optimization problem [41]. In most DE variants, only mutation strategy is adopted to generate trial vector. Thus, the search ability is limited. In fact, different mutation strategies have different features. Chosen mutation strategies have distinct advantages and they can be effectively cooperated and combined to optimize different kinds of problems. The idea is widely used in single optimize problem [42]. Composite DE (CoDE) uses rand/1/bin, rand/2/bin and current-to-rand/1 to generate trial vectors. Simulation results have shown that CoDE is very competitive on all the CEC2005 test functions [42].Three mutation strategies DE/rand/1, DE/best/2 and DE/current-to-rand/1 are chosen to form a mutation strategy pool. Compared with conventional DE and adaptive DE algorithms, simulation results have proven that the ensemble method has achieved better performance [43]. As classical evolutionary programming (CEP) with Gaussian mutation is better at searching in a local neighborhood while the fast EP (FEP) with the Cauchy mutation performs better over a larger neighborhood, an ensemble approach is proposed by combining adaptive EP, Gaussian and Cauchy mutations, the experimental results have revealed that the ensemble is better than the single mutation-based algorithms [44]. Different mutation and update strategies are implemented in mDE-bES [45]. An ensemble of multiple strategies is realized by a multi-population based approach. Extensive experiments show that the proposed method is competitive [46]. An ensemble DE algorithm is proposed to classify electromagnetic targets in resonance scattering region. Compared with DE variants, the performance of the proposed algorithm is better [47]. Thus, all the above simulation results and evidences have clearly revealed that different strategies can be more appropriate and benefit can be derived from the availability of diverse strategies.
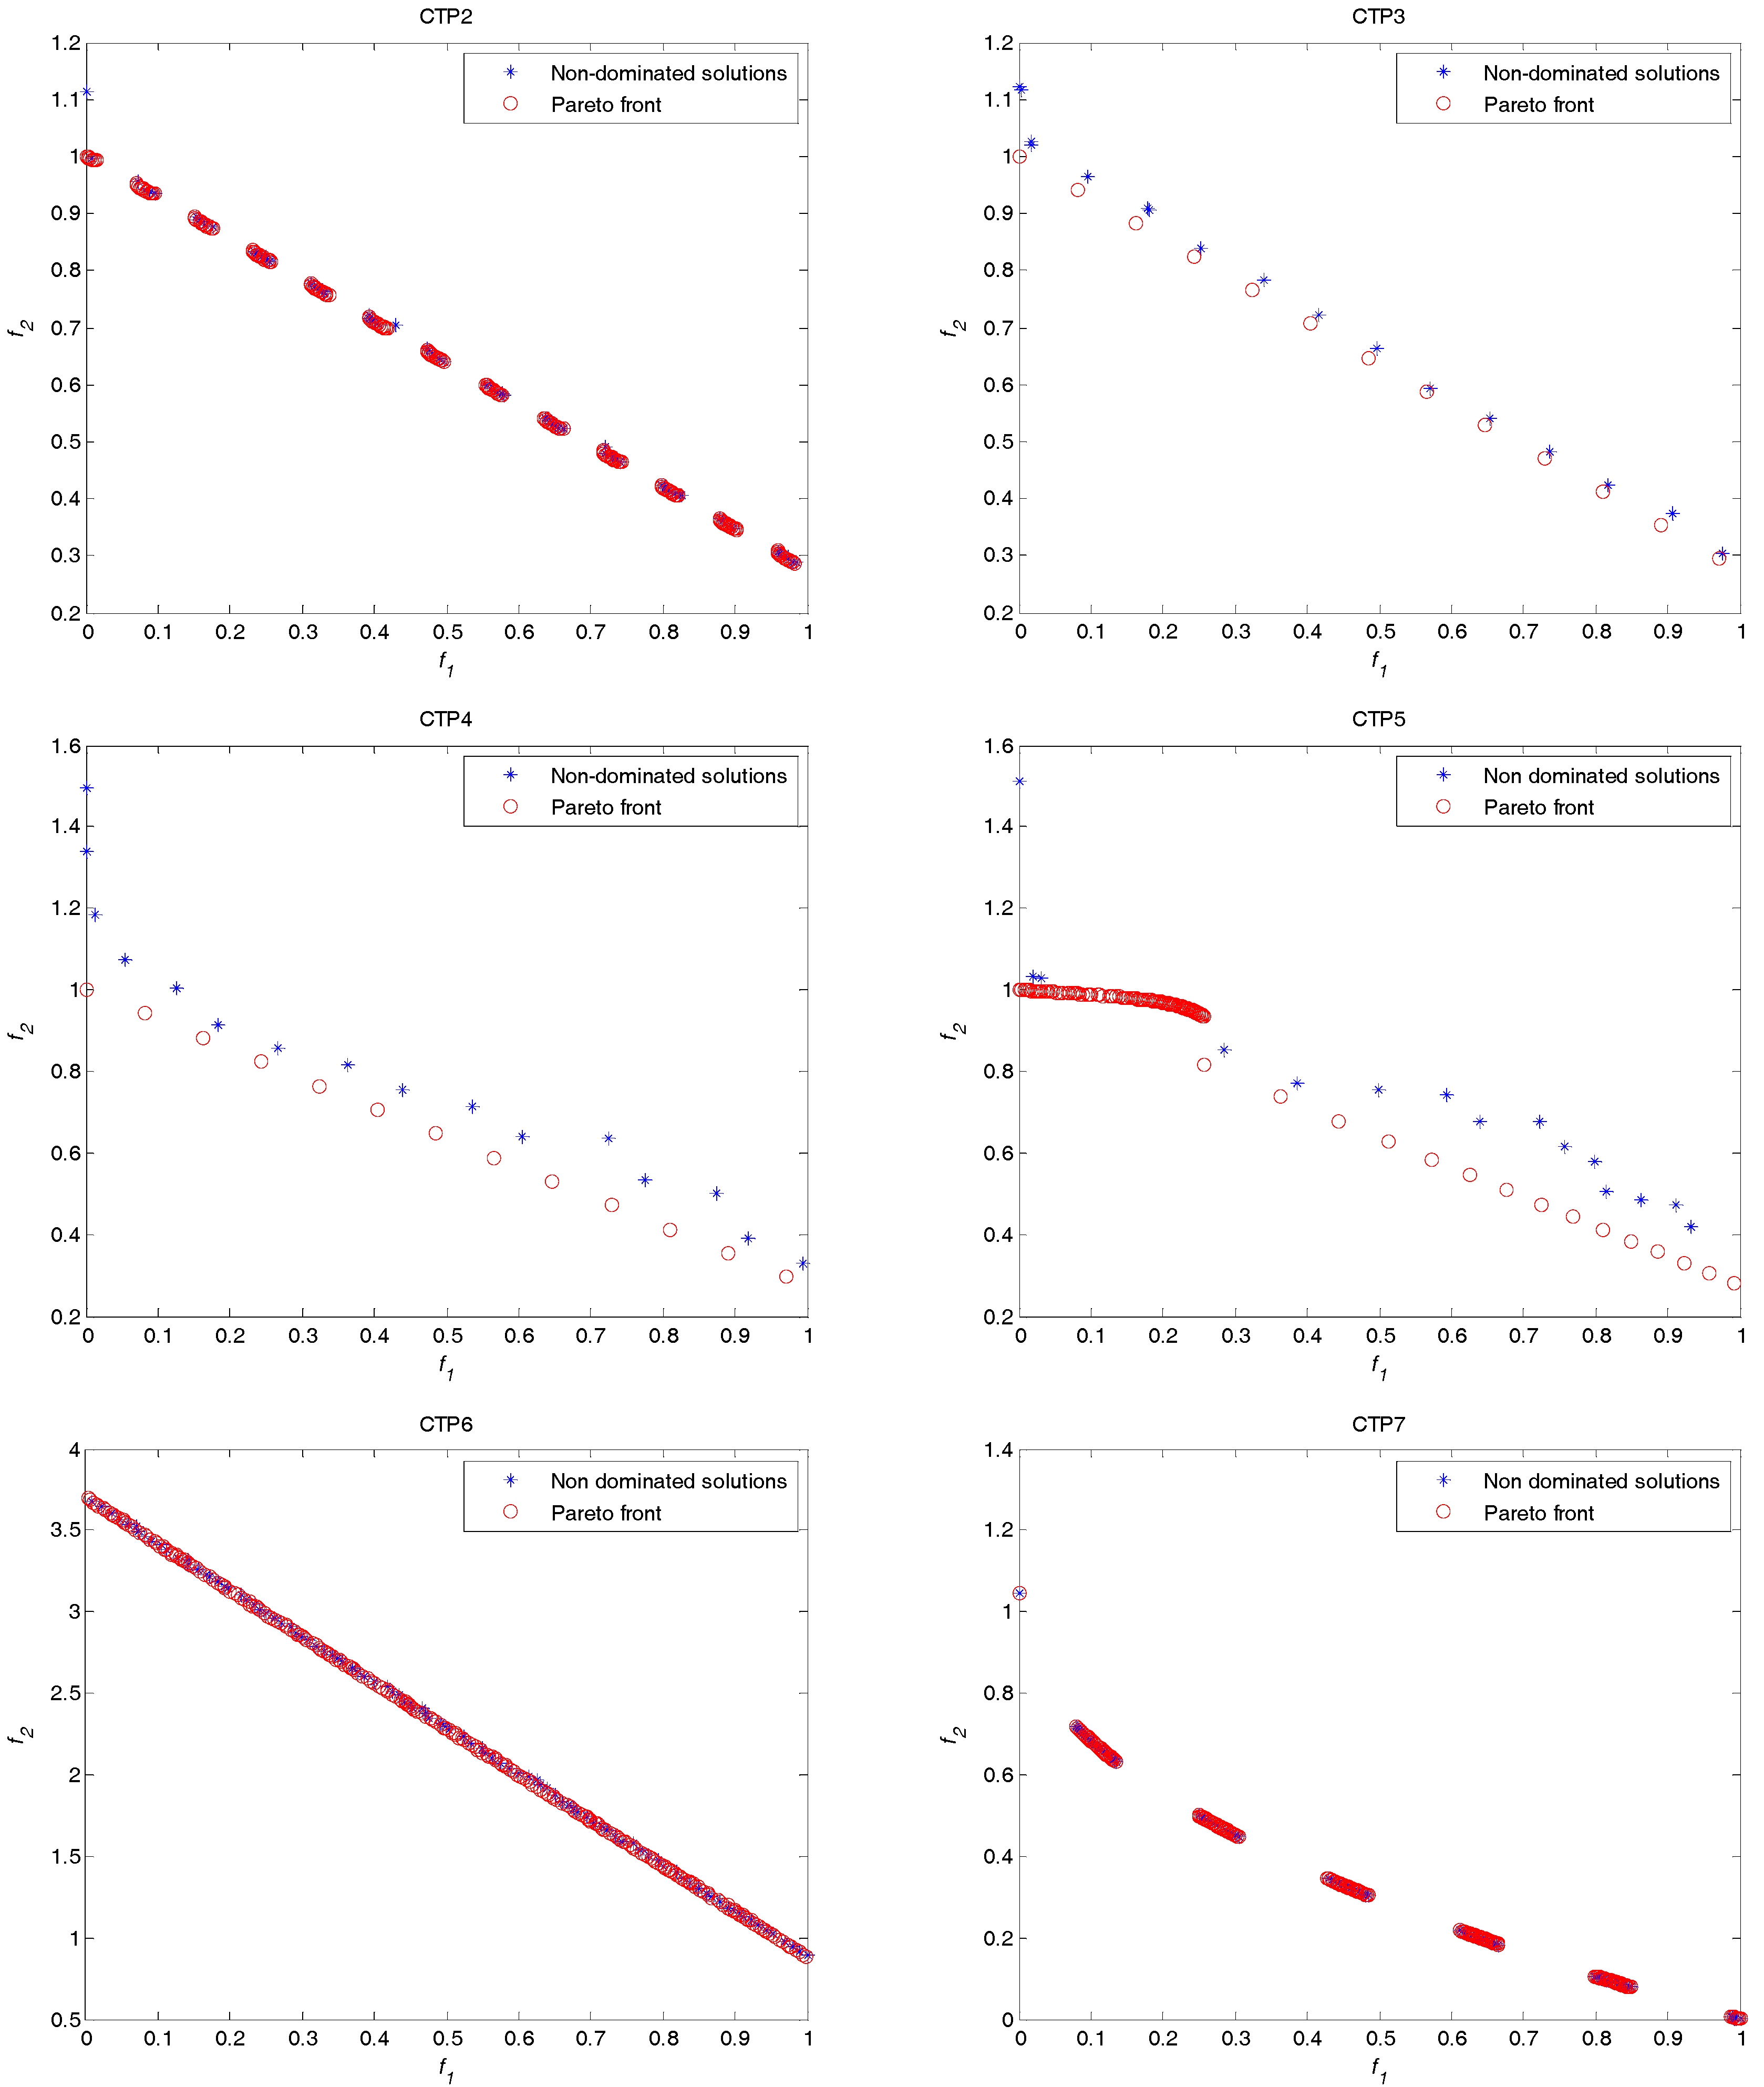
Based on the observation, the ensemble mutation strategies of the DE are implemented. As the multi-objective optimization problems are different from single optimization problems, Pareto theory is used to select best solutions. Thus, mutation strategies chosen are different from the single optimization problems. In addition, in order to cope with the equality constraints in the EED problem, a new mechanism is proposed by transforming the equality constraint into the inequality constraint. Next, the constraint domination principle is adopted to select these solutions to enter the next generation. By these efforts, a novel ensemble MODE (EMODE) is implemented to solve the EED problem. The primary advantage is that the proposed algorithm uses two different mutation operators. They have different features and can cooperate with each other to accelerate the optimization process while retaining the diversity of the population. To validate the performance of the proposed algorithm EMODE, it has been compared with the latest single optimization algorithms and MOEAs. Based on the benchmark test functions (CTP2~CTP7), the proposed algorithm is better than NSGAII [48] and MODE with mutation strategy DE/rand/1 according to the performance indicator Inverted Generational Distance (IGD). Then, the algorithm is used to solve the EED problem. Compared with the latest single optimization, the proposed algorithm is better than the recursive, PSO, DE and improved recursive. Compared with MOEAs, EMODE is better than MODE and SPEA 2. The NSGAII, PDE and EMODE have achieved similar performance. We can get the conclusion that the proposed algorithm is competitive.
The paper is organized as follows. In Section 2, the EED problem is briefly introduced. The conventional DE is presented and the proposed algorithm is developed in Section 3. In Section 4, experiments on the EED problem are performed. The study’s conclusions are presented in Section 5.

2. Economic Emission Dispatch (EED) Problem

The major aim of power companies is to schedule the generators’ output to satisfy the load requirements with minimum fuel costs without considering emissions. Currently, every country has begun to protect the environment from pollution. These power companies have to make alternative strategies to reduce pollutants such that they can meet the requirements of environmental protection. Otherwise, they will be severely punished. The EED problem is a typical MOP [10]. Addressing this problem requires simultaneously minimizing fuel costs and emission levels. Meanwhile, this approach has to meet certain constraints. First, some notations have to be presented such that the problem can be clearly explained. The notations are as follows [10]:
P G i : The output power of the i th generator
a i , b i , c i : The fuel cost coefficients of the i th generator
α i , β i , γ i : The emission coefficients of the i th generator
N G : The number of generators
P D : The total load demand
P l : The power losses
P G i m i n : The minimum power output of the i th generator
P G i m a x : The maximum power output of the i th generator
B i j : The loss coefficient between the i t h generator and the j th generator
F ( P G i ) : The total fuel costs function
E ( P G i ) : The total emissions function
F E : The total cost of generators
The total fuel costs function F ( P G i ) can be presented by the following equation
F ( P G i ) = i = 1 N G [ a i + b i P G i + c i P G i 2 ]
The emission may be SO2 or NOx. They are released by fossil fuels in power plants. The total emission function E ( P G i ) can be defined as
E ( P G i ) = i = 1 N G [ α i + β i P G i + γ i P G i 2 ]
Thus, the multi-objective of the EED problem can be given as follows:
F E = ( F ( P G i ) , E ( P G i ) )
When optimizing the EED problem, some constraints have to be met. The first one is power balance. The total power generated has to equal to the total power required and total power lost. It can be expressed as
i = 1 N G P G i = P D + P l , P l = i = 1 N G j = 1 N G P G i B i j P G j
The second constraint is the capacity constraint. The output power of every generator unit is constrained by the range limits:
P G i m i n P G i P G i m a x

3. Ensemble Multi-Objective Differential Evolution (EMODE)

3.1. Conventional DE

In the conventional DE, mutation, crossover and selection are very critical. The main framework of the DE is similar to the EAs, which is exhibited in Figure 1.
According to the main steps of the DE, V i = { v i 1 , v i 2 , , v i D , } and U i = { u i 1 , u i 2 , , u i D , } are the trial vectors, where D is the dimension of the problem. The former is generated by the mutation strategy in the mutation step. The latter is generated in the crossover step.
The mutation strategy plays an important role during evolution. Price and Storn employed the DE/rand/1/bin that has been widely used. The main strategies used in the DE algorithm are listed as follows [30]:
DE/best/1:
V i = X b e s t + F · ( X r 1 i X r 2 i )
DE/best/2:
V i = X b e s t + F · ( X r 1 i X r 2 i ) + F · ( X r 3 i X r 4 i )
DE/current-to-best/1:
V i = X i + F · ( X b e s t X i ) + F · ( X r 1 i X r 2 i )
DE/rand/:
V i = X r 1 i + F · ( X r 2 i X r 3 i )
DE/rand/2:
V i = X r 1 i + F · ( X r 2 i X r 3 i ) + F · ( X r 4 i X r 5 i )
DE/current-to-rand/1:
U i = X i + K · ( X r 1 i X i ) + F · ( X r 2 i X r 3 i )
The indices r 1 i ,   r 2 i ,   r 3 i are mutually exclusive integers. They are randomly generated within the range [0, 1]. The three of them have to be different from the index i. F and K are the mutation scale factors. Both of them are used to control the amplification of the differential variation.

3.2. EMODE Algorithm

3.2.1. Mutation Strategies

The performance of the DE relies on parameter values and the mutation strategy. On the basis of the no free lunch theorem, no single mutation strategy can outperform all others on every optimization problem [41]. Different optimization problems have different features. They demand different mutation strategies with different parameter values. Furthermore, to optimize a specific problem, different mutation strategies with different characteristics may be better than the conventional DE with a single mutation strategy [43]. Mutation strategies involved in the conventional DE are analyzed as follows.
The mutation strategies DE/best/1/bin, DE/rand-to-best/1/bin, DE/best/2/bin and DE/rand-to-best/2/bin have the best solution information that we have found so far. They are widely used in the single optimization problem. However, these strategies cannot be directly used to solve the multi-objective optimization problem since there are no best solution concepts. Those solutions with the lowest fronts also cannot dominate each other.
DE/rand/1 and DE/rand/2 have similar exploration capabilities. Nonetheless, DE/rand/1 was first developed for the DE and is one of the most widely and successful employed strategies. Thus, it is chosen as one of mutation strategies for the proposed algorithm.
DE/current-to-rand/1 is a rotational-invariant mutation strategy. This approach does not have crossover, which is significantly different from the above mutation strategies. Therefore, it is also chosen as the second mutation strategy.

3.2.2. Handling the Equality Constraints in EED Problem

In the EED problem, there are N G equality constraints. Generally, these equality constraints are converted into inequality constraints:
| h ( P G i ) | δ 0
h ( P G i ) = i = 1 N G P G i P D P l = i = 1 N G P G i P D i = 1 N G j = 1 N G P G i B i j P G j
where δ is the tolerance value for the equality constraints. According to [9], δ is a very small positive number, such as 0.0001. The absolute value operator can be removed by transforming Equation (13) into inequality constraints:
δ h ( P G i ) δ { h ( P G i ) δ h ( P G i ) δ
Thus, the total constraint violation (CV) can be expressed as follows:
C V ( P G i ) = m a x ( h ( P G i ) δ , 0 ) + m a x ( h ( P G i ) δ , 0 )
In the past decades, many techniques have been proposed to solve the constraints. These techniques mainly include the constraint domination principle [48] and penalty function [49].
Deb et al. proposed the constraint domination principle [48]. If two solutions are feasible, the solution that Pareto dominates the other solution is better. If two solutions are infeasible, the solution with the larger constraint violation is worse and the solution with the smaller constraint violation is better. If one solution is infeasible and the other solution is feasible, the feasible solution is better than the infeasible solution. The principle is similar to the feasibility rules that are used to address single objective constraint problems.
The penalty method is one of the simplest and most commonly used techniques to address constraint MOPs [49]. The penalty method introduces a penalty function or a coefficient into the original objective function to penalize those solutions that violate constraints. The main advantage of the penalty method is that the infeasible solutions will also have the opportunity to enter into following generations. The drawback is that when using the penalty method to solve constraint problems, it is still the most difficult method to find appropriate penalty coefficients, which guides the search direction towards the optimum.
However, the constraint domination principle prefers constraints to objectives. It is a greedy mechanism [50].The advantage of the principle is that it has the ability to motivate the population to the feasible regions and accelerate the optimization. In addition, the method does not need any penalty parameters, which makes it attractive. Thus, the approach is adopted to solve the constraints in the EED problem.

3.2.3. Solve the EED Problem by EMODE Algorithm

In the proposed algorithm, evolution can be implemented by the DE algorithm. The offspring population is generated by the DE operator. Then, the parent population and offspring population are combined to form a mating pool. The mating pool is divided into feasible solutions and infeasible solutions. These solutions are sorted in increasing order according to the respective objective function values and constraint violations. If the number of feasible solutions is more than the population size, the population will be directly selected from these solutions to enter in the next generation. Otherwise, some infeasible solutions with lower constraint violations will be chosen to enter the next generation.
According to the discussion above, the main procedure based on the EMODE to solve EED problem is presented as follows:
Step 1 
Initialize the parameters that include the mutation scale factor F, the crossover rate CR, the maximum iteration numbers and number in the population (NP).
Step 2 
Randomly generate NP individuals p = { X 1 , G , , X N P , G , } uniformly distributed in the range [ P G m i n , P G m a x ] , where P G m i n = { P G 1 m i n , P G 2 m i n , , P G i m i n } and P G m a x = { P G 1 m a x , P G 2 m a x , , P G i m a x } .
Step 3 
Calculate fuel costs and emissions according to Equations (2) and (3) and, total constraint violations CV based on Equation (16).
Step 4 
while stopping criterion is not met
Step 4.1 
Generate two vectors V i , G 1 , V i , G 2 according to Equations (10) and (12).
Step 4.2 
Generate two vectors U i , G 1 , U i , G 2 according to the DE crossover.
Step 4.3 
If the trial vectors U i , G 1 , U i , G 2 cannot meet the constraints of Equation (6); randomly generate them within the search space
Step 4.4 
Selection
Calculate fuel costs and emissions according to Equations (2) and (3) and, the total constraint violations CV based on Equation (16) of U i , G 1 , U i , G 2 respectively.
M P = ( p , U i , G 1 , U i , G 2 ) ;// combine p and U i , G 1 , U i , G 2 to form a mating pool (MP).
( p 1 , p 2 ) = s p l i t ( M P ) ;//feasible solutions ( p 1 ) and infeasible solutions ( p 2 )
If ( size ( p 1 ) N P )
  • Select NP individuals from p 1 by the non-dominated and crowding distance sorting and store these individuals in the current population p
End
If s i z e ( p 1 ) < N P
  • Sort p 2 by CV
  • p = p 1 + p 2 ( N P s z i e ( p 1 ) ) ;
End
Step 5 
End while
Step 6 
Select non-dominated solutions from p and output the corresponding results.
To clearly reveal the proposed algorithm, Figure 2 illustrates the main steps.

4. Experiment Results

4.1. Experiments Based on Benchmark Functions

To verify the performance of the proposed algorithm, six benchmark functions (CTP2, CTP3, CTP4, CTP5, CTP6 and CTP7) are adopted [51]. They are presented in Equation (17). The parameters settings are listed in Table 1.
Minimize f 1 ( x ) = x 1 Minimize f 2 ( x ) = g ( x ) ( 1 f 1 ( x ) g ( x ) ) subject   to c ( x ) = cos ( θ ) ( f 2 ( x ) e ) sin ( θ ) f 1 ( x ) a | sin ( b π ( sin ( θ ) ( f 2 ( x ) e ) + cos ( θ ) f 1 ( x ) ) c ) | d g ( x ) = 1 + i = 2 10 [ x i 2 10 cos ( 2 π x i ) + 10 ] , x [ 0 , 1 ]
The MODE algorithm based on mutation strategies DE/rand/1 is used to make comparisons. In addition, NSGAII with the constraint domination principle is also selected. The Inverted Generational Distance (IGD) is adopted as a performance indicator, which is widely used in MOEAs.
IGD = v P A d ( v , P A ) | P |
where d ( v , P A ) is the minimum Euclidean distance between v and the points in P A [60, 61] depicted in Figure 3 [52].
Each algorithm runs 25 times. The NSGAII is implemented based on the GA. All the parameters are the same, including the crossover probability 0.9, the mutation probability 0.1, the mutation distribution index 20 and the population size 100. For the proposed method, the population size is set to 100, F linearly decreases from 1.0 to 0.7 and CR linearly increases from 0.4 to 0.8. The stopping criterion is set at 500 generations for the above four methods.

Results and Discussion

The results of IGD are presented in Table 2. The complexities of constrained search space are controlled. The complexity of the test functions can be further increased by using a multi-modal function g(x). It is difficult to find and maintain correlated decision variables to fall on the constrained boundaries. In addition, there could be other difficulties near the real Pareto front. The constraints can make the real Pareto front become a set of discrete regions. At the extreme, the real Pareto front can become a collection of discrete solutions. It can be observed that the proposed algorithm has achieved the best IGD on CTP2, CTP4, CTP5, CTP6 and CTP7. The NSGAII obtained superior results on CTP3. Since NSGAII and DE algorithm with rand/1 mutation strategy get trapped in the local feasible regions in some runs, the performance of the two methods is bad. The reason is that the constrained complexities make the two methods unable to overcome a series of infeasible regions before coming to inland with the Pareto front. However, the proposed algorithm can accelerate the whole process with the help of ensemble mutation strategies. The non-dominated solutions obtained by the proposed algorithm and the Pareto front are presented in Figure 4. These non-dominated solutions are uniformly distributed along the Pareto front of each test functions. By the comparisons and experimental results, it can be concluded that ensemble mutation strategies are effective and the proposed algorithm is competitive.

4.2. Experiments Based on Typical EED Problems

To evaluate the performance of the proposed algorithm EMODE, it has been used to solve the EED problem by considering the following three test systems. The three test systems have been widely used as benchmark functions. The results from various optimization methods can make fair and faithful comparisons based on the benchmark functions. In the three test systems, the population size of the proposed EMODE is set to 200, F linearly decreases from 1.0 to 0.7 and CR linearly increases from 0.4 to 0.8. The maximum number of iterations is set to 1000.

Results and Discussion

(1) The first test system with six generators
The test system has six generators. It has quadratic cost functions and emission level functions. The power demands range from 500 MW to 1100 MW. They are 500 MW, 600 MW, 700 MW, 800 MW, 900 MW, 1000 MW and 1100 MW. In this test system, the loss coefficients and power loss are not taken into account. The coefficients are listed in Table 3. To make comparisons, the recursive method, PSO, DE and improved recursive method are selected to optimize the test system. The results of the above four methods are directly taken from [11]. The results from the proposed method and the four methods are presented in Table 4. The best results obtained are highlighted in bold.
It can be observed that the proposed algorithm EMODE has achieved the best results in the six generators test system with different required loads. For example, when the load demand is 1100, the fuel costs are 56,518$ and emissions are 451.3 kg. Meanwhile, the recursive and improved recursive methods have achieved the same performance and can be ranked as the second best. The PSO has the worst performance. Thus, the best compromised results from the proposed method are significantly better than other four methods. The finding has revealed that the proposed method can accelerate optimization while retaining population diversity. The best compromised solutions are given in Table 5.
In order to further validate the effectiveness of the proposed method, the set coverage is introduced. The performance index can be used to compare the difference between two algorithms. Let A and B be two non-dominated solutions. C(A,B) is defined as the percentage of the solutions in B that are dominated by at least one solution in A:
C ( A , B ) = { u B | v A v   d o m i n a t e s   u } | B |
where | B | is the number of solutions in the B [52]. C(A,B) is not necessarily to 1 − C(B,A). If C(A,B) = 1 indicates that all solutions in B are dominated by some solutions in A. If C(A,B) = 0 implies that no solution in B is dominated by a solution in A. The results of set coverage between EMODE and four algorithms are listed in Table 6. It can be noticed that all set coverage is equal to 1, which indicates that all solutions generated by the four algorithms are dominated by some solutions generated by EMODE. As EMODE is the multi-objective evolutionary algorithm, it can obtain multiple non-dominated solutions in a single run. Thus, we can get the conclusion that EMODE is better than the four algorithms.
(2) Test systems with eleven generators
The second test system has eleven generators. It also has quadratic cost functions and emission level functions. The power demands range from 1000 MW to 2500 MW. They are 1000 MW, 1250 MW, 1500 MW, 1750 MW, 2000 MW, 2250 MW and 2500 MW. The coefficients are listed in Table 7. It is noticed that the loss coefficients and power loss are also not taken into account. The results from above five methods are listed in Table 8. It can be observed that the proposed method outperforms the other four methods that include two recursive methods and two heuristic methods. We take demand = 2500 as an example. In the proposed method, fuel costs are 12,403$ and emissions are 902.2 kg. Therefore, it is better than other four optimization methods. The best compromise solutions are given in Table 9.
In order to further validate the performance of the proposed algorithm, γ -iteration, GA and gravitational search algorithm (GSA) [53] are also chosen to make comparisons [12]. The power demand is 2500. The coefficients are same to Table 7. The comparisons results are listed in Table 10. It can be observed that the result of EMODE is better than γ -iteration, GA and GSA.
(3) Test systems considering the power lost
This test system is different from the above two test systems. The power lost is considered. It has six generators, too. The coefficients are the same as Table 3. The B matrix of the loss formula is as follows:
B = [ 0.000140 0.000017 0.000015 0.000019 0.000026 0.000022 0.000017 0.000060 0.000013 0.000016 0.000015 0.000020 0.000015 0.000013 0.000065 0.000017 0.000024 0.000019 0.000019 0.000016 0.000017 0.000071 0.000030 0.000025 0.000026 0.000015 0.000024 0.000030 0.000069 0.000032 0.000022 0.000020 0.000019 0.000025 0.000032 0.000085 ]
The proposed method is compared with four MOEAs, including the NSGAII, PDE, SPEA 2 and MODE. The results of the four MOEAs are directly taken from [54]. To make a fair comparison, the functional evaluation numbers are same. The best compromise solutions and results from the five MOEAs are presented in Table 11. It can be observed that the EMODE has achieved 64,827$ costs, which is the smallest among the five methods. The emissions are 582.9 kg, which is a littler worse than the results from NSGAII and PDE. However, the result is better the results from the SPEA 2 and MODE and it can dominate their results. Thus, the proposed method is better than the SPEA 2 and MODE in the third test system.

5. Conclusions

The EED problem is a typical constraint MOP. The two objectives are fuel costs and emissions. They conflict with each other. A novel EMODE is proposed to solve the EED problem. The proposed algorithm converts the equality constraints of the EED problem into the inequality constraints. Then, the two mutation strategies DE/rand/1 and DE/current-to-rand/1 are implemented in the EMODE. The proposed algorithm can accelerate optimization while retaining the diversity of the population.
The performance of the proposed algorithm is evaluated using six benchmark test functions and the numerical results have indicated that the proposed algorithm is effective. Then, the proposed algorithm has been tested on a series of six generators and eleven generators EED problems. Compared with the latest single optimization, the proposed algorithm is better than the recursive, PSO, DE and improved recursive. Compared with MOEAs, EMODE is better than MODE and SPEA 2. The NSGAII, PDE and EMODE have achieved similar performance. The results have demonstrated that the proposed algorithm can provide high quality solutions. It can be observed that the proposed algorithm is a promising algorithm to solve the EED problem. It can provide an approach to realize the transition from China-Made to China-Innovation.

Acknowledgments

This study was funded by China Natural Science Foundation (grant number. 71503134, 71774088, 71571104), Key Project of National Social and Scientific Fund Program (16ZDA047) and philosophy and Social Sciences in Universities of Jiangsu (grant number. 2016SJB630016).

Author Contributions

Xiaobing Yu conceived the research and drafted, edited and revised the manuscript. Xianrui Yu designed the experiments; Yiqun Lu performed the experiments; Jichuan Sheng analyzed the data.

Conflicts of Interest

The authors declare no conflict of interest.

References

  1. Chen, X.; Gong, Z. Dea efficiency of energy consumption in china’s manufacturing sectors with environmental regulation policy constraints. Sustainability 2017, 9, 210. [Google Scholar] [CrossRef]
  2. Dhanalakshmi, S.; Kannan, S.; Mahadevan, K.; Baskar, S. Application of modified NSGA-II algorithm to combined economic and emission dispatch problem. Int. J. Electr. Power Energy Syst. 2011, 33, 992–1002. [Google Scholar] [CrossRef]
  3. Tan, X.; Gong, Z.; Huang, M.; Wang, Z.J. Selecting cooking methods to decrease persistent organic pollutant concentrations in food of animal origin using a consensus decision-making model. Int. J. Environ. Res. Public Health 2017, 14. [Google Scholar] [CrossRef] [PubMed]
  4. Chen, T. Competitive and sustainable manufacturing in the age of globalization. Sustainability 2016, 9, 26. [Google Scholar] [CrossRef]
  5. Zhu, X.; Gu, R.; Wu, B.; Managi, S. Does hazy weather influence earnings management of heavy-polluting enterprises? A chinese empirical study from the perspective of negative social concerns. Sustainability 2017, 9, 2296. [Google Scholar] [CrossRef]
  6. Gong, Z.; Xu, X.; Zhang, H.; Aytun Ozturk, U.; Herrera-Viedma, E.; Xu, C. The consensus models with interval preference opinions and their economic interpretation. Omega 2015, 55, 81–90. [Google Scholar] [CrossRef]
  7. Gong, Z.W.; Chen, X.Q. Analysis of interval data envelopment efficiency model considering different distribution characteristics-based on environmental performance evaluation of the manufacturing industry. Sustainability 2017, 9, 2080. [Google Scholar]
  8. Labbi, Y.; Ben Attous, D. Environmental/economic power dispatch using a hybrid big bang–big crunch optimization algorithm. Int. J. Syst. Assur. Eng. Manag. 2013, 5, 602–610. [Google Scholar] [CrossRef]
  9. Wang, Y.; Cai, Z. Constrained evolutionary optimization by means of (μ + λ)-differential evolution and improved adaptive trade-off model. Evol. Comput. 2011, 19, 249–285. [Google Scholar] [CrossRef] [PubMed]
  10. Qu, B.Y.; Zhu, Y.S.; Jiao, Y.C.; Wu, M.Y.; Suganthan, P.N.; Liang, J.J. A survey on multi-objective evolutionary algorithms for the solution of the environmental/economic dispatch problems. Swarm Evol. Comput. 2017, 38, 1–11. [Google Scholar] [CrossRef]
  11. Balamurugan, R.; Subramanian, S. A simplified recursive approach to combined economic emission dispatch. Electr. Power Compon. Syst. 2007, 36, 17–27. [Google Scholar] [CrossRef]
  12. Güvenç, U.; Sönmez, Y.; Duman, S.; Yörükeren, N. Combined economic and emission dispatch solution using gravitational search algorithm. Sci. Iran. 2012, 19, 1754–1762. [Google Scholar] [CrossRef]
  13. Kenan Dosoglu, M.; Guvenc, U.; Duman, S.; Sonmez, Y.; Tolga Kahraman, H. Symbiotic organisms search optimization algorithm for economic/emission dispatch problem in power systems. Neural Comput. Appl. 2018, 29, 721–737. [Google Scholar] [CrossRef]
  14. Jayabarathi, T.; Kolipakula, R.T.; Krishna, M.V.; Yazdani, A. Application and comparison of pso, its variants and hde techniques to emission/economic dispatch. Arabian J. Sci. Eng. 2013, 39, 967–976. [Google Scholar] [CrossRef]
  15. Roy, P.K.; Ghoshal, S.P.; Thakur, S.S. Combined economic and emission dispatch problems using biogeography-based optimization. Electr. Eng. 2010, 92, 173–184. [Google Scholar] [CrossRef]
  16. Aydin, D.; Özyön, S.; Yaşar, C.; Liao, T. Artificial bee colony algorithm with dynamic population size to combined economic and emission dispatch problem. Int. J. Electr. Power Energy Syst. 2014, 54, 144–153. [Google Scholar] [CrossRef]
  17. Ziane, I.; Benhamida, F.; Graa, A. Simulated annealing algorithm for combined economic and emission power dispatch using max/max price penalty factor. Neural Comput. Appl. 2017, 28 (Suppl. 1), 197–205. [Google Scholar] [CrossRef]
  18. Chatterjee, A.; Ghoshal, S.P.; Mukherjee, V. Solution of combined economic and emission dispatch problems of power systems by an opposition-based harmony search algorithm. Int. J. Electr. Power Energy Syst. 2012, 39, 9–20. [Google Scholar] [CrossRef]
  19. Hamedi, H. Solving the combined economic load and emission dispatch problems using new heuristic algorithm. Int. J. Electr. Power Energy Syst. 2013, 46, 10–16. [Google Scholar] [CrossRef]
  20. Liang, Y.-C.; Cuevas Juarez, J.R. A normalization method for solving the combined economic and emission dispatch problem with meta-heuristic algorithms. Int. J. Electr. Power Energy Syst. 2014, 54, 163–186. [Google Scholar] [CrossRef]
  21. Modiri-Delshad, M.; Rahim, N.A. Multi-objective backtracking search algorithm for economic emission dispatch problem. Appl. Soft Comput. 2016, 40, 479–494. [Google Scholar] [CrossRef]
  22. Xiong, G.; Shi, D.; Duan, X. Multi-strategy ensemble biogeography-based optimization for economic dispatch problems. Appl. Energy 2013, 111, 801–811. [Google Scholar] [CrossRef]
  23. Niknam, T.; Azizipanah-Abarghooee, R.; Roosta, A.; Amiri, B. A new multi-objective reserve constrained combined heat and power dynamic economic emission dispatch. Energy 2012, 42, 530–545. [Google Scholar] [CrossRef]
  24. Ghasemi, M.; Aghaei, J.; Akbari, E.; Ghavidel, S.; Li, L. A differential evolution particle swarm optimizer for various types of multi-area economic dispatch problems. Energy 2016, 107, 182–195. [Google Scholar] [CrossRef]
  25. El-Sobky, B.; Abo-Elnaga, Y. Multi-objective economic emission load dispatch problem with trust-region strategy. Electr. Power Syst. Res. 2014, 108, 254–259. [Google Scholar] [CrossRef]
  26. Hadji, B.; Mahdad, B.; Srairi, K.; Mancer, N. Multi-objective pso-tvac for environmental/economic dispatch problem. Energy Procedia 2015, 74, 102–111. [Google Scholar] [CrossRef]
  27. Liu, T.; Jiao, L.; Ma, W.; Ma, J.; Shang, R. Cultural quantum-behaved particle swarm optimization for environmental/economic dispatch. Appl. Soft Comput. 2016, 48, 597–611. [Google Scholar] [CrossRef]
  28. Zhang, Y.; Gong, D.-W.; Ding, Z. A bare-bones multi-objective particle swarm optimization algorithm for environmental/economic dispatch. Inf. Sci. 2012, 192, 213–227. [Google Scholar] [CrossRef]
  29. Nuaekaew, K.; Artrit, P.; Pholdee, N.; Bureerat, S. Optimal reactive power dispatch problem using a two-archive multi-objective grey wolf optimizer. Expert Syst. Appl. 2017, 87, 79–89. [Google Scholar] [CrossRef]
  30. Yu, X.; Wang, X. A novel hybrid classification framework using svm and differential evolution. Soft Comput. 2016, 21, 4029–4044. [Google Scholar] [CrossRef]
  31. Qu, B.Y.; Liang, J.J.; Zhu, Y.S.; Suganthan, P.N. Solving dynamic economic emission dispatch problem considering wind power by multi-objective differential evolution with ensemble of selection method. Nat. Comput. 2017. [Google Scholar] [CrossRef]
  32. Jiang, X.; Zhou, J.; Wang, H.; Zhang, Y. Dynamic environmental economic dispatch using multiobjective differential evolution algorithm with expanded double selection and adaptive random restart. Int. J. Electr. Power Energy Syst. 2013, 49, 399–407. [Google Scholar] [CrossRef]
  33. Xu, K.; Zhou, J.; Zhang, Y.; Gu, R. Differential evolution based on ε-domination and orthogonal design method for power environmentally-friendly dispatch. Expert Syst. Appl. 2012, 39, 3956–3963. [Google Scholar] [CrossRef]
  34. Qu, B.Y.; Liang, J.J.; Zhu, Y.S.; Wang, Z.Y.; Suganthan, P.N. Economic emission dispatch problems with stochastic wind power using summation based multi-objective evolutionary algorithm. Inf. Sci. 2016, 351, 48–66. [Google Scholar] [CrossRef]
  35. Di, Y.; Fei, M.; Wang, L.; Wu, W. Multi-objective optimization for economic emission dispatch using an improved multi-objective binary differential evolution algorithm. Energy Procedia 2014, 61, 2016–2021. [Google Scholar] [CrossRef]
  36. Lu, Y.; Zhou, J.; Qin, H.; Wang, Y.; Zhang, Y. Environmental/economic dispatch problem of power system by using an enhanced multi-objective differential evolution algorithm. Energy Convers. Manag. 2011, 52, 1175–1183. [Google Scholar] [CrossRef]
  37. Wu, L.H.; Wang, Y.N.; Yuan, X.F.; Zhou, S.W. Environmental/economic power dispatch problem using multi-objective differential evolution algorithm. Electr. Power Syst. Res. 2010, 80, 1171–1181. [Google Scholar] [CrossRef]
  38. Dinh, B.H.; Nguyen, T.T. New solutions to modify the differential evolution method for multi-objective load dispatch problem considering quadratic fuel cost function. In AEAT 2016: Recent Advances in Electrical Engineering and Related Sciences: Theory and Application; Duy, V.H., Dao, T.T., Kim, S.B., Tien, N.T., Zelinka, I., Eds.; Springer: Berlin, Germay, 2017; Volume 415, pp. 598–607. [Google Scholar]
  39. Xia, S.; Xu, Y.; Ge, X. An improved multi-objective differential evolution algorithm for active power dispatch in power system with wind farms. In ICSEE 2017: Advanced Computational Methods in Energy, Power, Electric Vehicles, and Their Integration; Li, K., Xue, Y., Cui, S., Niu, Q., Yang, Z., Luk, P., Eds.; Springer: Berlin, Germay, 2017; Volume 763, pp. 643–652. [Google Scholar]
  40. Basu, M.; Jena, C.; Panigrahi, C.K. Differential evolution with gaussian mutation for economic dispatch. J. Inst. Eng. (India) Ser. B 2015, 97, 493–498. [Google Scholar] [CrossRef]
  41. Mallipeddi, R.; Suganthan, P.N. Ensemble of constraint handling techniques. IEEE Trans. Evol. Comput. 2010, 14, 561–579. [Google Scholar] [CrossRef]
  42. Wang, Y.; Cai, Z.; Zhang, Q. Differential evolution with composite trial vector generation strategies and control parameters. IEEE Trans. Evol. Comput. 2011, 15, 55–66. [Google Scholar] [CrossRef]
  43. Mallipeddi, R.; Suganthan, P.N.; Pan, Q.K.; Tasgetiren, M.F. Differential evolution algorithm with ensemble of parameters and mutation strategies. Appl. Soft Comput. 2011, 11, 1679–1696. [Google Scholar] [CrossRef]
  44. Mallipeddi, R.; Mallipeddi, S.; Suganthan, P.N. Ensemble strategies with adaptive evolutionary programming. Inf. Sci. 2010, 180, 1571–1581. [Google Scholar] [CrossRef]
  45. Ali, M.Z.; Awad, N.H.; Suganthan, P.N. Multi-population differential evolution with balanced ensemble of mutation strategies for large-scale global optimization. Appl. Soft Comput. 2015, 33, 304–327. [Google Scholar] [CrossRef]
  46. Wu, G.; Mallipeddi, R.; Suganthan, P.N.; Wang, R.; Chen, H. Differential evolution with multi-population based ensemble of mutation strategies. Inf. Sci. 2016, 329, 329–345. [Google Scholar] [CrossRef]
  47. Secmen, M.; Tasgetiren, M.F. Ensemble of differential evolution algorithms for electromagnetic target recognition problem. IET Radar Sonar Navig. 2013, 7, 780–788. [Google Scholar] [CrossRef]
  48. Deb, K.; Pratap, A.; Agarwal, S.; Meyarivan, T. A fast and elitist multiobjective genetic algorithm: NSGA-II. IEEE Trans. Evol. Comput. 2002, 6, 182–197. [Google Scholar] [CrossRef]
  49. Woldesenbet, Y.G.; Yen, G.G.; Tessema, B.G. Constraint handling in multiobjective evolutionary optimization. IEEE Trans. Evol. Comput. 2009, 13, 514–525. [Google Scholar] [CrossRef]
  50. Wang, Y.; Wang, B.C.; Li, H.X.; Yen, G.G. Incorporating objective function information into the feasibility rule for constrained evolutionary optimization. IEEE Trans. Cybern. 2016, 46, 2938–2952. [Google Scholar] [CrossRef] [PubMed]
  51. Deb, K.; Pratap, A.; Meyarivan, T. Constrained test problems for multi-objective evolutionary optimization. In Evolutionary Multi-Criterion Optimization; Hutchison, D., Ed.; Springer: Berlin/Heidelberg, Germany, 2001; pp. 284–298. [Google Scholar]
  52. Qingfu, Z.; Hui, L. Moea/d: A multiobjective evolutionary algorithm based on decomposition. IEEE Trans. Evol. Comput. 2007, 11, 712–731. [Google Scholar] [CrossRef]
  53. Rashedi, E.; Nezamabadi-pour, H.; Saryazdi, S. Gsa: A gravitational search algorithm. Inf. Sci. 2009, 179, 2232–2248. [Google Scholar] [CrossRef]
  54. Basu, M. Economic environmental dispatch using multi-objective differential evolution. Appl. Soft Comput. 2011, 11, 2845–2853. [Google Scholar] [CrossRef]
Figure 1. Flowchart of the conventional DE.
Sustainability 10 00418 g001
Figure 2. Flowchart of the proposed algorithm.
Sustainability 10 00418 g002
Figure 3. Generational distance measurement.
Sustainability 10 00418 g003
Figure 4. Comparisons between non-dominated solutions and the Pareto front.
Sustainability 10 00418 g004
Table 1. Parameters of the second group test functions.
FunctionsParameters
CT2 θ = 0.2 π , a = 0.20 , b = 10.0 , c = 1 , d = 6.0 , e = 1
CT3 θ = 0.2 π , a = 0.10 , b = 10.0 , c = 1 , d = 0.5 , e = 1
CT4 θ = 0.2 π , a = 0.75 , b = 10.0 , c = 1 , d = 0.5 , e = 1
CT5 θ = 0.2 π , a = 0.75 , b = 10.0 , c = 2 , d = 0.5 , e = 1
CT6 θ = 0.1 π , a = 40.00 , b = 0.5 , c = 1 , d = 2.0 , e = 2
CT7 θ = 0.05 π , a = 40.00 , b = 5.0 , c = 1 , d = 6.0 , e = 0
Table 2. The IGD metric of three algorithms.
IGDNSGAIIDE/rand/1EMODE
CTP24.63 × 10−3 (6.76 × 10⁻⁶)2.78 × 10⁻³ (4.27 × 10⁻⁸)2.35 × 10⁻³ (3.04 × 10⁻⁸)
CTP31.18 × 10−2 (2.10 × 10⁻⁴)4.13 × 10⁻² (1.36 × 10⁻³)1.92 × 10⁻² (4.21 × 10⁻⁶)
CTP41.20 × 10−1 (1.53 × 10⁻³)8.4 × 10⁻² (5.13 × 10⁻⁵)8.81 × 10⁻² (1.18 × 10⁻⁴)
CTP51.35 × 10−1 (1.62 × 10⁻³)1.054 × 10⁻¹ (4.53 × 10⁻⁴)9.90 × 10⁻² (1.26 × 10⁻⁵)
CTP61.03 × 10−2 (2.41 × 10⁻⁵)1.16 × 10⁻¹ (7.70 × 10⁻²)9.62 × 10⁻³ (1.43 × 10⁻⁷)
CTP72.10 × 10−3 (7.16 × 10⁻⁶)6.73 × 10⁻² (5.24 × 10⁻³)1.04 × 10⁻³ (3.10 × 10⁻⁹)
Table 3. Coefficients of the six-unit generator.
Unit a i b i c i α i β i γ i P G i min P G i max
1756.80038.5400.152513.8600.33000.004210125
2451.32546.1600.106013.8600.33000.004210150
31050.00040.4000.028040.267−0.54550.006835225
41243.53038.3100.035540.267−0.54550.006835210
51658.57036.3280.021142.900−0.51120.0046130325
61356.66038.2700.018042.900−0.51120.0046125315
Table 4. Comparison of fuel costs and emission for the six-generator system (Cost: unit $ and Emission: unit kg).
LoadRecursivePSODEImproved RecursiveEMODE
Cost EmissionCost EmissionCost EmissionCost EmissionCost Emission
50027,093118.727,098118.927,098118.827,093118.727,073118.5
60032,627153.827,098154.131,629153.831,629153.831,621153.3
70036,314197.031,635197.136,314197.136,314197.036,312196.4
80041,148248.536,314248.541,153248.541,148248.541,144248.1
90046,132308.141,160308.346,132308.146,132308.146,104307.9
100051,265375.951,27037651,265375.951,265375.951,257375.6
110056,546451.956,557451.856,547451.956,546451.956,518451.3
Table 5. EED solutions of the six-generator system.
Load50060070080090010001100
P125.757336.713650.115460.329069.086583.522092.5939
P211.530625.909437.328852.539465.888978.501593.0328
P387.2611103.6695119.5007133.4621150.9331158.9832179.3460
P490.5584104.5445120.1008131.7089149.9904168.0432182.2870
P5145.4741168.0550188.8845214.5138233.1996257.4707274.9088
P6139.4184161.1081184.0696207.4469230.9015253.4795277.8315
Time(s)5.37.67.98.07.88.17.9
Table 6. The results of set coverage between EMODE and four algorithms.
C(EMODE, Algorithm)RecursivePSODEImproved Recursive
EMODE1111
Table 7. Coefficients of the eleven-unit generator.
Unit a i b i c i α i β i γ i P G i min P G i max
1387.851.926990.0076233.93−0.677670.0041920250
2441.622.119690.0083824.62−0.690440.0046120210
3422.572.191960.0052333.93−0.677670.0041920250
4552.502.019830.0014027.14−0.545510.0068360300
5557.752.121810.0015424.15−0.400600.0075120210
6562.181.915280.0017727.14−0.545510.0068360300
7568.392.106810.0019524.15−0.400060.0075120215
8682.931.991380.0010630.45−0.511160.00355100455
9741.221.998020.0011725.59−0.562280.00417100455
10617.832.123520.0008930.45−0.411160.00355110460
11674.612.104870.0009925.59−0.562280.00417110465
Table 8. Comparison of fuel costs and emissions for the eleven-generator system.
Load 1000125015001750200022502500
RecursiveCosts8502.39108.49733.510,37811,04111,72312,424
Emissions93.1154.2245.2366.1517.1697.9908.7
PSOCosts85089114973710,38011,04111,72512,429
Emissions94.3156.8247.3368.7518.1698.8911.6
DECosts85069118973610,37711,04111,72312,425
Emissions93.1154.2246.9366.1517.1697.9908.7
Improved RecursiveCosts8502.39108.49733.510,377.811,04111,72312,425
Emissions93.1154.2245.2366.1517.1697.9908.9
EMODECosts8496.791079730.110,36911,02011,71812,403
Emissions93.1151.8240.9361.9516.6685.8902.2
Table 9. EED solutions of the eleven-generator system.
Load1000125015001750200022502500
P186.414395.9372102.9861108.3956118.1331128.3625128.7609
P272.967486.505786.485395.917298.7609101.8583118.5395
P390.400896.3682115.3208122.5703124.8677152.8952144.9564
P482.705898.2494119.8692139.2933167.6652189.9708203.6015
P555.130877.614994.8632110.9899144.2773155.3846161.9490
P673.472199.1753116.2041150.2056165.3362175.5657200.9291
P749.590171.087396.0055106.7755130.9537143.0967172.6625
P8132.1147169.5561208.4068249.4712270.2169335.2919369.4619
P9124.6620149.6263183.7925224.6640252.5837287.4033324.4974
P10118.8382150.5627190.0441220.5946274.8657302.1718341.9780
P11113.7038155.3168186.0224221.1228252.3396277.9991332.6638
Time(s)9.811.212.414.314.612.811.9
Table 10. Comparison of the results for test system ( P D = 2500 MW).
AlgorithmCostsEmissions
γ-iteration12,424.94908.7
GA12,423.77908.5
Proposed GSA12,422.66908.54
EMODE12,403902.2
Table 11. Comparison of fuel costs and emissions for the six-generator system considering the power lost.
NSGAIIPDESPEA 2MODEEMODE
P1113.1259107.3965104.1573108.6284104.3959
P2116.4488122.1418122.9807115.9456119.5126
P3217.4191206.7536214.9553206.7969224.9859
P4207.9492203.7047203.1387210.000195.8249
P5304.6641308.1045316.0302301.8884296.9230
P6291.5969303.3797289.9396308.4127309.6791
Costs ($)64,96264,92064,88464,84364,827
Emissions (kg)581.1581.1582.9583.3582.9

