Defining Benchmarks for Restoration of Green Infrastructure: A Case Study Combining the Historical Range of Variability of Habitat and Species’ Requirements


Abstract
:1. Introduction
2. Materials and Methods
2.1. Loss of Grassland Area
2.2. Alteration of Grasslands
2.3. Fragmentation of Grassland Areas
2.4. Cumulative Effects
3. Results
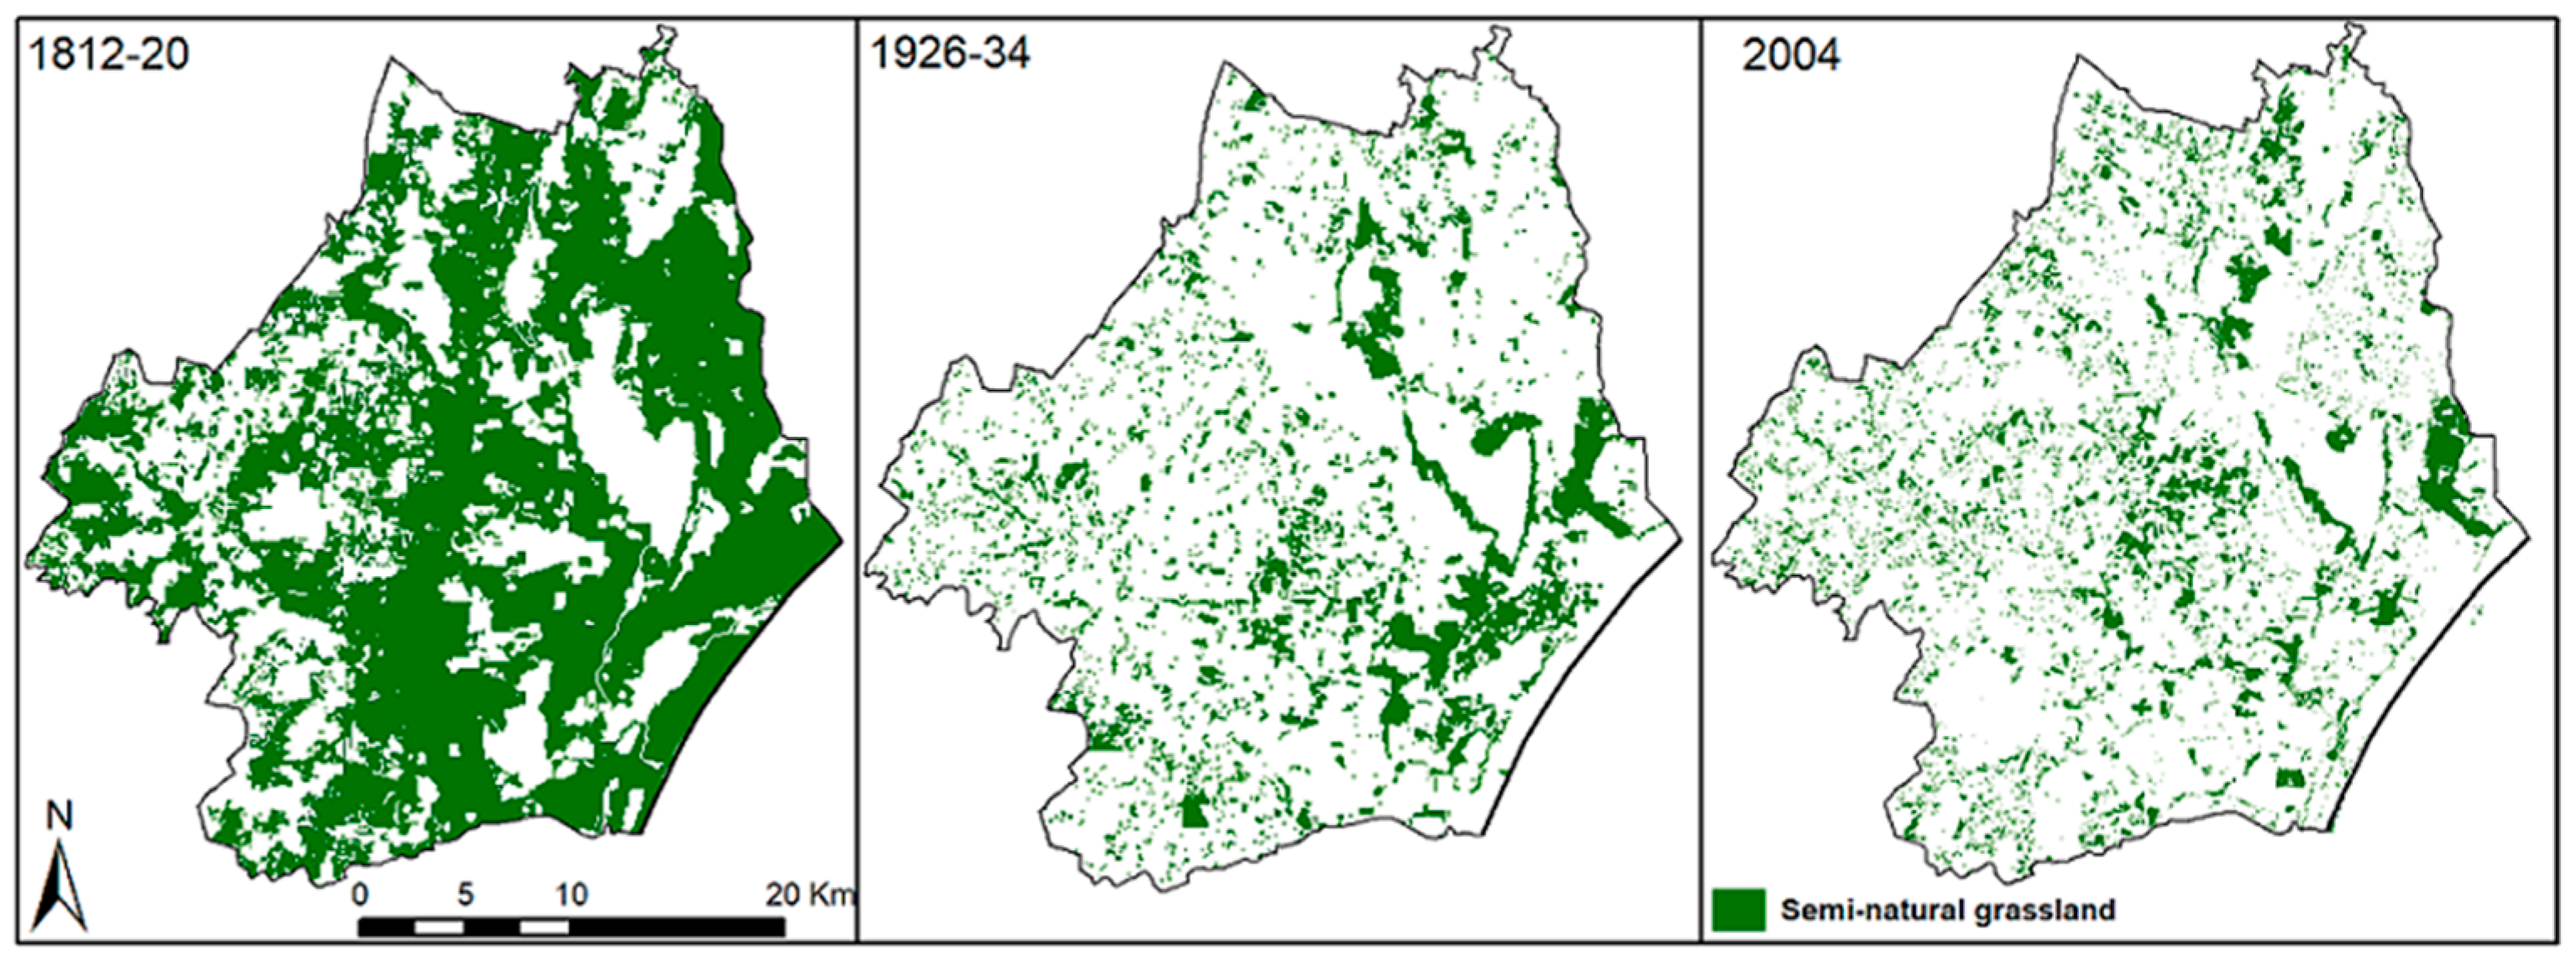
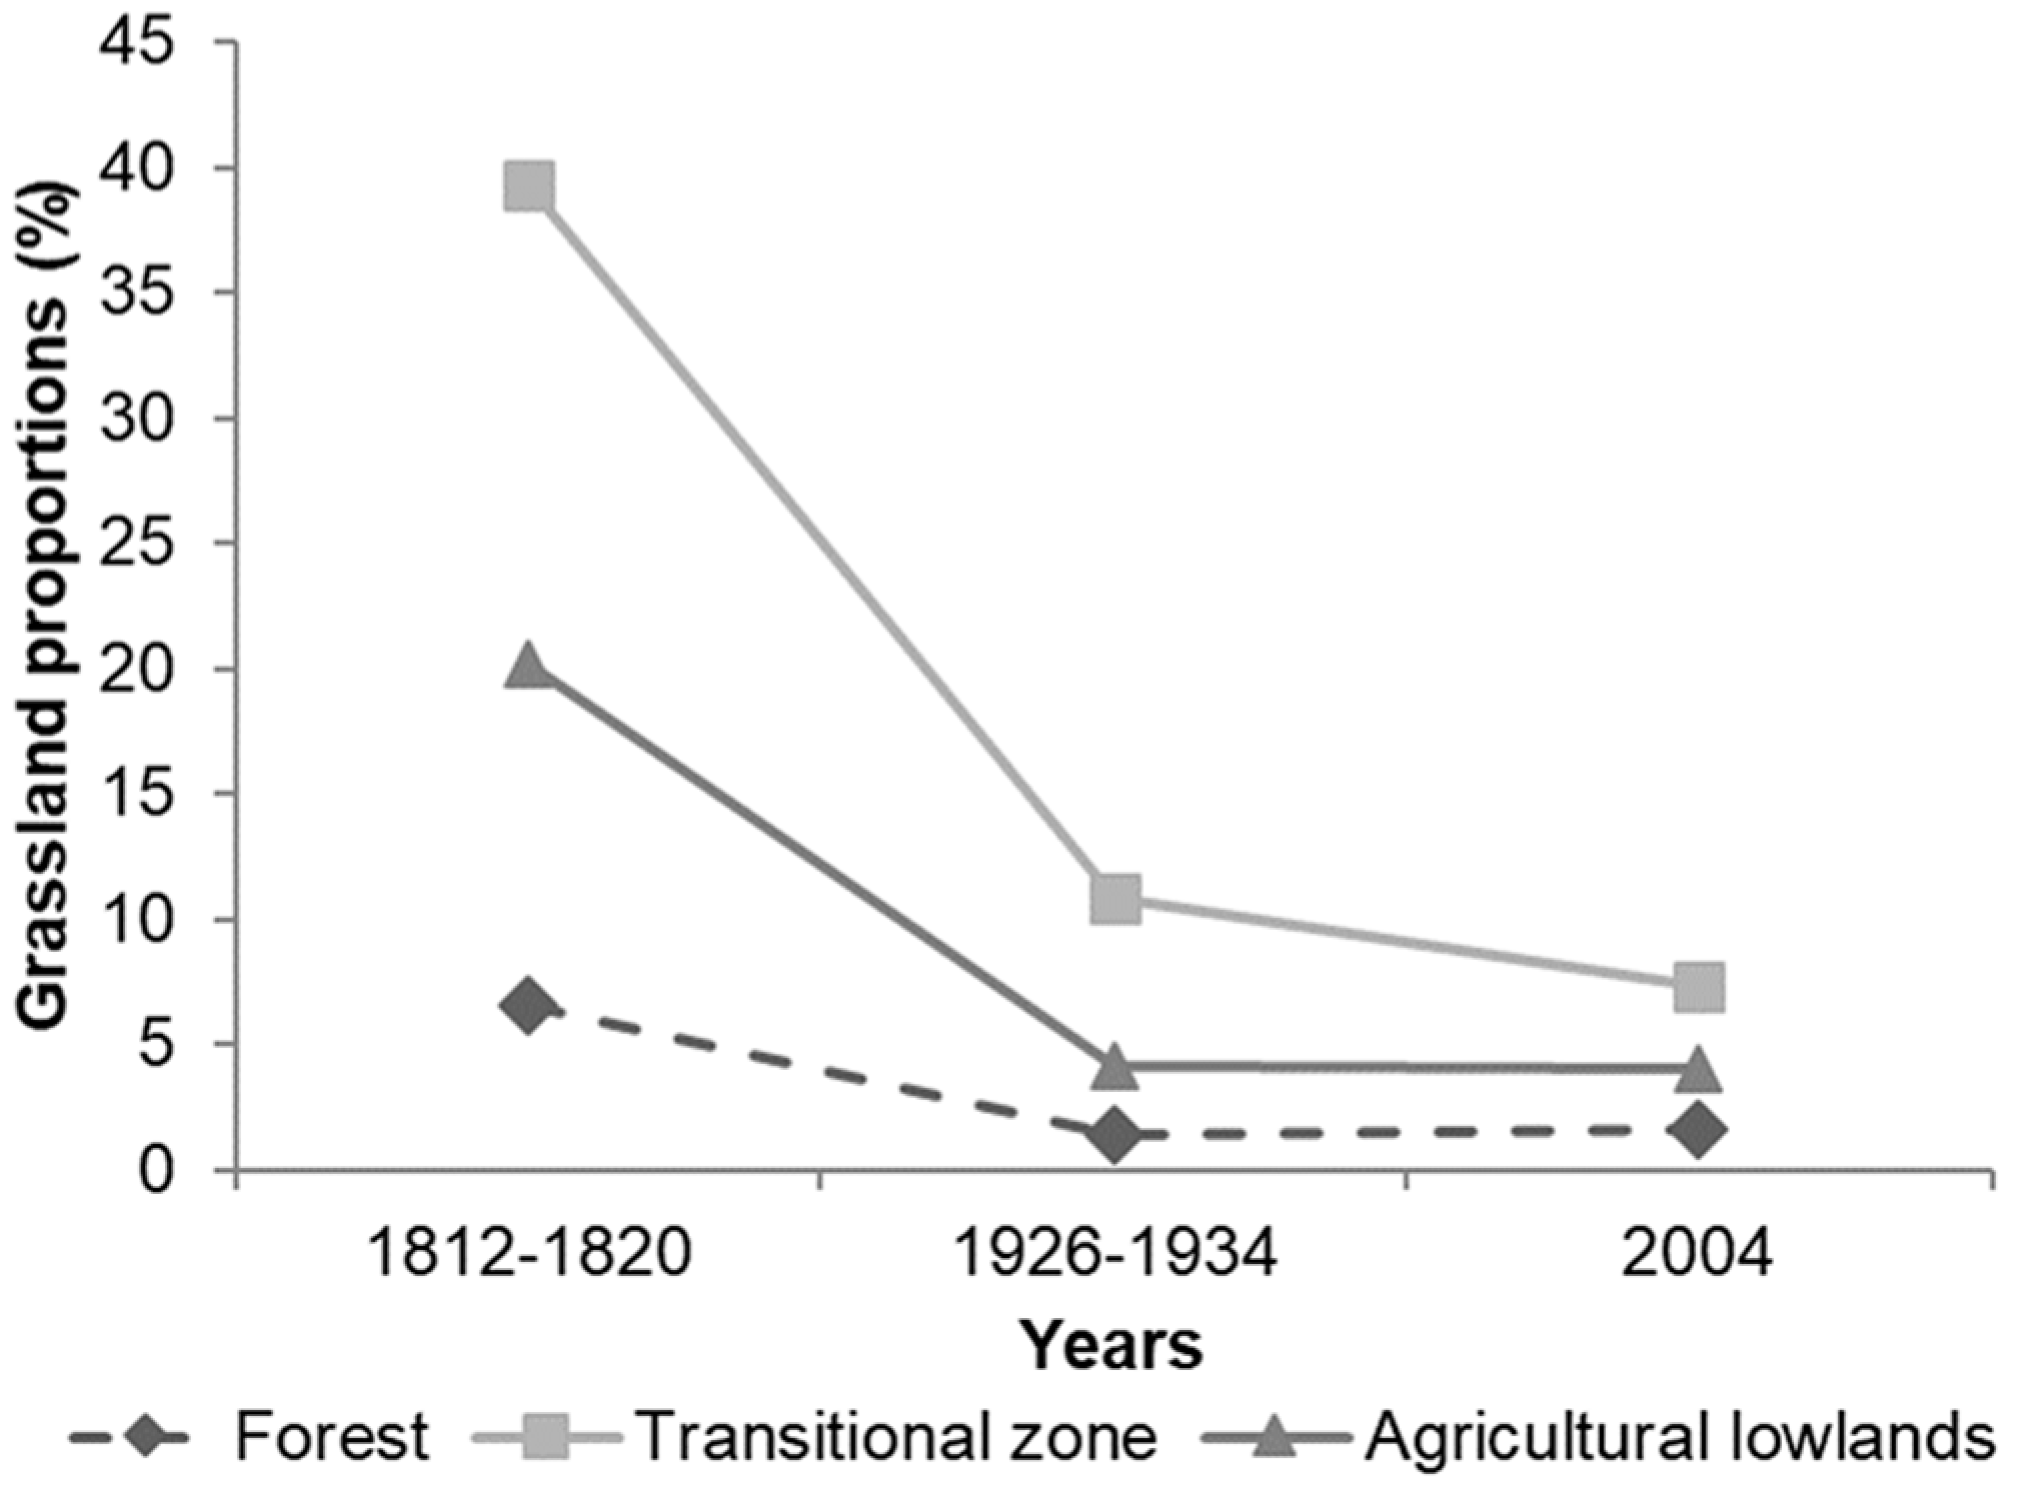
3.1. Grassland Loss
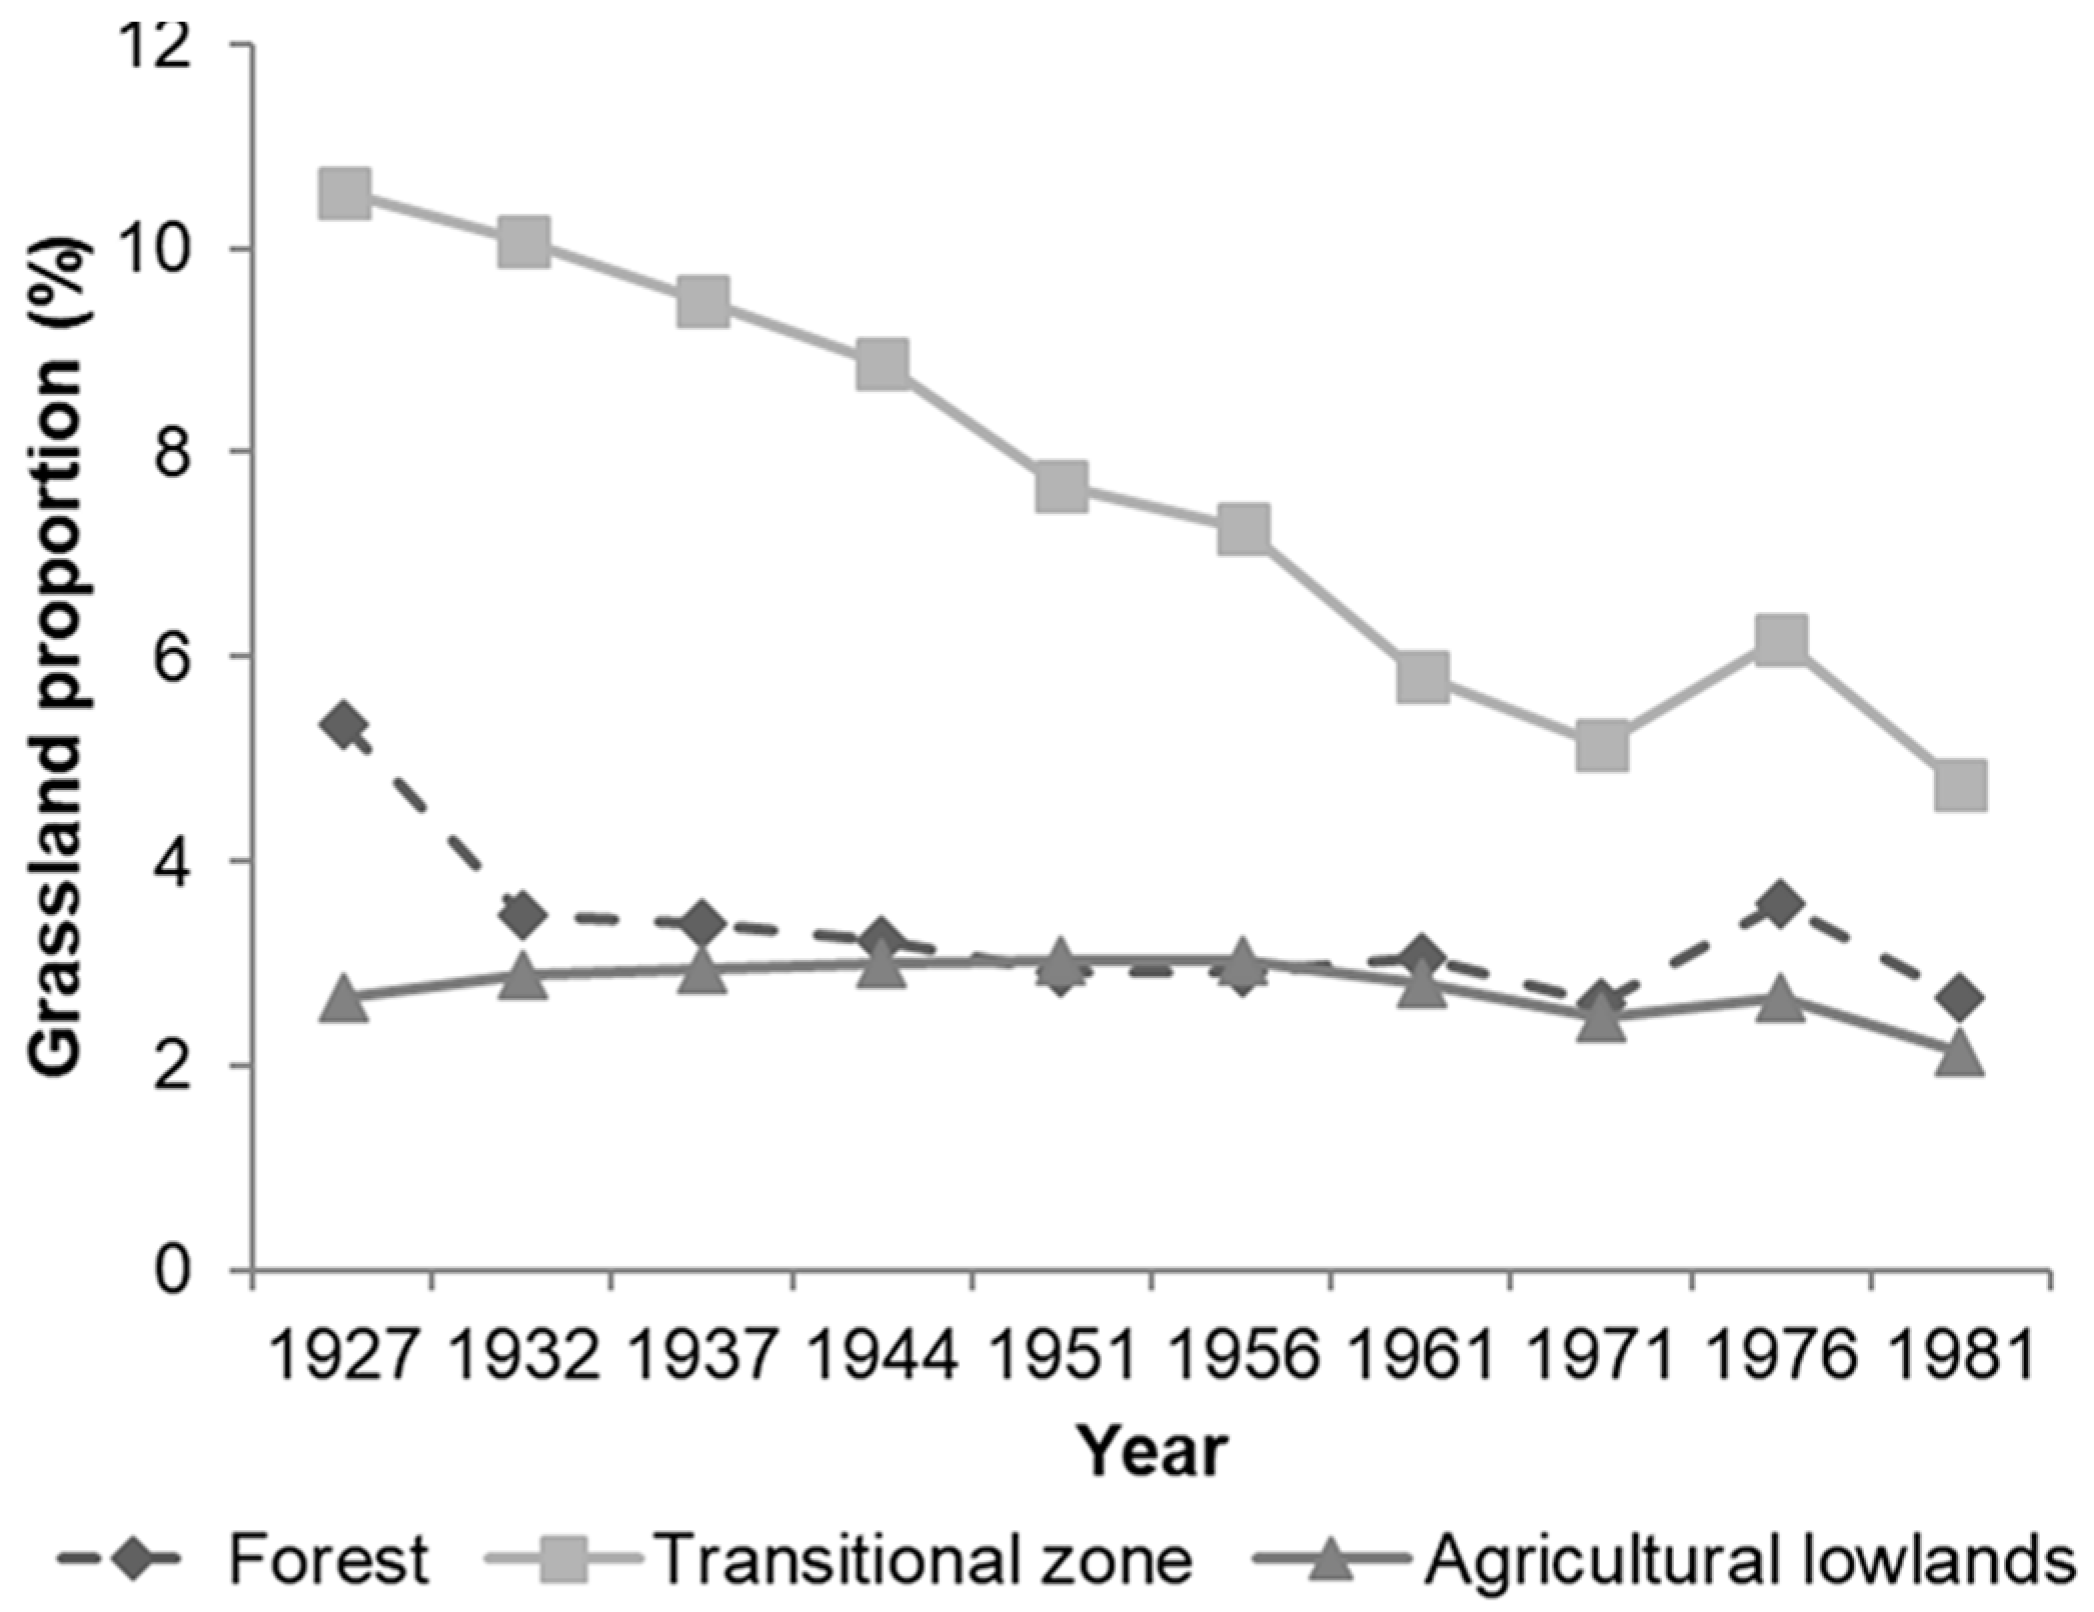
3.2. Semi-Natural Grassland Alteration
3.3. Semi-Natural Grassland Fragmentation
3.4. Cumulative Effect
4. Discussion
4.1. Reduced Functionality of Semi-Natural Grasslands as a Green Infrastructure
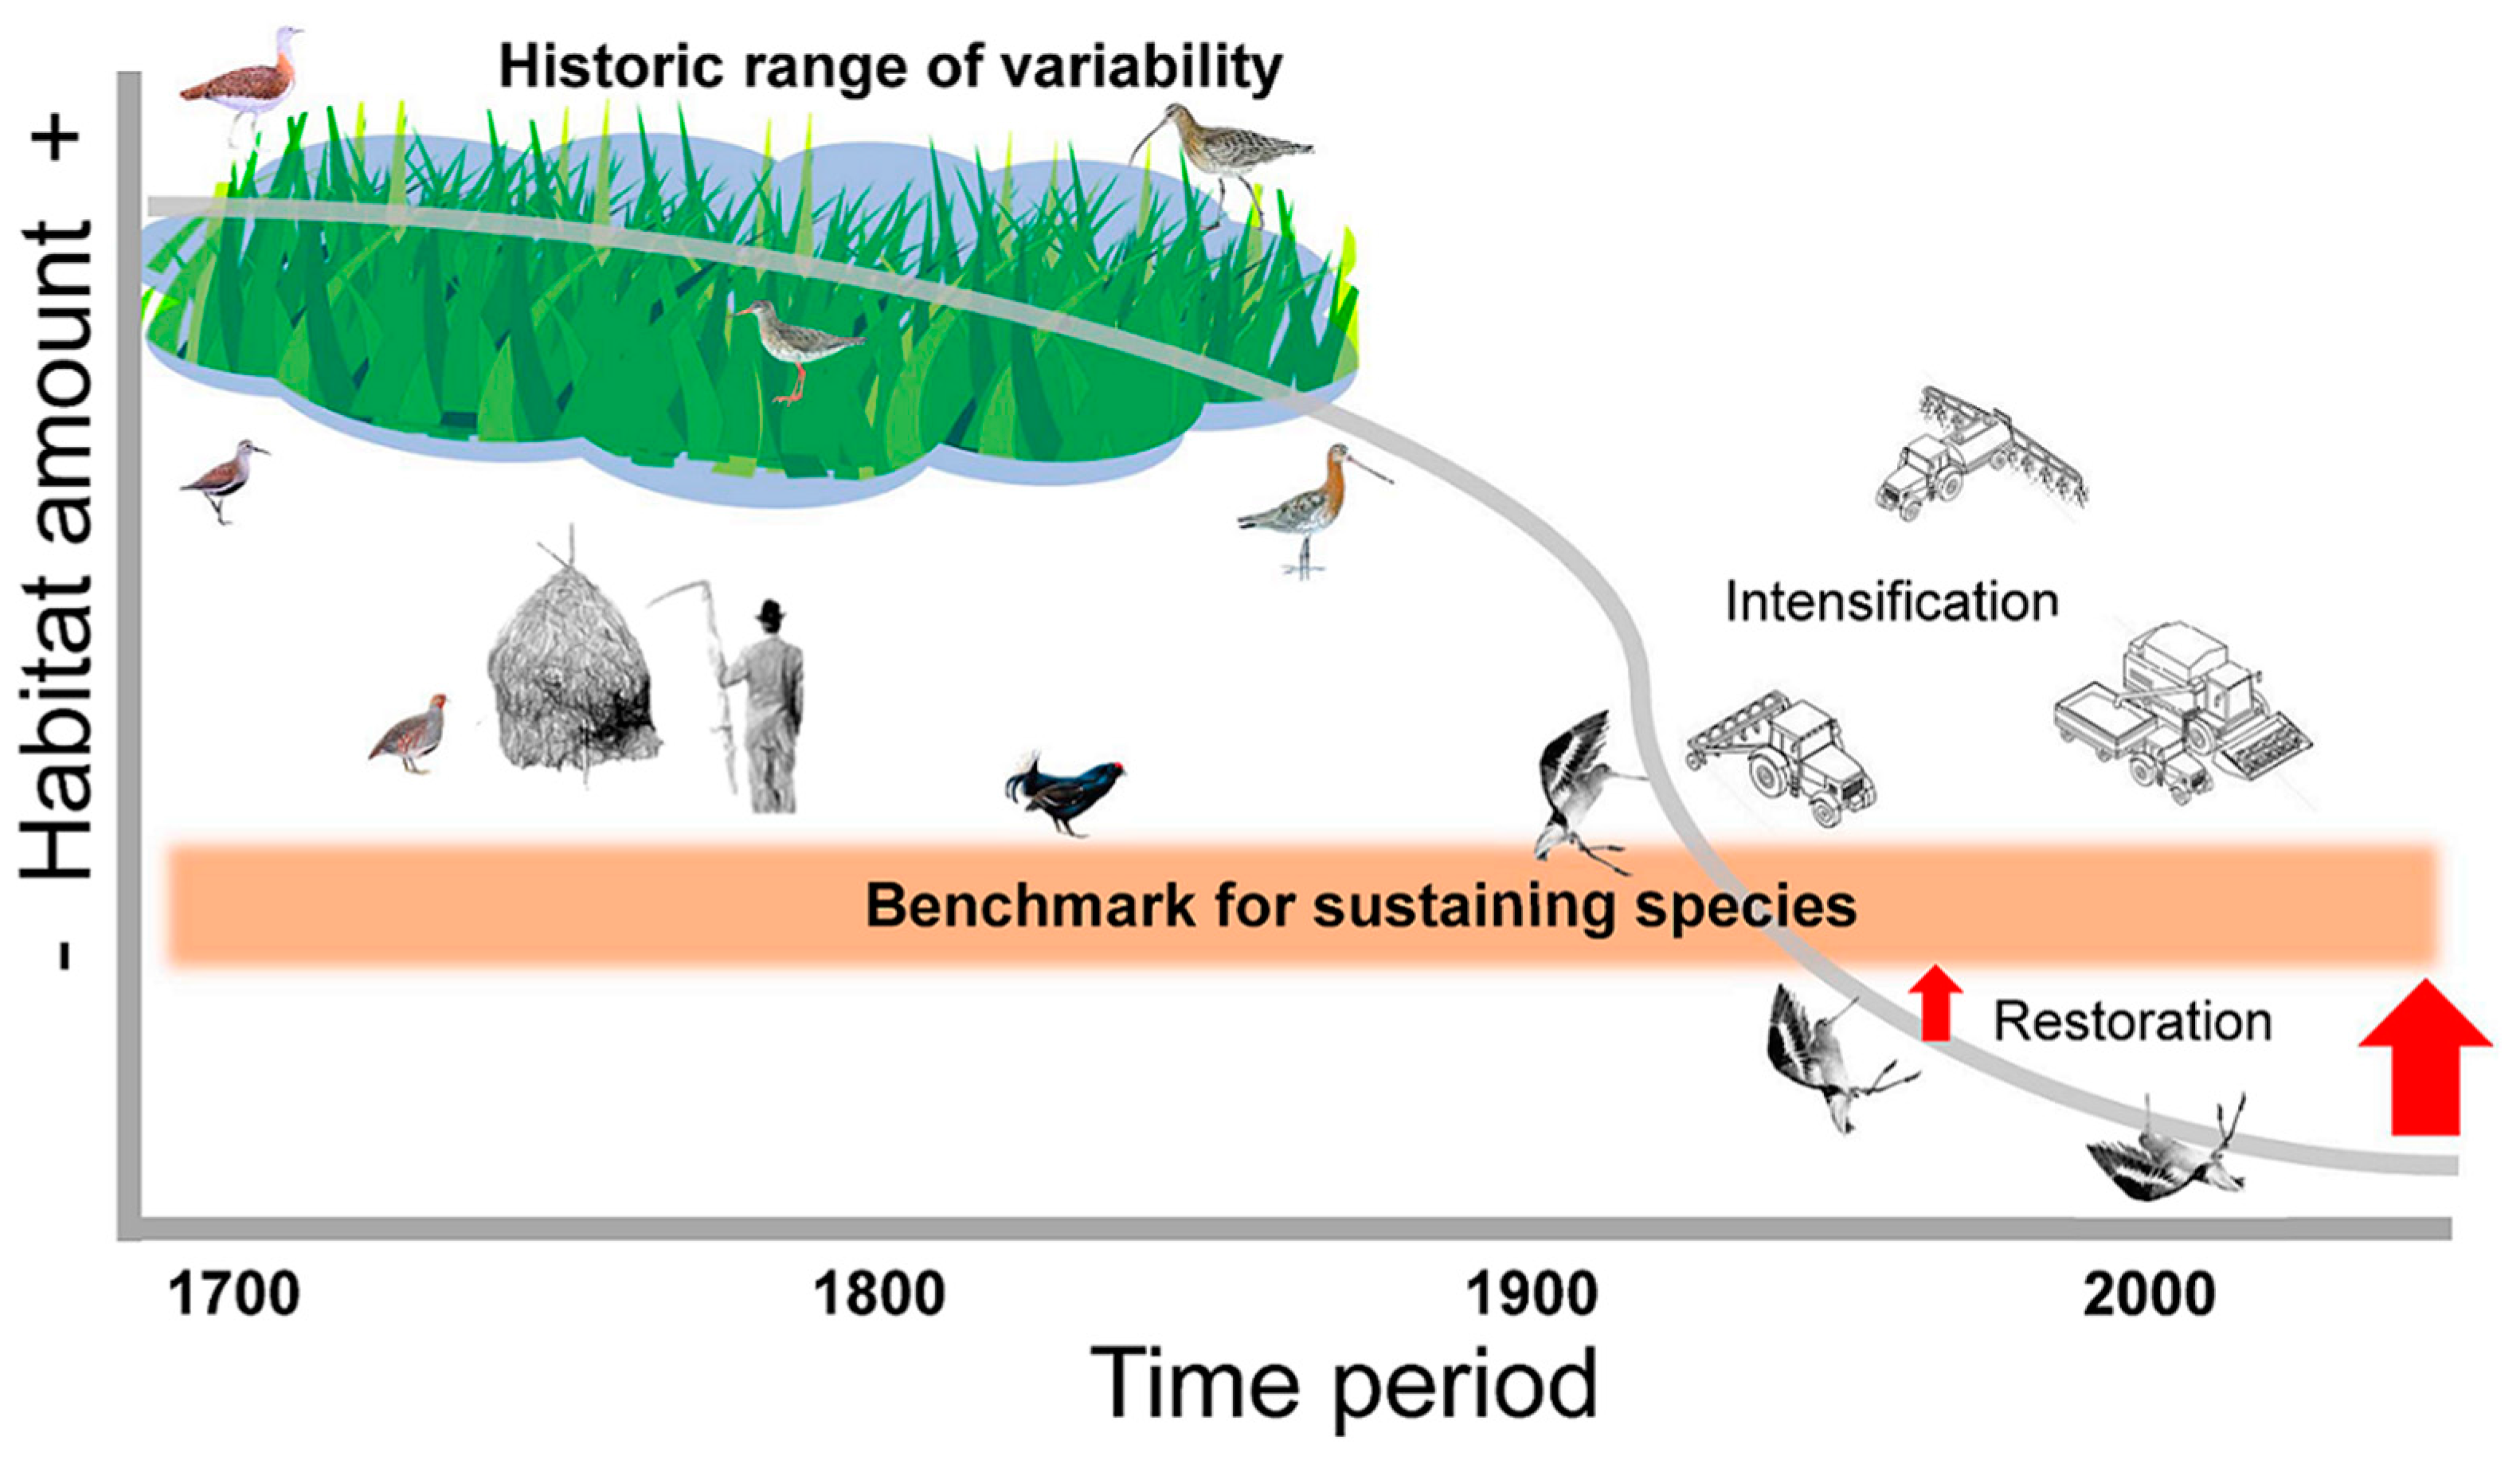
4.2. Combining Historical Ecology and Evidenced-Knowledge about What Species Require
4.3. Green Infrastructure and Human Well-Being
4.4. The Need for Spatial Planning
Acknowledgments
Author Contributions
Conflicts of Interest
References
- Costanza, R.; Daly, H.E. Natural capital and sustainable development. Conserv. Biol. 1992, 6, 37–46. [Google Scholar] [CrossRef]
- Petrosillo, I.; Zaccarelli, N.; Zurlini, G. Multi-scale vulnerability of natural capital in a panarchy of social-ecological landscapes. Ecol. Complex. 2010, 7, 359–367. [Google Scholar] [CrossRef]
- Brumelis, G.; Jonsson, B.G.; Kouki, J.; Kuuluvainen, T.; Shorohova, E. Forest naturalness in northern Europe: Perspectives on processes, structures and species diversity. Silva Fenn. 2011, 45, 807–821. [Google Scholar] [CrossRef]
- Hartel, T.; Plieninger, T. European Wood-Pastures in Transition: A Social-Ecological Approach; Routledge: London, UK, 2014. [Google Scholar]
- Manton, M.; Angelstam, P.; Milberg, P.; Elbakidze, M. Wet grasslands as a green infrastructure for ecological sustainability: Wader conservation in southern Sweden as a case study. Sustainability 2016, 8, 340. [Google Scholar] [CrossRef]
- Tzoulas, K.; Korpela, K.; Venn, S.; Yli-Pelkonen, V.; Kaźmierczak, A.; Niemela, J.; James, P. Promoting ecosystem and human health in urban areas using green infrastructure: A literature review. Landsc. Urban Plan. 2007, 81, 167–178. [Google Scholar] [CrossRef]
- Angelstam, P.; Khaulyak, O.; Yamelynets, T.; Mozgeris, G.; Naumov, V.; Chmielewski, T.J.; Elbakidze, M.; Manton, M.; Prots, B.; Valasiuk, S. Green infrastructure development at European Union’s eastern border: Effects of road infrastructure and forest habitat loss. J. Environ. Manag. 2017, 193, 300–311. [Google Scholar] [CrossRef] [PubMed]
- Jongman, R.H.G. Nature conservation planning in Europe: Developing ecological networks. Landsc. Urban Plan. 1995, 32, 169–183. [Google Scholar] [CrossRef]
- Čivić, K.; Jones-Walters, L.M. Implementing green infrastructure and ecological networks in Europe: Lessons learned and future perspectives. J. Green Eng. 2014, 4, 307–324. [Google Scholar]
- Angelstam, P.; Andersson, L. Estimates of the needs for forest reserves in Sweden. Scand. J. For. Res. 2001, 16, 38–51. [Google Scholar] [CrossRef]
- Andersson, K.; Angelstam, P.; Elbakidze, M.; Axelsson, R.; Degerman, E. Green infrastructures and intensive forestry: Need and opportunity for spatial planning in a Swedish rural-urban gradient. Scand. J. For. Res. 2013, 28, 143–165. [Google Scholar] [CrossRef]
- Roberge, J.-M.; Angelstam, P. Usefulness of the umbrella species concept as a conservation tool. Conserv. Biol. 2004, 18, 76–85. [Google Scholar] [CrossRef]
- European Commission. Green Infrastructure (GI)—Enhancing Europe’s Natural Capital; Communication from the Commission to the European Parliament, the Council, the European Economic and Social Committee and the Committee of the Regions; European Commission: Brussels, Belgium, 2013. [Google Scholar]
- Christensen, C. Agrarhistoriske Studier; Schubothe: Copenhagen, Denmark, 1886; Volume 2. [Google Scholar]
- Cramer, V.A.; Hobbs, R.J.; Standish, R.J. What’s new about old fields? Land abandonment and ecosystem assembly. Trends Ecol. Evol. 2008, 23, 104–112. [Google Scholar] [CrossRef] [PubMed]
- Keane, R.E.; Hessburg, P.F.; Landres, P.B.; Swanson, F.J. The use of historical range and variability (hrv) in landscape management. For. Ecol. Manag. 2009, 258, 1025–1037. [Google Scholar] [CrossRef]
- Angelstam, P.; Dönz-Breuss, M.; Roberge, J.-M. Targets and tools for the maintenance of forest biodiversity: An introduction. Ecol. Bull. 2004, 51, 11–24. [Google Scholar]
- Lindenmayer, D.B.; Fischer, J. Habitat Fragmentation and Landscape Change: An Ecological and Conservation Synthesis; Island Press: Washington, DC, USA, 2006; p. 329. [Google Scholar]
- Plieninger, T. Habitat loss, fragmentation, and alteration—Quantifying the impact of land-use changes on a Spanish Dehesa landscape by use of aerial photography and GIS. Landsc. Ecol. 2006, 21, 91–105. [Google Scholar] [CrossRef]
- Myrdal, J.; Morell, M. The Agrarian History of Sweden; Nordic Academic Press: Lund, Sweden, 2011. [Google Scholar]
- Eriksson, O.; Cousins, S. Historical landscape perspectives on grasslands in Sweden and the Baltic region. Land 2014, 3, 300. [Google Scholar] [CrossRef]
- Price, E. Lowland Grassland and Heathland Habitats; Routledge: London, UK, 2003. [Google Scholar]
- European Commission. Report on the Status of and Trends for Habitat Types and Species Covered by the Birds and Habitats Directives for the 2007–2012 Period as Required under Article 17 of the Habitats Directive and Article 12 of the Birds Directive; Report from the Commission to the Council and the European Parliament; The State of Nature in the European Union; European Commission: Brussels, Belgium, 2015. [Google Scholar]
- Egan, D.; Howell, E. The Historical Ecology Handbook. A Restorationist’s Guide to Reference Ecosystem; Island Press: Washington, DC, USA, 2001. [Google Scholar]
- Lagerås, P. Medieval colonisation and abandonment in the south Swedish uplands: A review of settlement and land use dynamics inferred from the pollen record. Archaeol. Balt. 2013, 20, 77–90. [Google Scholar] [CrossRef]
- Richnau, G.; Angelstam, P.; Valasiuk, S.; Zahvoyska, L.; Axelsson, R.; Elbakidze, M.; Farley, J.; Jönsson, I.; Soloviy, I. Multifaceted value profiles of forest owner categories in South Sweden: The river Helge å catchment as a case study. AMBIO 2013, 42, 188–200. [Google Scholar] [CrossRef] [PubMed]
- Magnusson, S.-E.; Magntorn, K.; Wallsten, E.; Cronert, H.; Thelaus, M. Kristianstads Vattenrike Biosphere Reserve Nomination Form; Kristianstad Kommun: Kristianstad, Sweden, 2004. [Google Scholar]
- Statistics, S.C.B.O. Official Statistics of Sweden: Census of Agriculture—from 1927 to 1981; Statistika Centralbyran: Stockholm, Sweden, 1983.
- Lantmäteriet. Skånska Rekognosceringskartan 1812–1820; Lantmäteriet: Stockholm, Sweden, 1986. [Google Scholar]
- Swedish Economic Department. Ordanance Survey 1926–1934 (Scale 1:20,000); Kristianstad County Agricultural Society: Kristianstad, Sweden, 1936. [Google Scholar]
- Lantmäteriet. Tematisk Noggrannhe i Svenska Marcktäckedata; Lantmäteriet: Stockholm, Sweden, 2004. [Google Scholar]
- Mikusiński, G.; Angelstam, P.; Sporrong, U. Distribution of deciduous stands in villages located in coniferous forest landscapes in Sweden. AMBIO 2003, 32, 520–526. [Google Scholar] [CrossRef] [PubMed]
- Cramp, S. Handbook of the Birds of Europe the Middle East and North Africa: The Birds of the Western Palearctic: 3. Waders to Gulls; Oxford University Press: Oxford, UK, 1990. [Google Scholar]
- Rannap, R.; Kaart, T.; Pehlak, H.; Kana, S.; Soomets, E.; Lanno, K. Coastal meadow management for threatened waders has a strong supporting impact on meadow plants and amphibians. J. Nat. Conserv. 2017, 35, 77–91. [Google Scholar] [CrossRef]
- Haddad, N.M.; Brudvig, L.A.; Clobert, J.; Davies, K.F.; Gonzalez, A.; Holt, R.D.; Lovejoy, T.E.; Sexton, J.O.; Austin, M.P.; Collins, C.D.; et al. Habitat fragmentation and its lasting impact on earth’s ecosystems. Sci. Adv. 2015, 1, e1500052. [Google Scholar] [CrossRef] [PubMed]
- Joyce, C.; Wade, P. Wet Grasslands: A European Perspective; John Wiley: Chichester, UK, 1998; p. 340. [Google Scholar]
- Ihse, M.; Lindahl, C. A holistic model for landscape ecology in practice: The Swedish survey and management of ancient meadows and pastures. Landsc. Urban Plan. 2000, 50, 59–84. [Google Scholar] [CrossRef]
- Nilsson, S. Skandinavisk Fauna; Foglarna. Första Bandet; Gleerups: Lund, Sweden, 1858. [Google Scholar]
- Ottvall, R.; Edenius, L.; Elmberg, J.; Engström, H.; Green, M.; Holmqvist, N.; Lindström, Å.; Pärt, T.; Tjernberg, M. Population trends for Swedish breeding birds. Ornis Svec. 2009, 19, 117–192. [Google Scholar]
- Thorup, O. Breeding Waders in Europe 2000; International Wader Study Group: Devon, UK, 2005; Volume 14, p. 142. [Google Scholar]
- Angelstam, P.; Runfors, O.; Mikusinski, G.; Seiler, C. Long-term dynamics of three types of black grouse habitat in the centre and at the edge of the distribution range in Sweden 1850–2000. Cah. d’Ethol. 2000, 20, 165–190. [Google Scholar]
- Bergman, K.-O.; Ask, L.; Askling, J.; Ignell, H.; Wahlman, H.; Milberg, P. Importance of boreal grasslands in Sweden for butterfly diversity and effects of local and landscape habitat factors. Biodivers. Conserv. 2008, 17, 139–153. [Google Scholar] [CrossRef]
- Brunet, J.; Felton, A.; Lindbladh, M. From wooded pasture to timber production—Changes in a European beech (Fagus sylvatica) forest landscape between 1840 and 2010. Scand. J. For. Res. 2012, 27, 245–254. [Google Scholar] [CrossRef]
- Ekberg, B.; Nilsson, L. Skånes Fåglar Idag och i Gången tid; Signum: Lund, Sweden, 1994. [Google Scholar]
- Bergman, K.-O.; Jansson, N.; Claesson, K.; Palmer, M.W.; Milberg, P. How much and at what scale? Multiscale analyses as decision support for conservation of saproxylic oak beetles. For. Ecol. Manag. 2012, 265, 133–141. [Google Scholar] [CrossRef]
- Ödman, A.M.; Olsson, P.A. Conservation of sandy calcareous grassland: What can be learned from the land use history? PLoS ONE 2014, 9, e90998. [Google Scholar] [CrossRef] [PubMed]
- Cousins, S.A.O.; Eriksson, Å.; Franzén, D. Reconstructing past land use and vegetation patterns using palaeogeographical and archaeological data: A focus on grasslands in Nynäs by the Baltic Sea in south-eastern Sweden. Landsc. Urban Plan. 2002, 61, 1–18. [Google Scholar] [CrossRef]
- Lindbladh, M.; Axelsson, A.-L.; Hultberg, T.; Brunet, J.; Felton, A. From broadleaves to spruce—The borealization of southern Sweden. Scand. J. For. Res. 2014, 29, 686–696. [Google Scholar] [CrossRef]
- Cousins, S.A.O.; Auffret, A.G.; Lindgren, J.; Tränk, L. Regional-scale land-cover change during the 20th century and its consequences for biodiversity. AMBIO 2015, 44, 17–27. [Google Scholar] [CrossRef] [PubMed]
- Laasimer, L. Eesti NSV taimkate. In Estonian with Russian and English Summaries; Valgus: Tallinn, Estonia, 1965. [Google Scholar]
- Helm, A.; Zobel, M.; Moles, A.T.; Szava-Kovats, R.; Pärtel, M. Characteristic and derived diversity: Implementing the species pool concept to quantify conservation condition of habitats. Divers. Distrib. 2015, 21, 711–721. [Google Scholar] [CrossRef]
- Sjöbeck, M. Det Sydsvenska Landskapets Historia och vård; AB Landstryck: Landskrona, Sweden, 1973. [Google Scholar]
- Bengtsson, K. Stortrappens skånska historia—En parentes? Anser 2015, 1, 21–38. [Google Scholar]
- Bengtsson, K. Stortrapp—Tillägg och rättelser. Anser 2015, 3, 45. [Google Scholar]
- Lindborg, R.; Eriksson, O. Historical landscape connectivity affects present plant species diversity. Ecology 2004, 85, 1840–1845. [Google Scholar] [CrossRef]
- Jonason, D.; Ibbe, M.; Milberg, P.; Tunér, A.; Westerberg, L.; Bergman, K.-O. Vegetation in clear-cuts depends on previous land use: A century-old grassland legacy. Ecol. Evol. 2014, 4, 4287–4295. [Google Scholar] [CrossRef] [PubMed]
- Schneider, C.; Fry, G. Estimating the consequences of land-use changes on butterfly diversity in a marginal agricultural landscape in Sweden. J. Nat. Conserv. 2005, 13, 247–256. [Google Scholar] [CrossRef]
- Öckinger, E.; Bergman, K.-O.; Franzén, M.; Kadlec, T.; Krauss, J.; Kuussaari, M.; Pöyry, J.; Smith, H.G.; Steffan-Dewenter, I.; Bommarco, R. The landscape matrix modifies the effect of habitat fragmentation in grassland butterflies. Landsc. Ecol. 2012, 27, 121–131. [Google Scholar] [CrossRef]
- Cousins, S.A.O.; Ohlson, H.; Eriksson, O. Effects of historical and present fragmentation on plant species diversity in semi-natural grasslands in Swedish rural landscapes. Landsc. Ecol. 2007, 22, 723–730. [Google Scholar] [CrossRef]
- Lindborg, R.; Bengtsson, J.; Berg, Å.; Cousins, S.A.O.; Eriksson, O.; Gustafsson, T.; Hasund, K.P.; Lenoir, L.; Pihlgren, A.; Sjödin, E.; et al. A landscape perspective on conservation of semi-natural grasslands. Agric. Ecosyst. Environ. 2008, 125, 213–222. [Google Scholar] [CrossRef]
- Cousins, S.A.O.; Eriksson, O. After the hotspots are gone: Land use history and grassland plant species diversity in a strongly transformed agricultural landscape. Appl. Veg. Sci. 2008, 11, 365–374. [Google Scholar] [CrossRef]
- Ekroos, J.; Rundlöf, M.; Smith, H.G. Trait-dependent responses of flower-visiting insects to distance to semi-natural grasslands and landscape heterogeneity. Landsc. Ecol. 2013, 28, 1283–1292. [Google Scholar] [CrossRef]
- Wrbka, T.; Erb, K.-H.; Schulz, N.B.; Peterseil, J.; Hahn, C.; Haberl, H. Linking pattern and process in cultural landscapes. An empirical study based on spatially explicit indicators. Land Use Policy 2004, 21, 289–306. [Google Scholar] [CrossRef]
- Berg, Å.; Wretenberg, J.; Żmihorski, M.; Hiron, M.; Pärt, T. Linking occurrence and changes in local abundance of farmland bird species to landscape composition and land-use changes. Agric. Ecosyst. Environ. 2015, 204, 1–7. [Google Scholar] [CrossRef]
- Angelstam, P. Predation on ground-nesting birds’ nests in relation to predator densities and habitat edge. Oikos 1986, 47, 365–373. [Google Scholar] [CrossRef]
- Kauhala, K.; Helle, P.; Helle, E. Predator control and the density and reproductive success of grouse populations in finland. Ecography 2000, 23, 161–168. [Google Scholar] [CrossRef]
- Lindström, E.; Angelstam, P.; Widén, P.; Andrén, H. Do predators synchronize vole and grouse fluctuations? An experiment. Oikos 1987, 48, 121–124. [Google Scholar] [CrossRef]
- Turner, M.G. Landscape ecology: The effect of pattern on process. Annu. Rev. Ecol. Syst. 1989, 20, 171–197. [Google Scholar] [CrossRef]
- Angelstam, P.; Dönz-Breuss, M. Measuring forest biodiversity at the stand scale: An evaluation of indicators in European forest history gradients. Ecol. Bull. 2004, 51, 305–332. [Google Scholar]
- Devictor, V.; Julliard, R.; Jiguet, F. Distribution of specialist and generalist species along spatial gradients of habitat disturbance and fragmentation. Oikos 2008, 117, 507–514. [Google Scholar] [CrossRef]
- Eglington, S.M.; Gill, J.A.; Smart, M.A.; Sutherland, W.J.; Watkinson, A.R.; Bolton, M. Habitat management and patterns of predation of northern lapwings on wet grasslands: The influence of linear habitat structures at different spatial scales. Biol. Conserv. 2009, 142, 314–324. [Google Scholar] [CrossRef]
- Brennan, L.A.; Kuvlesky, W.P., Jr. North American grassland birds: An unfolding conservation crisis? J. Wildl. Manag. 2005, 69, 1–13. [Google Scholar] [CrossRef]
- Andrén, H. Corvid density and nest predation in relation to forest fragmentation: A landscape perspective. Ecology 1992, 73, 794–804. [Google Scholar] [CrossRef]
- Bromberg, K.D.; Bertness, M.D. Reconstructing new England salt marsh losses using historical maps. Estuaries 2005, 28, 823–832. [Google Scholar] [CrossRef]
- Angelstam, P.; Roberge, J.M.; Lõhmus, A.; Bergmanis, M.; Brazaitis, G.; Dönz-Breuss, M.; Edenius, L.; Kosinski, Z.; Kurlavicius, P.; Lārmanis, V.; et al. Habitat modelling as a tool for landscape-scale conservation: A review of parameters for focal forest birds. Ecol. Bull. 2004, 51, 427–453. [Google Scholar]
- Angelstam, P.; Yamelynets, T.; Elbakidze, M.; Prots, B.; Manton, M. Gap analysis as a basis for strategic spatial planning of green infrastructure: A case study in the Ukrainian Carpathians. Écoscience 2017, 24, 41–58. [Google Scholar] [CrossRef]
- Scott, J.M.; Davis, F.; Csuti, B.; Noss, R.; Butterfield, B.; Groves, C.; Anderson, H.; Caicco, S.; D’Erchia, F.; Edwards, T.C.; et al. Gap analysis: A geographic approach to protection of biological diversity. Wildl. Monogr. 1993, 123, 3–41. [Google Scholar]
- Lõhmus, A.; Kohv, K.; Palo, A.; Viilma, K. Loss of old-growth, and the minimum need for strictly protected forests in Estonia. Ecol. Bull. 2004, 51, 401–411. [Google Scholar]
- Manton, M.G.; Angelstam, P.; Mikusiński, G. Modelling habitat suitability for deciduous forest focal species—A sensitivity analysis using different satellite land cover data. Landsc. Ecol. 2005, 20, 827–839. [Google Scholar] [CrossRef]
- Sala, O.E.; Paruelo, J.M. Ecosystem services in grasslands. In Nature’s Services: Societal Dependence on Natural Ecosystems; Daily, G.C., Ed.; Island Press: Washington, DC, USA, 1997; pp. 237–251. [Google Scholar]
- Beery, T.; Jönsson, K.I. Inspiring the outdoor experience: Does the path through a nature center lead out the door? J. Interpret. Res. 2015, 20, 67–85. [Google Scholar]
- Tuvendal, M.; Elmberg, J. A handshake between markets and hierarchies: Geese as an example of successful collaborative management of ecosystem services. Sustainability 2015, 7, 15937–15954. [Google Scholar] [CrossRef]
- Baker, S. Sustainable Development; Routledge: London, UK, 2006. [Google Scholar]
- Johannessen, Å.; Hahn, T. Social learning towards a more adaptive paradigm? Reducing flood risk in Kristianstad municipality, Sweden. Glob. Environ. Chang. 2013, 23, 372–381. [Google Scholar] [CrossRef]
- Tuvendal, M.; Elmqvist, T. Ecosystem services linking social and ecological systems: River brownification and the response of downstream stakeholders. Ecol. Soc. 2011, 16, 21. [Google Scholar] [CrossRef]
- Ottvall, R.; Smith, H.G. Effects of an agri-environment scheme on wader populations of coastal meadows of southern Sweden. Agric. Ecosyst. Environ. 2006, 113, 264–271. [Google Scholar] [CrossRef]
- Angelstam, P.; Barnes, G.; Elbakidze, M.; Marais, C.; Marsh, A.; Polonsky, S.; Richardson, D.M.; Rivers, N.; Shackleton, R.T.; Stafford, W. Collaborative learning to unlock investments for functional ecological infrastructure: Bridging barriers in social-ecological systems in South Africa. Ecosyst. Serv. 2017, 27, 291–304. [Google Scholar] [CrossRef]
- Schultz, L.; Folke, C.; Olsson, P. Enhancing ecosystem management through social-ecological inventories: Lessons from Kristianstads Vattenrike, Sweden. Environ. Conserv. 2007, 34, 140–152. [Google Scholar] [CrossRef]
- Millennium Ecosystem Assessment. Ecosystems and Human Well-Being: Synthesis; Island Press: Washington, DC, USA, 2005. [Google Scholar]
- Garrido, P.; Elbakidze, M.; Angelstam, P.; Plieninger, T.; Pulido, F.; Moreno, G. Stakeholders’ benefits of wood pasture landscapes in Spain. Land Use Policy 2017, 60, 324–333. [Google Scholar] [CrossRef]
- Huntsinger, L.; Oviedo, J.L. Ecosystem services are social-ecological services in a traditional pastoral system: The case of California’s Mediterranean rangelands. Ecol. Soc. 2014, 19, 8. [Google Scholar] [CrossRef]
- Benstead, P.; Jose, P.; Joyce, C.; Wade, P. European Wet Grassland: Guidelines for Management and Restoration; RSPB: Sandy, UK, 1999. [Google Scholar]
- Angelstam, P.; Grodzynskyi, M.; Andersson, K.; Axelsson, R.; Elbakidze, M.; Khoroshev, A.; Kruhlov, I.; Naumov, V. Measurement, collaborative learning and research for sustainable use of ecosystem services: Landscape concepts and Europe as laboratory. AMBIO 2013, 42, 129–145. [Google Scholar] [CrossRef] [PubMed]
- Gustavsson, E.; Lennartsson, T.; Emanuelsson, M. Land use more than 200 years ago explains current grassland plant diversity in a Swedish agricultural landscape. Biol. Conserv. 2007, 138, 47–59. [Google Scholar] [CrossRef]


| Data Sources | Term | Definition |
|---|---|---|
| Swedish Agricultural Statistics 1927–1981 | Slåtteräng | Hay meadow |
| Ordnad betesäng | Orderly grazing meadow | |
| Kultiverad betesmark | Cultivated pasture | |
| Annan betesäng | Other grazing meadow | |
| Naturlig äng | Natural meadow | |
| Betesmark | Pasture | |
| Hagmark | Grazed woodland | |
| Reconnaissance map from 1812–1820 | Öppen mark | Open ground |
| Mark med tuvsymboler | Field with tussocks | |
| Frisk äng eller hed | Mesic grassland or heath | |
| Betat eller tillfälligt odlad mark med sandflykt | Grazed or temporarily farmed land with sand erosion | |
| Permanent åker eller äng | Permanent field or meadow | |
| Ordnance survey maps 1926–1934 | Sidvallsäng | Wet grasslands |
| Hårdvallsäng | Mesic grassland | |
| Betesmark | Pasture | |
| Kärr som betesmark | Fen as grazed land | |
| Åker huvudsakligen använd som betesmark | Field mainly used as pasture | |
| Swedish Land Survey data 2004 | Betesmark | Pasture |
| Naturlig gräsmark | Natural grassland | |
| Limnogena våtmarker | Fen |
| Steps in the Analysis of Cumulative Effect | Landscape Strata in the Forest Upland to Agricultural Lowland Gradient | ||
|---|---|---|---|
| Forest | Transitional Zone | Agricultural Lowland | |
| (A) Remaining grasslands by comparison of spatial data 1812–20 to 1926–1934 (see Figure 3) | 0.22 | 0.28 | 0.21 |
| (B) Remaining grasslands by comparison of spatial data 1926–1934 to 2004 (see Figure 3) | 1.15 | 0.67 | 0.97 |
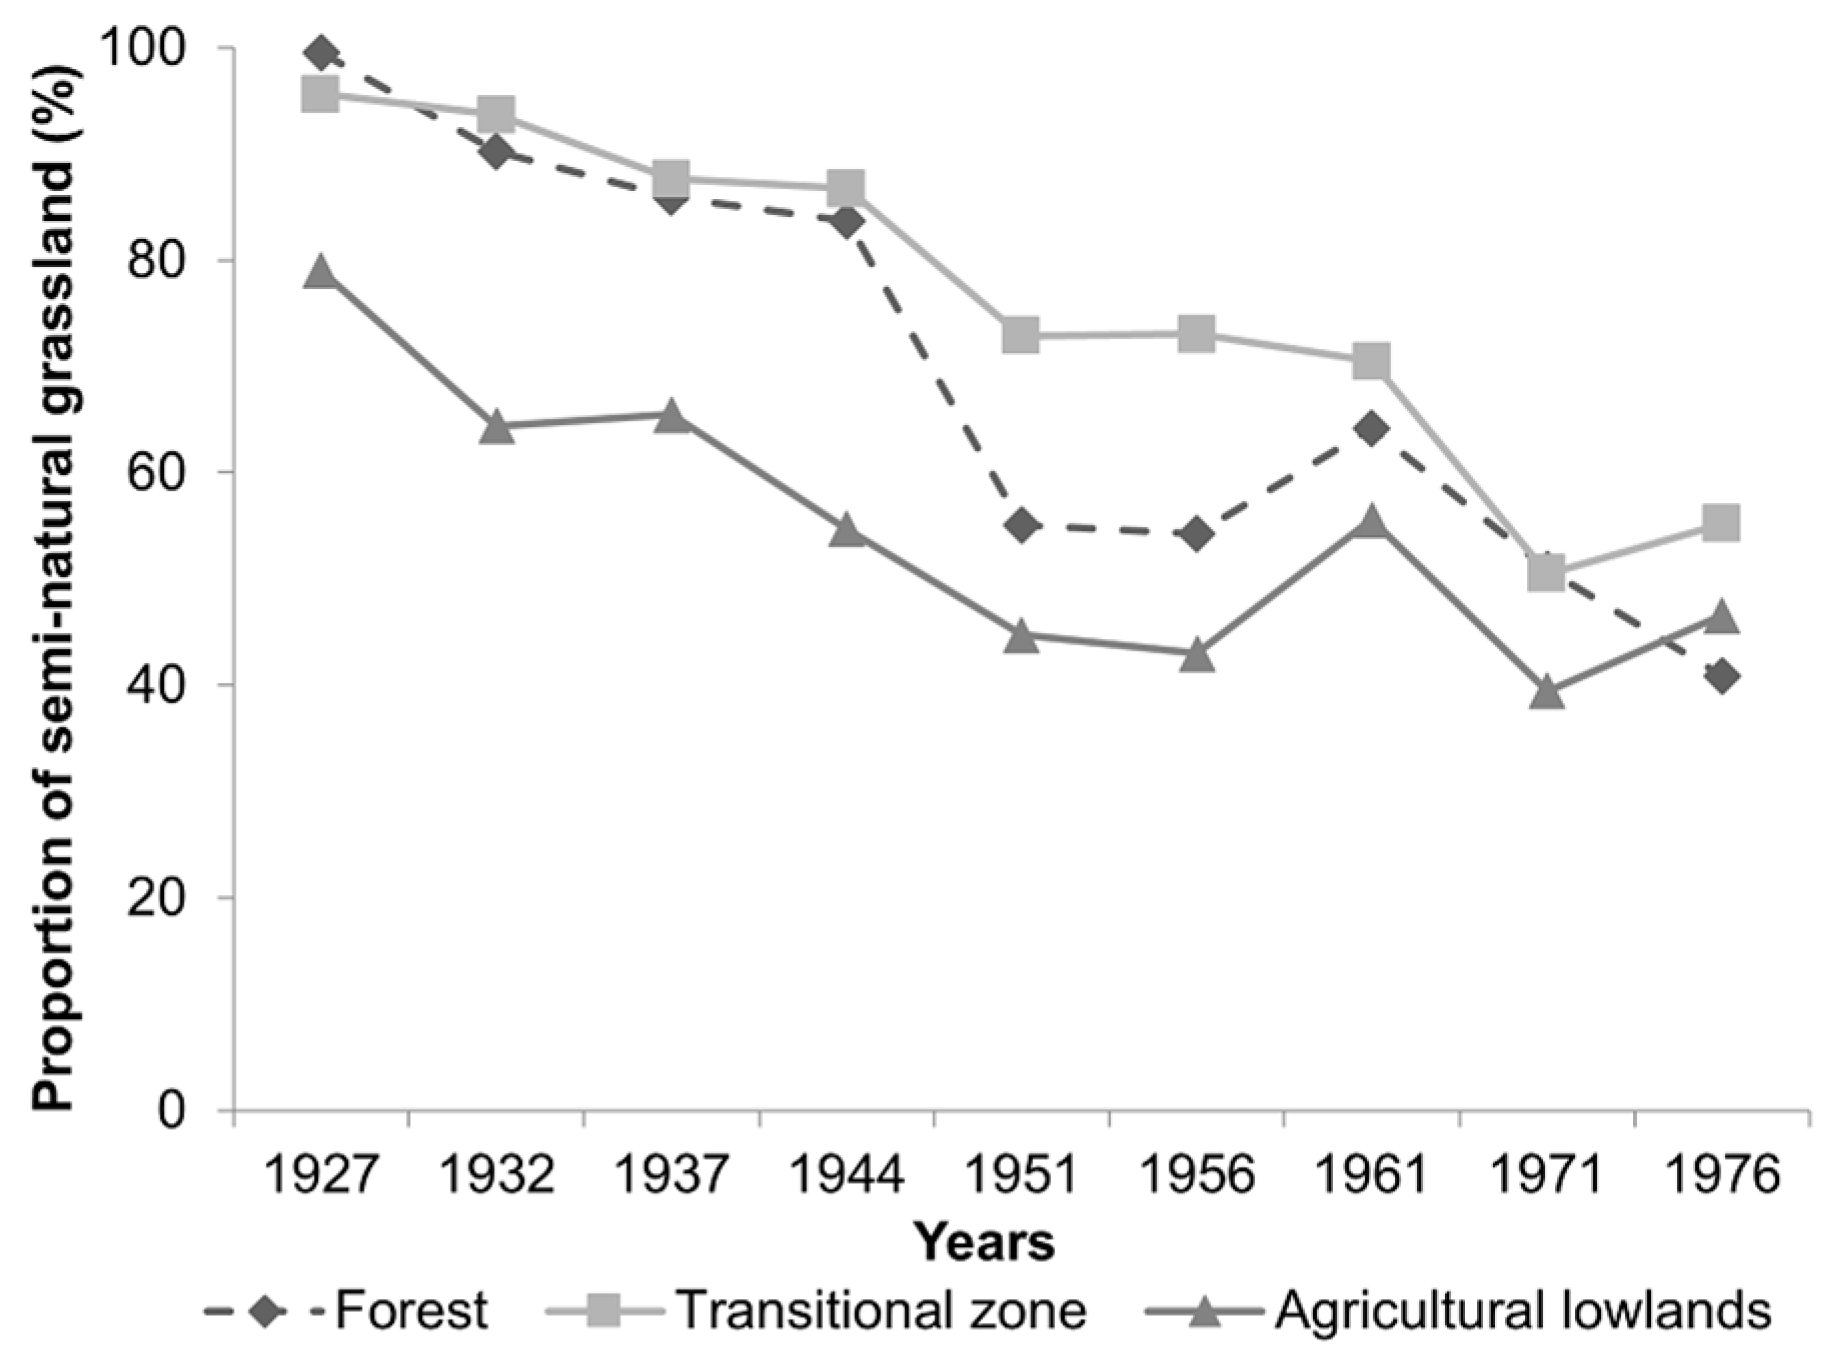
| (C) Remaining proportion of semi-natural grassland by comparison of 1926–1934 to 1976 (see Figure 5) | 0.59 | 0.42 | 0.41 |
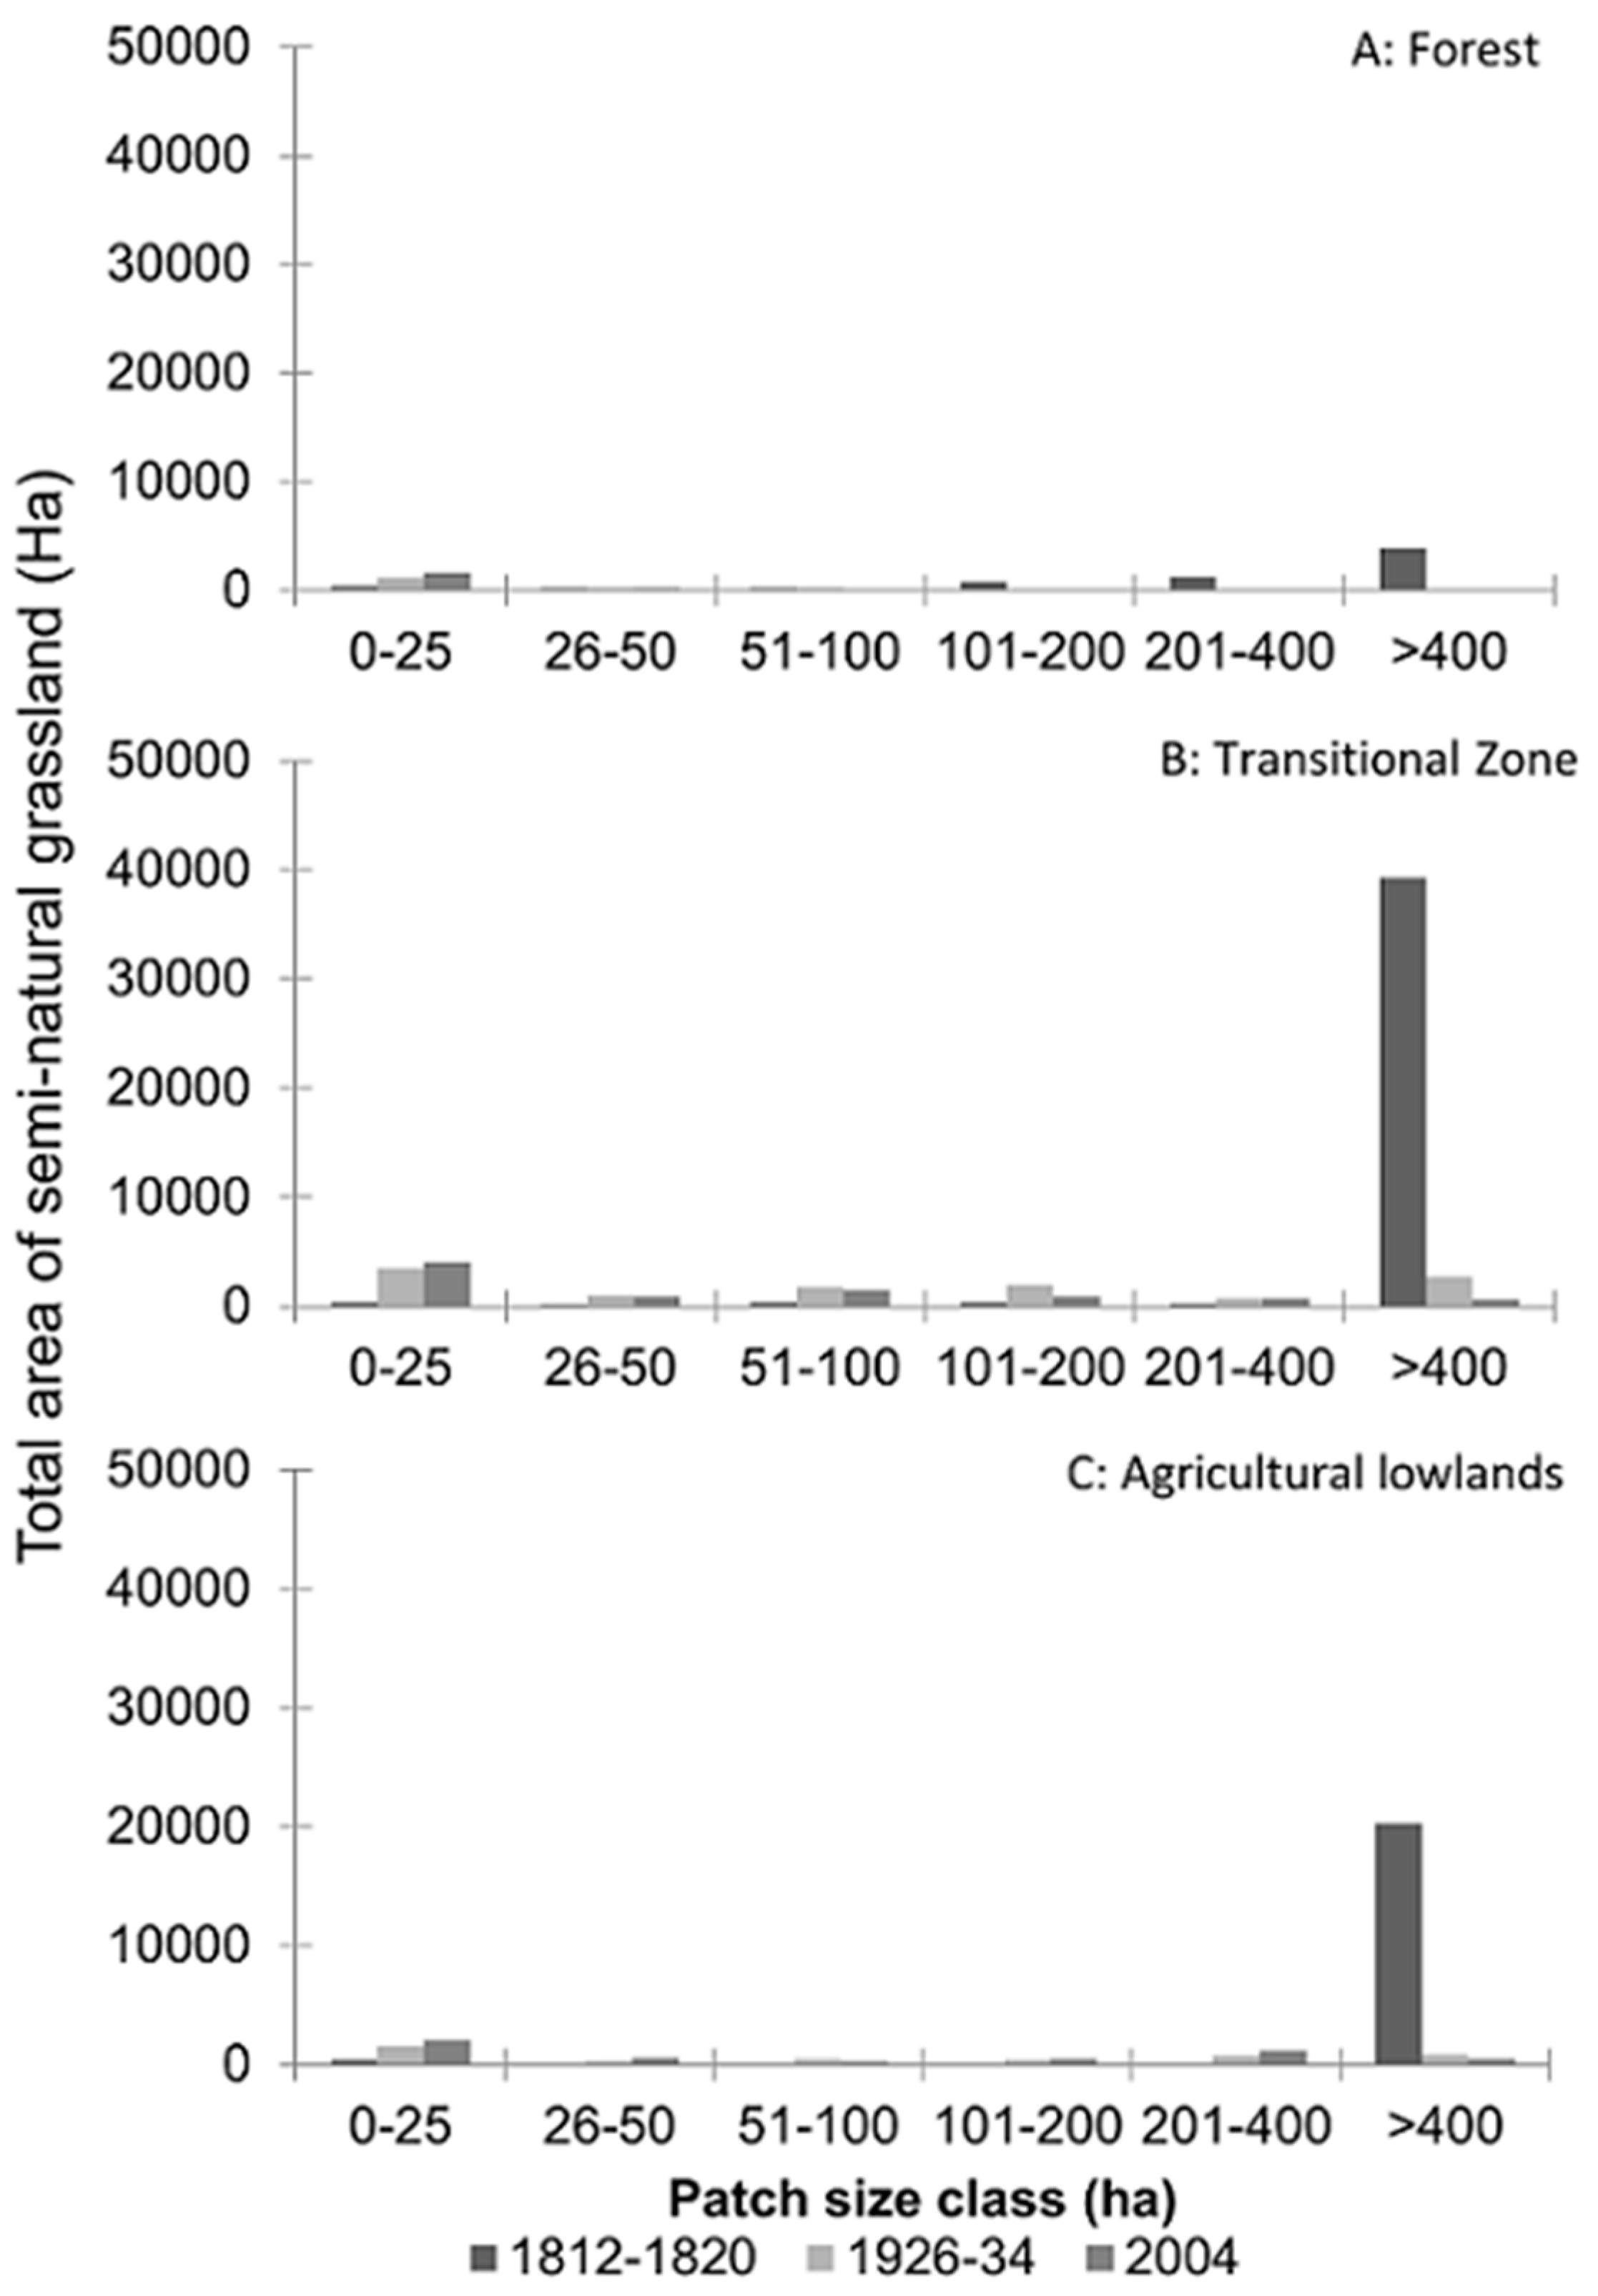
| (D) Remaining proportion of sufficiently large patches >100 ha during the last 200 years (Figure 6) | 0 | 0.06 | 0.11 |
| Cumulative effect (A × B × C × D) in terms of remaining semi-natural grassland functionality | 0 | 0.0047 | 0.0091 |
© 2018 by the authors. Licensee MDPI, Basel, Switzerland. This article is an open access article distributed under the terms and conditions of the Creative Commons Attribution (CC BY) license (http://creativecommons.org/licenses/by/4.0/).
Share and Cite
Manton, M.; Angelstam, P. Defining Benchmarks for Restoration of Green Infrastructure: A Case Study Combining the Historical Range of Variability of Habitat and Species’ Requirements. Sustainability 2018, 10, 326. https://doi.org/10.3390/su10020326
Manton M, Angelstam P. Defining Benchmarks for Restoration of Green Infrastructure: A Case Study Combining the Historical Range of Variability of Habitat and Species’ Requirements. Sustainability. 2018; 10(2):326. https://doi.org/10.3390/su10020326
Chicago/Turabian StyleManton, Michael, and Per Angelstam. 2018. "Defining Benchmarks for Restoration of Green Infrastructure: A Case Study Combining the Historical Range of Variability of Habitat and Species’ Requirements" Sustainability 10, no. 2: 326. https://doi.org/10.3390/su10020326
APA StyleManton, M., & Angelstam, P. (2018). Defining Benchmarks for Restoration of Green Infrastructure: A Case Study Combining the Historical Range of Variability of Habitat and Species’ Requirements. Sustainability, 10(2), 326. https://doi.org/10.3390/su10020326