Abstract
This research advances our understanding of sustainable community development in relation to complex economic phenomena and psychological processes. The last decade has seen regional and global communities transition through unprecedented economic change. Community resilience offers a framework to guide regional development and explore the sustainability of social, economic and environmental systems to manage change. However, the fundamental constructs of community resilience are still not well known, such as the critical role of emotional stability and residents’ perceptions of change. This research explores this relationship in economies undergoing transformations by presenting the results of a survey administered to 663 Mackay and Whitsunday residents in Queensland, Australia. The findings add substantial depth to community resilience theory by demonstrating a positive relationship between emotional stability and resilience and a negative relationship between resilience and perceptions of change. The results also provide insight into the sustainable characteristics of communities to build resilience and manage the transformation process. Future research should focus on further testing the relationship between resilience, emotional stability and perceptions of change within communities at different stages of the transformation process.
1. Introduction
Why regions, industries, and even societies rise and fall has been a question that has long concerned evolutionary economists and geographers [1]. Understanding how to build regional resilience and deliver sustainable development is critical not only for theory, but also for practice, as economic declines, rapid transformation and negative social and environmental impacts from industrial development can reduce quality of life for communities [2]. Yet our understanding of economic transformation and our ability to operationalise resilience for long-term regional growth is still in its infancy, with considerable ambiguity in conceptualisation, measurement and repeating trends/patterns [3]. There is an increasing urgency to close this theoretical gap as it has been observed that the cyclical boom and bust of regional economies is accelerating. This is especially critical in Australia, where the mining boom and bust cycles tend to be countercyclical to tourism boom and busts, thereby dramatically reshaping and impacting regional economies and communities.
While tourism and mining are two key economic pillars for Australia, they are subject to fluctuations which create significant structural economic change in many regions. Structural economic change occurs when the economy restructures towards another industry or the nature of an existing industry radically changes [4]. Long-term exposure to rapid structural change that is not adequately managed can negatively impact a community. Courvisanos, Jain and Mardaneh [5] acknowledge community instability as a significant repercussion of this exposure, and it may lead to low emotional wellbeing, a lack of unity and connectivity among community members, poor allocation and use of resources, and an inability to identify and address system risks and vulnerabilities.
Resilience theory has been applied to understand how regional communities may cope with change [6,7]. Community resilience refers to the existence, development and engagement of local resources by residents to thrive in an environment faced with change, uncertainty or unpredictability [2]. More precisely, community resilience is the ability of individuals and communities to cope with change by adapting, transforming and possibly becoming ‘stronger’ [6,8]. Managing change within a community system is essential for long-term sustainability and to achieve sustainable regional development. Resilience theory is emerging in prominence for extant studies on regional communities, as it considers the existence, development and engagement of community resources to manage change and uncertainty [6,9].
While community resilience offers a framework to guide regional development that accounts for the sustainability of society, the fundamental constructs which underpin community resilience, especially at the individual level require conceptual clarification and theoretical refinement [10,11]. Consequently, the aim of this research is to explore the psychological and behavioural factors that influence community resilience to long-term economic structural change. Addressing this aim will enhance the conceptual understanding of the antecedents that underpin community resilience at the individual and collective level, as well as to enable targeted approaches for building community resilience to rapid structural change and to guide regional policy and planning for change management.
2. Literature Review
Researchers note the importance of understanding community resilience as it can allow for policy development that can minimise the negative impacts that economic change has on people and bolster the sustainability of the change process [12]. Existing community resilience frameworks such as Cochrane [13] and Bec et al. [2], consider the interaction between economic, social, ecological and institutional systems of the community, enabling management responses to address the sustainability of long-term structural change. Among these factors, studies on regional development and change management approaches have emphasised the role of human capital for managing change [14,15]. As a result, the resilience literature is increasingly recognising that studies require more nuanced social and emotional factors at the individual level to facilitate the sustainable transformation of collective entities such as regional communities [2,16].
The factors that influence resilience at the individual level have been discussed from different disciplinary perspectives, primarily within psychology and sociology, where human and social capital are central concepts [12,17]. This prior research has tended to focus on the link between cognitive factors and resilience [18,19], categorising the cognitive factors as self-efficacy, cognitive appraisal, locus of control, dispositional optimism, learning, affectivity, and experience and expertise/knowledge [20,21]. These concepts have been applied within a community resilience framework, however, they have a tendency to focus on individual responses to change, particularly to disaster-related events, and often generalise about collective community resilience [6,22,23]. Although critical, arguably the bulk of this work has been completed after a period of heightened stress, rather than during a process of economic structural change.
Bec et al. [2] proposed a theoretical framework for resilience to structural change that highlights possible individual factors that may impact on community resilience, specifically emotional stability, demographics, personality, beliefs and values, place attachment, lifestyle attributes, and exposure to change. Importantly, Bec et al. [2] recognise that these psychological factors are just one determinant among many other collective factors of community resilience. These psychological factors also align with studies that have explored the social impacts of economic transformation within communities [24,25]. However, these key concepts of cognitive psychology, particularly emotions and perceptions, need to be further reviewed to understand how they can be applied within a community resilience framework for managing economic change.
In psychology, emotion is a key indicator of individual resilience [17]. Whilst an exact definition is contested, emotion is often defined as the outcomes of physical or psychological circumstances [26]. Excessive or prolonged exposure to negative emotions can impede on an individual’s wellbeing, and thus, building emotional stability is important [27]. Likewise, it has been argued that high levels of emotional stability in individuals may be a determinant of collective community resilience [2]. Yet, Staal et al. [21] argues that further research is required to progress our conceptual understanding of individual resilience, with a present need to focus on the role of emotional stability in existing conceptual models.
Research has also found that an individual’s perception of, and capacity to cope with, a traumatic event considerably influences their ability to manage change [28,29]. Perceptions of change, whilst established in broader literature, have not been adequately considered as a cognitive indicator of community resilience. Broader cognitive psychology literature does allude to a potential relationship between emotional stability and perceptions of change, as emotions have been identified to alter an individual’s views. For example, Lorenzoni, Nicholson-Cole and Whitmarsh [30] found that environmentally-sensitive people had a significantly stronger perception of climate change compared with individuals who were less environmentally sensitive. Although, Sheppard [31] acknowledges that emotions can be fabricated to influence the formation of perceptions. Alternatively, Fredrickson [26] claims that key factors such as dispositional optimism, stem from personality traits that define an individual’s worldview and perceptions. Thus, an individual’s perceptions have the capacity to influence emotional response and ultimately emotional stability [32]. North [33] further argues the influence that the force and type of change can have on both emotions and perceptions. For example, the considerable decline in resource sector activity and the flow on effects to other industries may stimulate negative emotions. As such, this relationship in the context of regional economic development requires further investigation for theoretical refinement.
Moreover, the relationship between emotional stability and resilience has been discussed within the resilience literature, as it is recognised that emotional stability at an individual level affects the collective capacity of the community to be resilient [2,19]. However, there is a lack of understanding and conceptual clarity on how the relationship between emotion and community resilience is influenced when perceptions of change are also considered [20]. Studies have explicitly explored community perceptions of resilience. For example, Kimhi and Shamai [34] examined perceptions of community resilience to the threat of political violence across four communities, each with differing proximities to the Israel–Lebanon border. However, studies in this area do not explore the relationship between these perceptions and the actual levels of resilience in the community. Arguably, existing studies do not provide an accurate depiction of the relationship between perceptions of change and the resilience of the community.
Studies have inferred the relationship between resilience and perceptions of change primarily on the basis that change management approaches are aligning with stakeholder opinions [14,35]. Yet, further consideration must be given to the role perceptions of change and emotional stability have in building resilience. This review has established that the relationship between resilience, emotion and perceptions of change is fragmented and has not been adequately explored within the context of long-term structural change and economic transformation. From the literature, it can be hypothesised that there is a two-way relationship between perceptions of change and emotional stability, both of which will influence individual and community resilience (refer to Figure 1). The present research aims to test and understand this relationship and how it contributes to sustainable economic development, especially for regional communities. The following propositions will be tested: (1) Community members and groups with higher emotional stability and more positive perceptions of change will be more resilient; and (2) community members and groups connected to the resources sector will have lower levels of resilience, emotional stability and more negative perceptions of change, compared to the individuals connected to the tourism sector.
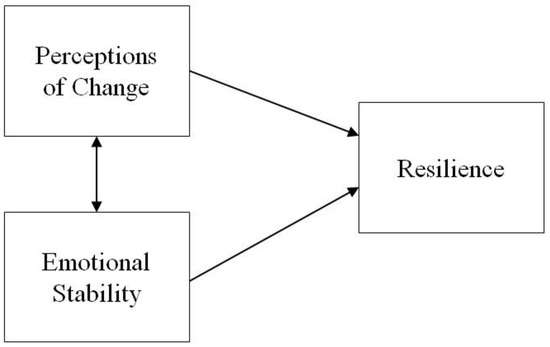
Figure 1.
Hypothesised relationship between perceptions of change, emotional stability and resilience.
3. Method
3.1. Data Collection
Two case studies were selected based on the economic importance and contribution (employment) that tourism and mining have on rural regions using data from the Australian Bureau of Statistics and Tourism Research Australia [2]. The Mackay and Whitsunday regions, located in Queensland, Australia, are two regions which have contended with prolonged exposure to structural change driven by tourism and mining. The Mackay region is indirectly associated with the resources sector and has a prominent tourism sector. The Whitsunday region is a leading Australian tourism destination, enveloped by the World Heritage Listed Great Barrier Reef. The region is also directly and indirectly linked within resource-based activity. At the time of the research, both regions were undergoing economic structural change.
Adopting a positivist perspective, surveys were distributed to residents of the Mackay and Whitsunday regions. To examine perceptions of change, participants were asked to assess how they perceived change in the region in general (PerchangeGen), and how they perceived change driven by the tourism (PerchangeTour) and resources (PerchangeRes) sectors in the region. A semantic differential scale was used to measure perceptions of change [36]. The bipolar adjectives for this nine-item scale were adopted from Gartner [37] and further enhanced by recent literature on resilience with similar aims and objectives [38]. The adjectives included opportunity/threat, small/large, positive/negative, adaptive/inflexible, insignificant/overwhelming, passive/forceful, unpleasant/pleasant, gloomy/exciting, and growing/declining.
To measure self-reports of participants’ emotional stability, a seven-item scale was adapted from Judge, van Viane & de Pater [39], based on the classifications of emotional stability by Saucier [40]. This scale adopted a 5-point Likert-type agreement scale (1 = ‘strongly disagree’, 5 = ‘strongly agree’). Similarly, community resilience was measured using 28 indicators of resilience on a 5-point Likert-type scale, with a ‘Don’t Know’ option where scores were coded as ‘0’. The indicators were established through an extensive review of previous studies, refined using a three-phased Delphi Study [41].
Survey distribution adopted a mixed-mode, non-random sampling method consisting of purposive, convenience and cluster sampling techniques. Dillman, Smyth and Christian [42] and Teddlie and Yu [43] support the use of mixed mode sampling across multiple channels for community research, as it allows various channels to be utilised to target a broad spectrum of community demographic groups. The mixed-mode approach consisted of third party organisations, face-to-face recruitment, a mail back strategy and online advertisement. A total of 663 respondents participated in the survey, with 411 being from Mackay and 252 from the Whitsunday region.
Data from the surveys were compiled and analysed using the statistical software package, STATA v. 13. To account for the bias that results from the use of a non-random mixed mode sampling and enhance the generalisability of the results [44], the data were merged and weighted to the population of each region by age and sex using the latest Australian Bureau of Statistics regional population data [45]. The applied weights assign values to the gender and age groups of each region, based on the population data. The values assigned to the data indicate the degree of significance that each case will have in the analysis. The weighted data allowed the analysis of results to be a representative of the population [44].
3.2. Scale Development
Scales were devised for perceptions of change and emotional stability, whilst an index was developed for the resilience variables. Following an approach by McLennan, Moyle, Ruhanen and Ritchie [46], Cronbach’s alpha, exploratory factor analysis and confirmatory factor analysis were used to test the reliability and validity of the instruments. A detailed discussion of the scale and index development process can be found in Bec et al. [2]. To measure perceptions of change, three 5-item scales were devised as different perceptions to certain types of change were evident: (i) The perceptions of change in general (PerchangeGen), (ii) perceptions of resources sector change (PerchangeRes), and (iii) perceptions of tourism change (PerchangeTour). To measure emotional stability, a seven-item scale was developed, whilst an 18-item index was developed to measure resilience.
3.3. Analysis
To assess the relationships between perceptions of change, emotional stability and community resilience, structural equation modelling (SEM) was undertaken. To further validate the model, path analysis was employed. Path analysis is a multiple regression which provides estimates of significance between sets of variables [47]. Partial disaggregation was employed due to the high number of indicators to ensure parsimony in the model and avoid the model being under-identified. This technique resulted in a model with better statistical properties than a more complex model using all individual indicator items [47].
Lastly, cluster analysis was used as an exploratory technique to analyse the community resilience and emotional stability levels for different community groups [48]. Hierarchical clustering, specifically the Ward’s linkage method, was used to form the segments of the cluster analysis, as it explores a range of potential cluster solutions [49]. To determine significant correlations among variables, design-based F-tests were employed [50].
3.4. Limitations
This study has limitations due to the methodological approach. Firstly, examining perceptions can be a limitation, as it may not be an accurate reflection of reality. Yet, using perceptions to assess the impacts of change, as well as measure resilience, is supported by previous literature [51]. Mixed mode sampling approaches can also limit the generalisability of the results. To overcome the limitations associated with the sampling, the analysis has been run using both weighted and unweighted data to validate the models [44]. Finally, Rundle-Thiele et al. [49] acknowledged that cluster analysis does not provide an explanation or interpretation of the cluster variables. By comparing the cluster variables against other variables, correlations can be identified, providing insight on the level of community resilience and emotional stability of the population.
4. Results
4.1. Relationship between Perceptions of Change, Emotional Stability and Resilience
A structural equation model was developed using partial disaggregation to determine the relationship between perceptions of change, emotional stability and community resilience. Given the complexity of the model, the SEM model was devised without the use of survey weights, which can have implications for confirming the validity of the model. The goodness-of-fit indices for the SEM model were acceptable with the exception of the CD score (0.56) which did not meet the required index level of above 0.7 [52]. However, Schermelleh-Engel and Moosbrugger [53] recognised that low CD scores can result from complex models using unweighted data.
The final model demonstrates high scores between the variables (refer to Figure 2), further confirming their strength. Moreover, the final model indicated that in comparison to PerchangeTour, PerchangeGen (0.97) and PerchangeRes (0.7) were more dominant perceptions of change. Additionally, a positive relationship was identified between emotional stability and resilience (0.24). This suggests that as emotional stability increases, community resilience will also increase. Alternatively, a negative relationship was identified between perceptions of change and community resilience (−0.27). This suggests that as perceptions of change decrease, community resilience increases.
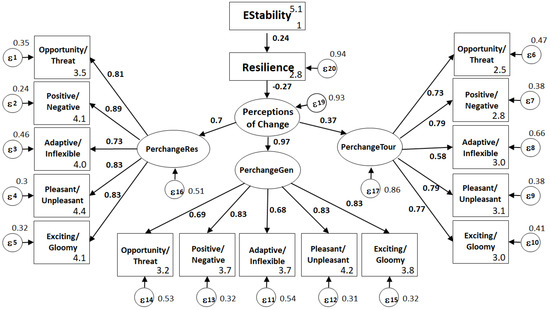
Figure 2.
Community resilience, emotional stability and perceptions of change model.
To validate the model, path analysis was also conducted between individual variables using survey weights [47]. Table 1 presents the results of the path analysis for the individual variables in the model. The regression presented similar results to the model, with a positive relationship evident between emotional stability and resilience, and a negative relationship between perceptions of change and resilience. Figure 3 presents the path diagram, displaying these relationships.

Table 1.
Variable path analysis.
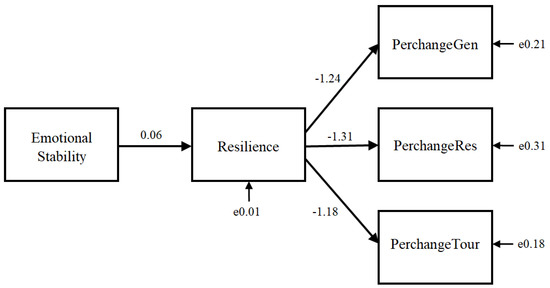
Figure 3.
Path analysis diagram.
4.2. Emotional Stability, Perceptions of Change and Resilience of Community Segments
The cluster analysis for the emotional stability and community resilience variables identified three relatively even cluster groups. Table 2 overviews the three clusters that emerged. Design-based F-tests were used to determine factors influencing or characterising the clusters, with statistically significant results identified by an asterisk (*) in Table 2. Given the results, the three clusters were labelled as: Cluster 1—Vulnerable disconnected individuals, Cluster 2—Tradies and those servicing the resources sector, and Cluster 3—Resource sector employees and those not in the private sector.
Table 2.
Cluster analysis demographic results.
The emotional stability and resilience of each cluster was then determined by examining the clusters against each emotional stability and resilience indicator. Table 3 outlines the mean () and median () values of the clusters for each indicator (1 = strongly disagree, 5 = strongly agree). The higher the value, the more emotionally stable or resilient the group, or the more desirable (Opportunity, Positive, Adaptive, Pleasant, Exciting) the perceptions of change. However, scores closer to 0 for resilience indicators reflected lower levels of resilience and/or higher uncertainty.
Table 3.
Emotional stability, resilience and perceptions of change among cluster groups.
All cluster groups had moderate to high emotional stability, however, Cluster 1 had greater levels of stress and nervousness and lower happiness with their lifestyle. Interestingly, overall the respondents scored ‘stressed’ the lowest, followed by nervous. Cluster 1 also had the lowest resilience, whilst Cluster 2 had moderate levels, and Cluster 3 had the highest levels of resilience. Cluster 1 was found to have more “Don’t Know” responses to the resilience variables than the other cluster groups, representing uncertainty and disconnection from the community, potentially contributing to the lower levels of resilience. This also aligns with Cluster 1’s disconnection from the tourism and resources sectors.
The weak and strong areas of the community can be identified when examining the resilience indicators individually. For example, economic support (Res_1, Res_2) and community support (Res_11, Res_12) were found to be significant contributors to the resilience of Clusters 2 and 3. Additionally, planning, preparedness and collaboration (Res_5, Res_6, Res_7, Res_8, Res_10, Res_13, Res_15, Res_16, Res_17, Res_18) were found to be higher in Cluster 3 than other cluster groups. Alternatively, all clusters had low levels of resilience relating to the reliance on natural resources, income from the resources sector, and high population turnover (Res_8, Res_9, Res_22), thus meaning they have high levels of dependence on these factors.
Whilst all clusters had neutral perceptions for PerchangeGen, Cluster 3, which had higher resilience and emotional stability, considered change to be less threatening and more positive than the other clusters. PerchangeRes found that Clusters 1 and 2 were categorised by more undesirable perceptions of change driven by the resources sector. These clusters consisted of higher numbers of Mackay residents, with lower overall emotional stability and resilience. This can be attributed to the prominence of change driven by the resources sector in Mackay and the impact the sector has had on the community. However, scores across all cluster groups were relatively high suggesting that change driven by the resources sector is perceived undesirable across the communities.
For the perceptions of change driven by tourism (PerchangeTour), a largely desirable perception exists among the cluster groups. Cluster 3 (which consists of high representation of Whitsunday residents) considered change to be more desirable than other cluster groups. This perception may stem from the prominence and importance of the sector in the region. The results demonstrate the differences the tourism and mining sectors have on the community and the different ways they influence the emotional stability of residents.
5. Discussion
This research suggested a relationship may exist between the concepts of emotional stability, perceptions of change, and resilience. The literature suggests that perceptions of change influence emotional stability, both of which influence community resilience [2,19]. As displayed in Figure 3, the results presented an alternate path relationship whereby the relationship between emotional stability and perceptions of change are mediated by community resilience.
The first research proposition hypothesized that community members and groups with higher emotional stability and more positive perceptions of change will be more resilient. The results did not support this proposition as it was found that residents’ perceptions of change decreased among the more resilient community groups, indicating that as perceptions of change decrease (or become more negative), community resilience increases. This to an extent aligns with the findings from Kimhi and Shamai’s [34] study, where resilient communities were those who were perceived to be less impacted by change. However, the results of the present research do not support the explanations given to these findings in the study. Instead, in this research, the more resilient community groups were found to have stronger adaptive characteristics and were more emotionally stable, including having a positive outlook, and having the ability to cope with most problems. The psychology literature offers a perspective to view the findings, suggesting that more resilient individuals are acutely aware and realistic of change in their lives [18,54]. Thus, being aware of change, resilient individuals are able to be more prepared and to develop the mechanisms to adapt and better manage change. Regions should, therefore, give considerable attention to building adaptive capacity within community systems, as it can influence the perceptions and response to change.
The second research proposition hypothesised that community members and groups connected to the resources sector will have lower levels of resilience, emotional stability and more negative perceptions of change, compared to the individuals connected to the tourism sector. This proposition was supported in the present research. Given that the study was undertaken during a time of rapid change in both regions, particularly a downturn in the resources sector, respondents with a connection to the resources sector had lower emotional stability and resilience compared with respondents who were not directly associated with the sector. From the literature on community perceptions of the tourism and resources sectors, it is evident that structural change places specific pressure on the lifestyle of individuals, generating a high degree of uncertainty particularly for the individuals involved with or connected to the resources sector [55]. The pressure and uncertainty inflicted by the resources sector at the time of the research directly aligns with the key emotional stability and mental health factors, such as stress and concern for future outlook, which can influence an individual’s resilience [18]. Therefore, the impacts of the resources sector on the emotional stability of residents assist in explaining the stronger relationship between perceptions of change, community resilience and emotional stability for residents in resource-based communities.
The relationship between the level of community resilience, emotional stability and perceptions of change was further illustrated by the differences between tourism and resource-driven change. Change driven by the resources sector was more negatively perceived across all cluster groups, noting the sector was in a period of rapid decline when the study was undertaken. Previous research suggests this results from its economic dominance and the noticeable physical change the sector creates [56]. According to Gilberthorpe and Papyrakis [56], the physical changes stemming from the resources sector creates the perception that change is amplified and that the sector is a less environmentally sustainable development pathway. Thus, as evidenced within the present research, community members may perceive tourism to be a more environmentally sustainable development alternative.
While the changes induced by the resources sector were predominantly negatively perceived, the present study further revealed an opportunistic perception of change for the future. The community outlook saw a desirable perception of tourism across all cluster groups. According to Neil and Tykkylainen [57], a downturn in the resources sector often results in increased attention given to other sectors, including tourism. Thus, the potential for greater tourism focus could explain desirable perceptions of tourism change and the higher levels of resilience for groups connected to the tourism sector, suggesting that tourism is perceived to be a more sustainable economic development alternative. Moreover, the desirable perception of the tourism sector may be attributed to the flexibility and diversity of the sector, as it enables skills from other sectors and specialised areas to be transferred to the tourism industry [58]. The resources sector, on the other hand, has a more rigid skill requirement, where employees need to be highly specialised within a specific area [59]. Therefore, the tourism sector may offer an adaptable and sustainable pathway for the region’s long-term viability and to soften fluctuations driven by structural change.
Irrespective of the tourism and resources sectors, community groups which had higher emotional stability viewed change within the community as more of an opportunity rather than a threat. Previous studies have shown that having a positive outlook is central for change management and fostering positive change [60]. More specifically, studies on cognitive behavioural therapy have found that a positive outlook towards change can promote action, direction and commitment, limiting the negative traumas associated with change, such as stress and anxiety [61,27]. This is particularly important for building resilience, as it requires long-term planning and forward thinking [62]. Practical applications of resilience, therefore, need to consider emotional stability in their strategic approaches.
6. Conclusions
Perceptions of change must be explored for multiple economic sectors which contribute to structural change in a region. This provides a deeper understanding of emotional stability and resilience to structural change, specifically how the relationship differs among economic sectors. This research demonstrates that for building community resilience, attention must be given to the individual factors that have the capacity to influence the resilience of the collective entity, in this instance a geographically defined community [15]. This research sought to understand the relationship between perceptions of change, emotional stability and resilience to manage long-term structural change. Using the Mackay and Whitsunday regions as a case study, exploratory and confirmatory factor analysis as well as cluster analysis were used to test the research propositions: (1) Community members and groups with higher emotional stability and more positive perceptions of change will be more resilient; and (2) community members and groups connected to the resources sector will have lower levels of resilience, emotional stability and more negative perceptions of change, compared to the individuals connected to the tourism sector.
The present research identified the intricate link between the concepts of resilience, emotional stability and perceptions of change in the process of managing long-term structural change. However, the first research proposition was not supported, as the results demonstrated a negative relationship between perceptions of change and resilience, suggesting that as perceptions of change decrease, resilience increases due to the adaptive characteristics of resilient individuals [54]. Perceptions of change were also found to have a more profound impact on resilience in resource-based communities compared with tourism communities, supporting the second research proposition. The desirable perceptions of tourism suggest that community members may perceive tourism to be a more sustainable development pathway to manage structural change.
This research has implications for the practical aspects of regional planning, development, and policy making, particularly for long-term planning. For instance, the findings of this research suggest that governments need to ensure a community has high levels of emotional stability and resilience prior to implementing structural change, as these individual factors influence the collective success of change. A limitation of this research is that it was conducted at one point in the transformation process when both regions were undergoing structural change. These results may not be generalizable to other community contexts that are at a different stage in the transformation process. Therefore, further replication of this research is required within communities that are at a different stage in the structural change process. Research is also needed to examine the emotional stability, perceptions of change and resilience of community members to other forces of economic change.
Author Contributions
A.B. contributed to the conceptual design of the study, data collection, drafting the article and final approval. B.M. contributed to the conceptual design of the study, drafting the article and final approval. C.-l.M. contributed to the conceptual design of the study, drafting the article and final approval.
Funding
This manuscript was supported by an Advance Queensland Fellowship (grant number AQRF10316-17RD2), in conjunction between the Murweh Shire and the Department of Innovation Tourism and Industry Development, Queensland Australia.
Conflicts of Interest
The authors declare no conflicts of interest.
References
- Kaldor, N. The Relation of Economic Growth and Cyclical Fluctuations. Econ. J. 1954, 64, 53–71. [Google Scholar] [CrossRef]
- Bec, A.; McLennan, C.; Moyle, B.D. Community resilience to long-term tourism decline and rejuvenation: A literature review and conceptual model. Curr. Issues Tour. 2016, 19, 431–457. [Google Scholar] [CrossRef]
- Martin, R.; Sunley, P.; Gardiner, B.; Tyler, P. How regions react to recessions: Resilience and the role of economic structure. Reg. Stud. 2016, 50, 561–585. [Google Scholar] [CrossRef]
- Laitner, J. Structural change and economic growth. Rev. Econ. Stud. 2000, 67, 545–561. [Google Scholar] [CrossRef]
- Courvisanos, J.; Jain, A.; KMardaneh, K. Economic resilience of regions under crises: A study of the Australian economy. Reg. Stud. 2016, 50, 629–643. [Google Scholar] [CrossRef]
- Arnell, A. Resilience as a transformative capacity: Exploring the quadripartite cycle of structuration in a Mozambican resettlement programme. Geoforum 2015, 66, 26–36. [Google Scholar] [CrossRef]
- Zautra, A.; Hall, J.; Murray, K. Community development and community resilience: An integrative approach. Community Dev. 2008, 39, 130–147. [Google Scholar] [CrossRef]
- Maclean, K.; Cuthill, M.; Ross, H. Six attributes of social resilience. J. Environ. Plan. Manag. 2014, 57, 144–156. [Google Scholar] [CrossRef]
- Eraydin, A. The role of regional policies along with the external and endogenous factors in the resilience of regions. Camb. J. Reg. Econ. Soc. 2016, 9, 217–234. [Google Scholar] [CrossRef]
- Herman, A. ‘More-than-human’ resilience(s)? Enhancing community in Finnish forest farms. Geoforum 2016, 69, 34–43. [Google Scholar] [CrossRef]
- Ross, H.; Berkes, F. Research approaches for understanding, enhancing, and monitoring community resilience. Soc. Nat. Resour. Int. J. 2014, 27, 787–804. [Google Scholar] [CrossRef]
- Adger, W.N. Social and ecological resilience: Are they related? Prog. Hum. Geogr. 2000, 24, 347–364. [Google Scholar] [CrossRef]
- Cochrane, J. The sphere of tourism resilience. Tour. Recreat. Res. 2010, 35, 173–185. [Google Scholar] [CrossRef]
- Berkes, F.; Ross, H. Community resilience: Towards and integrated approach. Soc. Nat. Resour. 2013, 26, 5–20. [Google Scholar] [CrossRef]
- Florida, R.; Mellander, C.; Stolarick, K. Inside the black box of regional development—Human capital, the creative class and tolerance. J. Econ. Geogr. 2008, 8, 615–649. [Google Scholar] [CrossRef]
- Hauge, M.M.; Fold, N. Resilience and reworking practices: Becoming the first-generation of industrial workers in Can Tho, Vietnam. Geoforum 2016, 77, 124–133. [Google Scholar] [CrossRef]
- Bonanno, G.A.; Galea, S.; Bucciarelli, A.; Vlahov, D. What predicts psychological resilience after disaster? The role of demographics, resources, and life stress. J. Consult. Clin. Psychol. 2007, 75, 671–682. [Google Scholar] [CrossRef]
- Bonanno, G.A. Loss, trauma, and human resilience: Have we underestimated the human capacity to thrive after extremely aversive events? Am. Psychol. 2004, 59, 20–28. [Google Scholar] [CrossRef]
- Norris, F.H.; Stevens, S.P.; Pfefferbaum, B.; Wyche, K.F.; Pfefferbaum, R.L. Community resilience as a metaphor, theory, set of capacities, and strategy for disaster readiness. Am. J. Community Psychol. 2008, 41, 127–150. [Google Scholar] [CrossRef]
- Friborg, O.; Barlaug, D.; Martinussen, M.; Rosenvinge, J.H.; Hjemdal, O. Resilience in relation to personality and intelligence. Int. J. Methods Psychiatr. Res. 2005, 14, 29–42. [Google Scholar] [CrossRef]
- Staal, M.A.; Bolton, C.; Yaroush, R.A.; Bourne, L.E. Cognitive performance and resilience to stress. In Biobehavioral Resilience to Stress; Lukey, B.J., Tepe, V., Eds.; CRC Press: Boca Raton, FL, USA, 2008; pp. 259–288. [Google Scholar]
- Kirmayer, L.J.; Sehdev, M.; Whitley, R. Community resilience: Models, metaphors and measures. J. Aborig. Health 2009, 5, 62–117. [Google Scholar]
- Paton, D. Disaster resilience: Integrating individual, community, institutional and environmental perspectives. In Disaster Resilience: An Integrated Approach; Paton, D., Johnston, D., Eds.; Charles C Thomas: Springfield, IL, USA, 2006; pp. 305–318. [Google Scholar]
- Lawson, C.W.; Saltmarshe, D.K. The psychology of economic transformation: The impact of the market on social institutions, status and values in a northern Albanian village. J. Econ. Psychol. 2002, 23, 487–500. [Google Scholar] [CrossRef]
- MacFadyen, A.J.; Wood MacFadyen, H.; Prince, N.J. Economic stress and psychological well-being: An economic psychology framework. J. Econ. Psychol. 1996, 17, 291–311. [Google Scholar] [CrossRef]
- Fredrickson, B.L. The role of positive emotions in positive psychology: The broaden-and-build theory of positive emotions. Am. Psychol. 2001, 56, 218–226. [Google Scholar] [CrossRef] [PubMed]
- Fredrickson, B.L.; Joiner, T. Positive emotions trigger upward spirals toward emotional well-being. Psychol. Sci. 2002, 13, 172–175. [Google Scholar] [CrossRef] [PubMed]
- Devilly, G.J.; Wright, R.; Varker, T. Vicarious trauma, secondary traumatic stress or simply burnout? Effect of trauma therapy on mental health professionals. Aust. N. Z. J. Psychiatry 2009, 43, 373–385. [Google Scholar] [CrossRef] [PubMed]
- Trippany, R.L.; White Kress, V.E.; Wilcoxon, S.A. Preventing vicarious trauma: What counselors should know when working with trauma survivors. J. Couns. Dev. 2004, 82, 31–37. [Google Scholar] [CrossRef]
- Lorenzoni, I.; Nicholson-Cole, S.; Whitmarsh, L. Barriers perceived to engaging with climate change among the UK public and their policy implications. Glob. Environ. Chang. 2007, 17, 445–459. [Google Scholar] [CrossRef]
- Sheppard, S.R.J. Landscape visualisation and climate change: The potential for influencing perceptions and behaviour. Environ. Sci. Policy 2005, 8, 637–654. [Google Scholar] [CrossRef]
- Peters, E.M.; Burraston, B.; Mertz, C.K. An emotion-based model of risk perception and stigma susceptibility: Cognitive appraisals of emotion, affective reactivity, worldviews, and risk perceptions in the generation of technological stigma. Risk Anal. 2004, 24, 1349–1367. [Google Scholar] [CrossRef]
- North, D.C. Understanding the Process of Economic Change; Princeton University Press: Princeton, NJ, USA, 2005. [Google Scholar]
- Kimhi, S.; Shamai, M. Community resilience and the impact of stress: Adult response to Israel’s withdrawal from Lebanon. J. Community Psychol. 2004, 32, 439–451. [Google Scholar] [CrossRef]
- Schwarz, A.-M.; Béné, C.; Bennett, G.; Boso, D.; Hilly, Z.; Paul, C.; Posala, R.; Sibiti, S.; Andrew, N. Vulnerability and resilience of remote rural communities to shocks and global changes: Empirical analysis from Solomon Islands. Glob. Environ. Chang. 2011, 21, 1128–1140. [Google Scholar] [CrossRef]
- Heise, D.R. The semantic differential and attitude research. In Attitude Measurement; Summers, G.F., Ed.; Rand McNally: Chicago, IL, USA, 1970; pp. 235–253. [Google Scholar]
- Gartner, W.C. Tourism image: Attribute measurement of state tourism products using multidimensional scaling techniques. J. Travel Res. 1989, 28, 16–20. [Google Scholar] [CrossRef]
- Friman, M. The structure of affective reactions to critical incidents. J. Econ. Psychol. 2004, 25, 331–353. [Google Scholar] [CrossRef]
- Judge, T.A.; van Vianen, A.; de Pater, I.E. Emotional Stability, Core Self-Evaluations, and Job Outcomes: A Review of the Evidence and an Agenda for Future Research. Hum. Perform. 2004, 17, 325–346. [Google Scholar] [CrossRef]
- Saucier, G. Effects of variable selection on the factor structure of person descriptors. J. Personal. Soc. Psychol. 1997, 73, 1296–1312. [Google Scholar] [CrossRef]
- Bec, A.; Moyle, B.; McLennan, C. Lessons Learnt from a Delphi Study on Community Resilience to Long-Term Structural Change; Paper presented at the Council for Australasian Tourism and Hospitality Education Conference; Southern Cross University: Gold Coast, Australia, 2015. [Google Scholar]
- Dillman, D.A.; Smyth, J.D.; Christian, L.M. Internet, Phone, Mail and Mixed-Mode Surveys: The Tailored Design Method, 4th ed.; John Wiley & Sons: Hoboken, NJ, USA, 2014. [Google Scholar]
- Teddlie, C.; Yu, F. Mixed methods sampling: A typology with examples. J. Mix. Methods Res. 2007, 1, 77–100. [Google Scholar] [CrossRef]
- Porter, S.R. Raising response rates: What works? New Dir. Inst. Res. 2004, 2004, 5–21. [Google Scholar] [CrossRef]
- Australian Bureau of Statistics. Australian Demographic Statistics June 2015 (Cat. No. 3101.0). 2015. Available online: http://www.abs.gov.au/AUSSTATS/abs@.nsf/allprimarymainfeatures/6CBA90A25BAC951DCA257F7F001CC559?opendocument (accessed on 15 September 2017).
- McLennan, C.; Moyle, B.D.; Ruhanen, L.M.; Ritchie, B.W. Developing and testing a suite of institutional indices to underpin the measurement and management of tourism destination transformation. Tour. Anal. 2013, 18, 157–171. [Google Scholar] [CrossRef]
- Shipley, B. Cause and Correlation in Biology: A User’s Guide to Path Analysis, Structural Equations and Causal Inference; Cambridge University Press: Cambridge, UK, 2000. [Google Scholar]
- Fredline, E.; Faulkner, B. Host community reactions: A cluster analysis. Ann. Tour. Res. 2000, 27, 763–784. [Google Scholar] [CrossRef]
- Rundle-Thiele, S.; Kubacki, K.; Tkaczynski, A.; Parkinson, J. Using two-step cluster analysis to identify homogeneous physical activity groups. Mark. Intell. Plan. 2015, 33, 522–537. [Google Scholar] [CrossRef]
- Thomas, D.R.; Rao, J.N.K. Small-sample comparisons of level and power for simple goodness-of-fit statistics under cluster sampling. J. Am. Stat. Assoc. 1987, 82, 630–636. [Google Scholar] [CrossRef]
- Buys, L.; Miller, E.; van Megen, K. Conceptualising climate change in rural Australia: Community perceptions, attitudes and (in)actions. Reg. Environ. Chang. 2012, 12, 237–248. [Google Scholar] [CrossRef]
- Hooper, D.; Coughlan, J.; Mullen, M. Structural equation modelling: Guidelines for determining model fit. J. Bus. Res. Methods 2008, 6, 53–60. [Google Scholar]
- Schermelleh-Engel, K.; Moosbrugger, H. Evaluating the fit of structural equation models: Tests of significance and descriptive goodness-of-fit measures. Methods Psychol. Res. 2003, 8, 23–74. [Google Scholar]
- Bless, H.; Fiedler, K.; Strack, F. Social Cognition: How Individuals Construct Social Reality; Psychology Press: Hove, UK, 2004. [Google Scholar]
- Ivanova, G.; Rolfe, J.; Lockie, S.; Timmer, V. Assessing social and economic impacts associated with changes in the coal mining industry in the Bowen Basin, Queensland, Australia. Manag. Environ. Qual. Int. J. 2007, 18, 211–228. [Google Scholar] [CrossRef]
- Gilberthorpe, E.; Papyrakis, E. The extractive industries and development: The resource curse at the micro, meso and macro levels. Extr. Ind. Soc. 2015, 2, 381–390. [Google Scholar] [CrossRef]
- Neil, C.; Tykkylainen, M. Local Economic Development: A Geographic Comparison of Rural Community Restructuring; United Nations University Press: Tokyo, Japan, 1998. [Google Scholar]
- Ladkin, A. Exploring tourism labor. Ann. Tour. Res. 2011, 38, 1135–1155. [Google Scholar] [CrossRef]
- Bahn, S.; Barratt-Pugh, L.; Yap, G. The employment of skilled migrants on temporary 457 visas in Australia: Emerging issues. Labour Ind. 2012, 22, 379–398. [Google Scholar] [CrossRef][Green Version]
- Avey, J.B.; Wernsing, T.S.; Luthans, F. Can positive employees help positive organizational change? Impact of psychological capital and emotions on relevant attitudes and behaviors. J. Appl. Behav. Sci. 2008, 44, 48–70. [Google Scholar] [CrossRef]
- Beck, J.S. Cognitive Behaviour Therapy: Basics and Beyond; Guilford Press: New York, NY, USA, 2011. [Google Scholar]
- Walker, B.; Carpenter, S.; Anderies, J.; Abel, N.; Cumming, G.; Janssen, M.; Lebel, L.; Norberg, J.; Peterson, G.D.; Pritchard, R. Resilience management in social-ecological systems: A working hypothesis for a participatory approach. Conserv. Ecol. 2002, 6, 14. [Google Scholar] [CrossRef]
© 2018 by the authors. Licensee MDPI, Basel, Switzerland. This article is an open access article distributed under the terms and conditions of the Creative Commons Attribution (CC BY) license (http://creativecommons.org/licenses/by/4.0/).