Abstract
Many studies reported the effect on plant functional groups and plant diversity under discontinuous slope gradient. However, studies on the effect of continuous slope gradient on plant functional groups and plant diversity in alpine meadows have rarely been conducted. We studied the effect of a continuous slope gradient on the dominance characteristics of plant functional groups and plant diversity of alpine meadows on the Tibetan plateau—in Hezuo area of Gannan Tibetan Autonomous Prefecture. Altogether, 84 samples of alpine meadows grass and 84 soil samples from seven slope gradients at sunlit slopes were collected. By using analysis of variance (ANOVA) and Pearson correlation coefficient, this study revealed: (1) Continuous slope gradient is an important factor affecting plant communities in alpine meadows, due to the physical and chemical characteristics of the soil and water content. The number of families, genera, and species increased first then decreased at the different slope gradient levels, respectively; (2) there is a close relationship between the soil and plant functional groups, and plant diversity. In other words, the slope determines the functional groups of plants and the soil nutrients; and (3) soil characteristics (pH value, Soil Total Nitrogen, Soil Water Content) are the determining factors of the plant community characteristics at each slope gradient level. To conclude, a continuous slope gradient is an important factor that affects plant communities in alpine meadows.
1. Introduction
The distribution and functional characteristics of vegetation are determined by zonal climatic conditions at regional and even global scales [1,2]. The topography not only redistributes water, heat and soil nutrients [3,4], but also affects the patterns and characteristics of vegetation at the landscape scales [5,6]. Therefore, topographic factors play an important part in effecting the functional characteristics and diversity of vegetation. Slope as one of the main topographical factors, not only has a great impact on the quantity and function of plant communities, but also a key abiotic factor in plant diversity and soil nutrient change. The effects of slope on plant communities are mainly reflected in the growth conditions and soil erosion of plant communities [7], common plants [8], species numbers [9], plant community characteristics, community diversity [10], and vegetation distribution patterns [11], and so on. Using slope to study vegetation characteristics and diversity distribution has become a prerequisite for revealing the relationship between topography and vegetation.
Alpine meadows are mainly distributed in mountainous areas and plateaus, even on areas maintained by harsh climatic conditions. As one of the main vegetation types in the middle and eastern parts of the Tibetan plateau, alpine meadows have important ecological value for maintaining the ecological balance and the development of animal husbandry of the Tibetan plateau. Numerous studies have been conducted in the field of the effects of topographic factors on the characteristics of plant communities in alpine meadows [12]. At present, previous studies have shown that altitude is an important topographic factor that causes plant community changes [13] and alpine meadows formation [14], while slope direction is the determinant of plant diversity, distribution pattern and functional traits in alpine meadows [15]. However, there is no relevant research on how the slope factor affects the plant community in alpine meadows, and the difference in the slope of the vegetation and its mechanism are still unclear in alpine meadows.
Therefore, in our study, we took the mountain vegetation of the sunny slope in alpine meadows in the eastern margin of the Tibetan plateau as the research object. The specific objectives were to reveal the influence mechanism of continuous sunny slope on the vegetation and soil characteristics of alpine meadows, based on the analysis of plant community characteristics and the physical and chemical properties of the soil under slope gradient. The study will provide more information on the sustainable use and restoration of alpine vegetation in alpine meadows and have an important ecological value in maintaining ecological balance and animal husbandry in the minority area.
2. Material and Methods
2.1. Study Area
The study area is distributed in the suburb of the eastern margin of the Tibetan plateau in Gansu province, China (34°57′23.16″–34°57′26.09″ N, 102°52′50.89″–102°53′43.57″ E) (Figure 1). The survey area was selected without interference from farming, which belongs to the summer pasture with the altitude from 2936 to 3100 m and an area of approximately 1 km2. According to the government website [16], the regional climate is characterized by a long cold season, with a mean annual temperature between −0.5 and 3.5 °C, the extreme maximum temperature of 28 °C, and the extreme minimum temperature of −24 °C. The mean annual precipitation is 545 mm, the annual evaporation is 1222 mm, and the average frost-free period is 48 days. Hence, the study area is a typical alpine region with plateau continental monsoon climate. In addition, the vegetation of this region harbors very large plant diversity, including Stipa purpurea, Festuca sinensis, Brachypodium sylvaticumvar, Carex crebra, Kobresia humips, Scirpus pumilus and Sanguisorba filiformis, Polygonum viviparum, Bupleurum smithii Wolff, Astragalus polycladus, Vicia unijuga, etc.
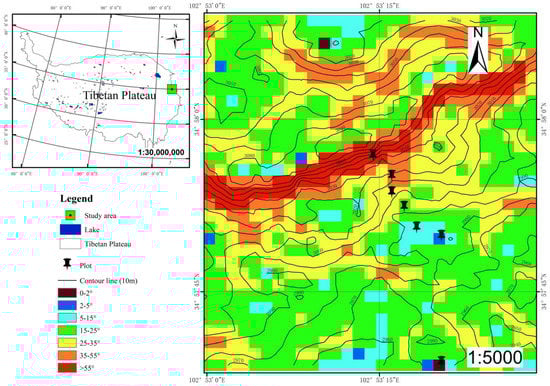
Figure 1.
The location of the study area.
2.2. Methods
2.2.1. Sampling Design
To study the relationship between slope and the vegetation community in alpine meadows, we selected the sunny slope of a small-scale mountain as the basic terrain unit as the survey object. The vegetation survey was conducted from 15 July to 1 August 2017. In our study, the study area was required to meet three conditions as follows: Sunny slope, with the similar inter-annual grazing intensity, and no cropping interference. Firstly, a total of seven plots were sampled according to the slope gradient based on the Digital Elevation Model (DEM). Then, approximately 2 × 10 m2 belts selected in each plot, based on the characteristics of topographical factors (mainly the slope direction and elevation). Each vegetation plot consisted of 12 quadrats of 0.5 × 0.5 m2 of inventory herb, and of eight quadrats of 2 × 2 m2 of shrub, in the alpine meadows. Herbs in quadrats of grasslands were counted, and their heights and percent cover were measured. In addition, a variable measured or collected at each plot, including plant species, species quantity, vegetation cover, plant height, plant frequency, and other related indicators. Furthermore, a soil sample was randomly collected with a 35 mm internal diameter, 20 cm depth and repeated 10 times at each sample. Then, a mixture of the soil samples at each sampling plot was used as a soil sample. The total vegetation samples number was 84 at a different slope. Besides, the total of 84 soil samples from the same survey area was collected. Moreover, measure and record the altitude, latitude and longitude, soil, vegetation type and interference status of each sample. In addition, the slope of the survey sample basically covers each slope gradient.
2.2.2. Data Analysis
According to the grassland plant economic group and plant types [17,18,19] the classification criteria, all the species were divided into six functional groups based on the utilization properties of alpine meadow plants in the study area, including Shrubs/Subshrubs (SS), Sedge family Herbage (SH), Perennial Bunch-grass (PB), Perennial Rhizome forbs (PR), Perennial Forbs (PF), and Annuals/Biennials (AB).
In addition, the slope was divided into seven gradient levels [20], that is I [0–2°], II (2–5°], III (5–15°], IV (15–25°], V (25–35°], VI (35–55°], and VII (55–90°].
Dominance (Summed Dominance Ratio SDR3 of three factors) for shrubs and herbs were calculated as follows [21]:
where SDR3 means the summed dominance ratio of the species; relative height, relative coverage and relative density refers to the proportion of one species accounting for the sum calculated for each plot individually.
SDR3 = (relative height + relative overage + relative density)/3,
The species diversity was assessed by calculating different indices. The Species richness index (R), the Simpson index (D), the Shannon’s diversity index (H) [22] and the Pielou’s index of evenness (E) [23] were calculated using the following equations:
Species richness index (R)
Simpson’s diversity index (D)
Shannon-Wiener diversity index (H)
Pielou’s index of evenness (E)
where , is the proportion of individuals found in the ith species, S is the total number of species, and N is the total individuals of all species present.
To estimate the relationship between slope gradient and the physical and chemical characteristics of the soil, five factors were chosen to investigate the soil characteristics, including Soil pH value (pH), Soil Organic Matter (SOM), Soil Total Nitrogen (STN), Soil Total Potassium (STK) and Soil Water Content (SWC). The determination of soil samples were analyzed as follows: (1) pH value was measured by 1:1 soil suspensions with a pH meter; (2) SOM was determined by Walkley and Black Rapid titration method [24]; (3) STN in 0.5 g soil samples by digestion with sulphuric acid and a K2SO4:CuSO4: Se catalyst; (4) STK was determined using NaOH fusion method; (5) using spectrophotometer, the absorbance was measured at 660 nm, SWC was measured at the depth of 20 cm as SWC = (massf − massd)/massf, where massf is the fresh mass of soil, while massed is the dry mass of soil.
2.2.3. Analysis Methodology
Community evenness was compared by producing dominance-diversity [22] plots using the vegan package in program R. A one-way ANOVA was applied to determine significant differences between different index using SPSS 16.0 (SPSS Inc., Chicago, IL, USA). Furthermore, the relationship between soil factors and plant traits were analyzed by Pearson’s correlation coefficient. The linear graph was done by OriginPro 2017 software (OriginProLab Corporation, Northampton, MA, USA, 2017).
3. Results
3.1. Analysis of the Plant Species and Community Quantitative Characteristics of Sunny Slope
Altogether, 84 samples of alpine meadows grass from seven slope gradients in sunny slope were collected. There were 27 families, 101 genera and 134 species distributed in sunny slope survey plots, among which 11 species were sedge family herbage (SH), nine species were Perennial Bunch-grass (PB), 10 species were Perennial Rhizome forbs (PR), 76 species were Perennial Forbs (PF), 21 species were Annuals/Biennials (AB), and 4 species were Shrubs/Subshrubs (SS).
As shown from Table 1, the number of families, genera, and species increased first then decreased at the different slope gradient level, with the peak at level IV (15–25°], IV (15–25], III (5–15°], respectively. K. humilis was the dominant species at the slope gradient level I [0–2°], and V (25–35°], respectively. Furthermore, E. nutans was a sub-dominant species at each slope gradient level, but it was dominant at level IV (15–25°] and VI (35–55°], with the dominance was 19.29% and 14.67%, respectively. S. capillata was the main associated species at slope gradient level I [0–2°], and it became the dominant species at level II (2–5°] and III (5–15°] then the dominance gradually decreased. P. pratensis was the main companion at each slope gradient level. Perennial weeds become the main companion species in different gradients, such as P. fragarioides, M. ruthenica, S. chamaejasme, and T. mongolicum, and so on. Although the dominant species distributed at different slope gradient level, the dominance values of the dominant species were small with huge fluctuations. Therefore, the distribution of dominance was relatively fragmented, and the dominant position of the species was not prominent in the study area (Table 1).

Table 1.
Composition of plant families and species under different slopes.
3.2. Effects of Slope Differentiation on Plant Community and the Physical and Chemical Properties of Soil
3.2.1. Effect of Slope on the Composition of Plant Functional Groups
The Plant Functional Groups (PFG) concept was used as a framework for investigating the linkages between ecosystem functions and plant biodiversity.
As shown in Figure 2, at different slope gradient level, the dominance of SH increased first then decreased with the highest dominance was at V slope gradient level (p < 0.01). The dominance of PR was low and changed mild at I–V slope gradient level, however, which increased significantly at VI–VII slope gradient level (p < 0.05). In addition, the dominance of PB obviously decreased with a significant difference at each slope gradient level (p < 0.01); and there was no PB detected at level VII. The dominance of PF maintains superiority with difference fluctuation at each slope gradient level (p < 0.01). The dominance of AB was changed with huge fluctuations and significant differences at each slope gradient level (p < 0.01). There was no related species of SS at I–IV slope gradient level, while the dominance of SS was increased obviously with a significant difference at V–VII slope gradient level (p < 0.01).
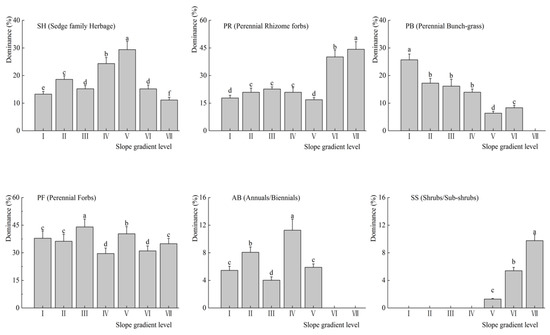
Figure 2.
Cumulative dominance values of life-form functional groups under different micro-topographic conditions (mean ± SE). All variables were examined using ANOVA with Tukey’s test α = 0.05. Bars with different letters indicate differences between sampled slopes. the same below.
3.2.2. Effect of Slope Gradient on Plant Diversity
The effect of slope on the habitat can be reflected by plant diversity. As described in Figure 3, the richness index (R) increased first and then decreased with the increase of slope gradient level (p < 0.01). Furthermore, Shannon-wiener index (H) decreased with the slope gradient level increased. However, there was a significant difference of Shannon-wiener index (H) at each slope gradient level (p < 0.05). Similarly, the higher the slope gradient level, the lower the Simpson’s diversity index (D). There was no significant difference effect on the Simpson’s diversity index (D) at each slope gradient level (p > 0.05). In addition, the Pielou’s index of evenness (E) was lower at the slope gradient level IV than that at other slope gradient level (p < 0.05).
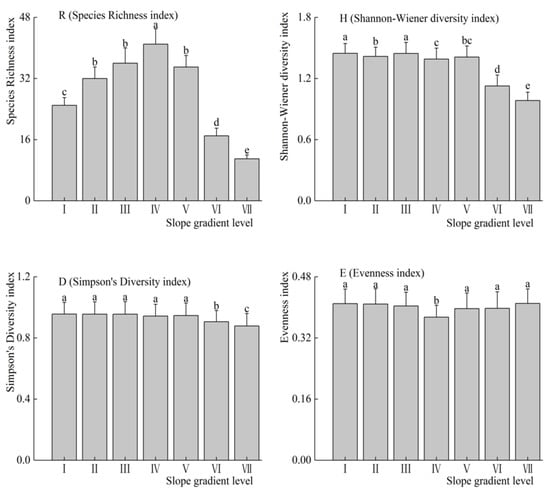
Figure 3.
Plant diversities at each slope gradient level (mean ± SE).
3.2.3. Effect of Slope on the Physical and Chemical Characteristics of Soil
Figure 4 shows the effect of slope on the physical and chemical characteristics of the soil. The pH value slightly increased with slope gradient level increased (p < 0.05). In addition, Soil Organic Matter (SOM), Soil Total Nitrogen (STN) and Soil Water Content (SWC) were obviously decreased with the slope gradient increase at each slope gradient level, respectively (p < 0.05); and the Soil Total Phosphorus (STP) increased with the slope gradient increase with no significant difference at each slope gradient level (p > 0.05). However, Soil Total Potassium (STK) decreased first and then increased with the slope gradient increased (p < 0.01).
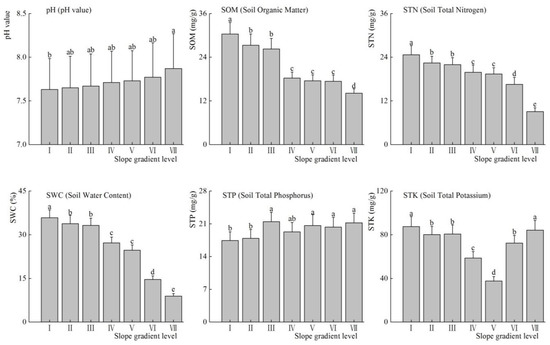
Figure 4.
Cumulative dominance values of life-form functional groups under different micro-topographic conditions (mean ± SE).
3.3. Correlation Analysis
3.3.1. Correlation Analysis between the Characteristics of Plant Functional Groups and Soil Factors
As can be seen from the data in Table 2, under different slope gradient level, the physical and chemical characteristics of the soil had a greater effect on the plant functional groups. The correlation was significant between plant functional groups and the physical and chemical characteristics of the soil. The results showed that SS has a highly significant negative correlation with STN, while the highly significant positive correlation with SWC, and pH, respectively. SH has a highly significant negative correlation with STK; and PR has a highly significant negative correlation with SWC, while the significant positive correlation with pH and the significant negative correlation with STN, respectively. In addition, a highly significant positive correlation was observed between PB and SOM, STN and SWC, respectively. However, PB had a highly significant negative correlation with PH. The correlation between the physical and chemical characteristics of the soil with PF, and AB was no significant, respectively.
Table 2.
The correlation matrix between plant communities and soil factors.
Above all, we can see that the characteristic of plant functional groups was closely related to the physical and chemical characteristics of the soil. In other words, the spatial heterogeneity of the physical and chemical characteristics of the soil affected by slope gradient has a significant impact on the plant functional groups. Furthermore, pH, STN, and SWC were the main characteristics of the soil, which were closely related to the plant functional groups.
The spatial heterogeneity of the physical and chemical properties of the soil, due to slope, had a significant impact on plant functional groups. There was a close relationship between the soil and plant functional groups, and plant diversity. In addition, pH, STN and SWC were the determining factors for plant community characteristics at each slope gradient level.
3.3.2. Correction Analysis between Plant Diversity and the Physical and Chemical Characteristics of Soil
As shown in Table 3, under the slope gradient level, the physical and chemical characteristics of the soil had a greater effect on plant diversity. There was a significant positive correlation between D and SWC, and STN, respectively, but an extreme significant negative correlation between D and PH (p < 0.01). In addition, a significant correlation was observed between D and SOM (p < 0.05). Furthermore, H has a significant positive correlation with SWC, and STN, respectively, but an extreme significant negative correlation with PH (p < 0.01). However, the physical and chemical characteristics of the soil have no significant correlation with R and E, respectively (p > 0.05). The results showed that PH, STN and SWC were the main characteristics of the soil, which has the closed related with the plant diversity.
Table 3.
The relationship between plant diversity and soil.
4. Discussions
4.1. The Difference of the Plant Functional Groups at Each Slope Gradient Level
The plant functional groups combined of all plant species responding to abiotic and biotic environmental constraints in ecosystems or biomes based on plant traits [25]. The dynamic and stable community structure formed by plant functional groups is a comprehensive adaptation of environmental factors, such as topography and soil. This specific structure is the basis for maintaining the functions and processes of vegetation ecosystems.
Slope affected plant functional groups, directly or indirectly, by changing ecological factors, such as partial moisture, heat, light intensity, and the physical and chemical characteristics of the soil. A previous study proved that topographic factors, such as slope, have a significant influence on the spatial distribution of vegetation, which was the main factor affecting plant species composition, soil and water conditions in alpine meadows [26]. According to Table 1 and Figure 2, under the influence of the slope, the dominance change of alpine meadow plant community was not obvious while the dominant degree of the plant functional groups changes extremely obvious in the survey area. Different plant functional groups have different topographical choices [27]. Shrubs/Subshrubs plants (SS), and Perennial Rhizomes (PR) gradually tends to dominant above the slope gradient level IV (15–25°]. While, the plant dominance of Sedge family Herbage (SH), Perennial Bunch-grass (PB), and Annuals/Biennials (AB) was declined above level IV, respectively (Figure 2). With the increase of the slope gradient, the composition of plant communities is gradually simplified. Therefore, as the slope gradient increases, other species are almost impossible to find. The slope becomes one of the limiting factors of the plant community. For example, Cotoneaster adpressus Bois can grow in thin soil and above 25°, which was an adaptation of the plant habitats, and therefore has the effect of indicating the slope.
The effects of soil erosion and nutrient loss were irreversible, so nutrient changes often have continuity between different slope gradient levels (Figure 4). In addition, the types and quantities of nutrient elements required for the normal growth of different plants have differentiation characteristics [28]. However, the differentiation characteristics affected on the species distribution and the plant functional groups. If the soil nutrient types and contents changed, the grassland plant community components may change to some extent [29]. Then, the original species will be replaced by other species that are better suited to the new soil conditions [30]. As a result, plant functional groups have changed. The plant community has good adaptability through the recombination of different plant functional groups and the adjustment of species within the plant functional groups at different slope gradient level. In our study, there were two plant communities (AB and PF) had little affected by the physical and chemical properties of the soil (Figure 2), indicating that they easy to occupy and utilize any kind of soil resources and grow rapidly.
4.2. The Plant Diversity at Each Slope Gradient Level
Plant diversity was an important parameter for characterizing community structure, which not only reflected changes in species composition within the community, but also characterized community habitat differences and stability [31,32].
In the study area, plant diversity was affected by the slope, because the soil and water condition were rich in the habitat on the lower part of the slope, therefore, the plant diversity was high. The soil and water conditions were poor in the steeper slope; therefore, the plant diversity was low. In addition, the change of the plant community diversity was caused by the habitat heterogeneity [33]. Greater slope inclination further worsens the conditions leading to diminished diversity [34]. Some studies reported that greater slope inclination further worsens the conditions prevent competitive species from monopolizing resources, resulting in an increase in plant diversity [35,36,37]. We have observed that the index (plant richness index (R), the Simpson’s diversity index (D), and the Shannon-wiener index (H)) began to decrease at the slope gradient level V (25–35°], due to the soil nutrient and root distribution spatial condition deteriorated with the slope increased (Figure 3). Although the dominance of some plant functional groups increased (such as PR and SS, shown in Figure 2), even some perennial weeds can also become a single dominant species community.
Ecosystems with high plant diversity contained species that are resistant to the specific environmental disturbances, which can compensate for the disturbances on the ecosystems [38]. Some studies have shown that the regular changes in plant diversity index can reflect the stability of the community [38,39,40]. The composition of plant species is different at each slope gradient level, so the values of various diversity indices appear irregularly in the study area. As shown in the fourth subfigure in Figure 3, at the level IV, the dominance of some species is extremely obvious with high superiority and low uniformity, indicating that the dominant species of plant communities at the slope gradient are prominent, which increases the instability of the community. Changes in the evenness index may be strongly influenced by biotic or abiotic factors [41].
Some studies have shown that grazing leads to reduced species diversity and species uniformity [42,43,44,45], but significantly increases species dominance. In other words, the community stability affected by the consequences of grazing [46,47,48]. Soil infertility factors limit the growth of plant populations [49]. Similarly, the physical and chemical properties of the soil at different slope gradient also can limit the growth of populations of plants. In addition, other factors, such as interspecific competition among plants, and coevolution of animals and plants, et al. will also have an impact on community diversity.
The irregularity of alpine meadow plant community characteristics was caused by many reasons along slope gradient. At present, we mainly choose the slope factor to explain the irregularity of the plant community characteristics in alpine meadows. It is also an incomplete performance in the single factor study of the terrain. Under the gradient, irregularity will conduct a more in-depth analysis in the study of grazing disturbance in alpine meadows.
4.3. The Physical and Chemical Characteristics of Soil at Each Slope Gradient Level
The physical and chemical properties of the soil not only determine the process of vegetation growth and decomposition of plant residues, but also affect the development of plant communities at each slope gradient level. Previous studies reported that the soil characteristic (STP, SOM, SWC, and pH value) has an impact on the growth of aboveground vegetation. Among all above soil characteristics, the two main factors are pH value and SWC [50,51].
In our study, SOM declined with the increase of the slope gradient, while pH value increased with the slope gradient increased. The reason might be that the soil erosion is serious that aggravates the loss of soil nutrients in alpine meadows [52,53,54]. Thus, the loss of SOM and soil nutrients increased with the increase slope gradient, which is more obvious in the steeper slope. However, litter releases a large amount of organic acid during the process of decomposition at gentle slope, and thus reduces the pH value of the soil [55]. In other words, pH and SOM have opposite trends with the increase of the slope gradient, which is consistent with our findings. In addition, SWC declined with the increase of the slope gradient in our study. Some studies [56,57] also reported that SWC is lower in the steeper slope than that in the gentle slope. The reason might be that the SWC is lower due to the water loss in the steeper slope, while SWC increased because of the long-term accumulation of soil moisture in the gentle slope [58,59,60].
4.4. The Relationship between Plant Community Characteristics and the Physical and Chemical of Soil
It is well-known that plants absorb nutrients and water through the soil, thus the relationship between plants and soil is more direct than the relationship between plants and terrain [63]. The soil was the nutrient source for vegetation, therefore, changes in the physical and chemical characteristics of the soil, and its distribution, has a great impact on plant growth. There is a significant correlation between the characteristics of vegetation and the soil [27]. In our study, the characteristics of plant functional groups were significantly correlated with the physical and chemical characteristics of the soil at each slope gradient level (Table 2). Similarly, plant diversity was closely related to the physical and chemical characteristics of the soil at each slope gradient level (Table 3). We found that the plant diversity showed a positive correlation with SOM; but significant negative correlation with pH value. These findings were also in line with a previous study [64]. Plant functional groups and diversity are closely related to a few soil factors. N and P are the main growth-limiting nutrients for plants in natural environments. Both elements play an essential role in plant growth. In most terrestrial ecosystems, the process of the ecosystems was limited by N and P cycles [65]. The content of phosphorus and potassium in the soil has an important impact on the species diversity of tropical plant communities [66]. Increasing the content of N in soil will enhance the primary productivity of the community, but significantly reduce the diversity of community species [67]. Therefore, high content of phosphorus in soil is considered as one of the main factors limiting species diversity on grasslands [68]. Gradients of soil depth and water availability were found to be the main factors influencing plant composition patterns. The main growth-limiting nutrients of the Tibetan plateau were N and P [69]. The changes in the quantity and composition of available nutrients of N and P have a significant impact on the species composition and community structure of plant communities [29]. In our study, soil total nitrogen, pH and water on different slopes of alpine meadows are the main factors determining plant functional groups and plant diversity.
When plant species change significantly in plant communities, plant diversity may change [70]. Plant communities might variance the content of some nutrient elements in soil, which leads to dynamic changes in the physical and chemical properties of the soil [30]. In other words, there was an interdependent and restrictive relationship between vegetation and the soil [71].
5. Conclusions
The slope provides a heterogeneous habitat for the plant community and affects the soil development. Continuous slope gradient is an important factor affecting plant communities in alpine meadows. Plant community characteristics and the physical and chemical properties of the soil varied significantly at each slope gradient level. In our study, the main conclusions were as follows: (1) Slope is the main factor that affects plant species composition, soil and water conditions in alpine meadows, directly or indirectly, by changing ecological factors, such as partial moisture, and the physical and chemical characteristics of the soil; (2) the dominance values of dominant species are small and show fluctuations; (3) different plant functional groups and plant diversity have irregularities, which reflects that the plant community characteristics are affected by many factors; and (4) the physical and chemical properties of soil continually changes. Furthermore, there was a close relationship between the soil and plant functional groups, and plant diversity. In addition, pH value (pH), Soil Total Nitrogen (STN) and Soil Water Content (SWC) were determining factors of plant community characteristics at each slope gradient level.
Author Contributions
Formal analysis, Q.-P.Z., Z.-G.Z. and Q.W. Funding acquisition, J.W.; Software, H.-L.G.; Writing—original draft, and J.W.; Writing—review and editing, Q.-P.Z. and J.W. All authors have approved the final article.
Funding
This research was funded by Natural Science Foundation of China (41271204), the Construction Project of the Superior Discipline in Jiangsu’s Universities(164320H116) and the National Natural Science Foundation (41501575).
Acknowledgments
We are grateful to the editor and anonymous reviewers.
Conflicts of Interest
The authors declare no conflict of interest.
References
- Woodward, F.I.; Mckee, I.F. Vegetation and climate. Environ. Int. 1991, 17, 535–546. [Google Scholar] [CrossRef]
- Zhang, X. A vegetation-climate classification system for global change studies in China. Quat. Sci. 1993, 13, 157–169. [Google Scholar]
- Wang, H.Z.; Li, R.D.; Wu, H.H. Quantitative study on height differentiation of land use degree in the suburban county of Wuhan city based on spatial overlaying analysis. Resour. Environ. Yangtze Basin 2002, 11, 531–535. [Google Scholar]
- Chen, L.; Zhang, S.; Fu, B.; Peng, H. Correlation analysis on spatial pattern of land use and soil at catchment scale. Acta Ecol. Sin. 2003, 23, 2497–2505. [Google Scholar]
- Luo, J.; Zhou, W.; Qin, C.; Deng, Q.; Luo, M.; Xiao, X.U.; Liu, G.; Zhang, B.; Guohong, L.I. Response of vegetation to micro-topography in the gullied area of Yuanmou dry-hot valley. J. Mt. Sci. 2012, 30, 535–542. [Google Scholar]
- Chang, X.L.; Lü, S.H.; Feng, Z.Y.; Ye, S.X. Impact of topography on the spatial distribution pattern of net primary productivity in a meadow. Acta Ecol. Sin. 2015, 35, 3339–3348. [Google Scholar]
- Jubenville, A.; O’Sullivan, K. Relationship of vegetation type and slope gradient to trail erosion in interior Alaska. J. Soil Water Conserv. 1987, 68, 729–737. [Google Scholar]
- Scatena, F.N.; Lugo, A.E. Geomorphology, disturbance, and the soil and vegetation of two subtropical wet steepland watersheds of Puerto Rico. Geomorphology 1995, 13, 199–213. [Google Scholar] [CrossRef]
- Zheng, D.; Hunt, E.R.; Running, S.W. Comparison of available soil water capacity estimated from topography and soil series information. Landsc. Ecol. 1996, 11, 3–14. [Google Scholar] [CrossRef]
- Kapolka, N.M.; Dollhopf, D.J. Effect of slope gradient and plant growth on soil loss on reconstructed steep slopes. Int. J. Surf. Min. Reclam. Environ. 2001, 15, 86–99. [Google Scholar] [CrossRef]
- Liu, J.G.; Xue, J.H. Impacts of slope gradient on the characteristics of Vetiveria zizanioides community in early-stage. Grassl. Turf 2010, 30, 56–61. [Google Scholar]
- Zhu, S.B.; Xu, W.N.; Liu, G.; Zhao, J.; Chen, Y.G. Effect of slope gradient on physiological characteristic of mediccago sativa and Cynodon Dactylon. Res. Soil Water Conserv. 2012, 19, 218–221. [Google Scholar]
- Wei, S.; Huang, F.; Yang, J. A base of formation on meadow vegetation. Pratacultural Sci. 2001, 18, 16–19. [Google Scholar]
- Zhang, H.Q. Species diversity of plant community in the origin area of the Minjiang River, southwestern China. Res. Soil Water Conserv. 2013, 20, 135–140. [Google Scholar]
- Liu, Z.Q.; Zhu, Q.K.; Wang, J.; Kuang, G.M.; Zhao, H. Effect of site factor on plant community characteristic in closed watershed in loess hilly and gully region. Agric. Sci. Technol. 2011, 12, 274–278. [Google Scholar]
- Introduction of Hezuo City. Available online: http://www.hezuo.gov.cn/zjhz/hzgl/2017-03-11/14891651406086.html (accessed on 25 May 2018).
- Noymeir, I.; Gutman, M.; Kaplan, Y. Responses of mediterranean grassland plants to grazing and protection. J. Ecol. 1989, 77, 290–310. [Google Scholar] [CrossRef]
- Vesk, P.A.; Westoby, M. Predicting plant species’ responses to grazing. J. Appl. Ecol. 2001, 38, 897–909. [Google Scholar] [CrossRef]
- Zhang, Y.; Zhao, X. Quantitative characteristics of degenerative succession in festuca sinensis sowing grassland in the alpine pastoral area. Chin. J. Appl. Ecol. 2002, 13, 285–289. [Google Scholar]
- Zhou, C. Geomorphology Dictionary; China Water Power Press: Beijing, China, 2006. [Google Scholar]
- Zhang, T. Quantitative Ecology; Science Press: Beijing, China, 2011. [Google Scholar]
- Whittaker, R.H. Evolution and measurement of species diversity. Taxon 1972, 21, 213–251. [Google Scholar] [CrossRef]
- Pielou, E.C. Shannon’s formula as a measure of specific diversity: Its use and misuse. Am. Nat. 1966, 100, 463–465. [Google Scholar] [CrossRef]
- Walkley, A.; Black, I.A. An examination of the degtjareff method for determining soil organic matter a proposed modification of the chromic acid titration method. Soil Sci. 1934, 37, 29–38. [Google Scholar] [CrossRef]
- Cornelissen, J.H.C.; Lavorel, S.; Garnier, E.; Díaz, S.; Buchmann, N.; Gurvich, D.E.; Reich, P.B.; Steege, H.T.; Morgan, H.D.; Heijden, M.G.A.V.D. A handbook of protocols for standardised and easy measurement of plant functional traits worldwide. Aust. J. Bot. 2003, 51, 335–380. [Google Scholar] [CrossRef]
- Zhang, C.S.; Xie, G.D.; Bao, W.K.; Long, C.; Sha, P.; Na, F. Effects of topographic factors on the plant species richness and distribution pattern of alpine meadow in source region of Lancang River, Southwest China. Chin. J. Ecol. 2012, 31, 2767–2774. [Google Scholar]
- Smith, J.K. Constraints for the restoration of tropical alpine vegetation on degraded slopes of the Venezuelan Andes. Plant Ecol. Divers. 2015, 8, 277–291. [Google Scholar]
- Luo, Y.; Bo, S.U.; Currie, W.S.; Dukes, J.S.; Finzi, A.; Hartwig, U.; Hungate, B.; Murtrie, R.E.M.; Oren, R.; Parton, W.J. Progressive nitrogen limitation of ecosystem responses to rising atmospheric carbon dioxide. Bioscience 2004, 54, 731–739. [Google Scholar] [CrossRef]
- Janssens, F.; Peeters, A.; Tallowin, J.R.B.; Bakker, J.P.; Bekker, R.M.; Fillat, F.; Oomes, M.J.M. Relationship between soil chemical factors and grassland diversity. Plant Soil 1998, 202, 69–78. [Google Scholar] [CrossRef]
- Putten, W.H.V.D.; Wardle, D.A. Plant–soil feedbacks: The past, the present and future challenges. J. Ecol. 2013, 101, 265–276. [Google Scholar] [CrossRef]
- Guo, Q.; Berry, W.L. Species richness and biomass: Dissection of the hump-shaped relationships. Ecology 1998, 79, 2555–2559. [Google Scholar] [CrossRef]
- Mittelbach, G.; Steiner, C.; Scheiner, S.; Gross, K.; Reynolds, H.; Waide, R.; Willig, M.; Dodson, S.; Gough, L. What is the observed relationship between species richness and productivity? Ecology 2001, 82, 2381–2396. [Google Scholar] [CrossRef]
- Bärlocher, F.; Corkum, M. Nutrient enrichment overwhelms diversity effects in leaf decomposition by stream fungi. Oikos 2010, 101, 247–252. [Google Scholar] [CrossRef]
- Kopeć, M.; Zarzycki, J.; Gondek, K. Species diversity of submontane grasslands: Effects of topographic and soil factors. Pol. J. Ecol. 2010, 58, 285–295. [Google Scholar]
- Kampmann, D.; Herzog, F.; Jeanneret, P.; Konold, W.; Peter, M.; Walter, T.; Wildi, O.; Lüscher, A. Mountain grassland biodiversity: Impact of site conditions versus management type. J. Nat. Conserv. 2008, 16, 12–25. [Google Scholar] [CrossRef]
- Marini, L.; Scotton, M.; Klimek, S.; Pecile, A. Patterns of plant species richness in alpine hay meadows: Local vs. landscape controls. Basic Appl. Ecol. 2008, 9, 365–372. [Google Scholar] [CrossRef]
- Pykälä, J.; Luoto, M.; Heikkinen, R.K.; Kontula, T. Plant species richness and persistence of rare plants in abandoned semi-natural grasslands in northern Europe. Basic Appl. Ecol. 2005, 6, 25–33. [Google Scholar] [CrossRef]
- Tilman, D.; Downing, J.A. Biodiversity and stability in grasslands. Nature 1994, 367, 363–365. [Google Scholar] [CrossRef]
- Li, Y.Y.; Shao, M.A. The change of plant diversity during natural recovery process of vegetation in Ziwuling area. Acta Ecol. Sin. 2004, 24, 252–260. [Google Scholar]
- Baskin, Y. Ecosystem function of biodiversity. Biol. Sci. 1995, 44, 657–660. [Google Scholar] [CrossRef]
- Wang, G.H.; Zhou, G.S.; Yang, L.M.; Li, Z.Q. Distribution, Species diversity and life-form spectra of plant communities along an altitudinal gradient in the Northern slopes of Qilianshan Mountains, Gansu, China. Plant Ecol. 2003, 165, 169–181. [Google Scholar] [CrossRef]
- Angassa, A.; Oba, G. Effects of grazing pressure, age of enclosures and seasonality on bush cover dynamics and vegetation composition in southern Ethiopia. J. Arid Environ. 2010, 74, 111–120. [Google Scholar] [CrossRef]
- Dong, Q.M.; Ma, Y.S.; Li, Q.Y.; Zhao, X.Q.; Wang, Q.J.; Shi, J.J. Effects of Stocking Rates for Yak on Community Composition and Plant Diversity in Kobresia parva Alpine Meadow Warm season Pasture. Acta Bot. Boreali-Occident. Sin. 2005, 25, 94–102. [Google Scholar]
- Wang, C.T.; Long, R.J.; Wang, Q.L.; Cao, G.M.; Shi, J.J.; Du, Y.G. Response of plant diversity and productivity to soil resources changing under grazing disturbance on an alpine meadow. Acta Ecol. Sin. 2008, 28, 4144–4152. [Google Scholar]
- Bakker, J.P. Nature Management by Grazing and Cutting; Springer: Dordrecht, The Netherlands, 1989. [Google Scholar]
- Cao, C.Y.; Jiang, D.M.; Zhu, L.H.; Nan, Y.H. Degradation and diversity changes of meadow grassland in Keerqin Sandy Land. Acta Prataculturae Sin. 2006, 15, 18–26. [Google Scholar]
- Liu, W.T.; Wei, Z.J.; Lü, S.J.; Wang, T.L.; Zhang, S. The impacts of grazing on plant diversity in Stipa breviflora desert grassland. Acta Ecol. Sin. 2017, 37, 3394–3402. [Google Scholar]
- Biondini, M.E.; Patton, B.D.; Nyren, P.E. Grazing intensity and ecosystem processes in a northern mixed-grass prairie, USA. Ecol. Appl. 1998, 8, 469–479. [Google Scholar] [CrossRef]
- Crawley, M.J. Plant Ecology; Blackwell Science: Cambridge, MA, USA, 1996. [Google Scholar]
- Wrigh, I.J.; Reich, P.B.; Cornelissen, J.H.C.; Falster, D.S.; Gamier, E.; Hikosaka, K.; Lamont, B.B.; Lee, W.; Oleksyn, J.; Osada, N.; et al. Assessing the generality of global leaf trait relationships. New Phytol. 2005, 166, 485–496. [Google Scholar] [CrossRef]
- Xue, S.; Liu, G.B.; Pan, Y.P.; Dai, Q.H.; Zhang, C.; Yu, N. Evolution of soil labile organic matter and carbon management index in the artificial Robinia of loess hilly area. Sci. Agric. Sin. 2009, 42, 1458–1464. [Google Scholar]
- Wang, B.Q.; Liu, G.B. Effects of Relief on Soil Nutrient Losses in Sloping Fieldsin Hilly Region of Loess Plateau. J. Soil Eros. Soil Water Conserv. 1999, 5, 18–22. [Google Scholar]
- Li, G.L.; Wu, F.Q.; Liu, B.Z.; Zhang, X.N. The effect of erosion on soil properties on the Loess Plateau area. J. Arid Land Resour. Environ. 1997, 11, 45–52. [Google Scholar]
- Jiang, H.M. Dynamics of Soil Organic Carbon, Fertility and Water in Different Land Uses from the Semi-Arid Loess Plateau. Ph.D. Thesis, Lanzhou University, Lanzhou, China, 2006; pp. 37–45. [Google Scholar]
- Qiu, L.P. Change of Soil Quality and Its Regulation in Revegetation Ecosystem of the Loess Plateau. Ph.D. Thesis, Northwest A&F University, Yangling, China, 2007. [Google Scholar]
- Wu, W.Z. Spatial Heterogeneity of Soil Moisture and Its Relation to Topographic Factors at Hillslope Scale. Master’s Thesis, Lanzhou University, Lanzhou, China, 2014. [Google Scholar]
- Zhao, C.; Zhang, H.L.; Li, J.L.; Tian, J.; Wu, W.Z.; Jin, X.; Zhang, X.F.; Jiang, Y.W.; Wang, X.L.; He, C.S.; et al. Analysis of the relationships between the spatial variations of soil moisture and the environmental factors in the upstream of the Heihe River watershed. J. Lanzhou Univ. Nat Sci. 2014, 50, 338–347. [Google Scholar]
- Takahashi, K.; Murayama, Y. Effects of topographic and edaphic conditions on alpine plant species distribution along a slope gradient on Mount Norikura, central Japan. Ecol. Res. 2014, 29, 823–833. [Google Scholar] [CrossRef]
- Moore, L.D.; Burch, G.J.; Mackenzie, D.H. Topographic effects on the distribution of surface soil water and the location of ephemeral gullies. TASAE 1988, 31, 1098–1107. [Google Scholar]
- Qiu, Y.; Fu, B.J.; Wang, J.; Chen, L.D. Relation to environmental induces in a Spatial variability of soil moisture content and its semi-arid gully catchment of the loess plateau, China. J. Arid Environ. 2001, 49, 723–750. [Google Scholar] [CrossRef]
- Liu, F.; Zhang, H.Q. Effects of Land Use and Topographic Factors on the Variability of Soil Nutrients in Newly Reclaimed Area in Yili. Resour. Sci. 2012, 34, 758–768. [Google Scholar]
- Jing, G.B. Investigation on Soil Organic Carbon and Nutrient Concentrations of Summer- and Winter-Grazing Pastures in Xiahe County. Master’s Thesis, Lanzhou University, Lanzhou, China, 2014. [Google Scholar]
- Nikora, V.I.; Pearson, C.P.; Shankar, U. Scaling properties in landscape patterns: New Zealand experience. Landsc. Ecol. 1999, 14, 17–33. [Google Scholar] [CrossRef]
- Nie, Y.Y. The Training of Plant Community Diversity and Above Ground Biomass of the Habitat Gradient from South-Facing Slope to North-Facing Slope. Master’s Thesis, Lanzhou University, Lanzhou, China, 2010; pp. 27–30. [Google Scholar]
- Aerts, R.; Chapin, F.S., III. The mineral nutrition of wild plants revisited: A re-evaluation of processes and patterns. Adv. Ecol. Res. 2000, 30, 1–67. [Google Scholar]
- Gartlan, J.S.; Newbery, D.M.; Thomas, D.W.; Waterman, P.G. The influence of topography and soil phosphorus on the vegetation of korup forest reserve, cameroun. Vegetatio 1986, 65, 131–148. [Google Scholar] [CrossRef]
- Baer, S.G.; Blair, J.M.; Collins, S.L.; Knapp, A.K. Soil resources regulate productivity and diversity in newly established tallgrass prairie. Ecology 2003, 84, 724–735. [Google Scholar] [CrossRef]
- Kattge, J.; Diaz, S.; Lavoreli, S.; Prentice, I.C.; Leadly, P.; Bonisch, G.; Garnier, E.; Westoby, M.; Reich, P.B.; Wright, I.J. Try—A global database on plant traits. Glob. Chang. Biol. 2011, 17, 2905–2935. [Google Scholar] [CrossRef]
- Nie, Y.Y.; Li, X.E.; Wang, G. Variation mode of α diversity and β diversity of plant community of different habitat gradients from south-facing slope to north-facing slope and its relation with different environmental factors. J. Lanzhou Univ. 2010, 46, 73–79. [Google Scholar]
- Cong, W.F.; Ruijven, J.; Mommer, L.; De Deyn, G.B.; Berendse, F.; Hoffland, E. Plant species richness promotes soil carbon and nitrogen stocks in grasslands without legumes. J. Ecol. 2015, 102, 1163–1170. [Google Scholar] [CrossRef]
- Chen, P.; Chu, Y.; Gu, F.X.; Zhang, Y.D.; Pan, X.L. Spatial heterogeneity of vegetation and soil characteristics in oasis-desert ecotone. Chin. J. Appl. Ecol. 2003, 14, 904–908. [Google Scholar]
© 2018 by the authors. Licensee MDPI, Basel, Switzerland. This article is an open access article distributed under the terms and conditions of the Creative Commons Attribution (CC BY) license (http://creativecommons.org/licenses/by/4.0/).