Article

Evolution of Tourism in Natural Destinations and Dynamic Sustainable Thresholds over Time

by
Hördur V. Haraldsson
1,* and
Rannveig Ólafsdóttir
2
1
Swedish Environmental Protection Agency, Stockholm 106 48, Sweden
2
Department of Geography and Tourism Studies, University of Iceland, Reykjavík 101, Iceland
*
Author to whom correspondence should be addressed.
Sustainability 2018, 10(12), 4788; https://doi.org/10.3390/su10124788
Submission received: 2 November 2018 / Revised: 13 December 2018 / Accepted: 13 December 2018 / Published: 15 December 2018

Abstract

:
Tourism is a complex industry involving numerous types of activities that can have adverse environmental impacts and, over time, gradually change the way tourists experience tourist destinations and their choice of particular tourist destinations. The overall aim of this study is to examine the impact of tourism destination exploitation upon the perceived attractiveness of a particular destination to different types of visitors using the Purism Scale coupled to the Tourism Area Life Cycle (TALC). The study uses the system dynamics Causal Loop Diagram (CLD) approach, to analyse feedback loop behaviour and causal loop impacts over time. The results show that the different visitors’ types, as defined by the Purist Scale, affect the attractiveness of the tourist destination in different ways over time. The results further show that different visitors’ types cannot exist at their own optimum level at the same time in a destination. The concept tourism carrying capacity should thus be defined through the maximum site attractiveness,-based upon the optimum size of infrastructure that ensures low visual effect, low crowding effect, and low environmental impact. This enables better understanding of the different evolution phases of the tourist site during its push for infrastructure development.

1. Introduction

Past years’ international tourist arrivals seem to hit a new record every year. A total of 1.2 billion tourists travelled the world in 2015 according to UNWTO [1], which is a 4% increase from the previous year. Coinciding with increased tourism, impact from tourism activities is increasing worldwide. Numerous examples show that tourism can be a powerful agent of change, ranging from economic and socio-cultural impacts to environmental impacts [2,3,4,5,6,7]. Tourism impacts arise as both actual and perceived changes [8]. Perceived impacts include the perception and attitude of tourism stakeholders such as the local community, tourism entrepreneurs, and tourists. Actual environmental impacts include aspects like air pollution, noise pollution, visual pollution, sewage pollution, solid waste and littering, depletion of natural resources, land degradation, deforestation and intensified use of land for provision of activities and infrastructure development, alteration of ecosystems by tourist activities, disturbance of wildlife, loss of flora and fauna, natural habitat loss, loss of bio- and geodiversity, increased fire frequency, crowding and congestion, vandalism and urbanisation [2,8]. Tourism’s relationship with the environment thus involves numerous activities that can potentially have adverse environmental effects, and gradually destroy the environmental resources on which tourism depends, as stressed by UNEP [2]. A holistic understanding of the causal relationship between the different impact factors has never been more critical in order to sustain the fragile balance between tourism and the environment.
One of the most widely referred-to tourism models is Butler’s [7] traditional model of Tourism Area Life Cycle (TALC), illustrating the relationship between the number of tourists and an hypothetical evolution of a tourist destination over time. The model is based on a simple sigmoid growth (S-shaped) curve presenting different stages of tourism development (i.e., exploration, involvement, development, consolidation, stagnation and regeneration) in which a tourism destination is likely to go through with an increase in the number of visitors. In its original form, the initial exploration stage is followed by a growth stage reflecting a rapid development and consolidation of tourism infrastructure and services in response to increased popularity of the destination and subsequently increased numbers of visitors. In the stagnation stage, the increasing in the number of visitors to the destination level off and ultimately stops, mainly due to unpleasant factors that are starting to impact the popularity of the destination. These factors constitute the critical range for the destination’s carrying capacity and are usually related to, crowdedness, pollution, visual obstructions and change in appearances that reduce the value of the destination [9]. According to Butler [10], the original purpose of the model was to reflect the dynamic nature of destinations and propose a generalised process of development and potential decline which if recognised could be avoided by appropriate intervention in planning and development grounded on the concept of carrying capacity. However, since the model was first launched in 1980, it has been largely debated, and thus also repeatedly reviewed by Butler [5,10,11,12]. He [10] concludes that if we are to understand more about the life cycle of destination and tourism dynamic in general then moving from “what” happens to tourist destination in terms of their development process to “why” is still critical in order to identify driving forces and triggers which affect the transition process from one stage of development to another.
Due to delays in the system, a destination tends to overshoot its critical range of carrying capacity when reaching its saturation point of absolute number of visitors [9]. The reason stems from planning in hindsight, where development of services is done reactively instead of proactively. Subsequently, a rapid decline of the current visitors’ type occurs when their demands of the destination are no longer met. Ongoing changes are thus likely to transform the site to another cycle of tourism development and thus attract another type of visitor (Figure 1). The number of tourists may thus rebound and recover under an alternative form of tourism and create a new setting for the destination’s attractiveness and new (renewed) destination carrying capacity. In this regard, it is important to keep in mind that each stage or cycle in the evolution of a tourist destination entails changes as regards the number and type of visitors and the relationship between visitors and residents.
Many variables influence the individual’s perception and enthusiasm when visiting areas of natural beauty based on their background and interests [13] making it often impossible to estimate tourism carrying capacity. The major variables are the level of infrastructure and services at a site as well as the density of tourists, reflecting the varying needs, attitudes, expectations and diverse tolerances the different types of visitors have regarding anthropogenic impact on the environment. Some visitors are not sensitive to human-induced changes, while such changes can ruin the experience of nature for others [14]. The purism scale approach groups together visitors with similar attitudes to these changes into four purism groups: strong purists, moderate purists, neutralists and non-purists according to their perception of natural areas (Figure 2) [15,16]. In this study, these purism groups are used to represent the causal sequence of increased infrastructure in a tourism natural destination system.
System analysis and dynamics have been shown to be useful methods in interdisciplinary problem analysis and simulations e.g., [17,18,19,20,21,22,23,24,25,26], and have over the past decade been gaining a foothold within the behavioural and social sciences e.g., [27,28,29,30]. One valuable insight, is the use of Systems Archetypes to describe a set of common structural patterns that can be used to explain a generic behaviour over time in different type of problems [31,32,33,34,35,36,37,38,39]. Some known system archetypes from natural resource management [32] are the “tragedy of the commons”, coined by Hardin [40], the “limits to growth” from Club of Rome [41] and the “Tyranny of small steps” [26]. As regards tourism studies, there still seems to be a strong lean towards practical applications and limiting studies focusing on theoretical systematisation of tourism and its generic behaviour. Consequently, only a limited studies exist that focus on resource management and system dynamics in tourism, e.g., [42,43,44,45,46,47,48]. This study takes the approach of adhering the understanding of generic archetypical behaviours to better explain the theoretical evolution of natural destinations. Such understanding can better aid in framing the evolution of tourism in different settings and locations. With an increase in tourism worldwide, there is a critical need to understand tourism in a wider context through the lens of system dynamics.
This study uses the systems approach to increase the understanding of the causal relationship between increased tourism infrastructure and services in a natural destination and visitor behaviour, by combining the TALC and the Purism Scale models into a theoretical frame. The key questions posed are:
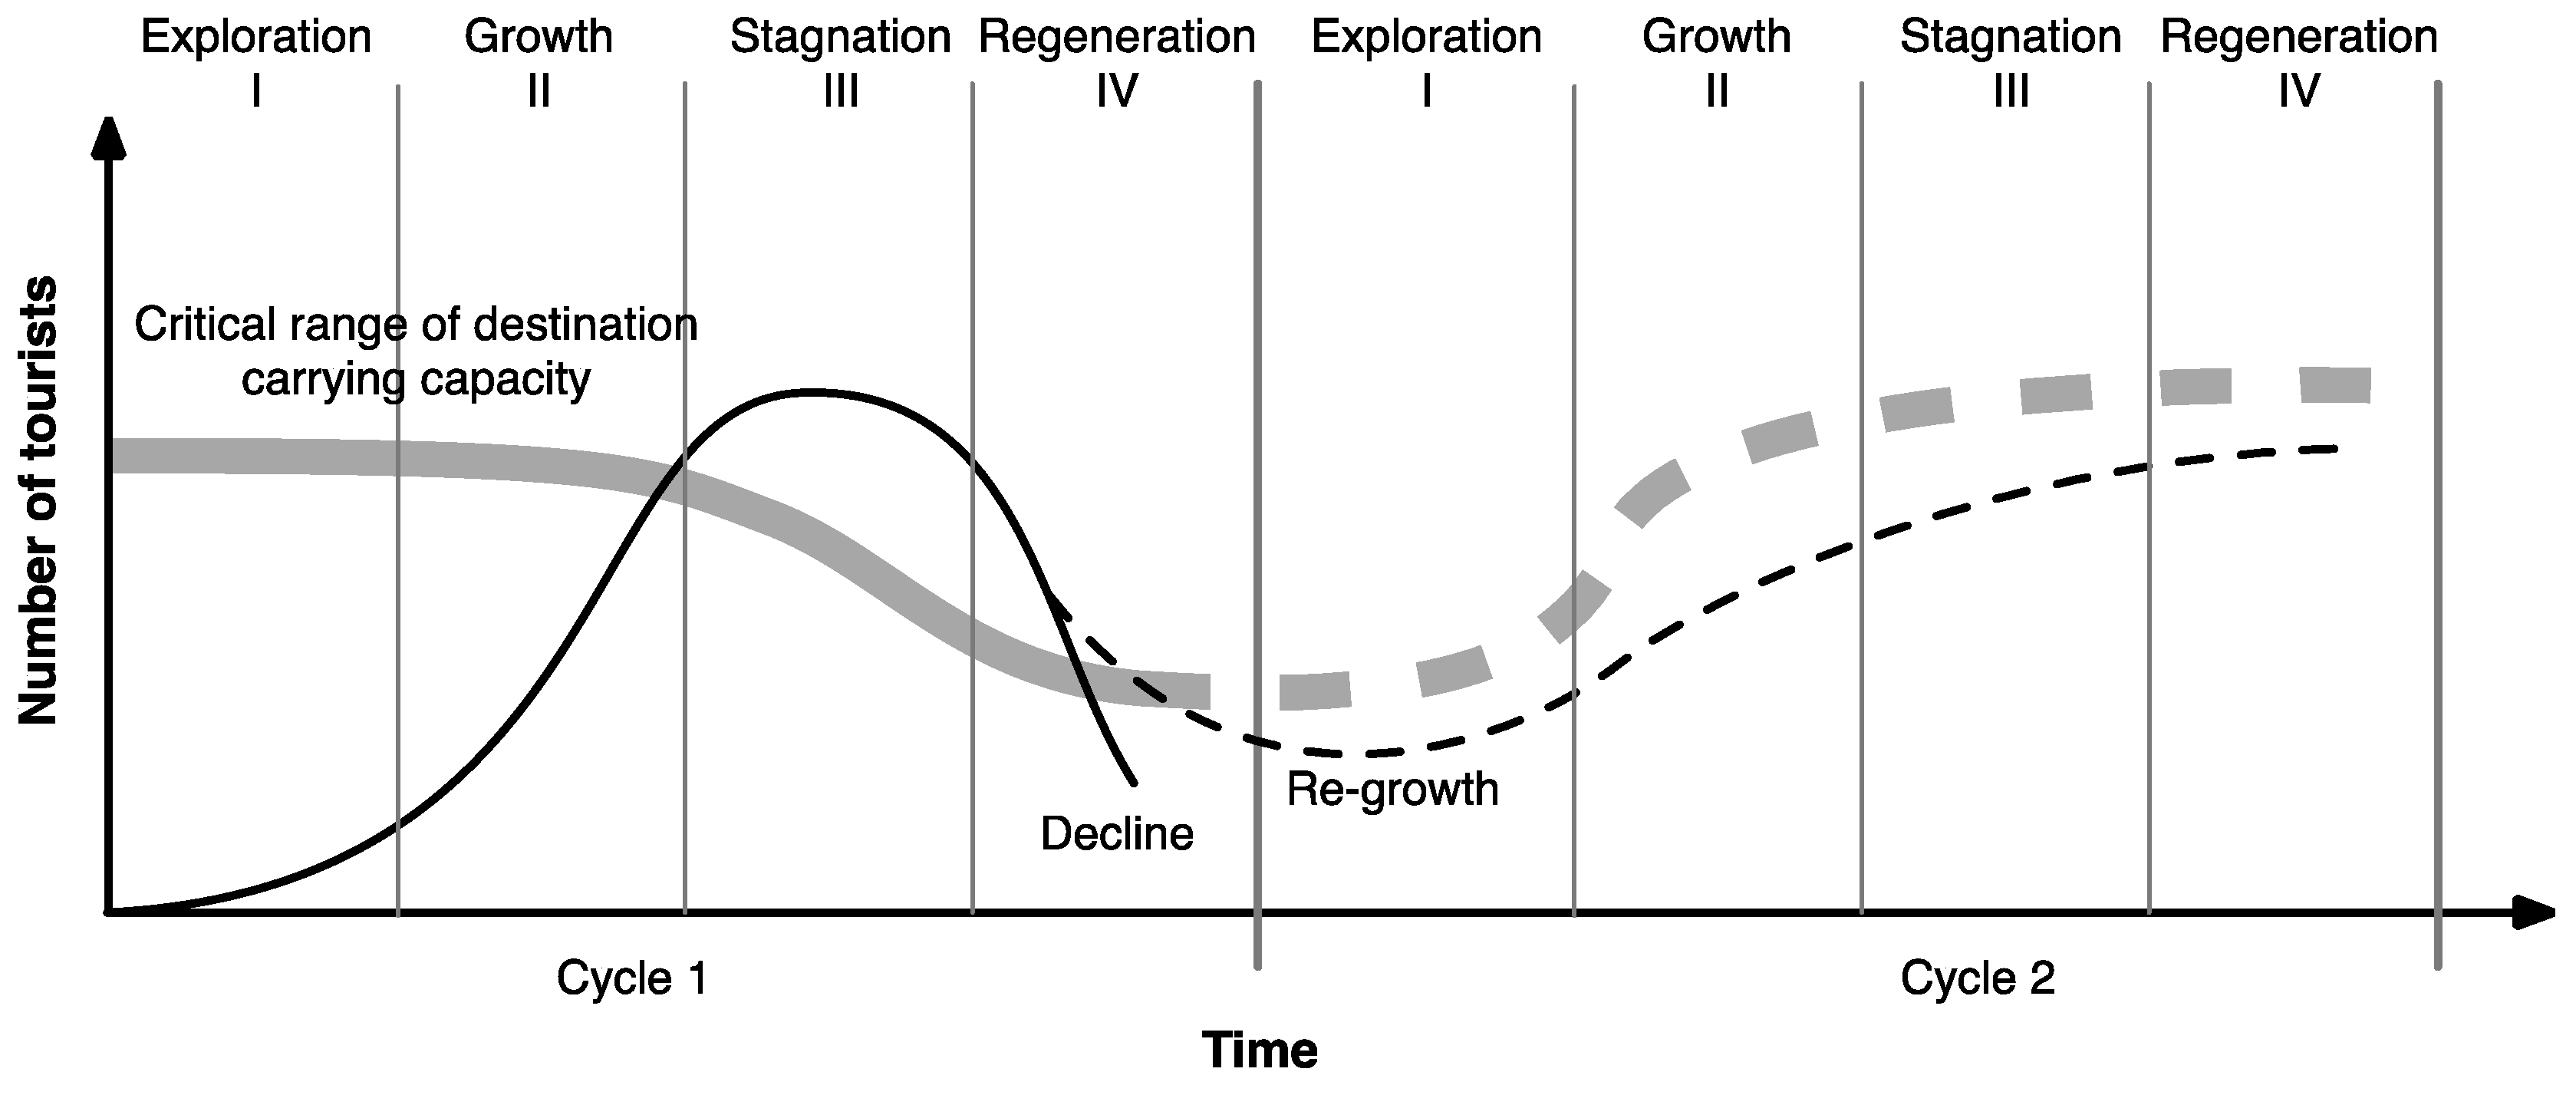
  • Can the combined TALC and Purism Scale be used to define a carrying capacity thresholds for different visitor types and a destination as whole?
  • What generic factors drive the attraction of a natural destination for different visitor types over time?
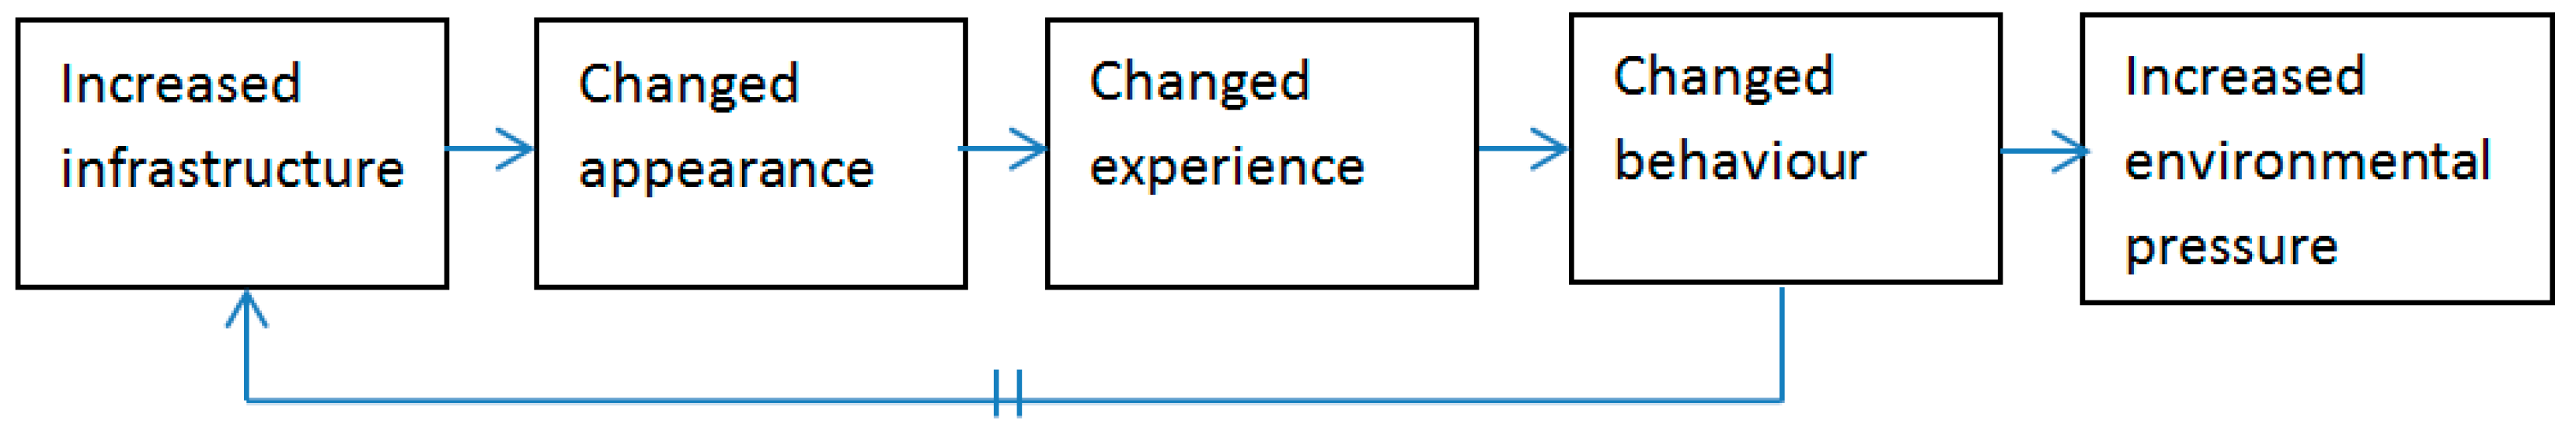
  • How do infrastructure and services influence a destination development over time?
The specific aims are to:
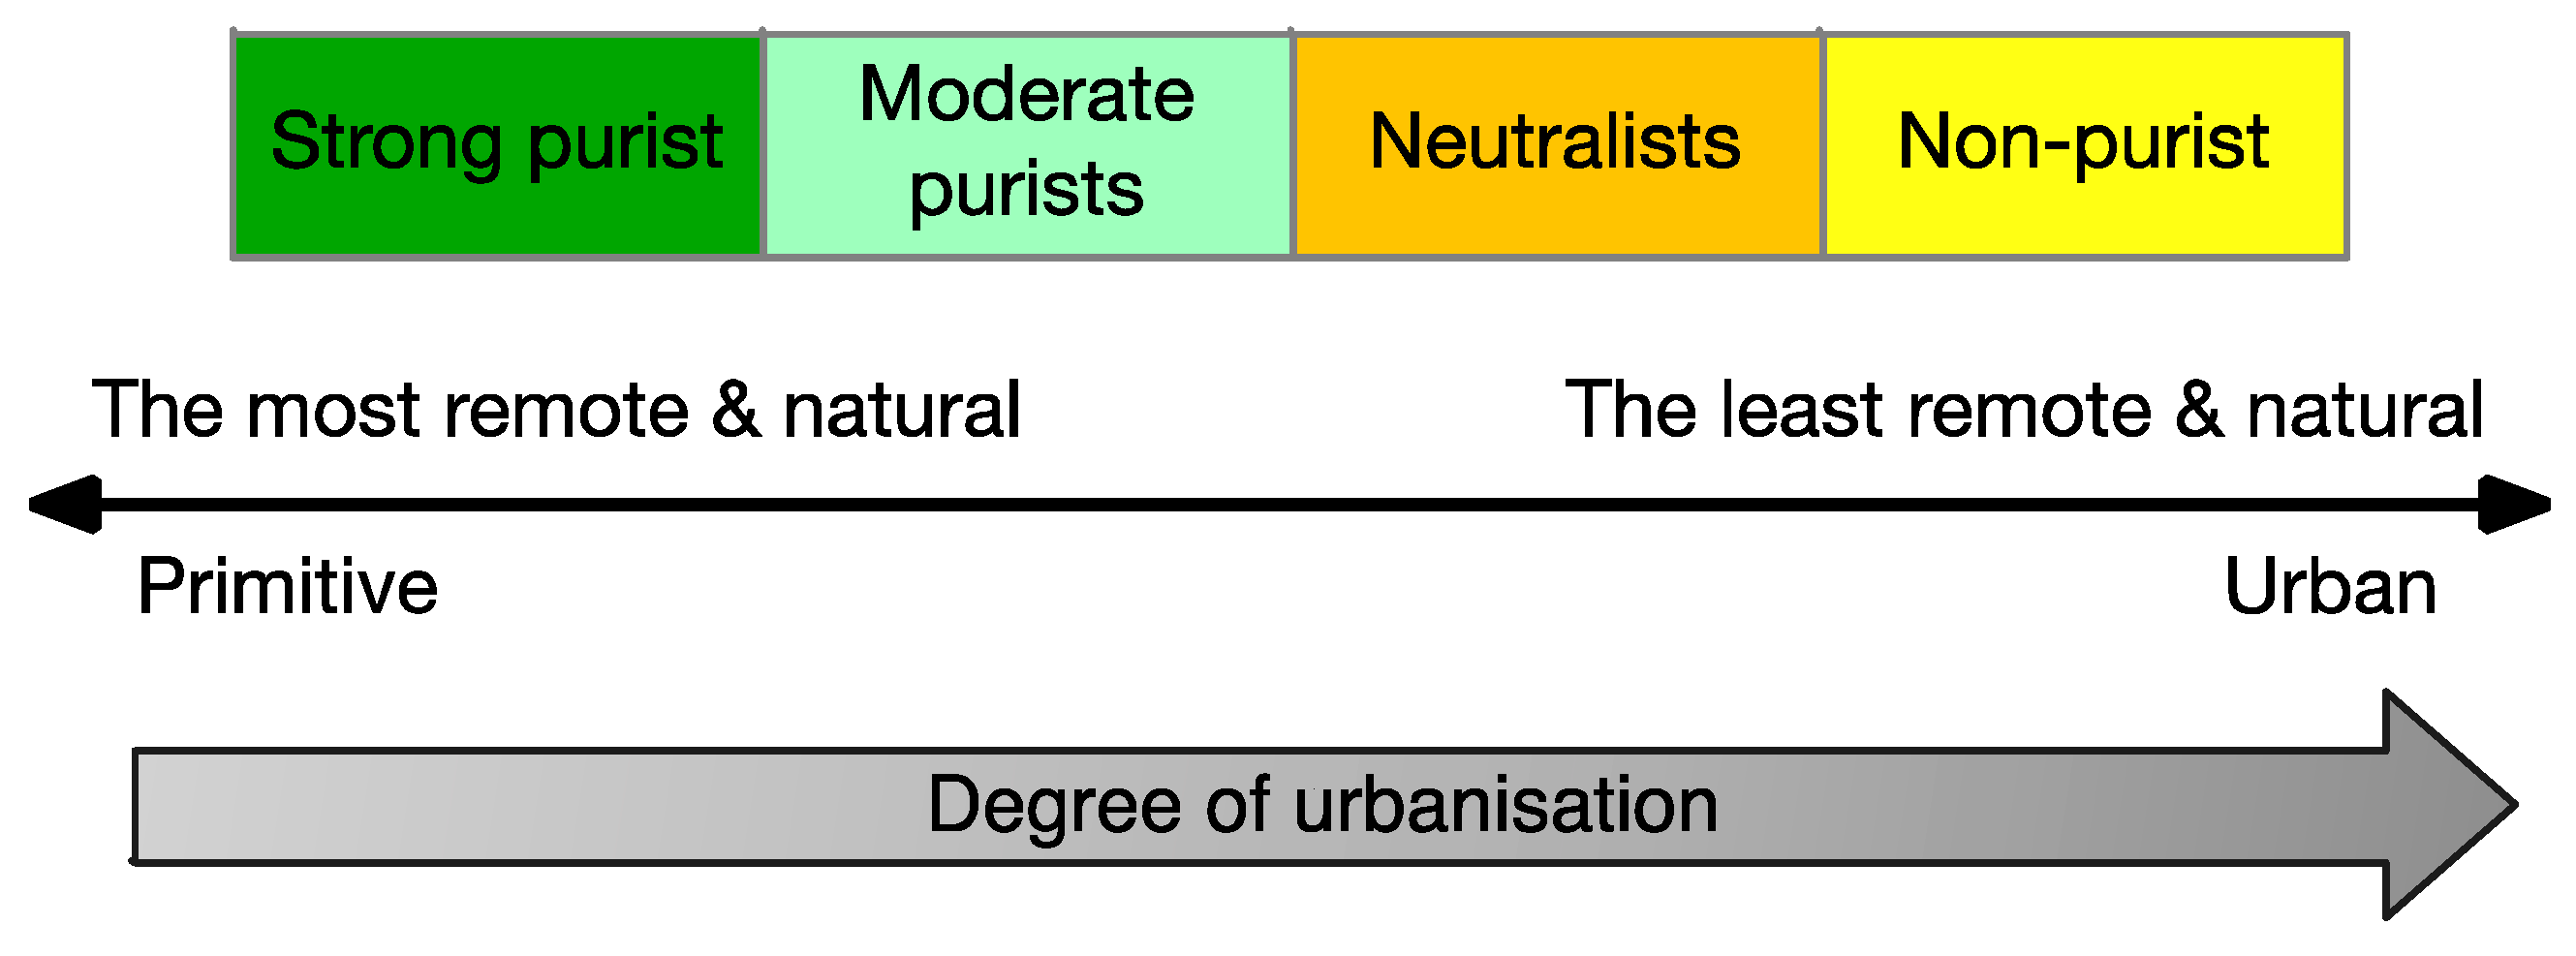
  • Identify the key factors triggering changes in natural destination using the Purism Scale approach.
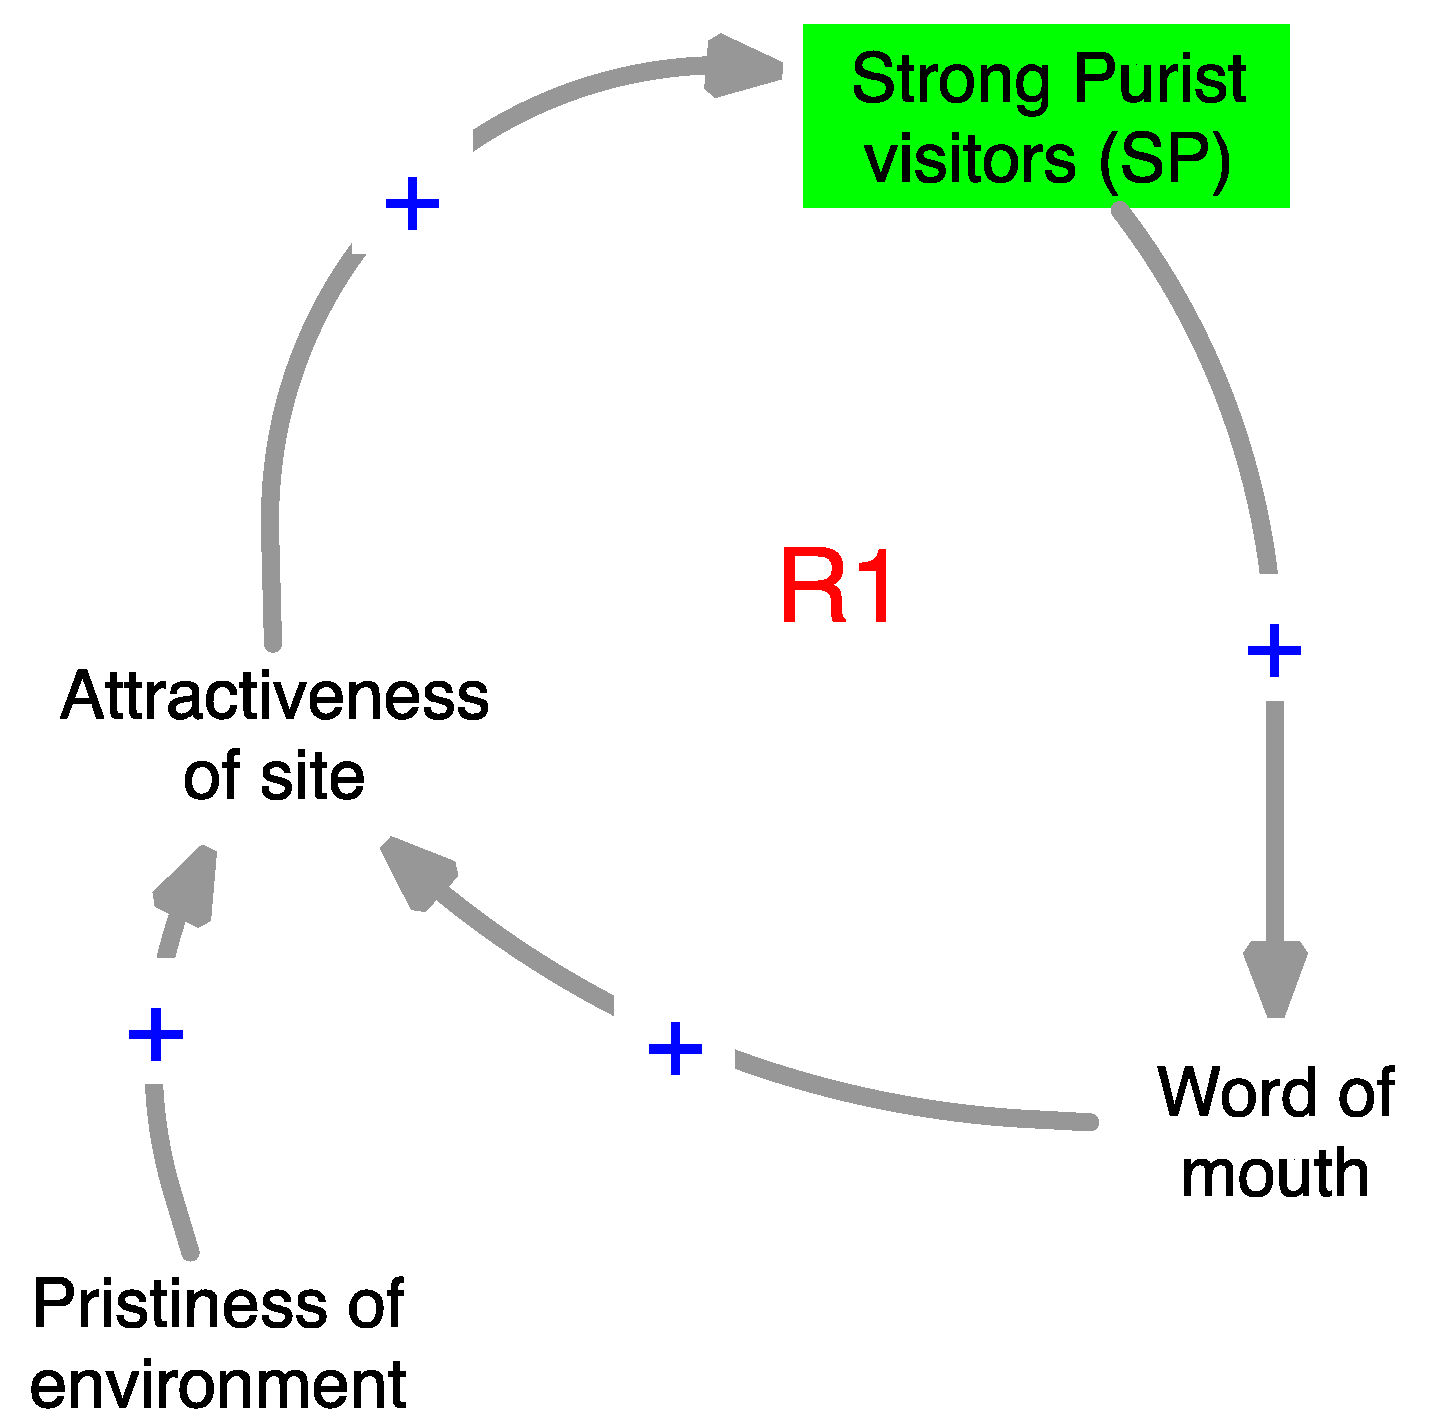
  • Design a Causal Loop Diagram in order to frame and structure a holistic overview of the key factors identified and their causal relationships of a natural destinations.
  • Clarify the complex interplay between the identified factors and triggers affecting transitions processes between sustainable thresholds of a natural destination system over time coupled to Butler’s TALC approach.
The purpose of combining the TALC model and the Purism Scale is to illustrate how the transition of different visitor types over time manifest the behaviour predicted by the TALC model, i.e., the S-shaped behaviour, and, furthermore, to illustrate the triggering factors that facilitate the transition of the different visitor types through the natural destination and change in its physical appearance.

2. Methods

2.1. Causal Loop Diagram Modelling

The Causal Loop Diagram (CLD) method [18,20,49,50,51,52,53] was used in order to define and confine system boundaries, as well as to map relevant causal relationship and feedback loops to obtain an overview of important leverage points in the system structure. Previous research [29,53,54,55,56,57] has shown the value of the system dynamic qualitative approach to highlight simple structures such as CLDs and has been demonstrated as an analysis tool in recent tourist studies as well [48,58,59]. This study utilises the CLD modelling approach and utilises the modelling tool Imodeler/Consideo [60] to construct the CLDs and perform the qualitative impact analysis. The results are further categorised into short-term, medium-term, long-term and beyond long-term. In the CLD each link is categorised according to the four terms and given an indexed value as required by the method [60]. Each link is further given an impact value for short, medium and long-term which represents the impact value over the time horizon for the study. This enables tracking of the delays of impact through the loop. The analysis utilises a relative scale as provided by the software to translate into results using the approach from Haraldsson and Wiktorsson [61].
The CLD is a systematic description of a system, taking a ‘bird’s view’ perspective where details that are not shown in the CLD are collapsed into driving variables [54,62,63,64,65,66]. A CLD thus elucidates the main feedback loop processes where cause and effect are variables that either change in the same direction (indicated with a “plus”) or change in opposite direction (indicated with a “minus”). Processes that move in the same direction are called reinforced processes, since they amplify a condition (indicated with R). Similarly, the processes that move in opposite direction (indicated with B) balance (dampen) out a condition. A feedback can thus either be a reinforcing feedback or a balancing one.
The main focus of the CLD approach is that all variables in the model are treated as unit-less and the focus is only upon the behaviour between the variables in terms of feedbacks [18,19,49]. The advantage of this approach is it enables using ‘soft’ and ‘hard’ variables in the same model without the need to consider their properties, only the direction of their causal relation.

2.2. Limitations

The limits of the CLD analysis require that variables must be on the same level of observation, i.e., not mixing different spatial and temporal scales in order for the CLD to be effective as analysis tool. A CLD analysis also requires good background knowledge, and proper framing of the problem and key questions, otherwise the analysis risks being superficial and not capturing the important drivers or feedback loops [19,63,67,68]. Furthermore, representation of behaviour over time is relative to the study frame and can only be defined in relative terms such as short, medium and long-term and not in exact numbers.

3. Results

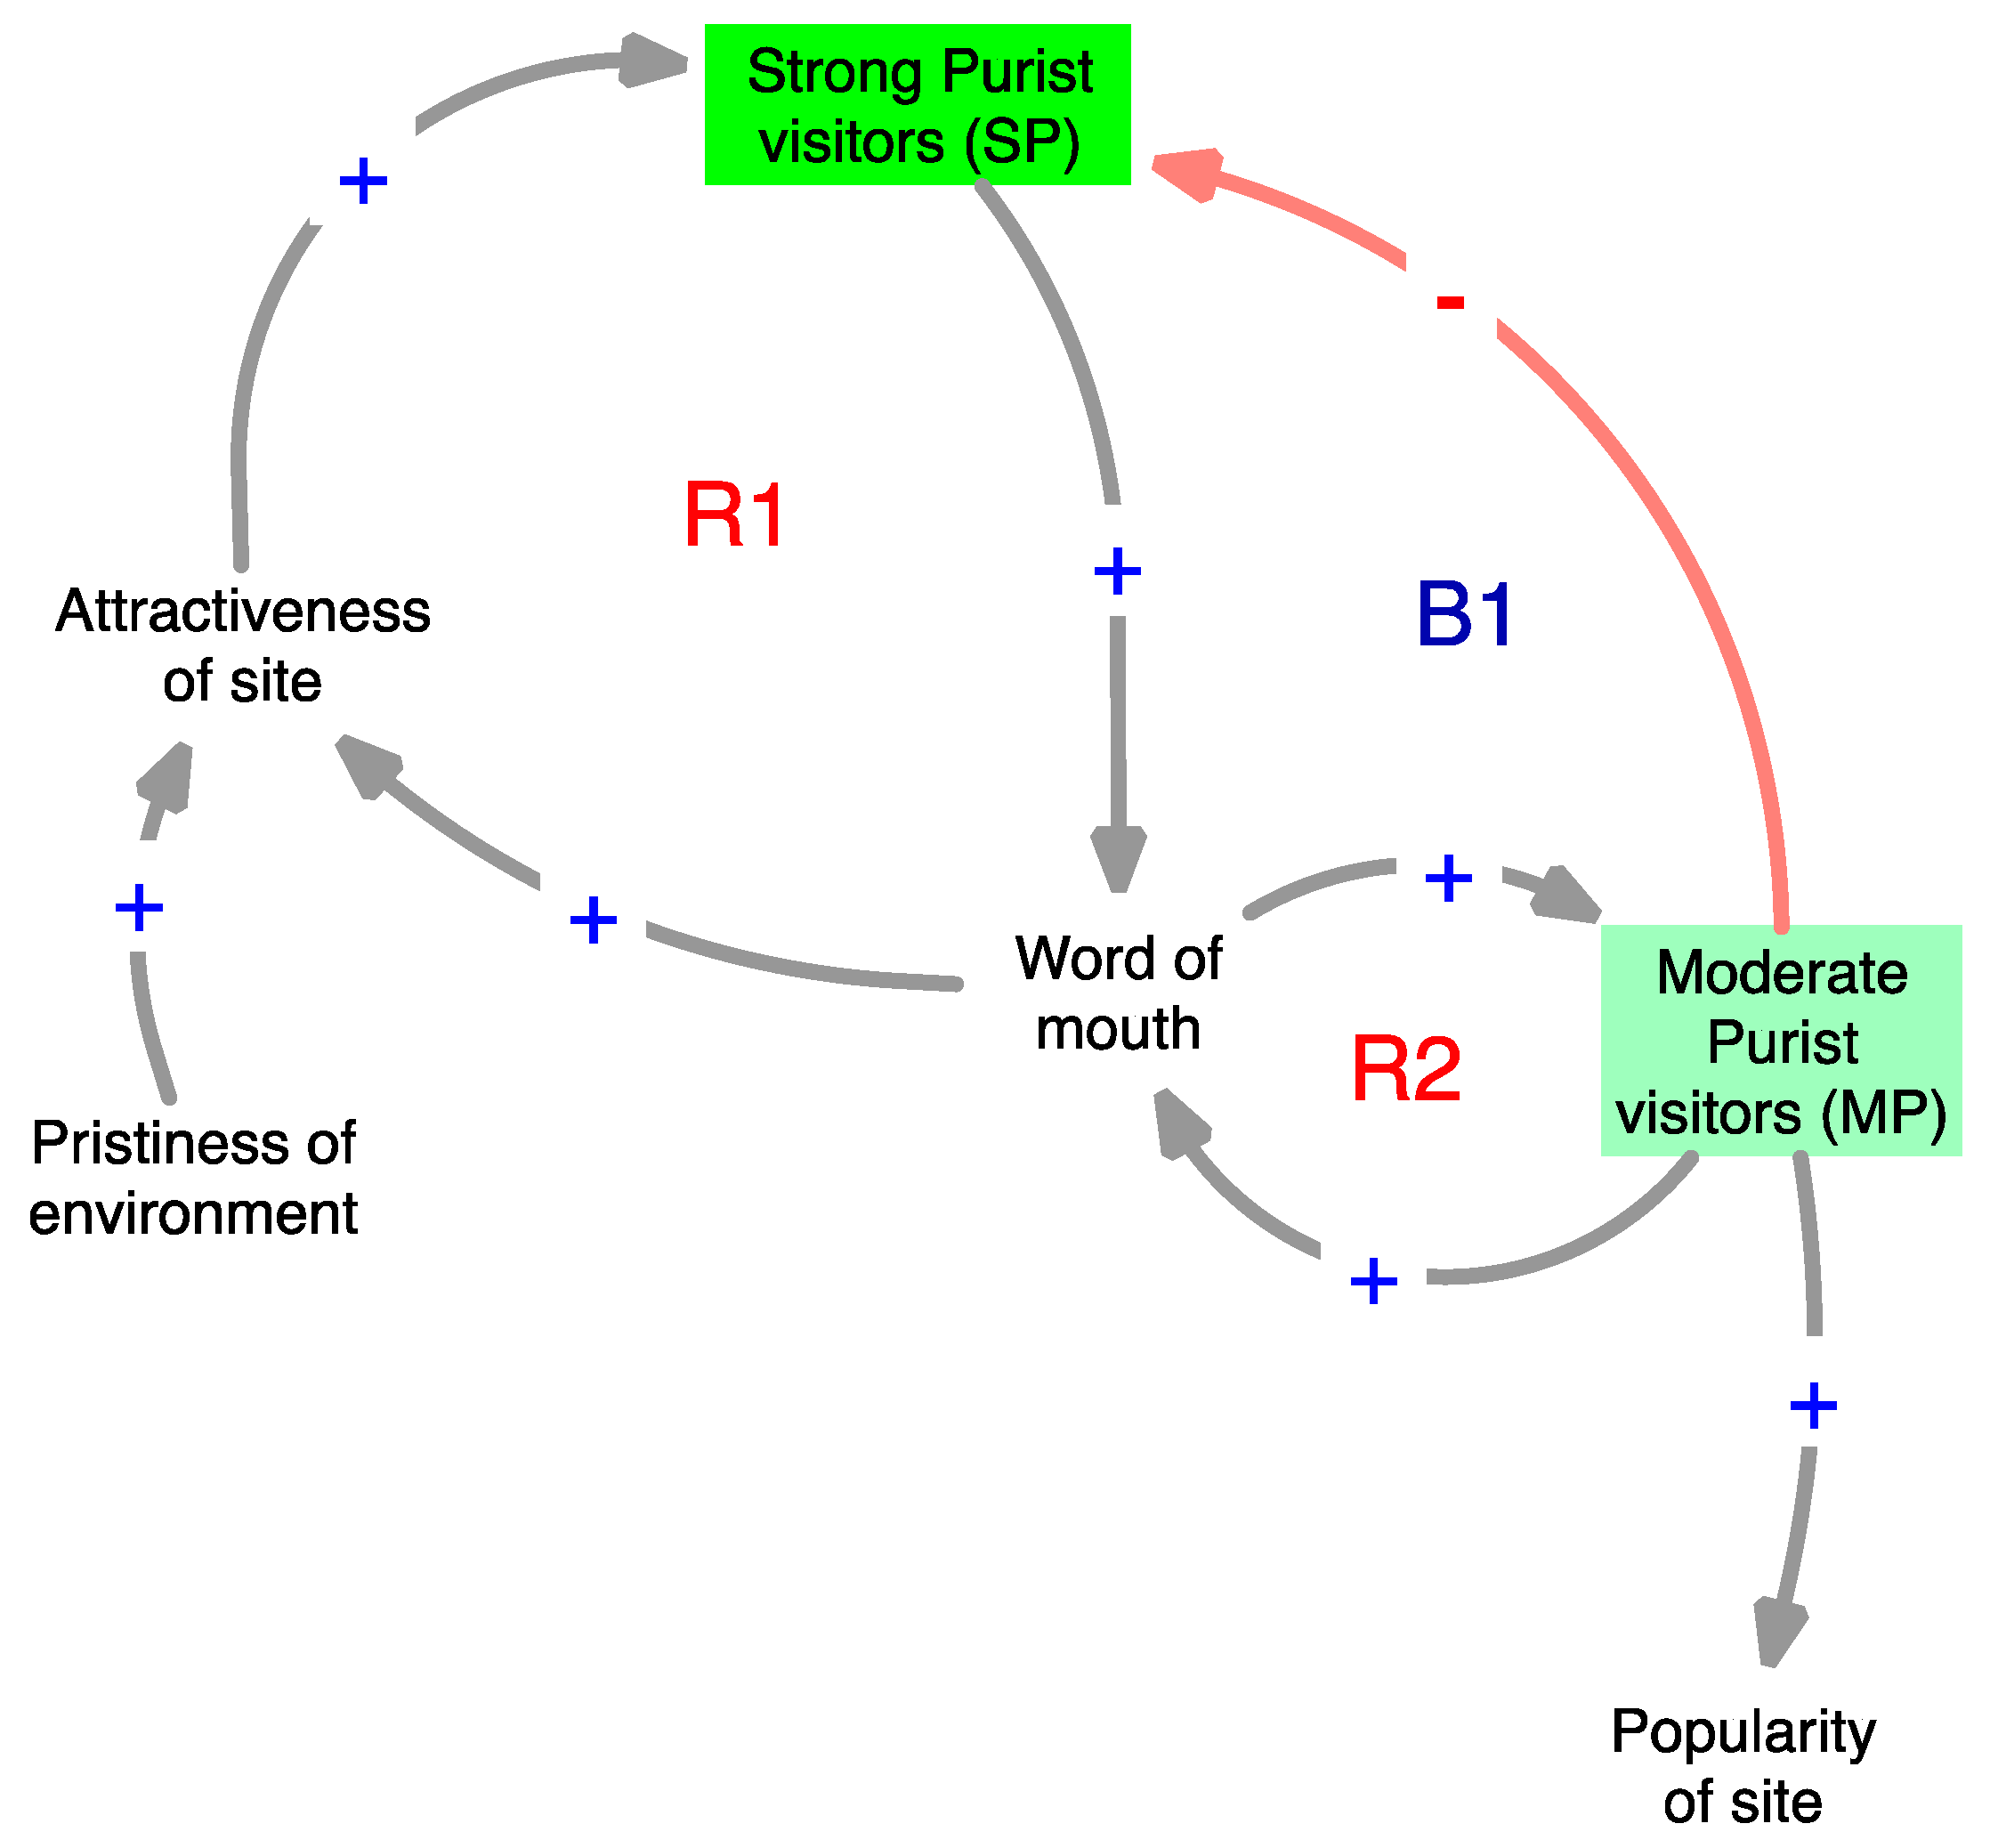
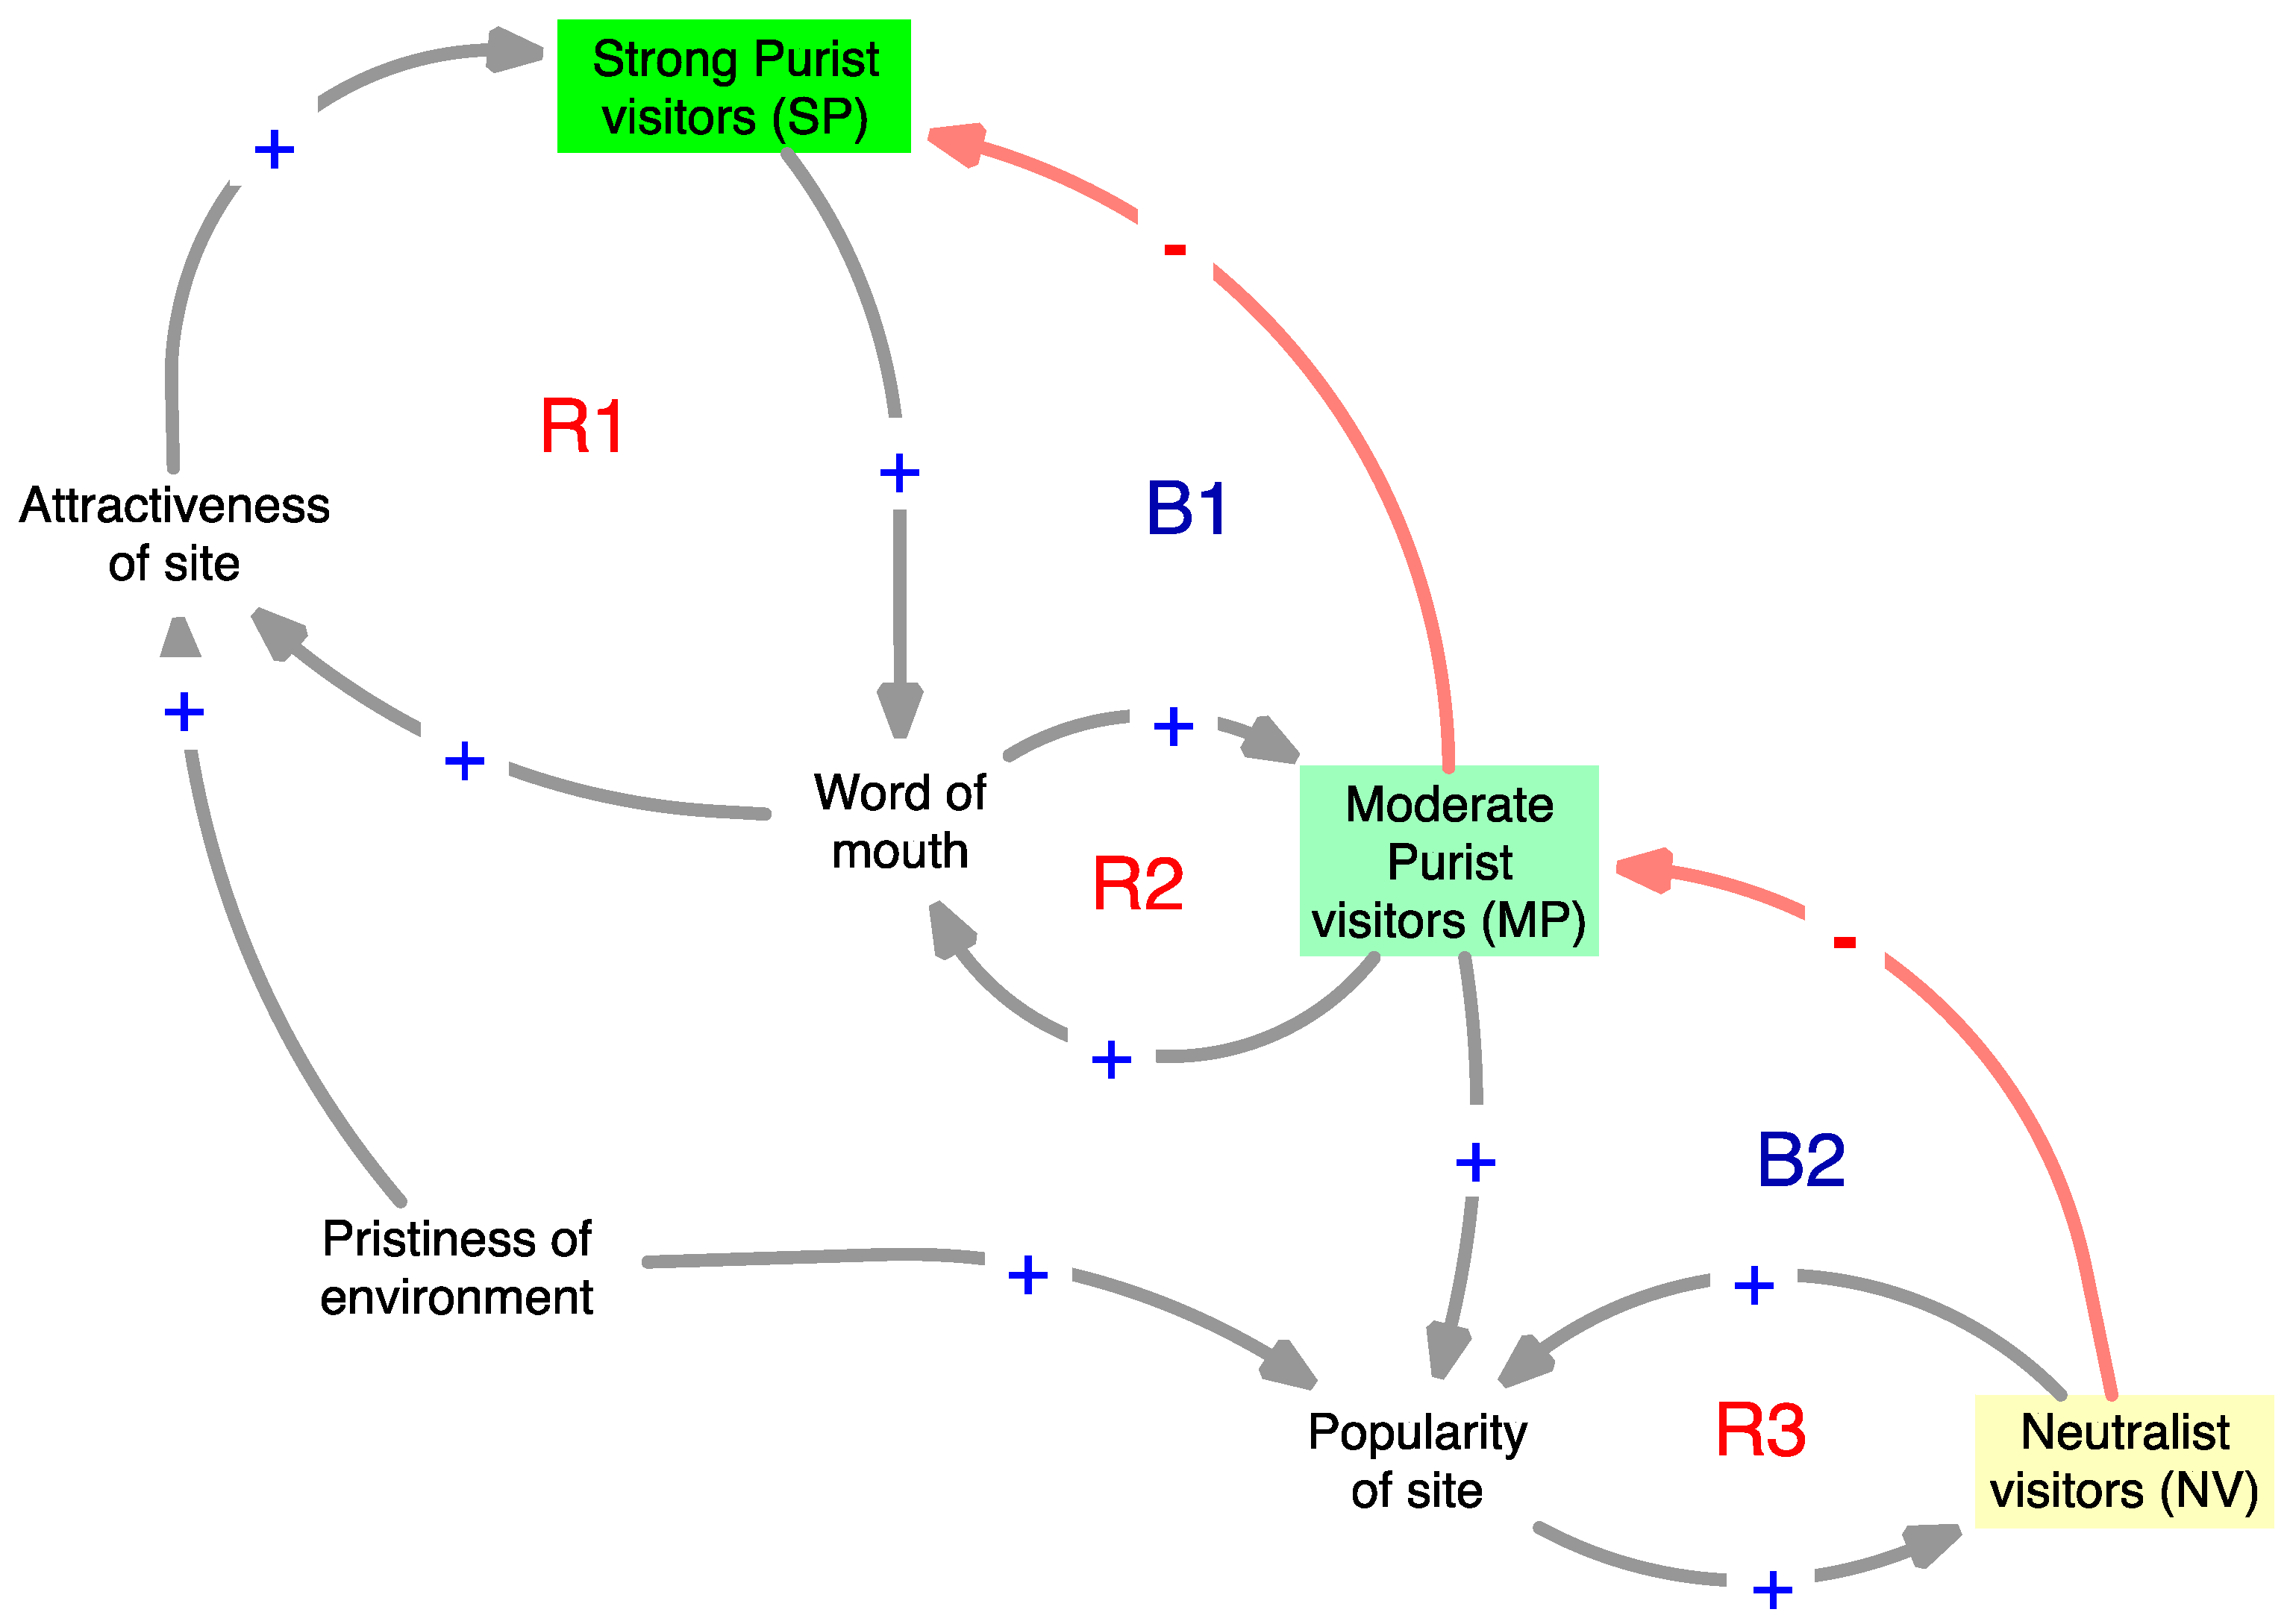
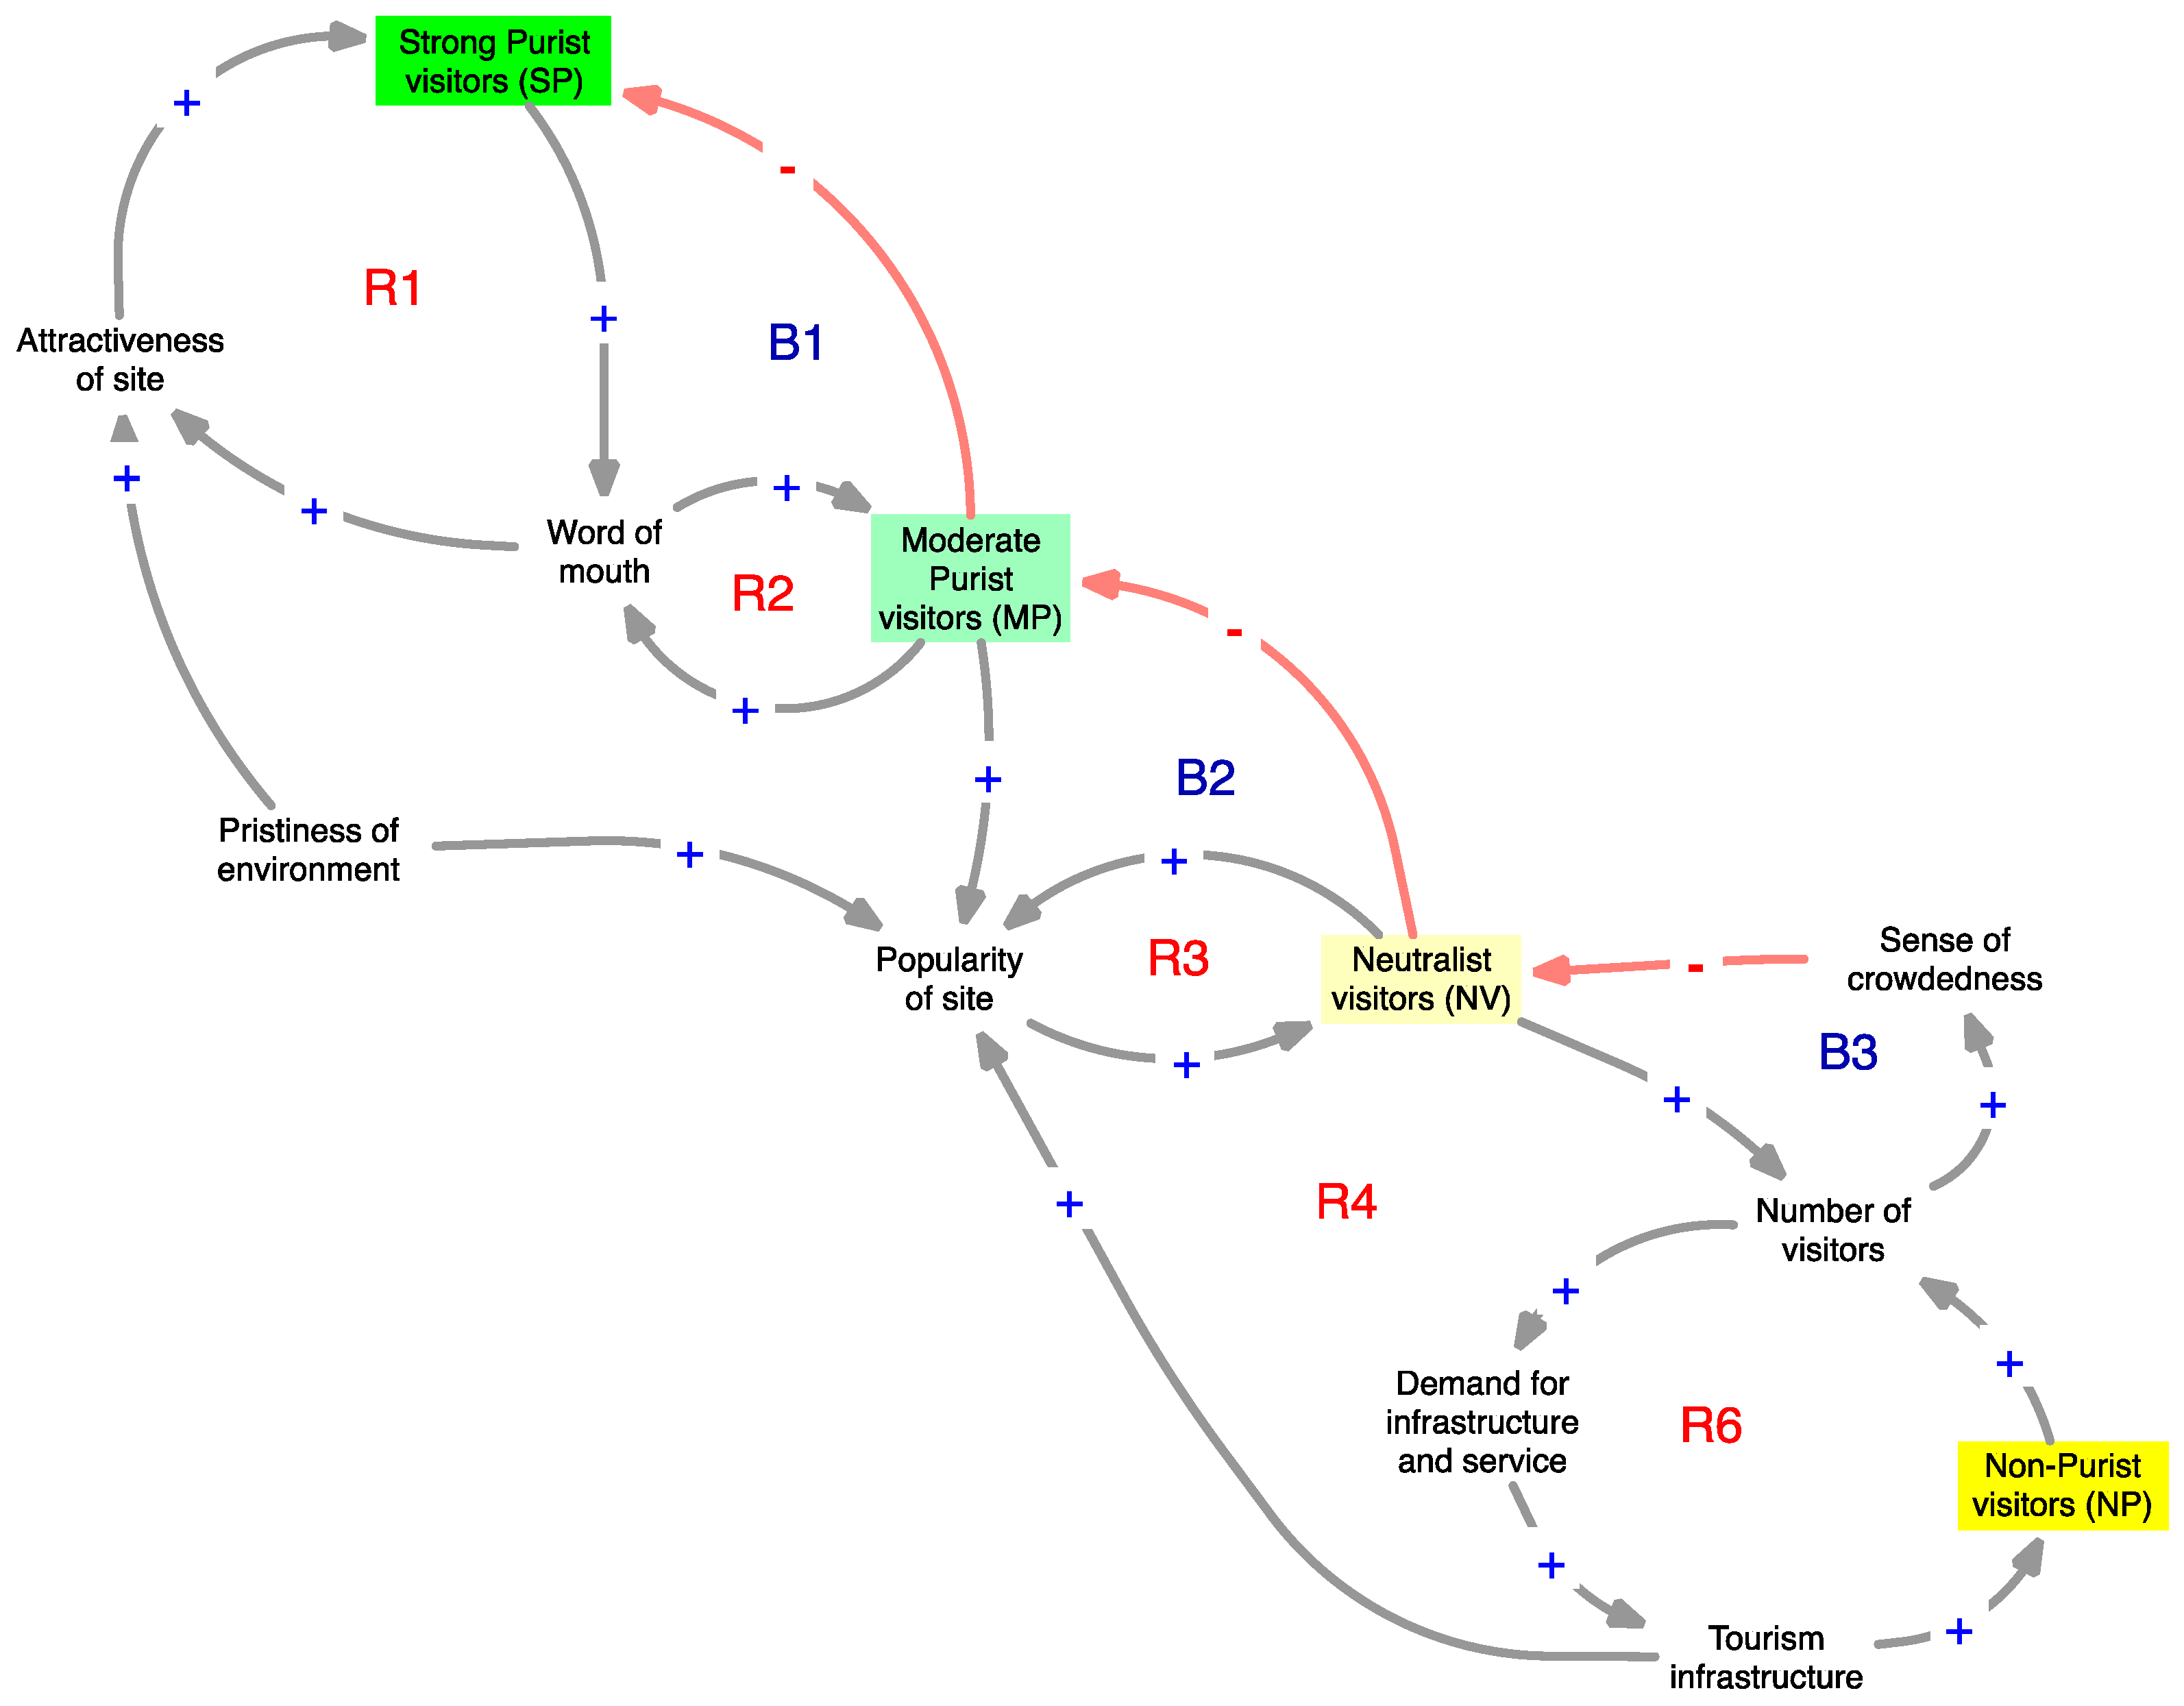
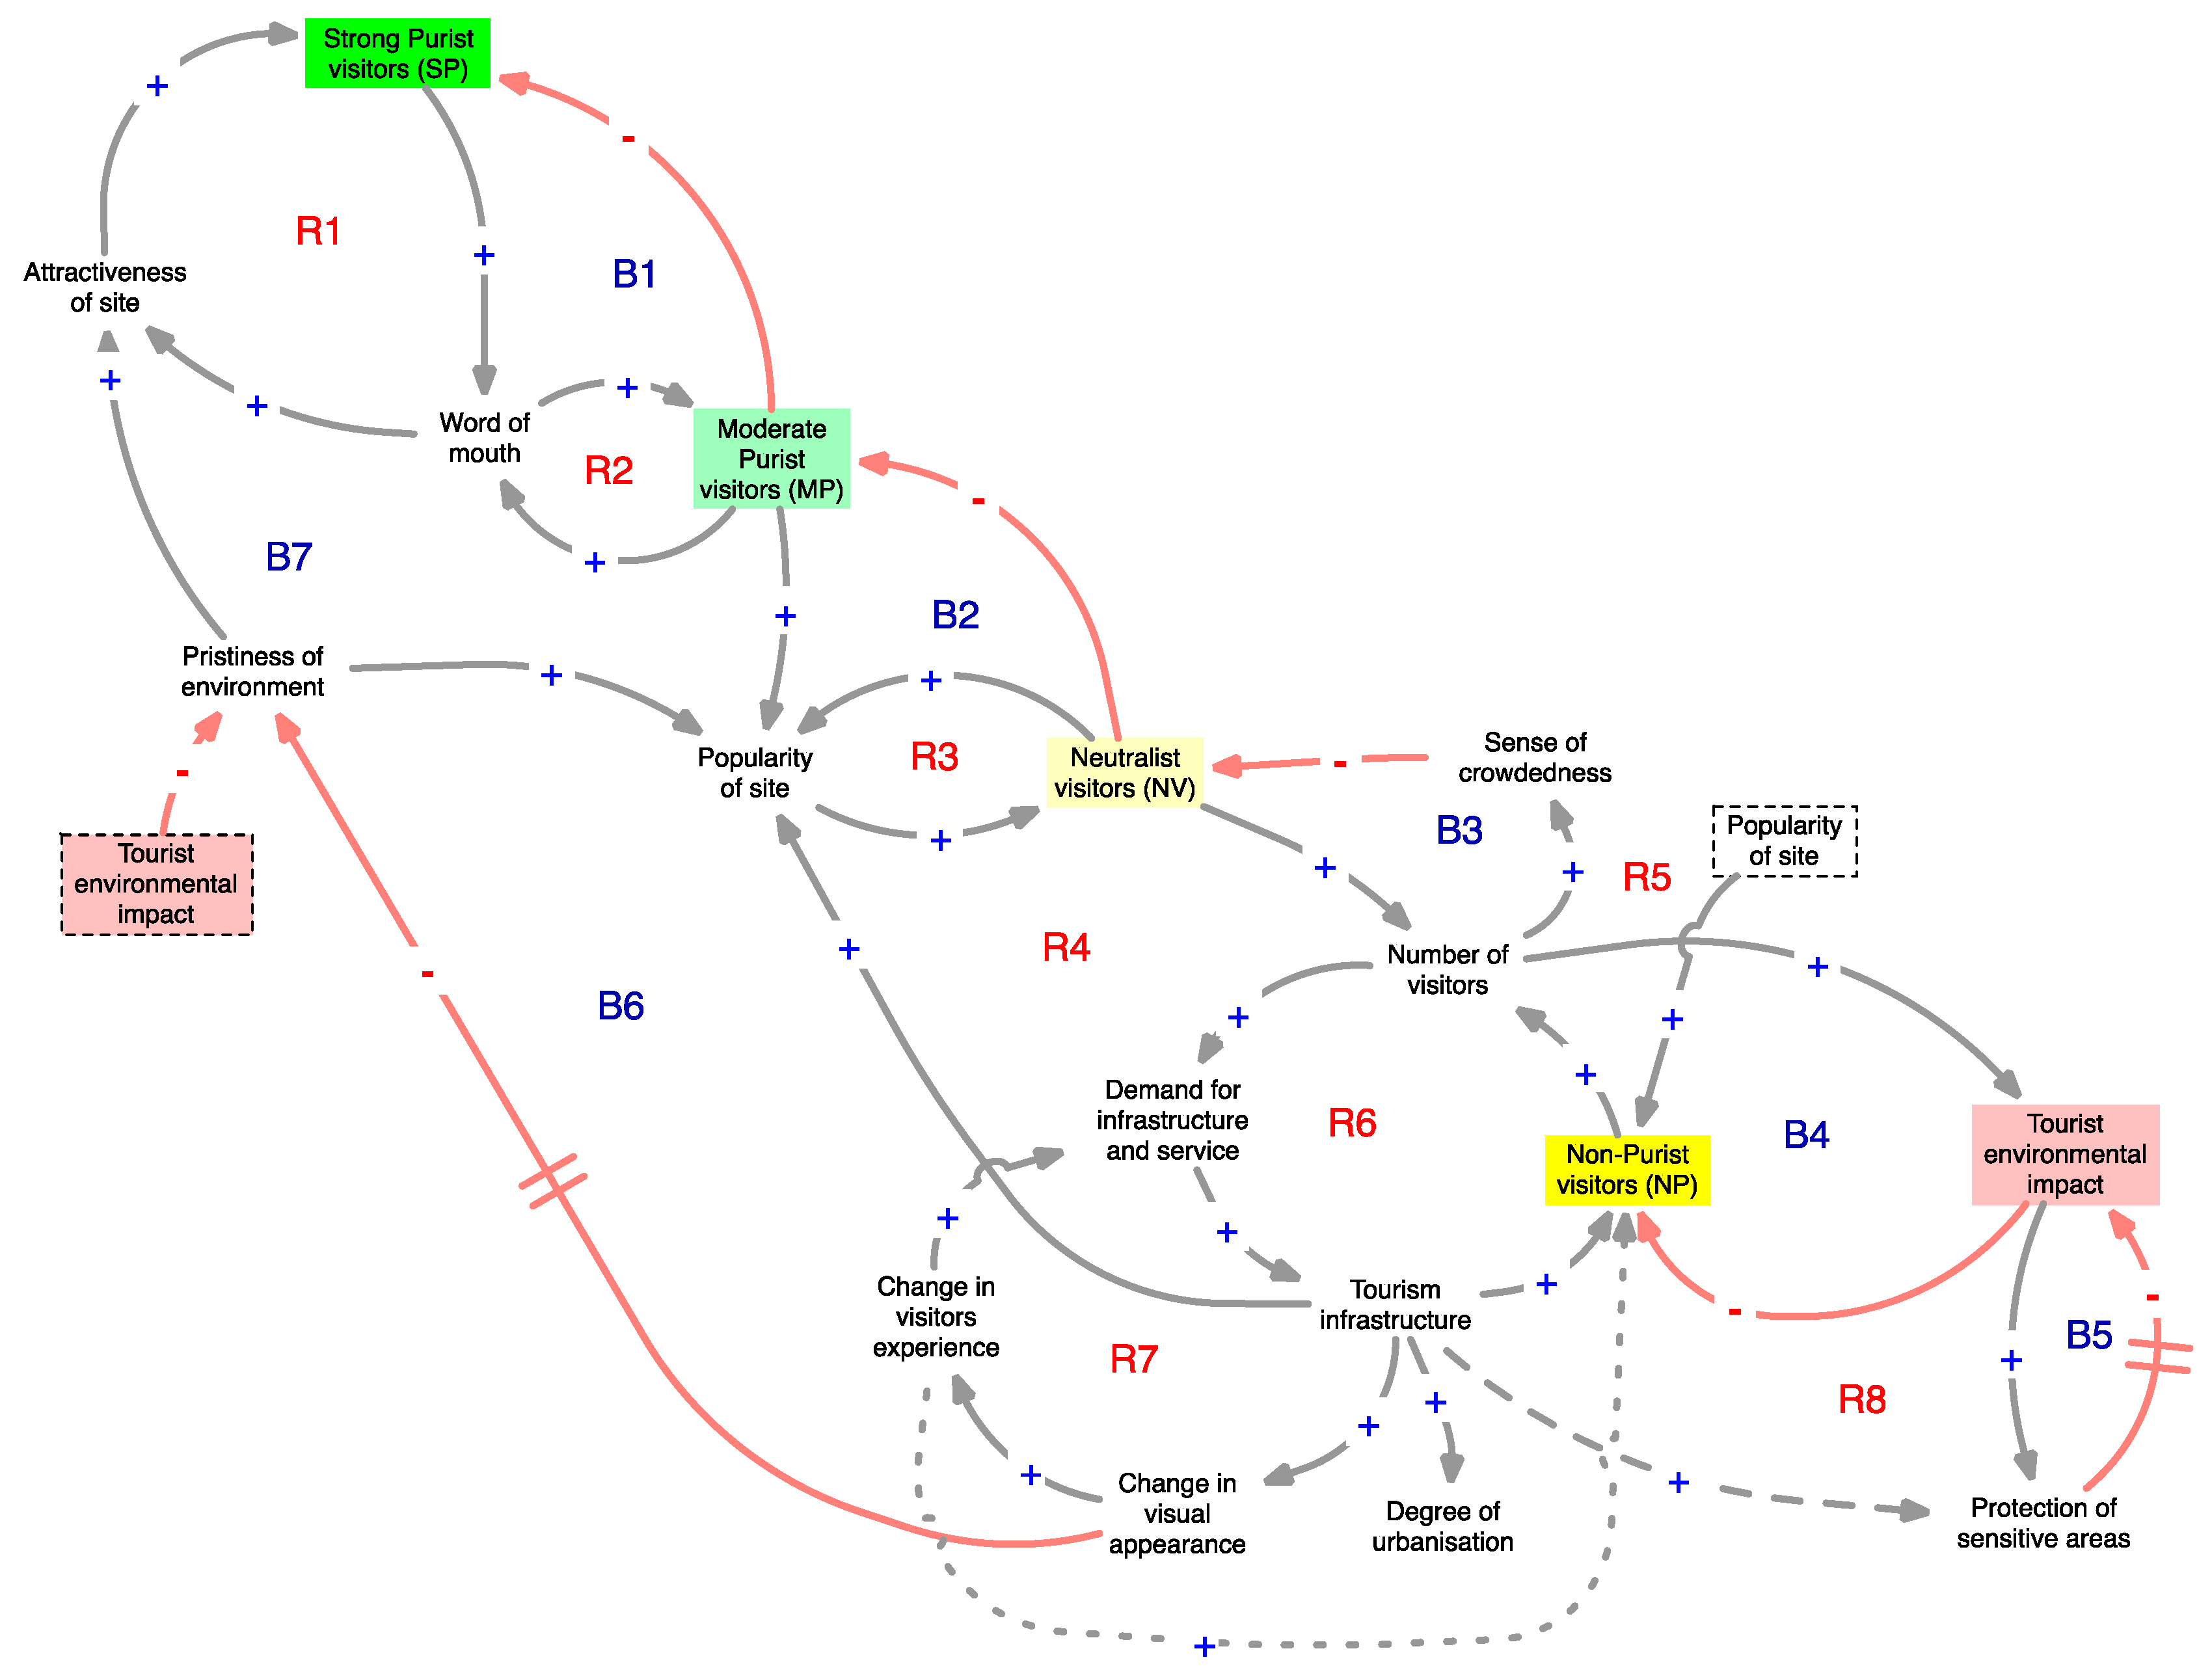
3.1. Causal Loop Analysis

In the CLD model, visitor behaviour is based on the purism scale approach. The idea of the underlying systems is that the different types of visitor, as categorised according to the purism scale, i.e., strong purists, moderates, neutralists, and non-purists, who visit an area of natural beauty are motivated by different degree of infrastructure and services. The initial motivation is the pristineness of a natural environment attracting the strong purists’ visitors as the area’s first visitors. Variables that exert a positive influence on the system are marked in black, and variables exerting a negative influence are marked in red. Delayed processes are marked with double lines crossing the arrow-line. The basic notion illustrated in the CLD is that the pristineness of the natural environment initially attracts strong purist visitors to a new tourist destination. These are the ‘explorers’, according to Butler’s [7] TALC model. Through word of mouth, the attractiveness of the site increases, resulting in an increased number of strong purists (indicated with R1) visiting the site (Figure 3). Increased attractiveness gradually attracts moderate purist visitors to the area through word of mouth (indicated with R2) who further increase the site’s popularity, that in turn will negatively affect the strong purist visitors who subsequently leave the area (indicated with B1) by being pushed out by moderate purist visitors (Figure 4).
Increased popularity of the site will in turn bring in neutralist visitors who have much less restriction on the sense of the area’s environmental pristineness than the strong and moderate purist visitors, but are still attracted by the tourist site due to its pristineness. The popularity of the site will reinforce (indicated with R3) the number of neutralist visitors but at the same time push out the moderated purists (indicated with B2) (Figure 5).
With the increased number of visitors, demand for tourism infrastructure and services grows, resulting in investment and construction of these amenities and subsequently increased infrastructure. The expansion of infrastructure has a positive impact on the popularity of the site (indicated with R4) since its access will improve, as will basic amenities, further increasing the number of visitors. This is where the non-purist enters the scene with increased services and infrastructure, more people enter the area due to increased accessibility (indicated with R6) (Figure 6). Coincident with increased popularity, the growing infrastructure gradually changes the visual appearance of the landscape at the site, that changes the visitors experience of the site and in turn the overall visitors’ behaviour. Ultimately, attracting more service minded tourists, namely non-purist visitors, resulting in an increasing acceleration in the number of visitors to the site. The arrival of non-purist visitors is more linked to the popularity of site in form of reputation, accessibility, comfort and range of services available, than the sites original natural attractiveness, resulting in increased demand for such amities. It is during this stage that the neutralist visitors feel a sense of crowdedness and their visit begin to reduce (indicated with B3).
The reinforced change in visitors’ experience will ultimately increase non-purist visitors and drive the focus of the original tourist attractor to an alternative stage (indicated with R7) (Figure 7). This is a reinforcing behaviour, which will continue as long as environmental conditions can sustain it. Increasing numbers of visitors will likewise increase pressure on the system’s environmental parameters, resulting in an increased environmental pressure on the site (indicated with B4). Environmental impact will increase both from tourists themselves and from tourism infrastructure, which in the long run will decrease the number of non-purist visitors visiting the site (indicated with B5 and R8), as well as the overall site’s attractiveness (indicated with B6 and B7). According to UNEP [2], negative environmental impacts from tourism occur when the level of visitor use is greater than the environment’s ability to cope with this use. In the world’s most sensitive areas, the impact of unsuitable forms of tourism can easily trigger ecological deterioration [69]. The way to address this issue is in the CLD is to mandate protected areas. Hence, while increased environmental impact of tourism decreases the natural site’s attractiveness, tourism infrastructure also protects sensitive areas decreasing environmental pressure from tourism at the site (cf. Figure 7).

3.2. Key Factors and System Triggers

In summary, the system trigger variables that have a positive impact on the attractiveness and popularity of a natural tourism destination are Word of mouth via the strong and moderate purist visitors, Tourism infrastructure through number of tourists and Demand in infrastructure and services, Popularity of site through tourism infrastructure. The decisive variables that have a negative impact on the attractiveness and popularity of a natural tourism destination are Tourism environmental impact as a corollary of the number of visitors to the site, as well as Change in visual appearance due to increased tourism infrastructure that gradually moves the site to an alternative stage more attractive to tourists with high impact tolerance, while conversely, environmental protection decreases environmental pressure. Protection is a decisive variable, which decreases the environmental impact of tourism through managed tourism infrastructure.
The CLD analysis reveals key factors identified as catalysts of changes transforming the system from one stage of development to another. Visually observed, a destination is transformed through a reinforcing process. Demand for tourism infrastructure and services increases, leading to a changed appearance of the destination, changing visitors experience at the destination over time and ultimately changing visitors’ attitude and behaviour. This process slowly transforms the site along the purism scale continuum to more service-demanding visitors, with the consequence of increased environmental pressure (Figure 8). The changes between stages are most profound and seen when the system is moving from neuatralist visitors towards non-purist visitors and Popularity of site is further reinforcing the transformation. The Sense of crowdedness completes the transfer of the natural destination towards non-purist stage since non-purist visitors overwhelm the neutralist visitors in numbers.

3.3. Qualitative Impact Loop Analysis

The results from the CLD modelling were categorised into short-term, medium-term, long-term and beyond long-term using the Imodeler to show impact of the different loops over time. Although Behaviour Over Time (BOT) is not shown explicitly, the Imodeler/Consideo enables tracking of relative summed impacts on specific factor over time. Figure 9 shows the sum of all the impacts in the CLD over time as well as each factor relative impact in relation to each other and to the central factor Tourist environmental impact. The qualitative impact loop analysis also shows that several factors are driving Tourist environmental impact over time (shown as positive value), as well as reducing it (shown as negative value). The Tourism infrastructure is the strongest contributing factor to the increase of environmental impact in the short and medium-term. Similarly, the Neutralist visitors and Sense of crowdedness shift between pulling and pushing within the system over time, meaning that these variables are sensitive towards changes and thus transformative. Word of mouth is the starting point and is initially contributing to environmental impact but only because the system is being changed from pristine state to being exploited by the initial push from purist and moderate purist visitors. The term “Beyond long-term” is defined as a continuation of the feedbacks in the model (reinforced or balancing).
The qualitative impact loop analysis furthermore shows that Protection of sensitive areas, Popularity of site, Sense of crowdedness, Neutralist visitors and Word of mouth are factors that fluctuate over time between a negative and positive value. Thus, emphasising that these factors transform the behaviour within the CLD. These factors are sensitive and can be utilised as points where policy interventions can be implemented towards reducing Tourist environmental impact in the long-term and beyond long-term. However, the largest initial contributor to environmental impacts stems from the arrival of the neutral visitors to the site. The neutral visitors “break in” the destination and push for the evolution of infrastructure. The results from the qualitative impact loop analysis can also be interpreted, as all factors that show consistent result (positive or negative) over time show a stable trend, whereas factors fluctuating between negative and positive values over time show an unstable trend. Factors that are interconnected to many feedback loops (nexus points) tend to be unstable and can be defined as system triggers.

3.4. Optimum Size of Infrastructure and Tourism Carrying Capacity

The CLD analysis shows that strong purist and non-purist visitors are not competing for the same area but rather are connected through the “early adapter” process, whereby the strong purist initially sets out the conditions for the site’s attractiveness and thereby create the conditions for other types of tourists to visit a new tourist destination. By adapting the results from the CLD analysis, it is possible to recreate a tourist BOT of the different evolution phases in the Butler’s [7] TALC model. The changing BOT of the different factors in the CLD may be indexed through the four phases, as well, to show relative critical range of destination carrying capacity (Figure 10). The qualitative analysis indicates a BOT that reflects how the strong and moderate purist visitors level off and neutralist visitors’ decrease in number, ultimately leaving non-purist visitors dominating the destination. This last phase represents the destination’s point of no return as regards attractiveness to other types of visitors.

4. Discussion and Conclusions

4.1. Management Implication for Natural Destinations and Dynamic Sustainable Thresholds

The TALC model demonstrates that tourist destinations are dynamic and complex systems. The scale and management of the number of tourists as well as the evolution of tourism infrastructure at a destination over time is strongly dependent on many critical factors that all contribute to the increasing complexity of the tourist destination system. The advantages of using the systemic-dynamic approach are according to Haraldsson and Ólafsdóttir [17] its simplicity and ability to reveal the underlying structure of complex problems. By emphasising on the sorting process itself where cause and effect are in focus, a better analysis of the structural relationship as a whole is enabled. By using the systemic approach the causal relations of the indicators of change in the Butler’s [7] TALC model can be better analysed and understood as well as the triggers affecting the transition processes from one stage of evolution to another.
The combination of the TALC and the Purism scale models illustrates that the ceiling for tourist carrying capacity can be predicted by observing the “growth”, the “stagnation” and the “decline” stage at a tourist destination development. The problem is that once the stagnation stage is reached the attractiveness of the site is already in decline, even if the numbers of tourists per se do not reflect that fact. This is arguably due to “destination reputation”, a phenomenon whereby rumours of a site’s bad reputation “lag behind” and the knowledge of the attractiveness or unattractiveness of a particular site have not yet filtered through to prospective non-purist visitors (Phase III and IV in Figure 10). This behaviour follows a generic characteristic of the “Overshoot and collapse” archetype. Since the development of tourist infrastructure often occurs on a medium- and a long-term basis and is-based upon projections of future numbers of visitors and activities, the construction of new facilities can end up continuing long after the point at which the attractiveness of the site is in rapid decline (as indicated in Phase IV in Figure 10). The CLD qualitative analysis demonstrates that understanding the driving factors influencing the “attractiveness of site” is the key to understanding the tourist carrying capacity in the early phases (i.e., phase I and II in Figure 10) where positive driving factors are primarily influencing “attractiveness”. In later phases the change in visual appearance (from tourism infrastructure) and visitors experience take on a more decisive role, impacting negatively “attractiveness”, and ultimately this negative feedback will come back to impact upon infrastructure development. Therefore, as soon as the attractiveness of a site starts to level off (i.e., phase II and III in Figure 10, an action plan should already be in place to mitigate these negative effects.
The results of the CLD analysis show that although the evolution of tourism can be adequately described in general terms according to Butler’s [7] TALC model of evolution of tourists destinations over time, the qualitative analysis of causal relations enables transparency of all interrelated impact factors. The CLD analysis indicates that Number of visitors is not, on its own, a suitable measure of evolution of a tourist natural destination. A suitable way is to categorise indices according to the site evolution is: Attractiveness of site in its initial phase and Popularity of site in its later phases, since it captures the evolution of the tourist system more clearly and can explain how different visitors’ types evolve over time with increasing tourist infrastructure development and the associated time delays. This is supported by recent research [70,71,72] concluding that increased infrastructure leads to a higher level of perceived crowding and therefore change in visitor types.
The different visitor types affect the attractiveness of a natural destination in different ways over time. The CLD and the BOT analysis demonstrate that all visitor types cannot exist at their own optimum level at the same destination. As regards a destination sustainable threshold, this research suggests that the tourism carrying capacity concept is dynamic and should therefore be defined through the maximum site attractiveness and the popularity of the site for each desired visitor type. This does not mean the maximum number of tourists that a site can hold, but rather the optimum size of infrastructure to ensure minimum environmental impact and crowding.
There is a notable and clear turning point in the evolution of tourist destinations when there is a transition from moderate purist visitors to neutral visitors. Neutral visitors bring with them the push for infrastructure development and in a local tourist management perspective “breaking in” a new area is mostly prone towards conflicts between different stakeholders. This is consistent with Salerno [9] emphasising that the infrastructure limiting factors at destinations creates a social limitations in form of sense crowdedness that either push the destination towards increase in infrastructure development or towards stagnation (even decline). This phase in development needs to be anticipated in the long-term destination vision of the tourist destination and according to Sheehan et al. [73] a successful destination promotion needs to incorporate the so called “triad” of the stakeholders that represent the organisational of utilisation, ownership and vision for the tourist site (in planning perspective). In the non-purist visitors phase, the direction of the tourist site is already in place and rigid and hard to adopt towards new visions and needs, since many of the stakeholders have vested interest in different aspect of the tourist site and therefore another type of community-based management is required [74]. The CLD analysis shows that there is a natural tendency for transition of the different visitor types over time. One explanation is that the transition between the visitor types follows the generic behaviour “The tyranny of small steps” [26] where small undetected steps of encroachments (infrastructure development) over time force out each visitor type until only the non-purists remain. From a management perspective it is thus important to identify the key items that are being encroached upon and monitor them long-term to avoid the effect of the archetype behaviour [26].
The limitation of the CLD qualitative analysis is in the accuracy in describing the BOT of the specific factors. The accuracy is furthermore limited to categorising the BOT into four time steps that are not necessarily equal in length and may not illustrate the representative shape (skewness and length) of the curve of each visitor group shown. Therefore, an approximate shape is assumed for discussion purposes.

4.2. Concluding Remark

The results from this study stress the dynamic evolution of tourism in natural destinations that will reach point of no return as regards attractiveness to other types of visitors than non-purists if no action are taken to manage that evolution. It is thus recommended that sustainable long-term planning for natural destinations should view and document the development of a destination as going through the different stages of potential visitor types in their search for appropriate marketing group. To do so, the following concluding remarks drawn from this study should be used as guidelines:
  • Define the type of tourism desired and the acceptable level of exploitation.
  • Define what constitutes Attractiveness in terms of key items at the natural destination in relation to its surrounding environment and natural resources.
  • Have a clear understanding what the natural limitations (thresholds/carrying capacity) are (water supply, erosion risks, land availability, etc) on overshoot on natural capital and irreversibility of Environmental impact.
  • Define what Visitor types are desirable for the natural site development according to the purism scale.
  • Define and understand what the Popularity of site is for the natural destination evolution in order to anticipate possible visitor types stage transition.
  • Stop and go approach to all Tourism infrastructure development in order to minimise the risk of unnoticed irreversible encroachment in small steps on the natural destination threshold [26].
  • Active monitoring of predefined items in order to avoid undetected encroachment in small steps of infrastructure development that is not according to the destination sustainable long-term plan.
This demonstrates the critical importance of tourism destination planning and management in order to avoid all tourist destinations evolving in the same direction, decreasing the value of these destinations for other tourist types than non-purists, viz. the tourist types that represent mass tourism. This conclusion is supported by Ryan [75], who emphasizes that it is through an individual’s sensory system that a destination is experienced. The combination of the TALC and the Purism scale models into a systemic overview of the triggering factors and its causal relations, helps to better place where in the evolution a destination finds itself, and how to understand its sustainable long-term development and consequently the planning to reach its sustainability. This study is limited to qualitative analysis and further research should focus on verifying the results with empirical studies on natural destinations at different stages. Furthermore, verifying the TALC and the Purism scale model evolution through dynamic quantitative modelling approach. All destinations evolve differently and can never please all types of tourists all of the time.

Author Contributions

The authors are two senior researchers that contributed equally to the work.

Funding

This study was supported by the Icelandic Tourist Board.

Acknowledgments

Special thanks go to Ólöf Ýrr Atladóttir, former director general of the Icelandic Tourist Board, for her vision and belief in the development of new approaches in tourism research. Further thanks are to all our anonymous reviewers for their valuable comments which have led to significant improvement of this paper.

Conflicts of Interest

The views and opinions expressed in this article are those of the authors and do not necessarily reflect the views of the Swedish Environmental Protection Agency.

References

  1. UNWTO International Tourist Arrivals up 4% Reach a Record 1.2 Billion in 2015. Available online: http://media.unwto.org/press-release/2016-01-18/international-tourist-arrivals-4-reach-record-12-billion-2015 (accessed on 13 November 2016).
  2. UNEP Impacts of Tourism. Available online: http://www.unep.org/resourceefficiency/Business/SectoralActivities/Tourism/FactsandFiguresaboutTourism/ImpactsofTourism/tabid/78774/Default.aspx (accessed on 15 February 2015).
  3. Newsome, D.; Moore, S.; Dowling, R.K. Natural Area Tourism: Ecology, Impacts and Management; Channel View Publications: Bristol, UK, 2012. [Google Scholar]
  4. Ólafsdóttir, R.; Runnström, M.C. Assessing hiking trails condition in two popular tourist destinations in the Icelandic highlands. J. Outdoor Recreat. Tour. 2013, 3–4, 57–67. [Google Scholar] [CrossRef]
  5. Butler, R.W.; Lew, A.; Hall, M.; Williams, A.M. The Tourism Area Life Cycle in the Twenty-First Century. In A Companion to Tourism; Blackwell: Hoboken, NJ, USA, 2004; pp. 159–169. [Google Scholar]
  6. Williams, P. Frameworks for Assessing Tourism’s Environmental Impacts. In Travel, Tourism and Hospitality Research. A Handbook for Managers and Researchers; Ritchie, J.R.B., Goeldner, C.R., Eds.; Wiley and Sons: Hoboken, NJ, USA, 1994. [Google Scholar]
  7. Butler, R.W. The concept of a tourist area cycle of evolution: Implications for management of resources. Can. Geogr. 1980, 24, 5–12. [Google Scholar] [CrossRef]
  8. Kavallinis, I.; Pizam, A. The Environmental Impacts of Tourism—Whose Responsibility Is It Anyway? The Case Study of Mykonos. J. Travel Res. 1994, 33, 26–32. [Google Scholar] [CrossRef]
  9. Salerno, F.; Viviano, G.; Manfredi, E.C.; Caroli, P.; Thakuri, S.; Tartari, G. Multiple Carrying Capacities from a management-oriented perspective to operationalize sustainable tourism in protected areas. J. Environ. Manag. 2013, 128, 116–125. [Google Scholar] [CrossRef] [PubMed]
  10. Butler, R. Mature tourist destinations: Can we recapture and retain the magic. In Renovación y Reestructuración de Destinos Turísticos en Áreas Costeras: Marco de Análisis, Procesos, Instrumentos y Realidades; Fernando Vera Rebollo, J., Rodríguez Sánchez, I., Eds.; Universitat de València: Valencia, Spain, 2012; pp. 19–36. [Google Scholar]
  11. Butler, R.W. The resort cycle two decades on. In Tourism in the 21st Century: Reflections on Experience; Faulkner, B., Laws, E., Mosscardo, G., Eds.; Continuum: London, UK, 2000; pp. 284–299. [Google Scholar]
  12. Butler, R. Tourism in the future: Cycles, waves or wheels? Futures 2009, 41, 346–352. [Google Scholar] [CrossRef]
  13. Ólafsdóttir, R.; Sæþórsdóttir, A.D.; Runnström, M.H. Purism Scale Approach for Wilderness Mapping in Iceland. In Mapping Wilderness; Craver, S., Fritz, S., Eds.; Springer: Dortrecht, The Netherlands, 2016. [Google Scholar]
  14. Sæþórsdóttir, A.D. Planning Nature Tourism in Iceland based on Tourist Attitudes. Tour. Geogr. 2010, 12, 25–52. [Google Scholar] [CrossRef]
  15. Hendee, J.; Catton, W.R.; Marion, L.D.; Brockman, L.D. Wilderness Users in the Pacific Northwest—Their Characteristics, Values, and Management Preferences; Forgotten Books: London, UK, 1968; p. 100. [Google Scholar]
  16. Stankey, G.H. Visitor Perception of Wilderness Recreation Carrying Capacity; Intermountain Forest & Range Experiment Station, USDA Forest Service: Ogden, UT, USA, 1973; p. 61. [Google Scholar]
  17. Haraldsson, H.V.; Ólafsdóttir, R. Simulating vegetation cover dynamics with regards to long-term climatic variations in sub-arctic landscapes. Glob. Planet. Chang. 2003, 38, 313–325. [Google Scholar] [CrossRef]
  18. Haraldsson, H.V. Introduction to Systems Thinking and Causal Loop Diagrams; Lund University, Department of Chemical Engineering: Lund, Sweden, 2004; pp. 1–49. [Google Scholar]
  19. Haraldsson, H.V.; Sverdrup, H.U. Finding simplicity in complexity in biogeochemical modelling. In Environmental Modelling: Finding Simplicity in Complexity; Wainwright, J., Mulligan, M., Eds.; Wiley: New York, NY, USA, 2004; pp. 211–223. [Google Scholar]
  20. Maani, K.E.; Cavana, R.Y. Systems Thinking and Modelling: Understanding Change and Complexity; Pearson Education: London, UK, 2000. [Google Scholar]
  21. Forrester, J.W. Industrial Dynamics; Productivity Press: Cambridge, MA, USA, 1961; ISBN 0-915299-88-7. [Google Scholar]
  22. Vennix, J.A.M. Group Model Building: Facilitating Team Learning Using System Dynamics; Wiley: Chichester, UK, 1996; ISBN 0-471-95355-5. [Google Scholar]
  23. Vennix, J.A.M. Group Model-Building: Tackling Messy Problems. Syst. Dyn. Rev. 1999, 15, 379–401. [Google Scholar] [CrossRef]
  24. Rodrigues, A.G.; Williams, T.M. System Dynamics in Project Management: Assessing the Impacts of Client Behaviour on Project Performance. J. Oper. Res. Soc. 1998, 49, 2–15. [Google Scholar] [CrossRef]
  25. Haraldsson, H.V.; Ólafsdóttir, R. A novel modelling approach for evaluating the preindustrial natural carrying capacity of human population in Iceland. Sci. Total Environ. 2006, 372, 109–119. [Google Scholar] [CrossRef]
  26. Haraldsson, H.V.; Sverdrup, H.U.; Belyazid, S.; Holmqvist, J.; Gramstad, R.C. The tyranny of small steps: A reoccurring behaviour in management. Syst. Res. Behav. Sci. Off. J. Int. Fed. Syst. Res. 2008, 25, 25–43. [Google Scholar] [CrossRef]
  27. Hovmand, P.; Gillespie, D.; Levin, B.; Proctor, E.; McFarland, D.; Haywood, S.; Goon, B. Science Meets Policy Practices. Dangerfield, D.C., Ed.; 2008. Available online: https://www.systemdynamics.org/assets/conferences/2008/proceed/papers/HOVMA418.pdf (accessed on 14 December 2018).
  28. Hovmand, P.S.; Ford, D.N. Sequence and timing of three community interventions to domestic violence. Am. J. Community Psychol. 2009, 44, 261–272. [Google Scholar] [CrossRef] [PubMed]
  29. Luna-Reyes, L.F.; Andersen, D.L. Collecting and Analyzing Qualitative Data for System Dynamics: Methods and Models. Syst. Dyn. Rev. 2003, 19, 271–296. [Google Scholar] [CrossRef]
  30. Gill, R.A. An Integrated Social Fabric Matrix/System Dynamics Approach to Policy Analysis. Syst. Dyn. Rev. 1996, 12, 167–181. [Google Scholar] [CrossRef]
  31. Senge, P.M. System Dynamics and the Learning Organization; Pegasus Communications: Encino, CA, USA, 1995. [Google Scholar]
  32. Kim, D.H. Systems archetypes as dynamic theories. Syst. Think. 1995, 6, 6–9. [Google Scholar]
  33. Braun, W. The system archetypes. System 2002, 2002, 27. [Google Scholar]
  34. Kim, D.H. System Archetypes at a Glance. Syst. Think. 1992, 3, 5. [Google Scholar]
  35. BenDor, T.K.; Kaza, N. A theory of spatial system archetypes. Syst. Dyn. Rev. 2012, 28, 109–130. [Google Scholar] [CrossRef]
  36. Forrester, J.W. The System Dynamics National Model: Macrobehavior from Microstructure; Milling, P.M., Zahn, E.O.K., Eds.; Springer: Berlin/Heidelberg, Germany, 1989; pp. 3–12. [Google Scholar]
  37. Hirsch, G.B.; Immediato, C.S. Microworlds and Generic Structures as Resources for Integrating Care and Improving Health. Syst. Dyn. Rev. 1999, 15, 315. [Google Scholar] [CrossRef]
  38. Mrotzek, M.; Ossimitz, G. Catastrophe Archetypes—Using System Dynamics to Build an Integrated Systemic Theory of Catastrophes. 2008. Available online: http://citeseerx.ist.psu.edu/viewdoc/download?doi=10.1.1.408.8248&rep=rep1&type=pdf (accessed on 14 December 2018).
  39. Banson, K.E.; Nguyen, N.C.; Bosch, O.J. Using system archetypes to identify drivers and barriers for sustainable agriculture in Africa: A case study in Ghana. Syst. Res. Behav. Sci. 2016, 33, 79–99. [Google Scholar] [CrossRef]
  40. Hardin, G. The tragedy of the commons. Science 1968, 162, 1243–1248. [Google Scholar] [PubMed]
  41. Meadows, D.H.; Meadows, D.L.; Randers, J.; Behrens, W.W., III. The Limits to Growth: A Report for the Club of Rome’s Project on the Predicament of Mankind; Universe Books: New York, NY, USA, 1972; ISBN 0-87663-165-0. [Google Scholar]
  42. Fritz, R.G. Strategic Planning with a System Dynamics Model for Regional Tourism Site Development. Rev. Reg. Stud. 1989, 19, 57–71. [Google Scholar]
  43. Walker, P.; Greiner, R. Systems Thinking in Tourism: Out-Learning the Competitors. 1999. Available online: https://www.systemdynamics.org/assets/conferences/1999/PAPERS/PARA218.PDF (accessed on 14 December 2018).
  44. Georgantzas, N.C. Tourism Dynamics: Cyprus’ Hotel Value Chain and Profitability. Syst. Dyn. Rev. 2003, 19, 175–212. [Google Scholar] [CrossRef]
  45. Xu, H.; Dai, S. A system dynamics approach to explore sustainable policies for Xidi, the world heritage village. Curr. Issues Tour. 2012, 15, 441–459. [Google Scholar] [CrossRef]
  46. Ran, W. A System Dynamics Approach to Exploring Sustainable Tourism Development. Husemann, E., Lane, D., Eds.; 2012. Available online: https://www.systemdynamics.org/assets/conferences/2012/proceed/papers/P1402.pdf (accessed on 14 December 2018).
  47. Soufivand, M.; Bivona, E.; Alessi, M. A System Dynamics Approach to Enhance Tourism Service Delivery Performance through Value Co-Creation; Eberlein, R., Martinez-Moyano, I.J., Eds. 2013. Available online: https://www.semanticscholar.org/paper/A-System-Dynamics-Approach-to-Enhance-Tourism-Value-Soufivand-Alessi/334ea6576adaefd5f673eb987dbcd61caa2d5e32 (accessed on 14 December 2018).
  48. Kim, S.R.; Lee, S.D. An Analysis of Tourist Participation Restoration-Ecotourism through Systems Thinking. IOP Conf. Ser. Earth Environ. Sci. 2018, 151, 012015. [Google Scholar] [CrossRef]
  49. Haraldsson, H. Developing Methods for Modelling Procedures in System Analysis and System Dynamics. Ph.D. Thesis, Lund University, Lund, Sweden, 2005. [Google Scholar]
  50. Richardson, G.P.; Alexander, L.; Pugh, I. Introduction to System Dynamics Modeling with DYNAMO; Productivity Press: Cambridge, MA, USA, 1981; ISBN 0-262-18102-9. [Google Scholar]
  51. Sterman, J.D. Business Dynamics: Systems Thinking and Modeling for a Complex World; Irwin/McGraw-Hill: Boston, MA, USA, 2000; ISBN 0072311355. [Google Scholar]
  52. Roberts, N.H.; Andersen, D.F.; Deal, R.M.; Grant, M.S.; Shaffer, W.A. Introduction to Computer Simulation; Pegasus Communications: Waltham, MA, USA, 1981. [Google Scholar]
  53. Binder, T.; Vox, A.; Belyazid, S.; Haraldsson, H.V.; Svensson, M.G. Developing System Dynamics Models from Causal Loop Diagrams. 2004. Available online: https://pdfs.semanticscholar.org/cf00/b9084b05ba357bf0c5fa7a5b9cc1b5695015.pdf (accessed on 14 December 2018).
  54. Burns, J.R.; Musa, P. Structural Validation of Causal Loop Diagrams. 2001. Available online: https://www.systemdynamics.org/assets/conferences/2001/papers/Burns_1.pdf (accessed on 14 December 2018).
  55. Wolstenholme, E.F. Qualitative vs Quantitative Modelling: The Evolving Balance. J. Oper. Res. 1999, 50, 422–428. [Google Scholar] [CrossRef]
  56. Wolstenholme, E.F.; Coyle, R.G. The Development of System Dynamics as a Methodology for System Description and Qualitative Analysis. J. Oper. Res. Soc. 1983, 7, 569–581. [Google Scholar] [CrossRef]
  57. Lorenz, U.; Haraldsson, H.V. Impact Assessment of Global Megatrends: Two Case Studies Connecting Global Megatrends to Regional Topics; Swedish Environmental Protection Agency: Stockholm, Sweden, 2014. [Google Scholar]
  58. Mai, T.; Maani, K. Systems Thinking for Sustainable Tourism in the Cat Ba Biosphere Reserve of Viet Nam. 2010. Available online: https://www.systemdynamics.org/assets/conferences/2010/proceed/papers/P1312.pdf (accessed on 14 December 2018).
  59. Mai, T.; Smith, C. Scenario-based planning for tourism development using system dynamic modelling: A case study of Cat Ba Island, Vietnam. Tour. Manag. 2018, 68, 336–354. [Google Scholar] [CrossRef]
  60. Neumann, K.; Anderson, C.; Denich, M. Participatory, explorative, qualitative modeling: Application of the iMODELER software to assess trade-offs among the SDGs. Economics 2018, 12, 1–19. [Google Scholar] [CrossRef]
  61. Haraldsson, H.; Wiktorsson, M. Understanding the Policy Implementation Deficit of the Swedish Environmental Quality Objectives System. Davidsen, P., Haraldsson, E., Eds.; 2014. Available online: https://www.systemdynamics.org/assets/conferences/2014/proceed/papers/P1424.pdf (accessed on 14 December 2018).
  62. Haraldsson, H.V.; Sverdrup, H.; Belyazid, S.; Sigurdsson, B.D.; Halldórsson, G. Assessment of effects of afforestation on soil properties in Iceland, using Systems Analysis and System Dynamic methods. Icel. Agric. Sci. 2007, 20, 107–123. [Google Scholar]
  63. Moxnes, E. The Art of Causal Loop Diagramming. In Proceedings of the 1984 International System Dynamics Conference, Oslo, Norway, June 1984; pp. 200–204. [Google Scholar]
  64. Kim, D.H. Using Causal Loop Diagrams to Make Mental Models Explicit. Syst. Think. 1994. Available online: https://thesystemsthinker.com/using-causal-loop-diagrams-to-make-mental-models-explicit/ (accessed on 14 December 2018).
  65. Schaffernicht, M. Causal loop diagrams between structure and behaviour: A critical analysis of the relationship between polarity, behaviour and events. Syst. Res. Behav. Sci. 2010, 27, 653–666. [Google Scholar] [CrossRef]
  66. Sarah, R.; O’Brien, A.; Haslett, T. Learning from Loops—Applying CLD to Identify Leverage Points as Organizational Learning. 2006, p. 110. Available online: https://www.researchgate.net/publication/239909587_Learning_from_Loops_-_Applying_CLD_to_Identify_Leverage_Points_as_Organizational_Learning (accessed on 14 December 2018).
  67. Wardman, K.T. Selecting Variable Names for Causal Loop Diagrams. Syst. Think. 1994. Available online: https://thesystemsthinker.com/selecting-variable-names-for-causal-loop-diagrams/ (accessed on 14 December 2018).
  68. Haraldsson, H.V.; Sverdrup, H. On Aspects of System Analysis and Dynamics Workflow. 2005, p. 79. Available online: https://www.systemdynamics.org/assets/conferences/2005/proceed/papers/HARAL310.pdf (accessed on 14 December 2018).
  69. Ólafsdóttir, R.; Runnström, M.C. A GIS approach to evaluating ecological sensitivity for tourism development in fragile environments. A case study from SE Iceland. Scand. J. Hosp. Tour. 2009, 9, 22–38. [Google Scholar] [CrossRef]
  70. Tverijonaite, E.; Ólafsdóttir, R.; Thorsteinsson, T. Accessibility of protected areas and visitor behaviour: A case study from Iceland. J. Outdoor Recreat. Tour. 2018, 24, 1–10. [Google Scholar] [CrossRef]
  71. Cságoly, Z.; Sæþórsdóttir, A.D.; Ólafsdóttir, R. Tourism changing the edge of the wild. J. Outdoor Recreat. Tour. 2017, 17, 1–8. [Google Scholar] [CrossRef]
  72. Ólafsdóttir, R.; Sæþórsdóttir, A.D.; Noordhuizen, J.; Nijkrake, W. Sustainable Leisure Landscapes in Icelandic Rural Communities: A Multidisciplinary Approach. J. Manag. Sustain. 2018, 8, 54–64. [Google Scholar] [CrossRef]
  73. Sheehan, L.; Ritchie, J.R.B.; Hudson, S. The Destination Promotion Triad: Understanding Asymmetric Stakeholder Interdependencies among the City, Hotels, and DMO. J. Travel Res. 2007, 46, 64–74. [Google Scholar] [CrossRef]
  74. Presenza, A.; Del Chiappa, G.; Sheehan, L. Residents’ engagement and local tourism governance in maturing beach destinations. Evidence from an Italian case study. J. Destin. Mark. Manag. 2013, 2, 22–30. [Google Scholar] [CrossRef]
  75. Ryan, C. Equity, management, power sharing and sustainability—Issues of the ‘new tourism’. Tour. Manag. 2002, 23, 17–26. [Google Scholar] [CrossRef]
Figure 1. Hypothetical evolutionary cycles of a tourist destination over time with respect to the TALC. Each cycle represents a new stage in the system attracting visitors with higher tolerance to increased tourism modification from previous stage, and thus higher destination carrying capacity (adapted from Butler [7]).
Sustainability 10 04788 g001
Figure 2. The purism scale continuum relative to the degree of urbanisation (adapted from Ólafsdóttir et al. [13]).
Sustainability 10 04788 g002
Figure 3. The core loop and key driving factors in the CLD of attractiveness of a new site of natural beauty in the tourism destination system.
Sustainability 10 04788 g003
Figure 4. The impact of increased attractiveness of a site of natural beauty in the tourism destination system.
Sustainability 10 04788 g004
Figure 5. Impact of increased popularity of a natural attraction on the categories of tourists visiting a site.
Sustainability 10 04788 g005
Figure 6. The arrival of non-purist visitors into the system and subsequent increasing acceleration in the number of visitors and increased demand for infrastructure and services.
Sustainability 10 04788 g006
Figure 7. The final CLD illustrating the interaction of environmental impact of tourism and tourism activities and infrastructure on the attractiveness of a natural destination. Unsuitable use and development will lead to a change in the system in the form of a higher degree of urbanisation and/or changed environmental status.
Sustainability 10 04788 g007
Figure 8. Natural destination transformation is visually observed through a reinforcing process over time when it moves from purist visitor types towards non-purist visitor types.
Sustainability 10 04788 g008
Figure 9. Result of the relative impact of all the CLD factors upon Tourist environmental impact over time.
Sustainability 10 04788 g009
Figure 10. A relative scale drawn of the changing “number of tourists” composition over time (BOT) through the four stages of development with respect to the results from the relative qualitative CLD impact analysis and the Butler’s [7] TALC model. Growth is shown as positive values (bars) and regression as negative values (bars). The growth, stagnation and decline of each stage indicates the destination tourist carrying capacity threshold has been overshot with the resulting transition towards the following stage.
Sustainability 10 04788 g010

