Trialing a Road Lane to Bicycle Path Redesign—Changes in Travel Behavior with a Focus on Users’ Route and Mode Choice


Abstract

1. Introduction
2. Methodology
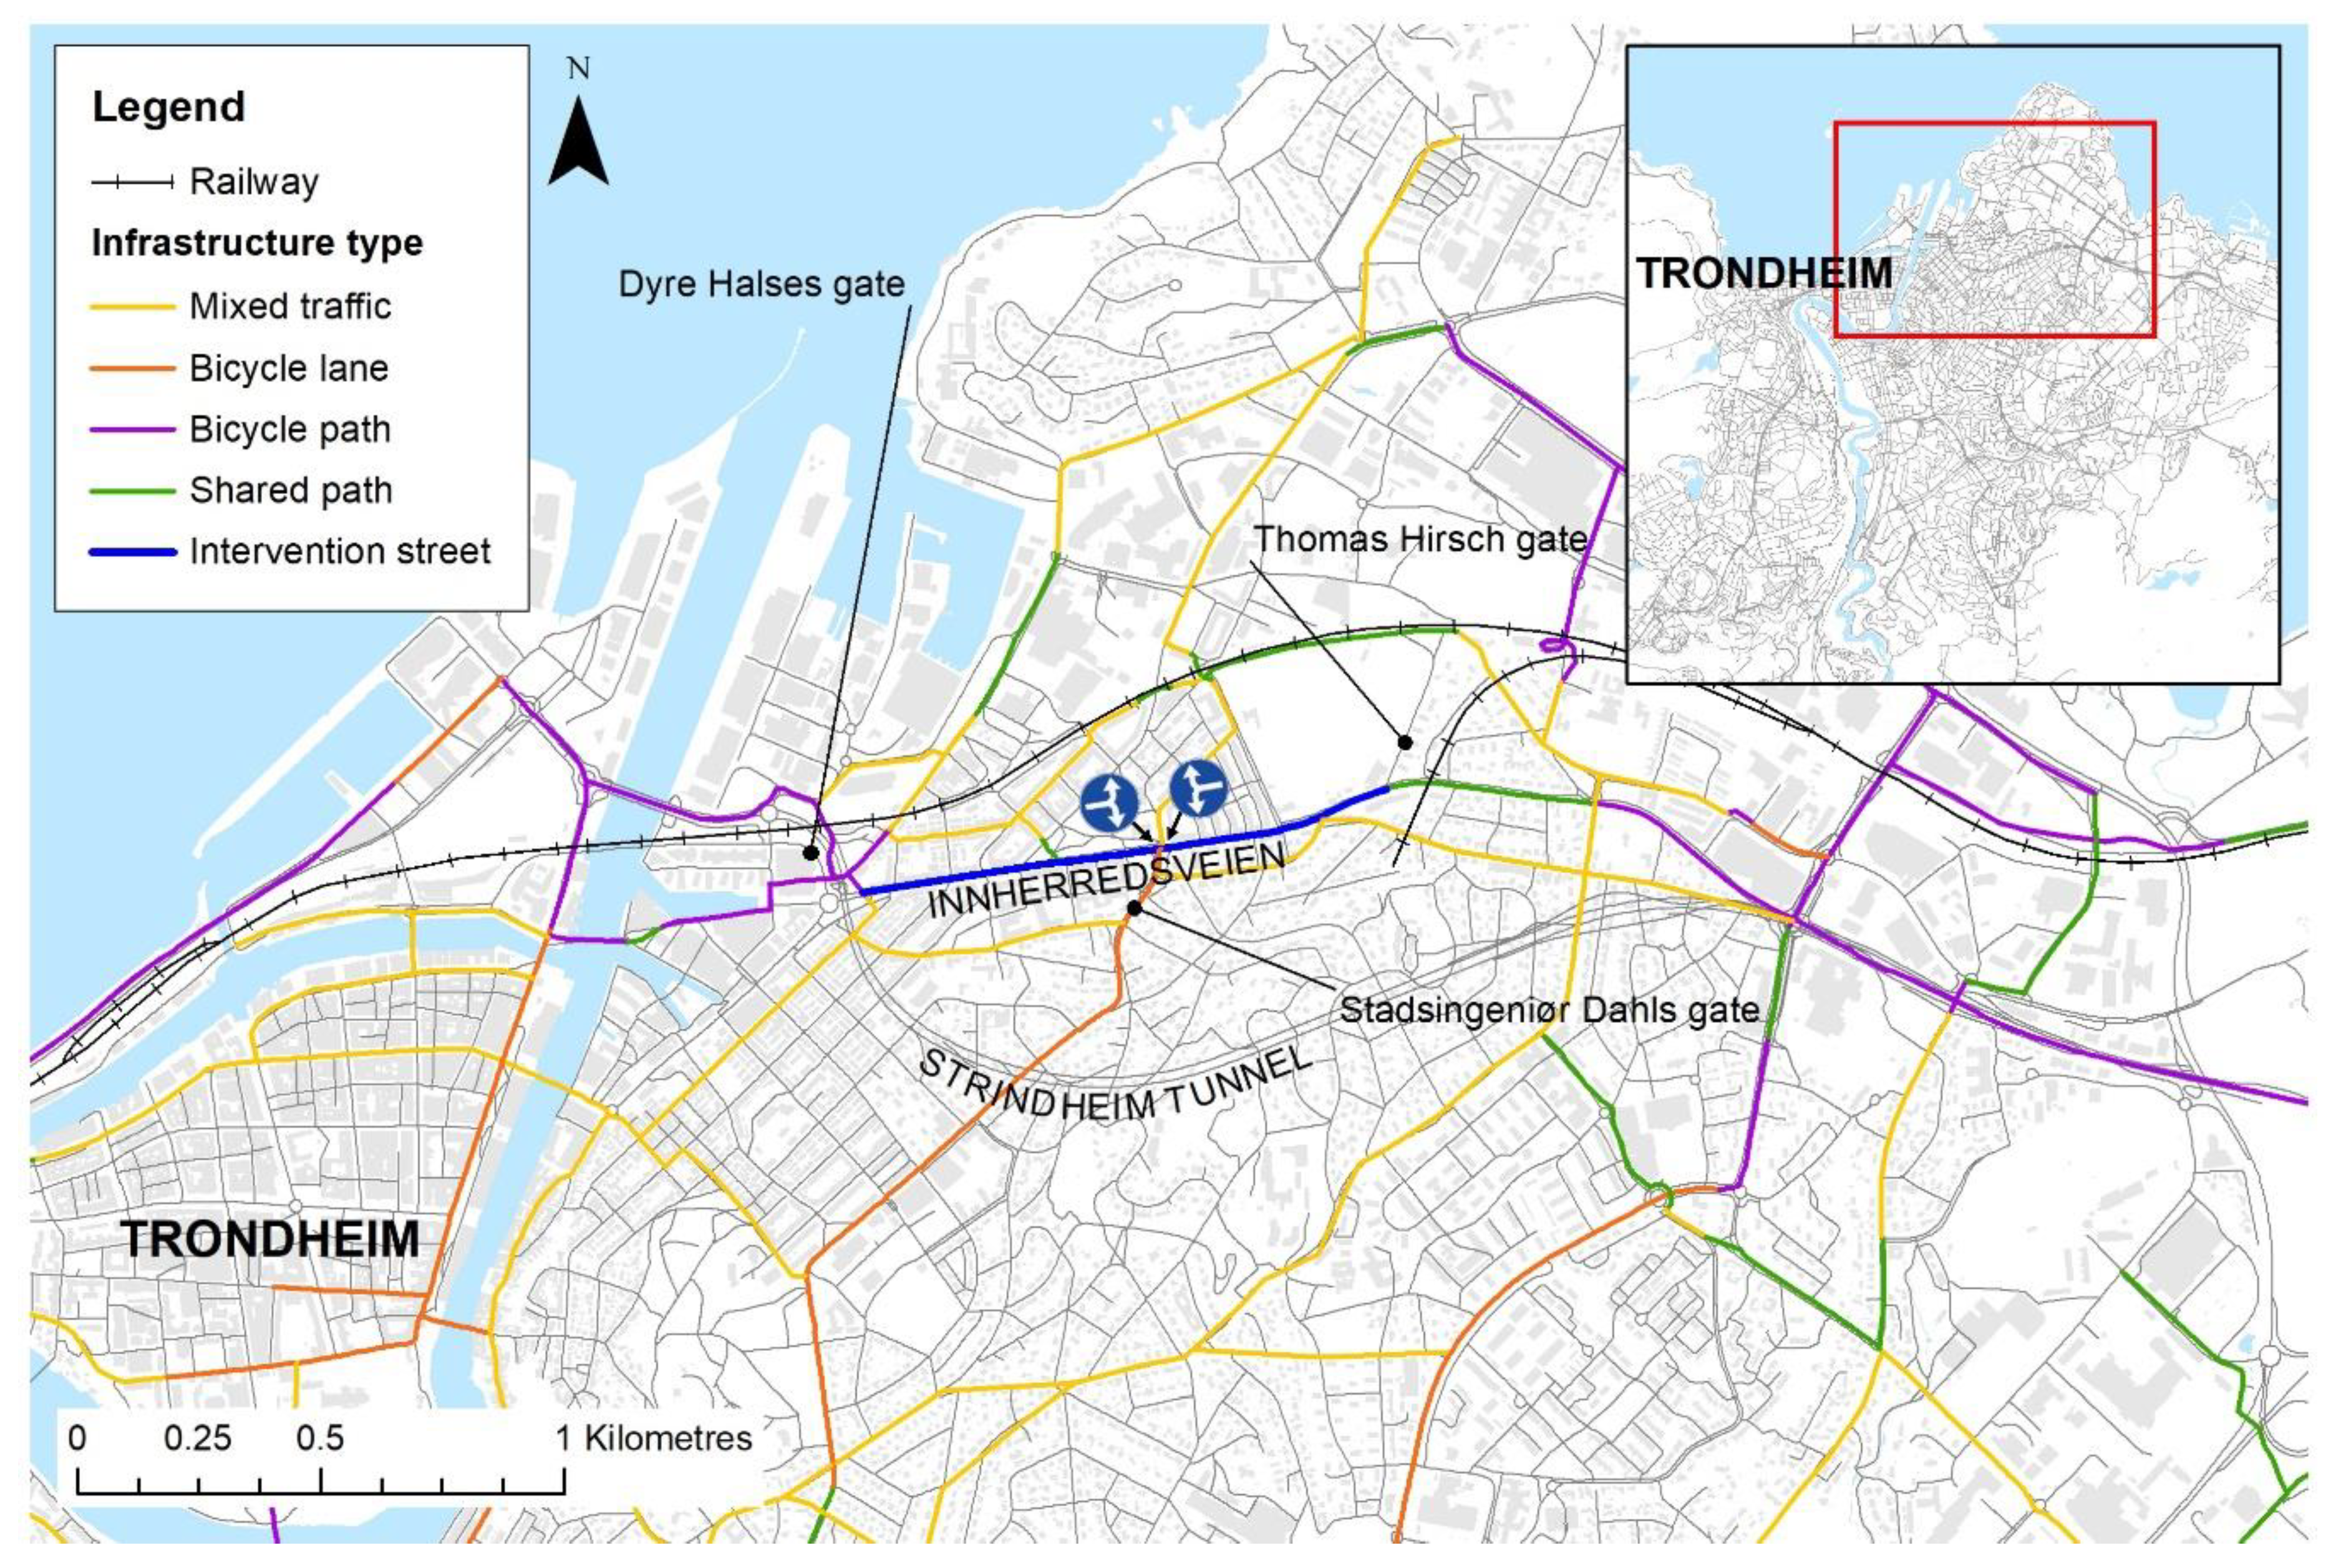
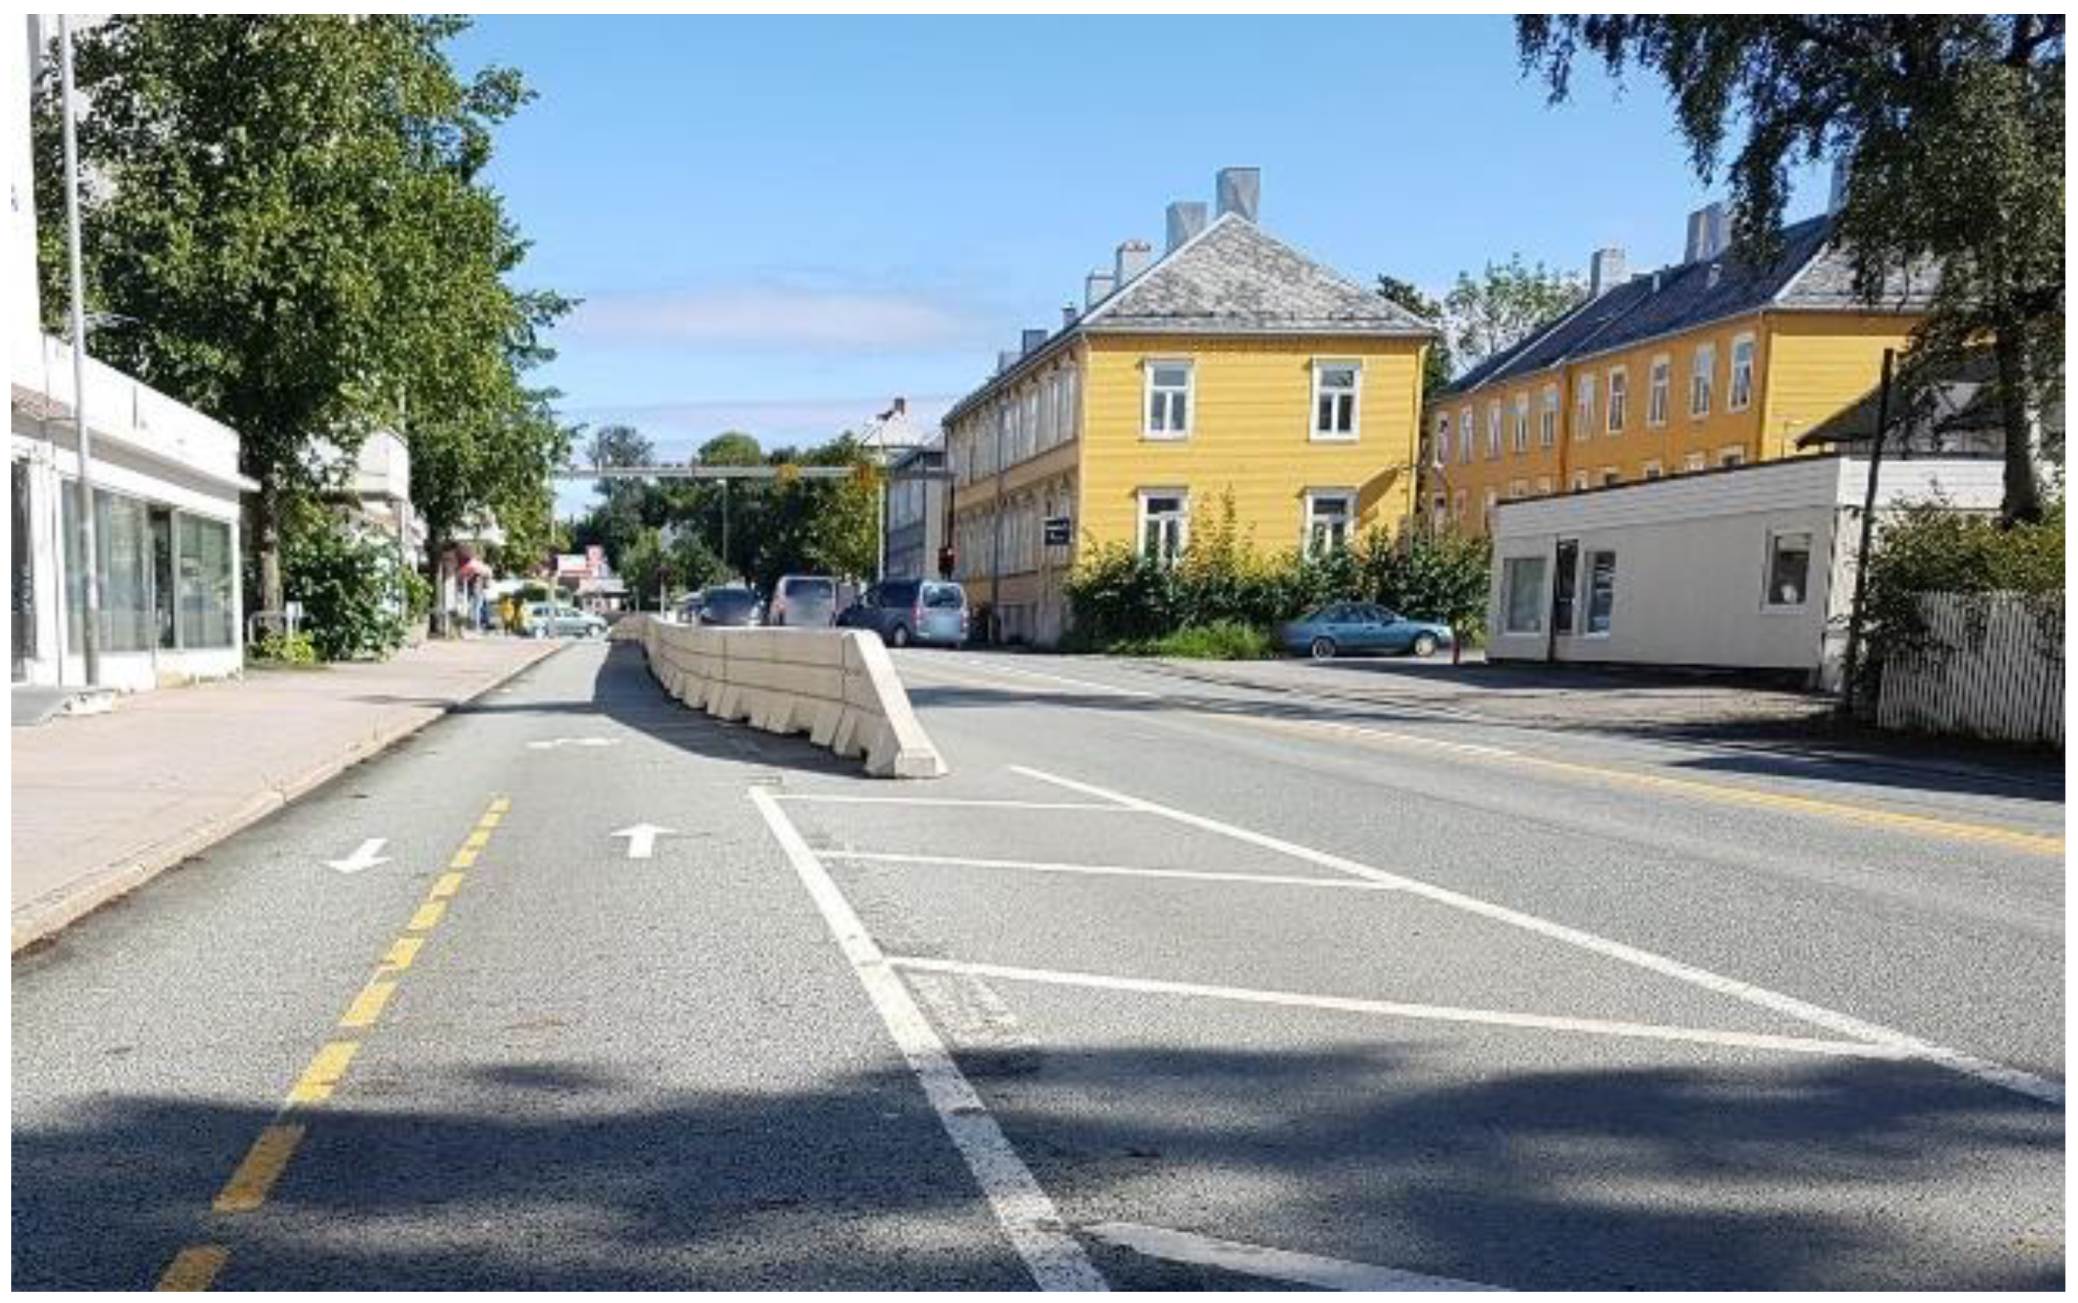
2.1. Case Description
2.2. Data Collection
2.3. Analysis
2.3.1. Geographic Information Systems (GIS)
2.3.2. Statistical Tests
3. Results
3.1. Overview
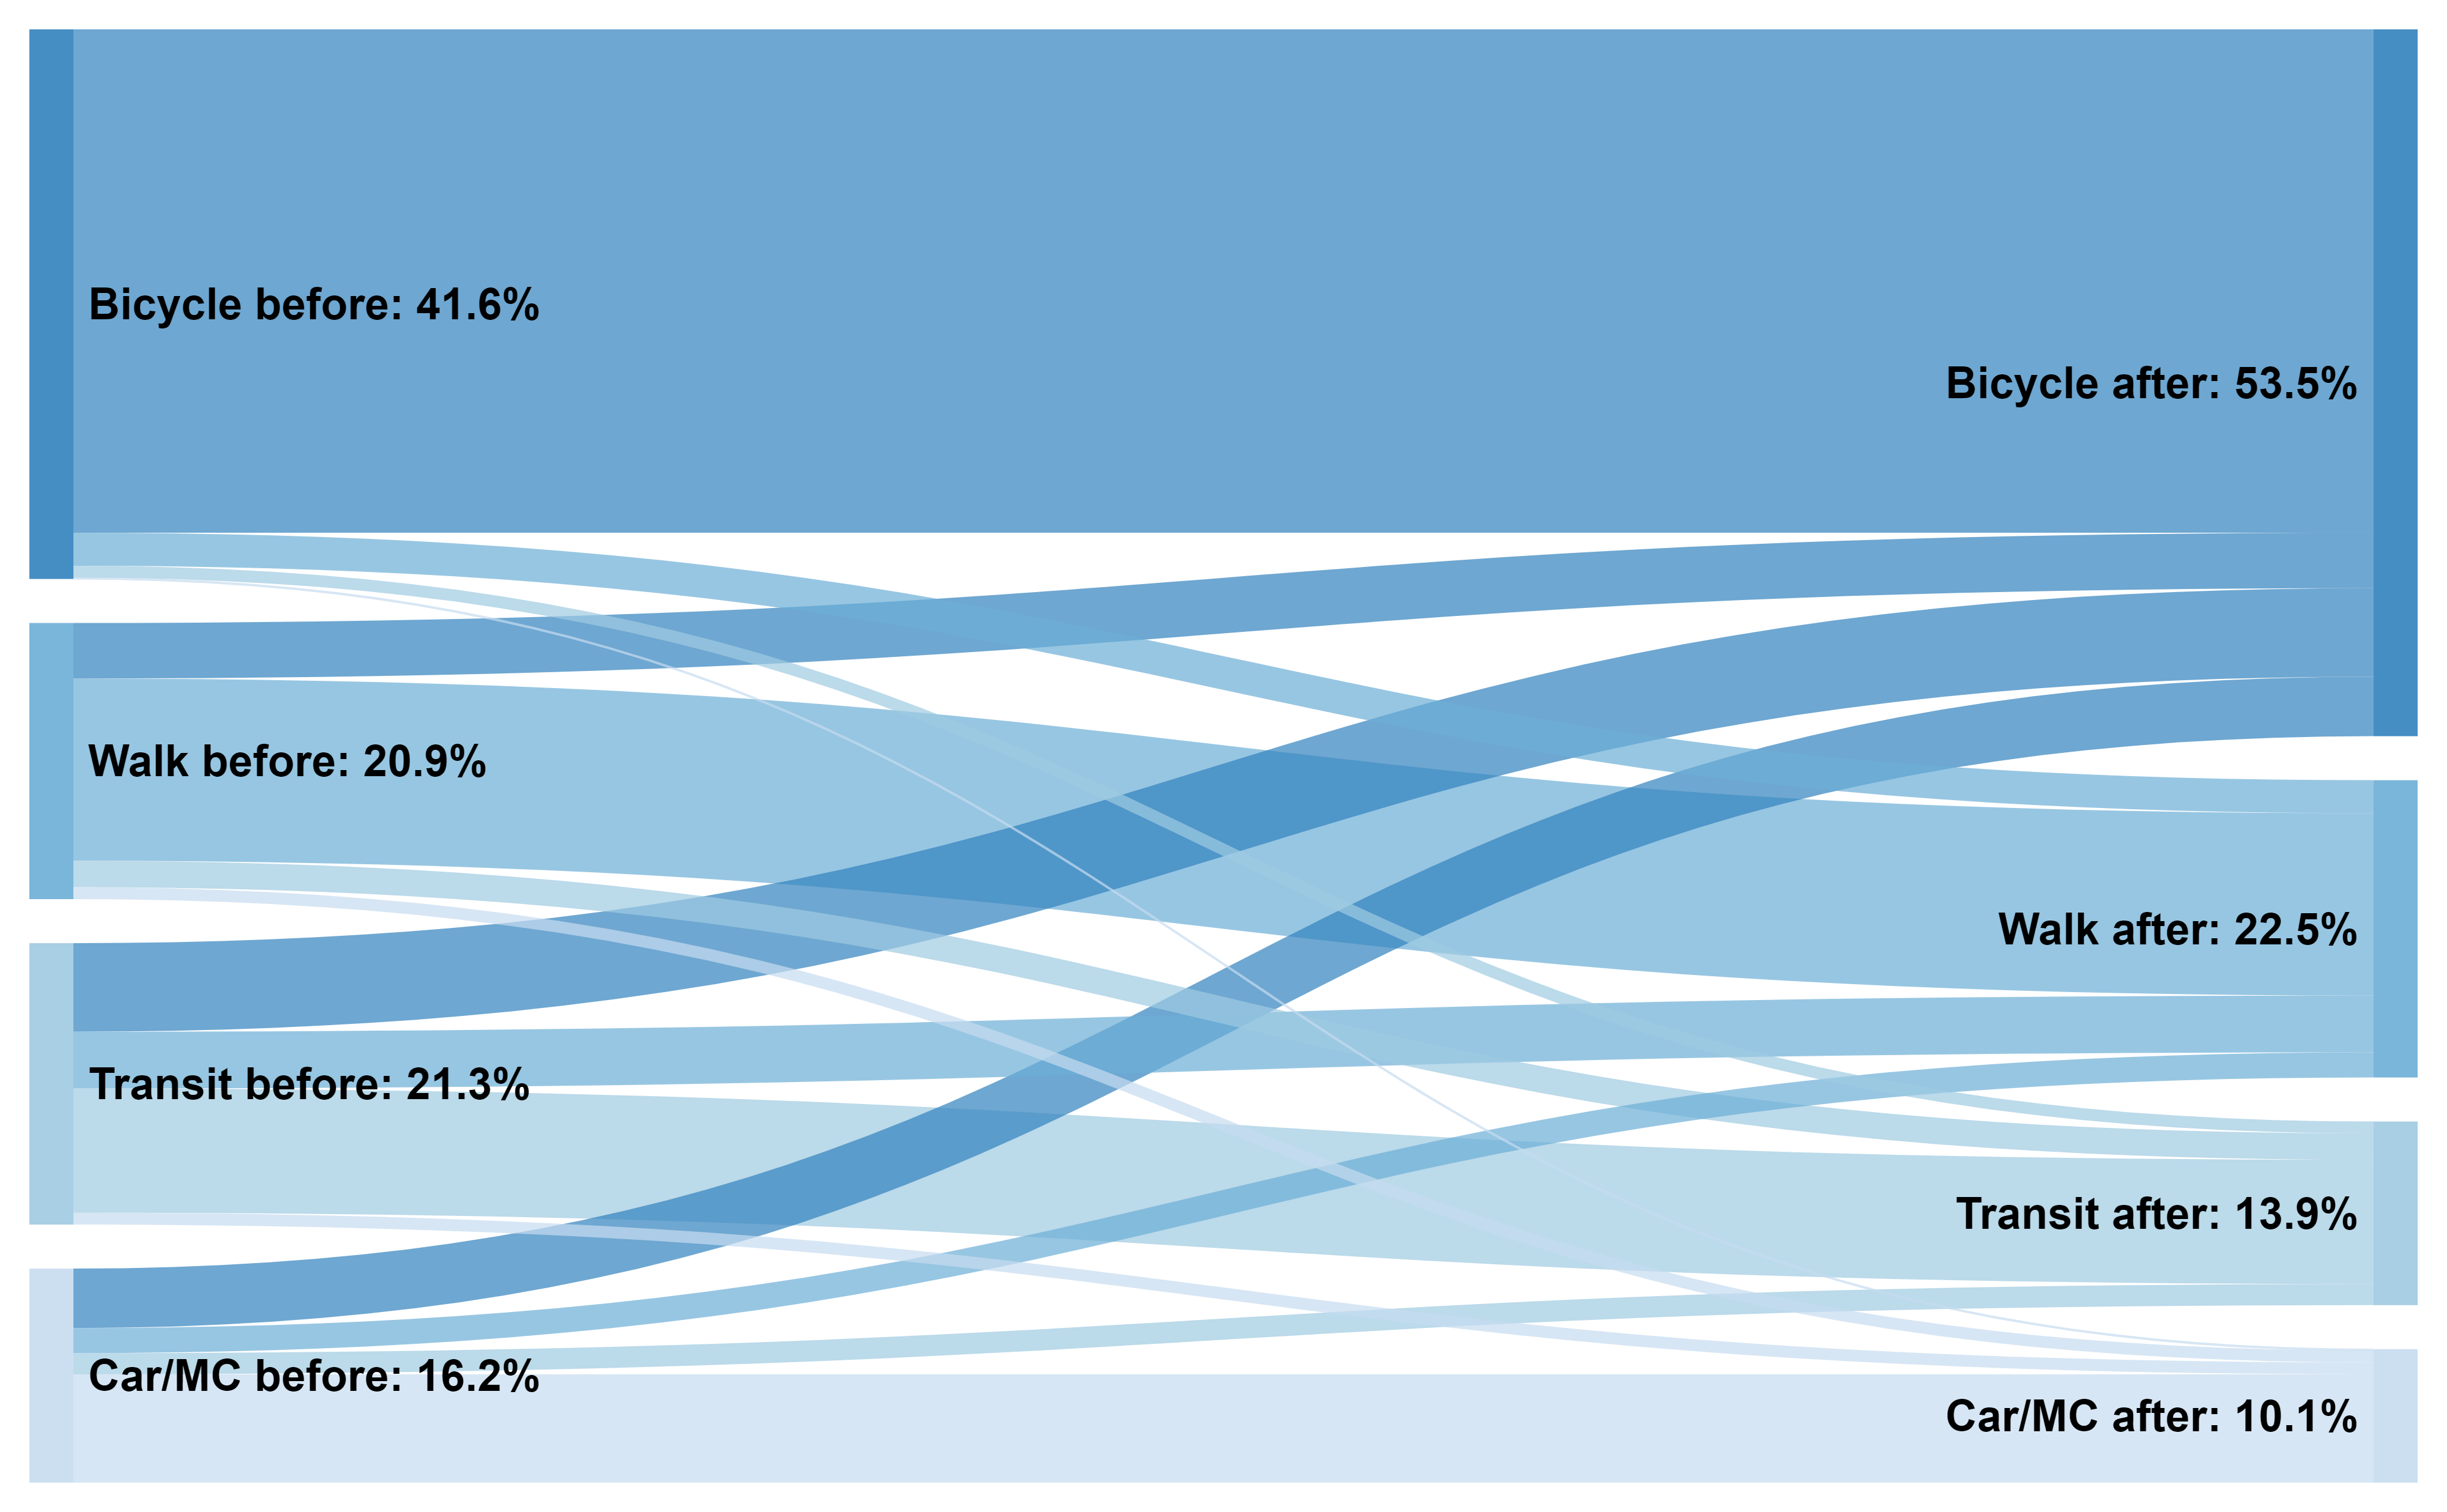
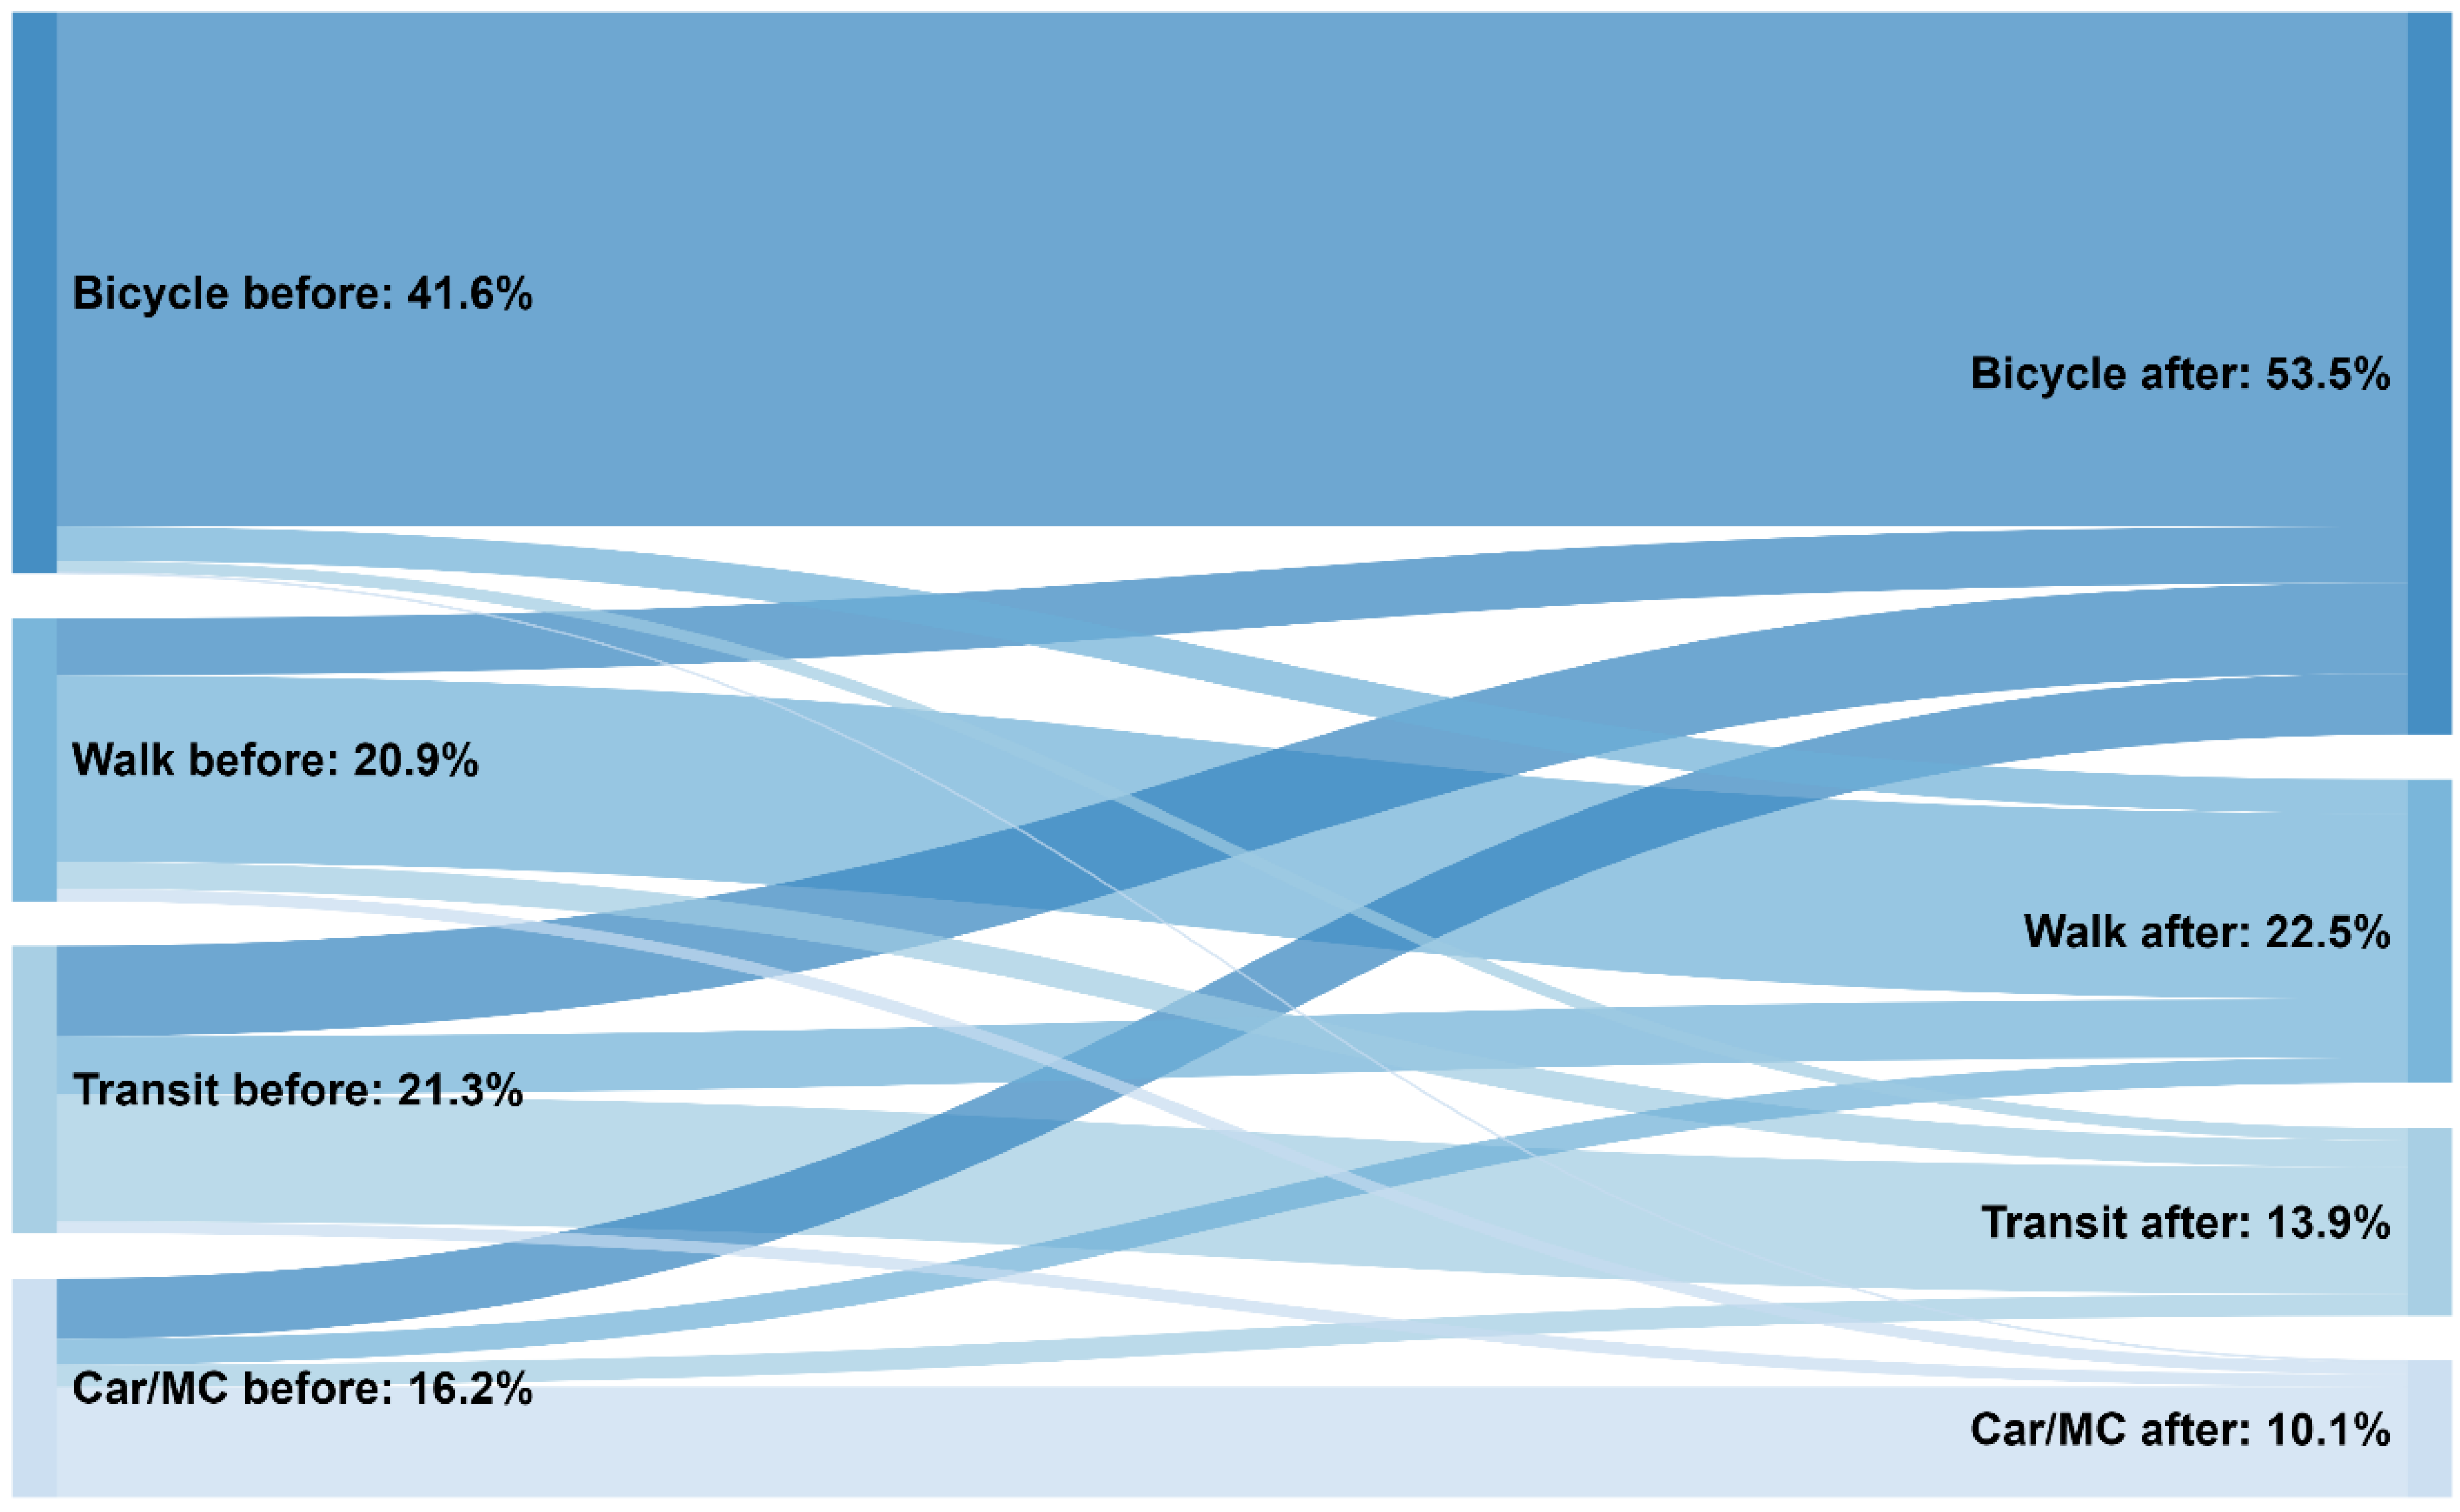
3.2. Mode Choice
3.3. Route Choice
3.4. Attitude
4. Discussion
4.1. Mode Choice
4.2. Route Choice
4.3. Policy Implications
4.4. Limitations
5. Conclusions
Author Contributions
Funding
Acknowledgments
Conflicts of Interest
References
- Koorey, G.; Lieswyn, J. Making space: Innovative ways to fit multiple modes within narrow cross sections. Road Transp. Res. 2016, 25, 44–61. [Google Scholar]
- Mooney, S.J.; Magee, C.; Dang, K.; Leonard, J.C.; Yang, J.; Rivara, F.P.; Ebel, B.E.; Rowhani-Rahbar, A.; Quistberg, D.A. “Complete Streets” and Adult Bicyclist Fatalities: Applying G-Computation to Evaluate an Intervention That Affects the Size of a Population at Risk. Am. J. Epidemiol. 2018, 187, 2038–2045. [Google Scholar] [CrossRef] [PubMed]
- Thomas, L. White Paper Series Road Diet Conversions: A Synthesis of Safety Research. Pedestr. Bicycl. Inf. Cent. 2013, 1–17. [Google Scholar]
- Huang, H.; Stewart, J.; Zegeer, C. Evaluation of Lane Reduction “Road Diet” Measures on Crashes and Injuries. Transp. Res. Rec. J. Transp. Res. Board 2002, 1784, 80–90. [Google Scholar] [CrossRef]
- Pawlovich, M.; Li, W.; Carriquiry, A.; Welch, T. Iowa’s Experience with Road Diet Measures: Use of Bayesian Approach to Assess Impacts on Crash Frequencies and Crash Rates. Transp. Res. Rec. 2006, 1953, 163–171. [Google Scholar] [CrossRef]
- Elias, A. Automobile-Oriented or Complete Street? Transp. Res. Rec. J. Transp. Res. Board 2011, 2257, 80–86. [Google Scholar] [CrossRef]
- Shu, S.; Quiros, D.C.; Wang, R.; Zhu, Y. Changes of street use and on-road air quality before and after complete street retrofit: An exploratory case study in Santa Monica, California. Transp. Res. Part D Transp. Environ. 2014, 32, 387–396. [Google Scholar] [CrossRef]
- Sallaberry, M. Valencia Street Bicycle Lanes: A One Year Evaluation; City of San Francisco Department of Parking and Traffic: San Francisco, CA, USA, 2000. [Google Scholar]
- Provence, D. 25th Avenue Road Diet Project. A One Year Evaluation. In Transportation Fund for Clean Air Project 05r07; San Francisco Municipal Transportation Agency: San Francisco, CA, USA, 2009. [Google Scholar]
- Gudz, E.M.; Fang, K.; Handy, S.L. When a Diet Prompts a Gain. Transp. Res. Rec. J. Transp. Res. Board 2016, 2587, 61–67. [Google Scholar] [CrossRef]
- Monsere, C.; McNeil, N.; Dill, J. Evaluation of Innovative Bicycle Facilities: SW Broadway Cycle Track and SW Stark/Oak Street Buffered Bike Lanes. In Urban Studies and Planning Faculty Publications and Presentations; Portland State University Library: Portland, OR, USA, 2011. [Google Scholar]
- City of Seattle Department of Transportation. Stone Way Rechannelization: Before and After Study; City of Seattle Department of Transportation: Seattle, WA, USA, 2010.
- Laplante, J.; McCann, B. Complete streets: We can get there from here. ITE J. (Inst. Transp. Eng.) 2008, 78, 24–28. [Google Scholar]
- Monsere, C.; Dill, J.; McNeil, N.; Clifton, K.; Foster, N.; Goddard, T.; Berkow, M.; Gilpin, J.; Voros, K.; van Hengel, D.; et al. Lessons from the Green Lanes: Evaluating Protected Bike Lanes in the U.S. Natl. Inst. Transp. Communities 2014, NITC-RR-583, 1–179. [Google Scholar]
- Standen, C.; Crane, M.; Collins, A.; Greaves, S.; Rissel, C. Determinants of mode and route change following the opening of a new cycleway in Sydney, Australia. J. Transp. Heal. 2017, 4, 255–266. [Google Scholar] [CrossRef]
- Börjesson, M.; Eliasson, J. The value of time and external benefits in bicycle appraisal. Transp. Res. Part A Policy Pract. 2012, 46, 673–683. [Google Scholar] [CrossRef]
- Tilahun, N.Y.; Levinson, D.M.; Krizek, K.J. Trails, lanes, or traffic: Valuing bicycle facilities with an adaptive stated preference survey. Transp. Res. Part A Policy Pract. 2007, 41, 287–301. [Google Scholar] [CrossRef]
- Krenn, P.J.; Oja, P.; Titze, S. Route choices of transport bicyclists: A comparison of actually used and shortest routes. Int. J. Behav. Nutr. Phys. Act. 2014, 11, 1–7. [Google Scholar] [CrossRef] [PubMed]
- Dill, J. Bicycling for Transportation and Health: The Role of Infrastructure. J. Public Health Policy 2009, 30 (Suppl. 1), S95–S110. [Google Scholar] [CrossRef] [PubMed]
- Heesch, K.C.; James, B.; Washington, T.L.; Zuniga, K.; Burke, M. Evaluation of the Veloway 1: A natural experiment of new bicycle infrastructure in Brisbane, Australia. J. Transp. Health 2016, 3, 366–376. [Google Scholar] [CrossRef]
- Aultman-Hall, L.; Hall, F.; Baetz, B. Analysis of Bicycle Commuter Routes Using Geographic Information Systems: Implications for Bicycle Planning. Transp. Res. Rec. J. Transp. Res. Board 1997, 1578, 102–110. [Google Scholar] [CrossRef]
- Bølviken, T. Miljøgate 2014—En statusrapport [Environmental street 2014—A status raport]. In Statens Vegvesens Rapporter Nr.346 [Norwegian Public Roads Administration Reports]; Norwegian Public Roads Administration: Oslo, Norway, 2014. [Google Scholar]
- Statens Vegvesen [Norwegian Public Roads Administration]. Fra Riksveg til Gate—erfaringer fra 16 Miljøgater [From National Highway to Street—Experiences from 16 Environmental Streets]; Norwegian Public Roads Administration: Oslo, Norway, 2003; ISBN 8272075431.
- Statistics Norway. Population. Available online: https://www.ssb.no/en/befolkning/statistikker/folkemengde/aar-berekna (accessed on 22 November 2018).
- Hjorthol, R.; Engebretsen, Ø.; Uteng, T.P. TØI Report 1383/2014. Den Nasjonale Reisevaneundersøkelsen 2013/2014—Nøkkelrapport [2013/14 National Travel Survey—Key Results]; Institute of Transport Economics: Oslo, Norway, 2014; ISBN 9788248011316. [Google Scholar]
- Pokorny, P.; Pritchard, R.; Pitera, K. Conflicts between bikes and trucks in urban areas—A survey of Norwegian cyclists. Case Stud. Transp. Policy 2018, 6, 147–155. [Google Scholar] [CrossRef]
- Mapillary. Available online: https://www.mapillary.com/app/?lat=63.4369257441324&lng=10.433829831494483&z=17&focus=photo&menu=false&dateFrom=2017-07-31&pKey=Ho0mq2xFH73byGRs-Gct-g&fbclid=IwAR1RFCUV24_oi79xo-qzOGPuZ1blqjpv32k5azZbOfafyvcri8kNW-MQe-o (accessed on 22 November 2018).
- Pánek, J.; Benediktsson, K. Emotional mapping and its participatory potential: Opinions about cycling conditions in Reykjavík, Iceland. Cities 2017, 61, 65–73. [Google Scholar] [CrossRef]
- Pritchard, R. Revealed Preference Methods for Studying Bicycle Route Choice—A Systematic Review. Int. J. Environ. Res. Public Health 2018, 15, 470. [Google Scholar] [CrossRef]
- Wang, J.Y.T.; Mirza, L.; Cheung, A.K.L.; Moradi, S. Transforming Auckland into a bicycle-friendly city: Understanding factors influencing choices of cyclists. In Australasian Transport Research Forum; Hughes, B., Petkoff, I., Eds.; Australasian Transport Research Forum Incorporated: Perth, Australia, 2012. [Google Scholar]
- Snizek, B.; Sick Nielsen, T.A.; Skov-Petersen, H. Mapping bicyclists’ experiences in Copenhagen. J. Transp. Geogr. 2013, 30, 227–233. [Google Scholar] [CrossRef]
- Rambøll AS. Evaluering av Trafikale Effekter av Prøveprosjektet i Innherredsveien [Evaluation of Traffic Effects of Innherredsveien Trial Project]; Rambøll AS: Copenhagen, Denmark, 2018. [Google Scholar]
- IBM Corp. IBM SPSS Statistics Version 25 for Windows, Computer Software; IBM Corp: New York, NY, USA, 2017. [Google Scholar]
- Feller, W. The Fundamental Limit Theorems in Probability. Bull. Am. Math. Soc. 1945, 51, 800–832. [Google Scholar] [CrossRef]
- Goodman, A.; Sahlqvist, S.; Ogilvie, D. New walking and cycling routes and increased physical activity: One- and 2-year findings from the UK iConnect study. Am. J. Public Health 2014, 104, 38–46. [Google Scholar] [CrossRef] [PubMed]
- Ministry of Transport and Communications. White Paper No. 33 (2016–2017) National Plan of Transport 2018–2029 (In Norwegian: Meld. St. 33 (2016–2017) Nasjonal Transportplan 2018–2029); Ministry of Transport and Communications: Vilnius, Lithuania, 2017.
- Song, Y.; Preston, J.; Ogilvie, D. New walking and cycling infrastructure and modal shift in the UK: A quasi-experimental panel study. Transp. Res. Part A Policy Pract. 2017, 95, 320–333. [Google Scholar] [CrossRef] [PubMed]
- Van Goeverden, K.; Nielsen, T.S.; Harder, H.; Van Nes, R. Interventions in bicycle infrastructure, lessons from Dutch and Danish cases. Transp. Res. Procedia 2015, 10, 403–412. [Google Scholar] [CrossRef]
- Pucher, J.; Garrard, J.; Greaves, S. Cycling down under: A comparative analysis of bicycling trends and policies in Sydney and Melbourne. J. Transp. Geogr. 2011, 19, 332–345. [Google Scholar] [CrossRef]
- Dill, J.; Goddard, T.; Monsere, M.C.; McNeil, N. Can Protected Bike Lanes Help Close the Gender Gap in Cycling? Lessons from Five Cities. 94th Annu. Meet. Transp. Res. Board 2015. [Google Scholar] [CrossRef]
- Parker, K.M.; Rice, J.; Gustat, J.; Ruley, J.; Spriggs, A.; Johnson, C. Effect of Bike Lane Infrastructure Improvements on Ridership in One New Orleans Neighborhood. Ann. Behav. Med. 2013, 45, 101–107. [Google Scholar] [CrossRef]
- Van Goeverden, K.; Godefrooij, T. The Dutch Reference Study. Cases of Interventions in Bicycle Infrastructure Reviewed in the Framework of Bikeability; Delft University of Technology: Delft, The Netherlands, 2011. [Google Scholar]
- Lott, D.F.; Tardiff, T.; Lott, D.Y. Evaluation by experienced riders of a new bicycle lane in an Established Bikeway System. Transp. Res. Rec. J. Transp. Res. Board. 1978, 683, 40–46. [Google Scholar]
- Heinen, E.; Harshfield, A.; Panter, J.; Mackett, R.; Ogilvie, D. Does exposure to new transport infrastructure result in modal shifts? Patterns of change in commute mode choices in a four-year quasi-experimental cohort study. J. Transp. Health 2017, 6, 396–410. [Google Scholar] [CrossRef]


| Variable | Category | Frequency | % |
|---|---|---|---|
| Gender | Male | 415 | 57.7 |
| Female | 304 | 42.3 | |
| Total | 719 | 100 | |
| Age | ≤29 | 243 | 33 |
| 30–34 | 123 | 17 | |
| 35–54 | 274 | 39 | |
| ≥55 | 79 | 11 | |
| Total | 719 | 100 | |
| Occupation | Employed | 552 | 76.8 |
| Student | 116 | 16.1 | |
| Non-employed | 50 | 7 | |
| Total | 718 | 100 | |
| Mode of most usual trip “before” | Walking | 144 | 20.9 |
| Cycling | 287 | 41.6 | |
| Public transport | 147 | 21.3 | |
| Car/Motorcycle/Moped | 112 | 16.2 | |
| Total | 690 | 100 | |
| Mode of most usual trip “after” | Walking | 155 | 22.5 |
| Cycling | 369 | 53.5 | |
| Public transport | 96 | 13.9 | |
| Car/Motorcycle/Moped | 70 | 10.1 | |
| Total | 690 | 100 | |
| Purpose of most usual trip “before” | Work | 300 | 43.5 |
| School | 64 | 9.3 | |
| Personal | 326 | 47.2 | |
| Total | 690 | 100 | |
| Purpose of most usual trip “after” | Work | 341 | 49.4 |
| School | 44 | 6.4 | |
| Personal | 305 | 44.2 | |
| Total | 690 | 100 |
| Occupation | Increased | % | Total |
| Employed | 210 | 39.2% | 536 |
| Student | 43 | 41.3% | 104 |
| Non-employed | 10 | 20.0% | 50 |
| Age | Increased | % | Total |
| ≤29 | 94 | 41.6% | 226 |
| 30–34 | 55 | 46.2% | 119 |
| 35–54 | 97 | 36.2% | 268 |
| ≥55 | 17 | 21.8% | 78 |
| Gender | Increased | % | Total |
| Men | 146 | 36.4% | 401 |
| Women | 117 | 40.3% | 290 |
| Purpose before | Increased | % | Total |
| Work | 105 | 34.9% | 301 |
| School | 30 | 46.9% | 64 |
| Personal | 128 | 39.3% | 326 |
| Mode | Increased | % | Total |
| Walking | 47 | 32.6% | 144 |
| Cycling | 120 | 41.8% | 287 |
| Public | 57 | 38.8% | 147 |
| Motorized | 39 | 34.8% | 112 |
| Occupation | Agree | % | Total |
| Employed | 472 | 88.1% | 536 |
| Student | 93 | 89.4% | 104 |
| Non-employed | 39 | 78.0% | 50 |
| Age | Agree | % | Total |
| ≤29 | 198 | 87.6% | 226 |
| 30–34 | 114 | 95.8% | 119 |
| 35–54 | 234 | 87.3% | 268 |
| ≥55 | 58 | 74.4% | 78 |
| Gender | Agree | % | Total |
| Men | 347 | 86.5% | 401 |
| Women | 257 | 88.6% | 290 |
| Purpose before | Agree | % | Total |
| Work | 267 | 88.7% | 301 |
| School | 57 | 89.1% | 64 |
| Personal | 280 | 85.9% | 326 |
| Mode | Agree | % | Total |
| Walking | 135 | 93.8% | 144 |
| Cycling | 260 | 90.6% | 287 |
| Public | 126 | 85.7% | 147 |
| Motorized | 83 | 74.1% | 112 |
© 2018 by the authors. Licensee MDPI, Basel, Switzerland. This article is an open access article distributed under the terms and conditions of the Creative Commons Attribution (CC BY) license (http://creativecommons.org/licenses/by/4.0/).
Share and Cite
Vasilev, M.; Pritchard, R.; Jonsson, T. Trialing a Road Lane to Bicycle Path Redesign—Changes in Travel Behavior with a Focus on Users’ Route and Mode Choice. Sustainability 2018, 10, 4768. https://doi.org/10.3390/su10124768
Vasilev M, Pritchard R, Jonsson T. Trialing a Road Lane to Bicycle Path Redesign—Changes in Travel Behavior with a Focus on Users’ Route and Mode Choice. Sustainability. 2018; 10(12):4768. https://doi.org/10.3390/su10124768
Chicago/Turabian StyleVasilev, Miroslav, Ray Pritchard, and Thomas Jonsson. 2018. "Trialing a Road Lane to Bicycle Path Redesign—Changes in Travel Behavior with a Focus on Users’ Route and Mode Choice" Sustainability 10, no. 12: 4768. https://doi.org/10.3390/su10124768
APA StyleVasilev, M., Pritchard, R., & Jonsson, T. (2018). Trialing a Road Lane to Bicycle Path Redesign—Changes in Travel Behavior with a Focus on Users’ Route and Mode Choice. Sustainability, 10(12), 4768. https://doi.org/10.3390/su10124768