Beyond Food Security: Challenges in Food Safety Policies and Governance along a Heterogeneous Agri-Food Chain and Its Effects on Health Measures and Sustainable Development in Mexico


Abstract
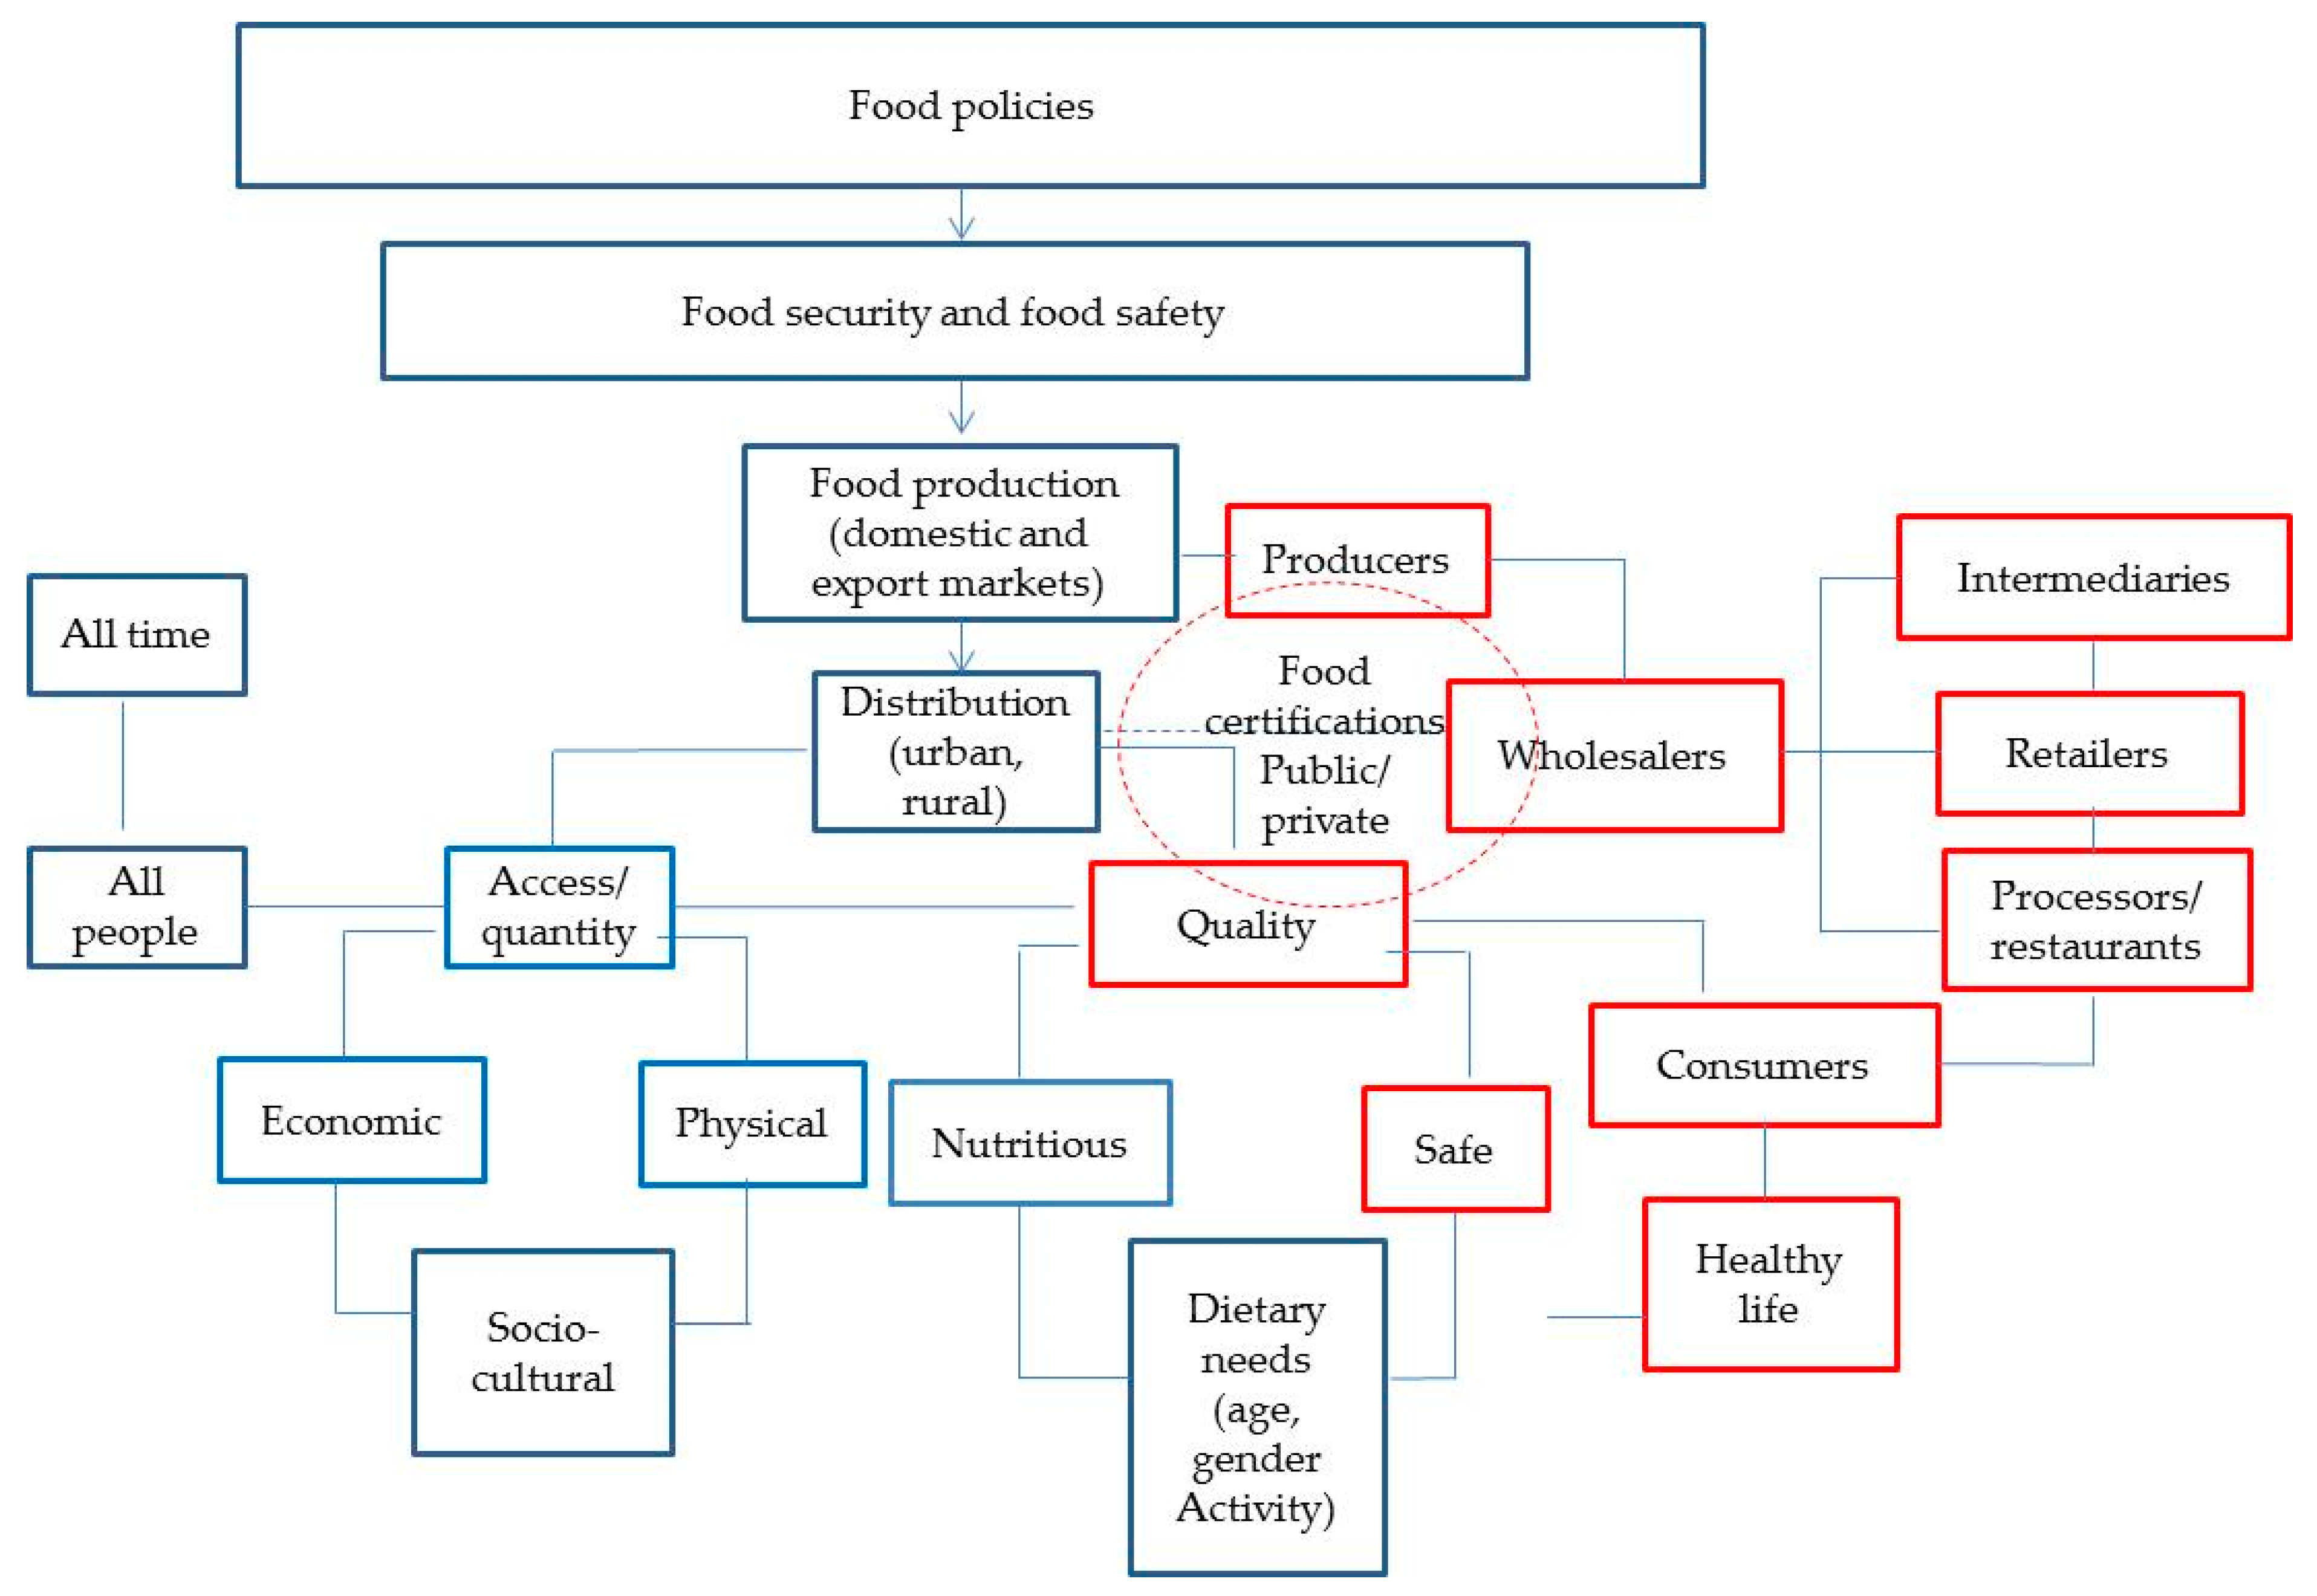
:1. Introduction
1.1. Food Security and the Importance of Food Safety along the Agri-Food Chain
1.2. Socioeconomic Characteristics of Mexico
1.2.1. Food Security Challenges in Mexico
1.2.2. Digestive Illness, Food Safety Concerns and Its Relation with Poverty in Mexico
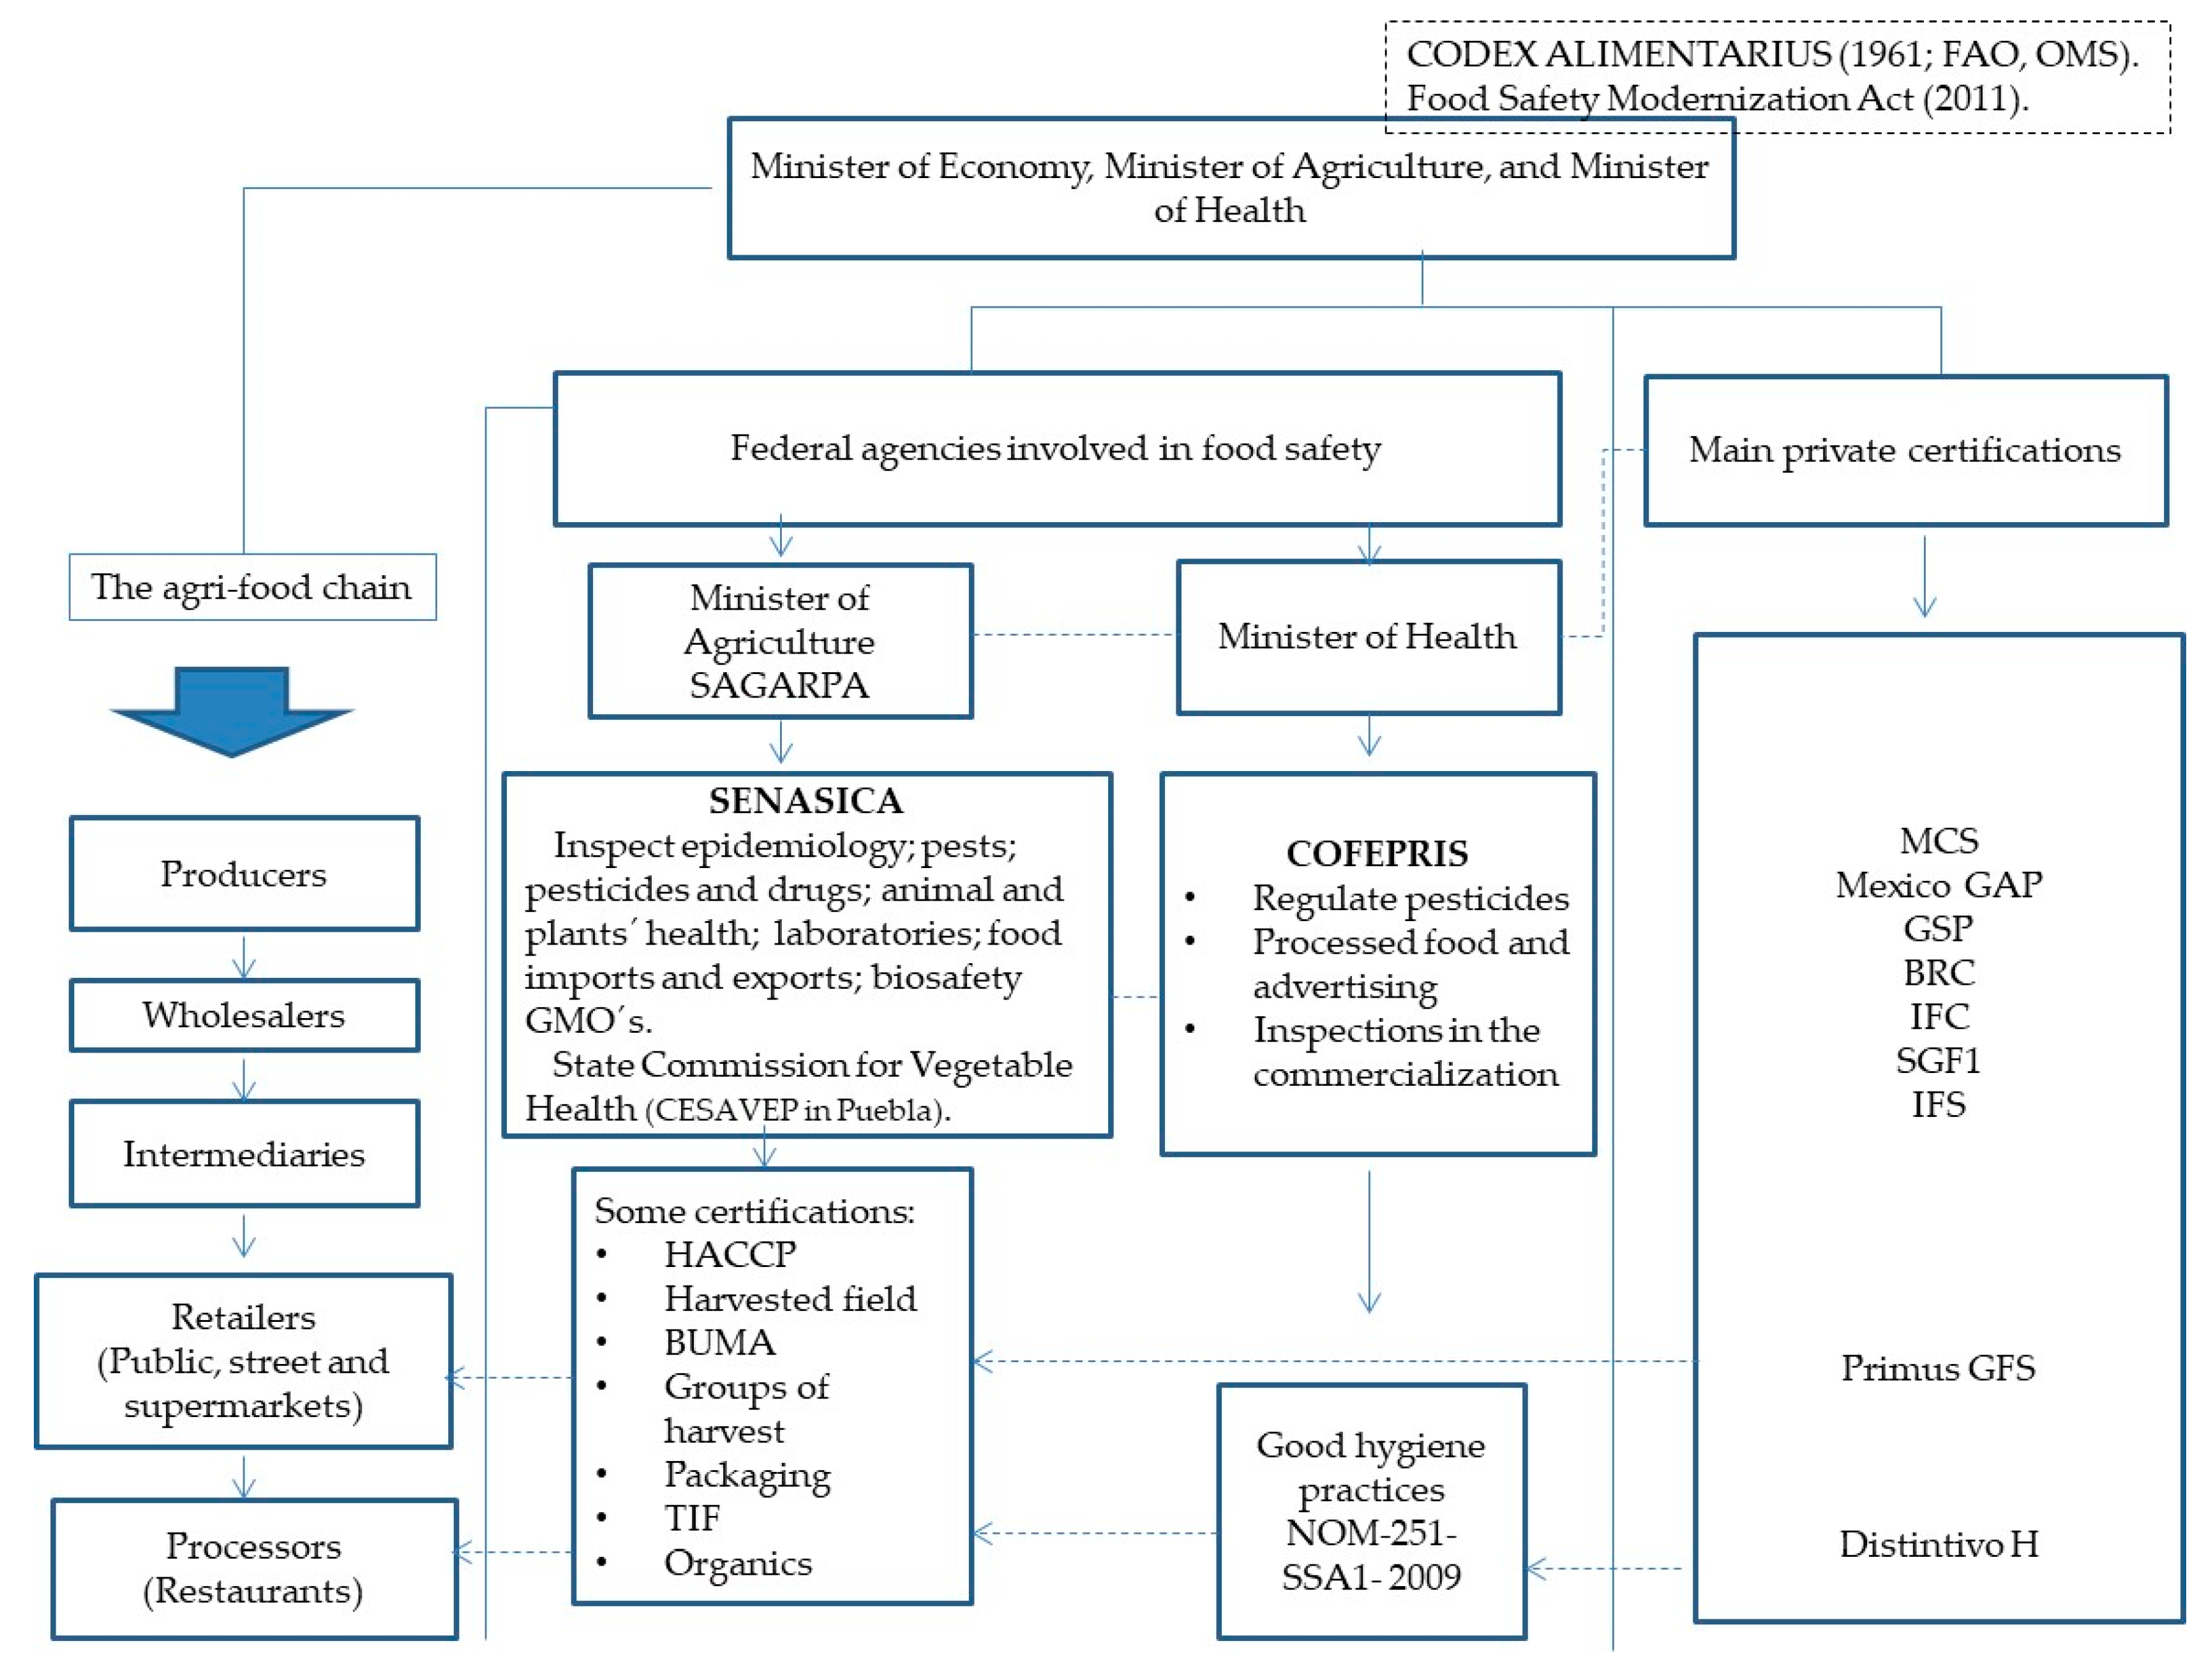
1.2.3. Food Safety and Food Certification Achievements and Opportunities
1.2.4. Food Certifications
1.2.5. The Heterogeneity in the Mexican Agricultural Sector and Its Challenges in Achieving Food Safety
1.2.6. Consumer’ Socioeconomic Profiles, Their Access to Food Security and Safety
2. Materials and Methods
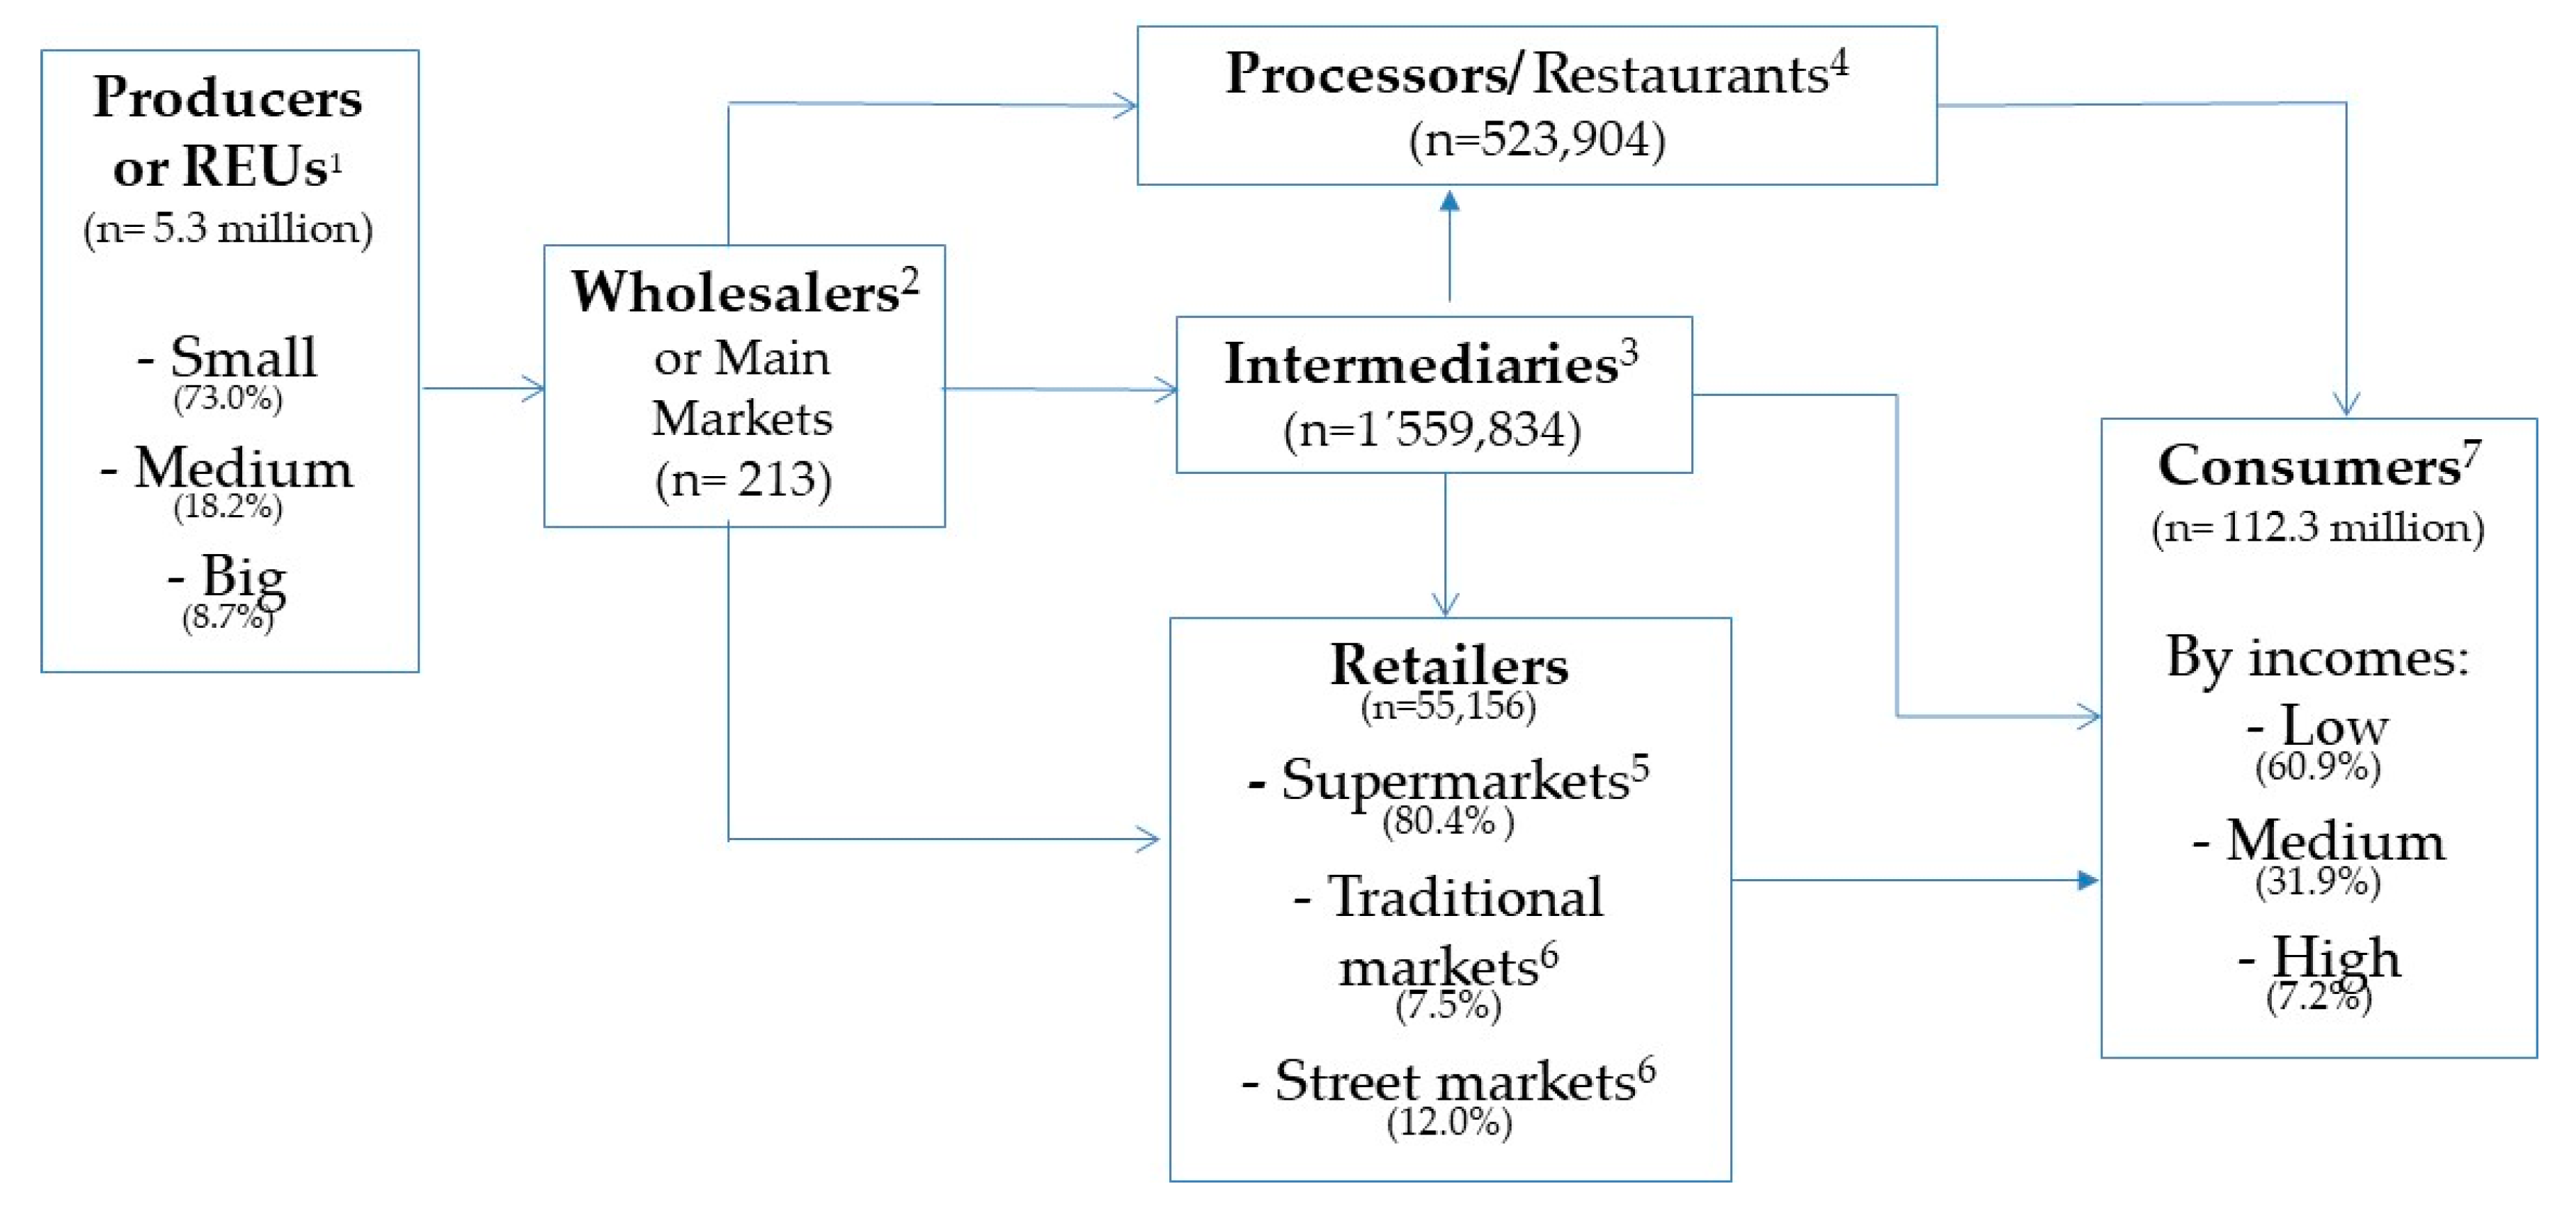
2.1. Number of Food Certifications That Each Agent Has along the Agri-Food Chain
2.2. Wholesalers
2.3. Intermediaries
2.4. Processors or Restaurants
2.5. Retailers
- Supermarkets. Recent reports from the Mexican Chamber of Supermarkets, and Convenience Stores (ANTAD) mentioned the existence of about 55,156 supermarkets and chain stores in the whole country [57]. Traditional markets. Regarding traditional markets, there are 329 for the capital of the country, Mexico City [56]. Given the scarcity of information for the rest of the country, we used these data to estimate a number of markets and street markets across the nation. The markets in Mexico City average one per 27,052 people, we conservatively estimate 1 market for every 27,000 people, or 4153 markets nationwide. Street markets. The same situation happened trying to obtain data regarding the number of street markets or open-air markets. This number was available only for Mexico City (1343); so we used the same method described for estimating a number of street markets, arriving at 16,954 markets nationwide [55,56].
2.6. Consumers
3. Results
3.1. Answers from People Knowledgeable about Certification Processes and Requirements along the Agri-Food Chain
- For producers, we can confirm certifications are voluntary, costly and market oriented, this means, they are commercially oriented adopted (mainly when any intermediaries or retailer, national or international, ask for those requirements), not because they worry about their own or other people’s health. To meet those standards, it is very important to be organized so they can share resources (water, electricity, warehouses, transport, and legal benefits).
- In the case of wholesalers, intermediaries and retailers, they are not pushed to attend food certifications as the agents before them (REUs), and after them have not adopted any standard as well, so they can freely sell their food without any safety concern; additionally, the number of agents in this part of the chain (near 2.4 million economic units-wholesalers, intermediaries, processors, and retailers), is hard to control.
- In restaurants, we can observe two challenges: a basic disconnection between the Minister of Economy and Commerce, and the Ministry of Health. The former have ignored this part of the legal and formal permits to open and operate a food restaurant; then all efforts from the Minister of Health to control food safety issues are insufficient; additionally, the scarcity of federal budget investment in the Ministry of Health to hire additional inspectors, had led to a hug amount of unsafety food and informal vendor (street food), whom, by the way, do not pay taxes and hence do not contribute in increasing the budget for both Ministries of Economy and Health.
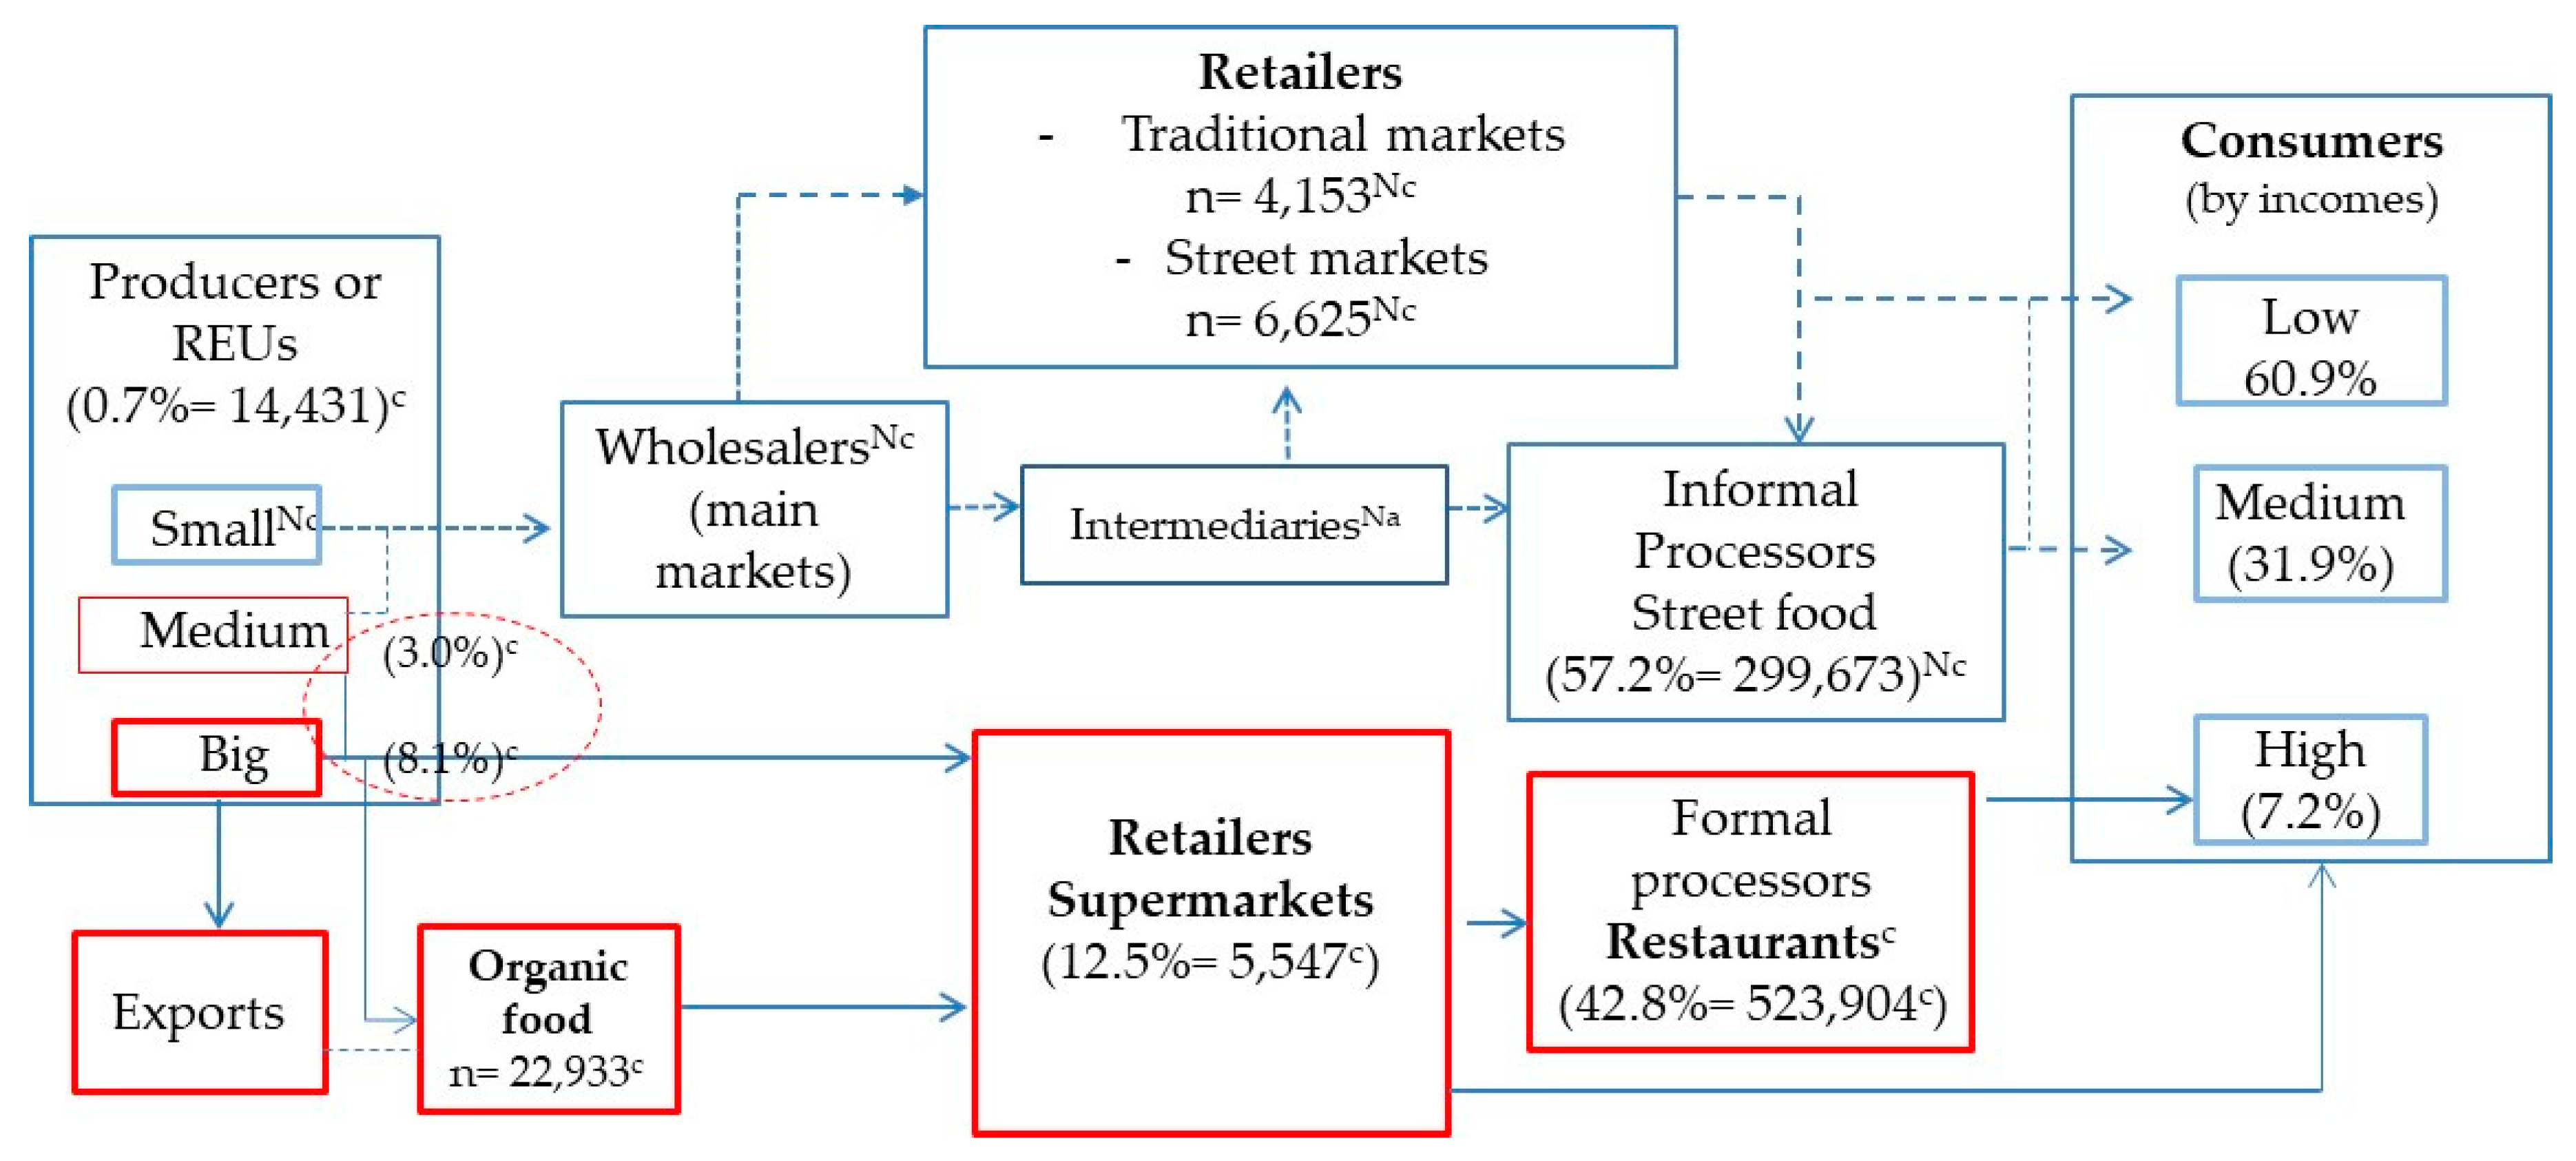
3.2. Certifications in Producers, Products, Type of Certifications and Hectares Achieved in 2018
3.3. Economic Barriers for Certification Experienced by Producers
3.4. Educational and Cultural Barriers
3.5. Wholesalers and Intermediaries’ Certifications
3.6. Regarding the Number of Retailers (Public and Street Markets) Certified
3.7. The Retailers’ Importance in Food Safety
3.8. Food Preparation and the Lack of Supervision in Formal and Informal Restaurants
3.9. International Tourism and Food Intake Risks
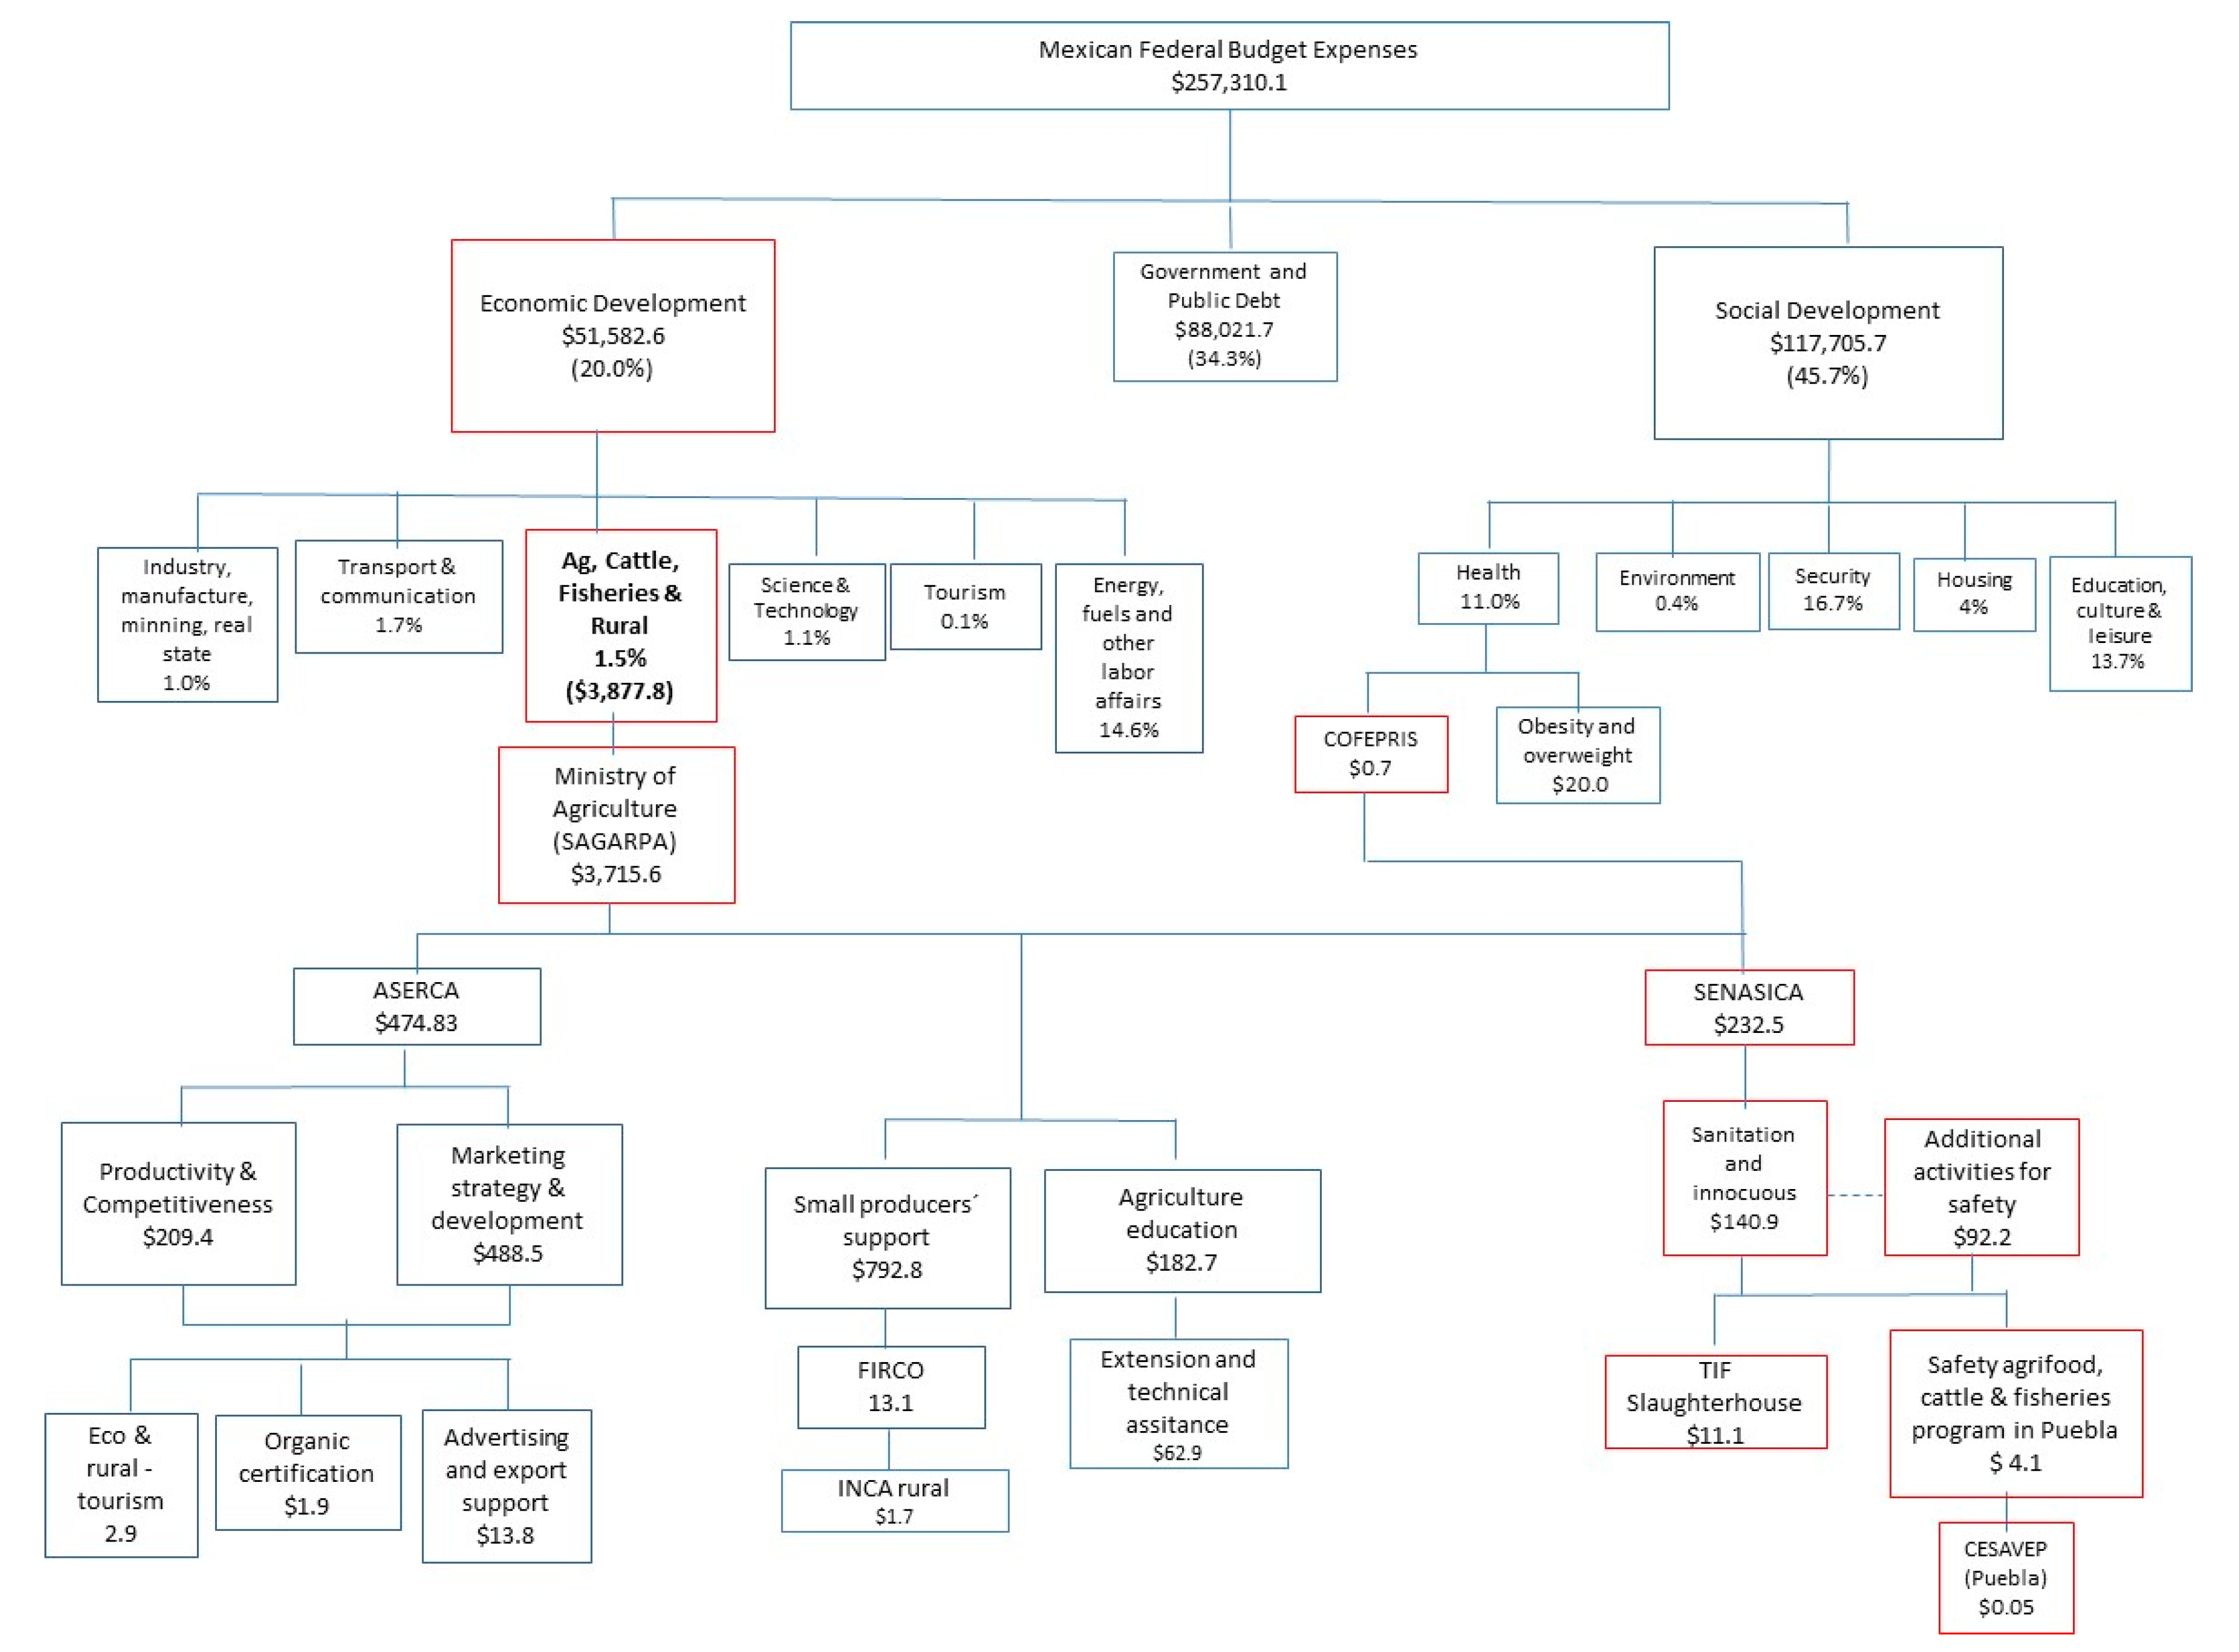
3.10. Federal Expenditures in Food Safety Issues and Federal Agencies Associated to Safety Issues and Health
4. Discussion
- (a)
- Unfortunately, Mexican food policies regard food safety issues as focused on the privileged and are oriented to export markets and/or high-income producers-consumers;
- (b)
- This situation has split the agri-food chain in two: one that serves international or high-income consumers, and another that serves domestic markets;
- (c)
- The agri-food chain that serves domestic markets experiences short falls in federal budget expenditures devoted to food safety issues and experiences a lack of coordination in food regulations (transparency, laws, training, supervision, infrastructure), across the various domestic agri-food chain agents. Consequently, this situation has created alternate informal markets which contribute to increase food illnesses due their scarcity of safety practices and oversight. Finally, we observe a vicious circle that mainly affects lower-income peoples’ health, wellbeing, and reduces their purchasing power. The process of convalescing and managing the accompanying illnesses could increase their poverty condition or risk of poverty. For these low-income consumers, we also observe large inequities in the food quality and quantity they can access.
4.1. Certification and Training for Small and Medium Producers: Some Experiences in Some Latin America Countries
- Pérez-Alemán [69,82] worked in Nicaragua, El Salvador and Guatemala “building collective capabilities, learning and standards diffusion”, the knowledge behind standards (what and why), and the organizational components to meet them (know–how). The study found out that the process is not an easy issue as it includes tacit to explicit knowledge-sharing, communication and confidence, combining and creating new local knowledge, or mixing local knowledge with national or international knowledge. Shared and spread, this becomes a collective learning process that must be planned, supervised, adjusted and coordinated on a daily basis and must be recorded so that the valuable traditional knowledge can be passed on. Looking at certification from a different perspective [69,82,83], researchers suggest avoiding “taking norms for granted” and “one size fits all”, or worrying about why they do not spread the way “they should” in marginalized regions. Pérez-Alemán and Henson and Jaffee [82,83,84] highlight the importance of using traditional rural and small producers’ knowledge, and put it in practice, beyond the mere acquisition of technology, to a transfer of information in a simplified way. Their methodology focuses on developing new competencies to merge old and new processes, products, organizational activities, and building social capital. Systems of training through associations and groups or regional, national and international network for small countries also worked.
- In the case of Brazil, it took five years for sugarcane producers to adopt certification processes successfully [68,85]. Training auditors and authorities on these issues were more valuable than having seminars for producers and passing out folders that contained the rules. Auditors must adopt a counselor role rather than acting as mere supervisor or police. Big exporters require a different language and support than domestic small and medium producers, intermediaries, processors; they expect a different language because they have different interests along the chain than retailers. Third-party auditors, who in rural areas must be close to the producers, must not act as authorities but should help producers translate what the standards and technical language mean. The third-party auditors can thus become strategic partners to help producers move to change, to make them feel included and that they are participating in a fair game (no winner or losers). The auditors can also try to build a constructive environment and emphasize the role of the cooperative as a community with shared values.
- The increasing demand (internal and external) in Peru for quality asparagus led them to a strong cooperation between private and government sectors, in both standards, and cooperation with investments and infrastructure. This increased income and employment across the supply chain including in cultivation of fresh asparagus, as well as in secondary industries (frozen and canned). In addition, they utilized second-grade produce that did not meet standards for exports, for self-consumption and for low-income markets, thus reducing waste and leading to more employment for some of Peru’s poorest people [82]; they would need people to package, transport, distribute and commercialize the product.
4.2. Retailer Challenges
4.3. Processors and Restaurants Inspections
4.4. Educating the Consumer to Inform about Food Safety at Home
5. Conclusions
Author Contributions
Funding
Acknowledgments
Conflicts of Interest
References
- Food and Agriculture Organization of the United Nations. Food Security. 2006. Available online: http://www.fao.org/forestry/13128-0e6f36f27e0091055bec28ebe830f46b3.pdf (accessed on 30 January 2018).
- World Health Organization. WHO Estimates of the Global Burden of Foodborne Diseases. Foodborne Disease Burden Epidemiology Reference Group 2007–2015. 2015. Available online: http://apps.who.int/iris/bitstream/10665/199350/1/9789241565165_eng.pdf (accessed on 17 February 2016).
- Gordana, R. Study of Food Safety Inspections. World Bank, 2009. Available online: http://documents.worldbank.org/curated/en/614141468325282214/Study-of-food-safety-inspections (accessed on 23 September 2018).
- Chandrasekaran, N.; Raghuram, G. Agribusiness Supply Chain Management; CRC Press. Taylor & Francis Group: Boca Raton, FL, USA, 2014; p. 670. ISBN 978-1-4665-1674-8. [Google Scholar]
- Pan American Health Organization. Health in the Americas: 2012 Edition. Regional Outlook and Country Profiles. Scientific and Technical Publication No. 636. World Health Organization Regional Office for the Americas, 2012. Available online: http://www1.paho.org/saludenlasamericas/docs/hia-2012-summary.pdf (accessed on 17 February 2016).
- Batz, M.B.; Henke, E.; Kowalcyk, B. Long-term consequences of foodborne infections. Infect. Dis. Clin. N. Am. 2013, 27, 599–616. [Google Scholar] [CrossRef] [PubMed]
- Official Journal of the Federal Government of Mexico. Programa Nacional México sin Hambre. Gobierno Federal, 2014. Available online: http://dof.gob.mx/nota_detalle.php?codigo=5343098&fecha=30/04/2014 (accessed on 12 November 2015).
- Consejo Nacional de Evaluación de la Política de Desarrollo Social. Informe de Evaluación de la Política de Desarrollo Social 2016. 2017. Available online: https://www.coneval.org.mx/Evaluacion/IEPSM/Documents/IEPDS_2016.pdf (accessed on 2 May 2018).
- Food and Agriculture Organization of the United Nations. Regional Overview of Food Insecurity Latin America and the Caribbean. 2015. Available online: http://www.fao.org/3/a-i4636e.pdf (accessed on 29 April 2016).
- Torres, F. México: Expectativas de su seguridad alimentaria en la fase de economía abierta, In Ciencia, Tecnología e Innovación en el Sistema Agroalimentario de México; Martínez-Carrera, D., Ramírez-Juárez, J., Eds.; Biblioteca Básica de Agricultura: Guadalajara, México, 2016; p. 856. ISBN 978-607-715-314-6. [Google Scholar]
- Cuéllar, J.A. Programa de Seguridad Alimentaria: Experiencias en México y Otros Países. Comisión Económica para América Latina, 2011. Available online: http://repositorio.cepal.org/bitstream/handle/11362/26070/LCmexL1035_es.pdf?sequence=1 (accessed on 8April 2015).
- Food and Agriculture Organization of the United Nations. Food Safety Risk Management. Evidence-Informed Policies and Decisions Considering Multiple Factors. FAO Guidance Materials. 2017. Available online: http://www.fao.org/3/i8240en/I8240EN.pdf (accessed on 2 October 2018).
- Parra-Inzunza, F.; Ocampo-Fletes, I.; Gutiérrez, A. La Experiencia PESA—FAO en la Región Mixteca Baja Poblana. In Seguridad Alimentaria en Puebla: Importancia, Estrategias y Experiencias; Jiménez, F.A., Ed.; Colegio de Postgraduados, Secretaría de Desarrollo Rural del Gobierno del Estado de Puebla, Altres Costa, AMIC: Mexico City, Mexico, 2008; p. 283. ISBN 978-968-839-539-4. [Google Scholar]
- Instituto Nacional de Estadística y Geografía. Estadísticas de Mortalidad. 2013. Available online: http://www3.inegi.org.mx/sistemas/sisept/Default.aspx?t=mdemo107&s=est&c=23587 (accessed on 4 September 2015).
- Instituto Nacional de Salud Pública. Encuesta Nacional de Salud y Nutrición. Resultados Nacionales 2012. Instituto Nacional de Salud Pública, 2012. Available online: https://ensanut.insp.mx/informes/ENSANUT2012ResultadosNacionales.pdf (accessed on 8 October 2018).
- Diaz-Cayeros, A.; Egan, A.; Floca, M.; Furszyfer, J.; Gell-Redman, M.; Gomez Morin, L.; Razu, Z. Atlas of Epidemiological Transition in Mexico. Center for U.S.-Mexican Studies, 2017. Available online: http://usmex-health.ucsd.edu/ (accessed on 13 February 2018).
- Instituto Nacional de Estadística y Geografía. Anuario Estadístico y Geográfico de los Estados Unidos Mexicanos. 2014. Available online: http://www.beta.inegi.org.mx/app/biblioteca/ficha.html?upc=702825097912 (accessed on 14 August 2018).
- World Health Organization. World Health Day 2015 Food Safety. How Safe Is Your Food? From Farm to Plate, Make Food Safe. Campaign Tool Kit. 2015. Available online: http://www.who.int/campaigns/world-health-day/2015/campaign-toolkit.pdf?ua=1 (accessed on 2 October 2018).
- World Health Organization. Food Safety Key Facts. Fact Sheet No. 399. 2015. Available online: http://www.who.int/campaigns/world-health-day/2015/fact-sheet.pdf?ua=1 (accessed on 26 September 2018).
- Instituto Nacional de Estadística y Geografía. Sistema de Cuentas Nacionales de México. Cuentas de Bienes y Servicios 2014. 2015. Available online: http://www.inegi.org.mx/saladeprensa/boletines/2015/especiales/especiales2015_09_3.pdf (accessed on 8 October 2018).
- Official Journal of the Federal Government of Mexico. Decreto por el que se Aprueba el Programa Sectorial de Desarrollo Agropecuario, Pesquero y Alimentario 2013–2018. Cuarta Sección. 13 de Diciembre. Secretaría de Agricultura, Ganadería, Desarrollo Rural, Pesca y Alimentación. 2013. Available online: http://dof.gob.mx/nota_detalle.php?codigo=5326583&fecha=13/12/2013 (accessed on 12 November 2015).
- Jiménez, F.A. Seguridad Alimentaria en Puebla: Importancia, Estrategias y Experiencias; Colegio de Postgraduados, Secretaría de Desarrollo Rural del Gobierno del Estado de Puebla, Altres Costa, AMIC: Texcoco, Mexico, 2008; p. 283. ISBN 978-968-839-539-4. [Google Scholar]
- Comisión para la Sanidad Vegetal del Estado de Puebla. Situación Actual del Programa. 2017. Available online: http://www.cesavep.org/campanias/Pia/pia_sit_act.html (accessed on 23 April 2017).
- Comisión para la Sanidad Vegetal del Estado de Puebla. 2015. Available online: https://www.gob.mx/senasica/acciones-y-programas/acciones-estrategicas-de-sanidad-vegetal (accessed on 23 April 2017).
- Official Journal of the Federal Government of Mexico. Federal Expenses Budget Approved for 2015. 2014. Available online: http://www.dof.gob.mx/nota_detalle.php?codigo=5374053&fecha=03/12/2014 (accessed on 12 November 2015).
- Secretaría de Hacienda y Crédito Público. Presupuesto de Egresos de la Federación 2017. Versión Ciudadana. Secretaría de Hacienda y Crédito Público, 2017. Available online: http://www.secretariadoejecutivo.gob.mx/docs/pdfs/normateca/Presupuestos/Presupuesto%20de%20Egresos%20de%20la%20Federaci%C3%B3n%20para%20el%20Ejercicio%20Fiscal%202017.pdf (accessed on 15 January 2018).
- Villa, M. ¿Qué hacemos con el campo? 2nd ed.; Mundi-Prensa: Texcoco, México, 2011; p. 433. ISBN 9786077533696. [Google Scholar]
- Secretaría de Agricultura, Ganadería, Desarrollo Rural, Pesca y Alimentación. 5th SAGARPA Activities Report (2016–2017). 2017. Available online: https://www.gob.mx/cms/uploads/attachment/file/255710/5TO_INFORME_2017_web.pdf (accessed on 20 January 2017).
- Secretaría de Economía. Estadísticas de Comercio Exterior de México. Subsecretaría de Comercio Exterior. Total Exportaciones e Importaciones. 2016. Available online: http://www.gob.mx/cms/uploads/attachment/file/81863/Acum-Exporta.pdf (accessed on 11 March 2016).
- Avendaño, B.; Varela, R. La adopción de estándares en el sector hortícola de Baja California. Estudios Fronterizos 2010, 11, 171–202. [Google Scholar]
- Salles de Almeida, J. “Normas privadas”: El nuevo desafío para las exportaciones de los países en desarrollo. Comisión Económica para América Latina, Naciones Unidas. 2008. Available online: http://repositorio.cepal.org/bitstream/handle/11362/4430/S0800046_es.pdf?sequence=1 (accessed on 23 November 2015).
- The Codex Alimentarius. Available online: http://www.fao.org/fao-who-codexalimentarius/about-codex/en/#c453333 (accessed on 19 November 2017).
- Food Safety Modernization Act. 2017. Available online: https://www.gob.mx/sagarpa/prensa/capacitacion-en-ley-de-inocuidad-de-estados-unidos-beneficiara-a-productores-mexicanos (accessed on 23 January 2017).
- Secretaría de Economía. Catálogo Mexicano de Normas. 2018. Available online: https://www.sinec.gob.mx/SINEC/ (accessed on 8 October 2018).
- Comisión Federal para la Protección Contra Riesgos Sanitarios. Proceso de Vigilancia Sanitaria. Comisión de Operación Sanitaria, 2018. Available online: https://www.gob.mx/cofepris/acciones-y-programas/proceso-de-de-vigilancia-sanitaria-75408 (accessed on 8 October 2018).
- Consejo Nacional de Evaluación de la Política de Desarrollo Social. Instrumentación de Acciones para mejorar las Sanidades a través de Inspecciones Fitozoosanitarias. Informe de la Evaluación Específica de Desempeño 2012–2013. 2014. Available online: http://www.coneval.org.mx/Informes/Evaluacion/Especificas_Desempeno2012/SAGARPA/8_U002/8_U002_Completo.pdf (accessed on 10 November 2015).
- México Calidad Suprema. México Calidad Suprema, el Sello de los Mexicanos. 2018. Available online: http://www.mexicocalidadsuprema.org/proyectos/ (accessed on 15 October 2018).
- Globalstd.com. (Private third-party auditors). Personal communication, 2018.
- Walmart. Requerimientos de Seguridad Alimentaria para Proveedores de Alimentos Procesados y Productos Agrícolas. 2018. Available online: https://cdn.corporate.walmart.com/b3/f4/3b20e09f44868655259e8bb570fe/manual-seguridad-alimentos-procesados-agricolas.pdf (accessed on 14 February 2018).
- Ramírez-Juárez, J. La agricultura familiar y su contribución a la seguridad alimentaria: Límites y posibilidades. In Ciencia, Tecnología e Innovación en el Sistema Agroalimentario de México; Martínez-Carrera, D., Ramírez- Juárez, J., Eds.; Biblioteca Básica de Agricultura: Guadalajara, México, 2016; p. 856. ISBN 978-607-715-314-6. [Google Scholar]
- Muñoz-Rodríguez, M.; Santoyo-Cortés, V.H.; Gómez-Pérez, D.; y Altamirano-Cárdenas, J.R. Otro campo es possible. In Agenda Pública y Política con Relación al Campo Mexicano; Universidad Autónoma Chapingo: Texcoco, México, 2018; p. 121. [Google Scholar]
- Consejo Nacional de Evaluación de la Política de Desarrollo Social en México 2012. 2012. Available online: https://www.coneval.org.mx/informes/evaluacion/iepds2012/pages-iepdsmex2012-12nov-vfinal_lowres6.pdf (accessed on 14 October 2018).
- Instituto Nacional de Estadística y Geografía (INEGI). Encuesta Nacional de Ocupación y Empleo. Tasa de Informalidad Laboral. Indicadores Estratégicos. Primer Trimestre. 2018. Available online: http://www.beta.inegi.org.mx/app/buscador/default.html?q=tasa+de+informalidad#tabMCcollapse-Indicadores (accessed on 9 August 2018).
- United States Department of Agriculture. Economic Research Service. Budget Shares for Broad Aggregates and Conditional Budget Shares for Food Categories 2005. Available online: http://ers.usda.gov/data-products/international-food-consumption-patterns.aspx#26207 (accessed on 3 October 2015).
- Case, K.E.; Fair, R.C. Principios de Microeconomía, 4th ed.; Prentice Hall: Mexico City, México, 1995; p. 620. ISBN 0-13-440918-3. [Google Scholar]
- Organisation for Economic Co-Operation and Development. Health at a Glance 2017: OECD Indicators; OECD Publishing: Paris, France, 2017. Available online: https://www.health.gov.il/publicationsfiles/healthataglance2017.pdf (accessed on 26 September 2018).
- Secretaría de Salud. Estrategia Nacional para la Prevención y el Control del Sobrepeso, la Obesidad y la Diabetes. 2013. Available online: https://www.gob.mx/cms/uploads/attachment/file/348803/Estrategia_con_portada.pdf (accessed on 20 January 2018).
- Hoffmann, S.; Anekwe, T.D. Making Sense of Recent Cost-of-Foodborne-Illness Estimates. United States Department of Agriculture, 2013. Available online: https://www.ers.usda.gov/webdocs/publications/43796/40344_eib118.pdf?v=0 (accessed on 2 October 2018).
- Mayett- Moreno, Y.; Sabogal-Salamanca, M.; Popp, J.S.; Crandall, P.; Arvizu-Barrón, E. Is Food Safety a Real Concern in Mexico and Colombia? A Preliminary Report among Small Producers, Retailers and Consumers. Dev. Policy Rev. 2017, 36, O880–O896. [Google Scholar] [CrossRef]
- Kuchler, F. How Much Does It Matter How Sick You Get? Consumers’ Responses to Foodborne Disease Outbreaks of Different Severities. 2015. Available online: https://www.ers.usda.gov/webdocs/publications/45419/53640_err193.pdf?v=42243 (accessed on 2 October 2018).
- Hernández, R.; Fernández- Collado, C.; Baptista, P. Metodología de la investigación, 6th ed.; Mc Graw Hill: Mexico City, México, 2014; p. 632. ISBN 978-1456223960. [Google Scholar]
- Central de Abasto de la Ciudad de México. Available online: https://uneabasto.com/informacion-de-central-de-abastos.htm (accessed on 8 September 2018).
- Sistema Nacional de Información e Integración de Mercados. Secretaría de Economía. Available online: http://www.economia-sniim.gob.mx/nuevo/ (accessed on 26 September 2018).
- Instituto Nacional de Estadística y Geografía. Directorio Estadístico Nacional de Unidades Económicas. 2018. Available online: http://www.beta.inegi.org.mx/app/mapa/denue/ (accessed on 26 September 2018).
- Instituto Nacional de Estadística y Geografía. Censos Económicos 2014. La Industria Restaurantera en México. 2016. Available online: http://www.beta.inegi.org.mx/app/biblioteca/ficha.html?upc=702825080334 (accessed on 28 September 2018).
- Secretaría de Desarrollo Económico. Ciudad de México. Listado de Mercados Públicos. 2015. Available online: http://www.sedecodf.gob.mx/archivos/Menu_Horizontal/2015/InformacionRelevante/Listado_de_Mercados_Publicos.pdf (accessed on 28 September 2018).
- Asociación Nacional de Tiendas de Autoservicio y Departamentales. 2018. Available online: https://antad.net/ (accessed on 12 October 2018).
- Instituto Nacional de Estadística y Geografía. Encuesta Nacional de Ingresos y Gastos de los Hogares. 2010. Available online: http://www3.inegi.org.mx/rnm/index.php/catalog/36 (accessed on 4 September 2015).
- Servicio Nacional de Sanidad, Inocuidad y Calidad Agroalimentaria (SENASICA). Directorio de Empresas y áreas Reconocidas 08/10/2018. Available online: https://www.gob.mx/cms/uploads/attachment/file/405446/DIRECTORIO_EMPRESAS_Y_AREAS_al_17_de_octubre_2018.pdf (accessed on 15 October 2018).
- Atlas Agroalimentario. Servicio de Información Agroalimentaria y Pesquera (SIAP). 2018. Available online: https://nube.siap.gob.mx/gobmx_publicaciones_siap/pag/2018/Atlas-Agroalimentario-2018 (accessed on 12 October 2018).
- Ciudad de México CDMX-SEDECO. Cuadro Comparativo de Precios de Productos Básicos Correspondientes a la 2da y 3era Semana de Octubre. 2018. Available online: https://www.sedeco.cdmx.gob.mx/storage/app/media/Canasta%20Basica/Seguimiento%20Diario/2018/Octubre/Comparativo%20tercera%20semana%20de%20octubre%202018.pdf (accessed on 24 October 2018).
- Lee, J.; Gereffi, G.; Beauvais, J. Global value chains and agrifood standards: Challenges and possibilities for smallholders in developing countries. Proc. Natl. Acad. Sci. USA 2012, 109, 12326–12331. [Google Scholar] [CrossRef] [PubMed]
- Avendaño, B.; Schwentesius, R.; Lugo, S. El impacto de la Iniciativa de Inocuidad Alimentaria de Estados Unidos en las Exportaciones de Hortalizas Frescas del Noroeste de México. Región y Sociedad, 2006. Available online: http://www.redalyc.org/articulo.oa?id=10203601 (accessed on 3 November 2015).
- IPAAGRO-LUUM. (Private third-party auditors). Personal communication, 2018.
- Herbert, M.; Mora, J.S.; Martínez, M.A.; García-Mata, R. Impacto económico de la Ley Federal de Sanidad Vegetal en el Mercado Mexicano de Limón Persa. Revista Mexicana de Ciencias Agrícolas 2010, 1, 321–333. [Google Scholar]
- Arvizu, E.; Mayett-Moreno, Y.; Martínez-Flores, J.L.; Olivares-Benítez, E.; Flores-Miranda, L. Análisis de producción y comercialización hortícola del Estado de Puebla: Un enfoque de cadena de valor. Revista Mexicana de Ciencias Agrícolas 2015, 6, 779–792. [Google Scholar] [CrossRef]
- Neal, J.A.; O’Bryan, C.A.; Crandall, P.G. Preventing Post-Processing Contamination in a Food Nugget Processing Line When Language Barriers Exist. Agric. Food Anal. Bacteriol. 2014, 4, 20–26. [Google Scholar]
- Coslovsky, S. Enforcing Food Quality and Safety Standards in Brazil: The Case of COBRACANA. Ann. Am. Acad. Political Soc. Sci. 2013, 649, 122–138. [Google Scholar] [CrossRef]
- Pérez- Alemán, P. Global standards and local knowledge building: Upgrading small producers in developing countries. Proc. Natl. Acad. Sci. USA 2012, 109, 12344–12349. [Google Scholar] [CrossRef] [PubMed]
- Post, D.L. Standards and Regulatory Capitalism: The diffusion of Food Safety Standards in Developing Countries. Ann. Am. Acad. Political Soc. Sci. 2005, 598, 168–183. [Google Scholar] [CrossRef]
- Food and Agriculture Organization of the United Nations. Food Chain Crisis Early Warning Bulletin. 2018. Available online: http://faostat.fao.org/site/339/default.aspx (accessed on 29 August 2018).
- Lugo-Morín, D.R.; Ramírez-Juárez, J.; Méndez-Espinoza, J.A.; Peña-Olvera, B. Asymmetric social networks in the horticultural system in the Tepeaca Valley, Mexico. Economía Sociedad y Territorio 2010, 10, 207–230. [Google Scholar]
- Procuraduría Federal del Consumidor. Survey Regards Places Where Households Buy Their Groceries. 2014. Available online: http://www.profeco.gob.mx/encuesta/mirador/2014/Encuesta_sobre_lugares_de_compra.pdf (accessed on 5 December 2014).
- Mayett, Y.; Martínez-Carrera, M. Estrategias para promover el consumo de hongos comestibles en México, con base en sus propiedades funcionales y medicinales. In Ciencia, Tecnología e Innovación en el Sistema Agroalimentario de México; Martínez-Carrera, D., Ramírez- Juárez, J., Eds.; Biblioteca Básica de Agricultura: Guadalajara, México, 2016; p. 856. ISBN 978-607-715-314-6. [Google Scholar]
- Norma Oficial Mexicana NOM-251-SSA1-2009. Gobierno Federal. Available online: http://dof.gob.mx/nota_detalle.php?codigo=5133449&fecha=01/03/2010 (accessed on 20 January 2018).
- Secretaria de Salud. 5to. Informe de Labores 2016–2017. Gobierno Federal, 2017. Available online: https://www.gob.mx/cms/uploads/attachment/file/254434/5to_IL_SS.pdf (accessed on 20 January 2018).
- Secretaría de Turismo. México, Sexto Lugar del Ranking Mundial en Arribo de Turistas Internacionales, confirma OMT. 2018. Available online: https://www.gob.mx/sectur/prensa/mexico-sexto-lugar-del-ranking-mundial-en-arribo-de-turistas-internacionales-confirma-omt (accessed on 30 August, 2018).
- Secretaría de Turismo. Distintivo H. Available online: http://www.sectur.gob.mx/gobmx/tramites-y-servicios/certificacion-turistica/distintivo-h/ (accessed on 12 October 2018).
- Secretaría de Agricultura, Ganadería, Desarrollo Rural, Pesca y Alimentación; Secretaría de Desarrollo Social; Instituto Nacional de Salud Pública; Food and Agriculture Organization of the United Nations. Panorama de la Seguridad Alimentaria y Nutricional en México. 2012. Available online: http://www.colpos.mx/wb_pdf/Panorama_Seguridad_Alimentaria.pdf (accessed on 12 April 2015).
- Secretaría de Hacienda y Crédito Público. Presupuesto de Egresos de la Federación 2015. Versión Ciudadana. Secretaría de Hacienda y Crédito Público, 2015. Available online: http://www.transparenciapresupuestaria.gob.mx/work/models/PTP/Home/Ultimas_Publicaciones/PEF_ciudadano_2015.pdf (accessed on 12 November 2015).
- Secretaría de Agricultura, Ganadería, Desarrollo Rural, Pesca y Alimentación. 2nd SAGARPA Activities Report (2013–2014). 2014. Available online: http://www.sagarpa.gob.mx/Transparencia/Informes/SEGUNDO_INFORME_DE_LABORES_2013_%202014_SAGARPA.pdf (accessed on 16 November 2015).
- Pérez- Alemán, P. Collective Learning in global diffusion: Spreading quality standards in a developing country cluster. Organ. Sci. 2011, 22, 173–189. [Google Scholar] [CrossRef]
- Henson, S.; Jaffee, S. Standards and Agro-Food Exports from Developing Countries: Rebalancing the Debate. World Bank Policy. Research Working Paper 3348. 2004. Available online: http://elibrary.worldbank.org/doi/abs/10.1596/1813-9450-3348 (accessed on 13November 2015).
- Henson, S.; Jaffee, S. Understanding Developing Country Strategic Responses to the Enhancement of Food Safety Standards. World Econ. 2008, 31, 548–568. [Google Scholar] [CrossRef]
- Donovan, J.A.; Caswell, J.; Salay, E. The Effect of Stricter Foreign Regulations on Food Safety Levels in Developing Countries: A Study of Brazil. Rev. Agric. Econ. 2001, 23, 163–175. [Google Scholar] [CrossRef]
- Anusuya, E.; Bihn, A.; Gravani, R.B.; Scott, D.L.; Pritts, M.P. Food Safety Begins on the Farm. A Grower’s Guide. Good Agricultural Practices for Fruits and Vegetables. Cornell Good Agricultural Practices Program. 2000. Available online: https://ecommons.cornell.edu/handle/1813/2209 (accessed on 8 October 2018).
- United Nations. Sustainable Development Goals. 17 Goals to Transform Our World. 2016. Available online: https://www.un.org/sustainabledevelopment/sustainable-development-goals/ (accessed on 18 November 2017).

| REUs Type | Contact with Market a/Destination of the Production | % REUs (n = 5.32 million) | Cultivated Hectares | Assets Value (Thousand USD) | Access to Credit Per REU (%) | Estimated Cash Income (Annual) USD |
|---|---|---|---|---|---|---|
| E1 Subsistence family farms | None/self-consumption | 22.4 | 3.5 | 0.23 | No access | <869.1 |
| E2 Subsistence family farms with access to markets | Limited/self-consumption and national market | 50.6 | 8.8 | 2.35 | 2.7 | 869.1 |
| E3 Transition | Occasional/national market | 8.3 | 32.3 | 8.23 | 7.8 | 3989.9 |
| E4 Weak profit | 95% a/national market | 9.9 | 37.5 | 14.11 | 13.1 | 7771.4 |
| E5 Young entrepreneurs | 100% a/national market | 8.4 | 141.4 | 44.11 | 44.5 | 28,773.7 |
| E6 Dynamic entrepreneurs | 100% a/national & international market | 0.3 | 297.6 | 285.11 | 50.5 | >28,773.7 |
| Total | 100 | 521.1 | 364.95 |
| FAO’s Criteria | All People | All Time | Access Sufficient (Quantity) | Quality | Healthy Life | Output in Society | |||||
|---|---|---|---|---|---|---|---|---|---|---|---|
| Physical | Social (Culture) | Economic | Safe | Nutritious | Dietary Needs | ||||||
| Different scenarios | |||||||||||
| Street food and uncertified food | Yes | Yes | Yes | Yes | Yes | No | Some | Some | No | Food illnesses in all agents along the food chain (infectious, bacteria); loss of income; poverty. | |
| Junk food | Yes | Yes | Yes | No | Yes | Yes | No | No | No | Food illnesses (overweight; obesity, diabetes, cancer); loss of income; poverty. | |
| Organic food | No | No | No | Some | No | Yes | Yes | No | Yes | Feasible to produce only by 8.7% of all REU’s. Export oriented. Economically feasible for only 7.2% of consumers. | |
| Activity through the Agri-Food Chain (n = 7) | Region (n = 2) | Number of Interviews Gathered (n = 8) | Primary Communication Method (Interviews) (n = 3) | Questions Asked |
|---|---|---|---|---|
| Wholesaler main office | Mexico City and Puebla City | 2 | Telephone | Are wholesalers certified in any type of standards? |
| Traditional Markets main office front desk | Mexico City | 1 | Telephone | Are public markets and street markets certified in any type of standards? |
| SENASICA coordinator | Mexico City | 1 | Personal and e-mail | 1. Which are the main federal agencies in charge of food certifications? 2. Which are private and which are federal? 3. How does SENASICA help certify all producers? |
| Ministry of Health and License Office | Puebla City | 1 | Personal | 1. How many restaurants are certified? 2. How often do restaurants have to renew their food service’ license? 3. How many restaurants attended the NOM251-SSA1-2009 lecture? 4. Why does not the Ministry of Health ask informal restaurants and street vendors to attend the NOM’s standard? |
| Ministry of Health trainer | Puebla City | 1 | Personal | Why the Ministry of Health does not ask informal restaurants and street vendors to adopt that NOM’s lecture? |
| Private third-party auditor (IL) | Puebla City | 1 | Personal and telephone | 1. What type of certifications or support do you offer? 2. How much do those certification cost? 3. What are the requirements? 4. If there is a special amount of federal budget for agriculture education, small producers’ support, marketing strategies, productivity, competitiveness subsectors, how is this support linked with those in food safety food and SENASICA? 5. What category of producers are those reported by SENASICA as having certifications in the 2018 database? 6. What happens regard food standards in wholesalers, public and street markets? |
| Private third-party auditor (GL) | Mexico City | 1 | Personal and e-mail | 1. What type of certifications do they recommend to be adopted to sell fresh fruits and vegetables food in supermarkets? 2. How much do those certification cost? 3. What are the requirements? 4. How long does the license last? |
| Director of the Agronomy School at a private University | Puebla City | 1 | Personal | 1. Which are the main federal agencies in charge of food certifications? 2. Which ones are private and which are federal? 3. Which agents from the agri-food chain do you think are certified? |
| Answers by Type of Interviewee |
|---|
| A National Service for Disease Control, Safety and Agri-food Quality (SENASICA) State coordinator. |
| 1. The main federal agencies in charge of food certifications are the Ministry of Agriculture, Cattle, Fisheries, Rural Development and Feeding Affairs (SAGARPA) and SENASICA. 2. There are private and public certifications; in the former we have Primus, SQF, Mexico Good Agricultural Practices (GAP), Mexico Calidad Suprema (MCS) which is half private and non-profit. Federal certifications are mainly on Hazard Analysis Critical Control Point (HACCP) which is considered the most important one and synonymous with safety. Private and public certifications are voluntary and producers adopt them when buyers (domestic or international) ask for them. 3. SENASICA helps certificate REUs in the third phase of that. First producers must ask their local or regional Safety Committee (as is the case of CESAVEP), to make a supervision through a technician; then comes a set of different inspections, and after everything is settled, SENASICA gives the certification. |
| Private third-party auditor (IL). |
| 1. Their companies trains E3–E6 REUs, with third party auditors “in field and packaging” certifications, because SENASICA has few trainers in the State of Puebla (only from 8 to 10). 2. The general introduction cost 105 USD, and the third-party auditor cost 290 USD, both per person. 3. Requirements are: producers should be organized and legally registered. 4. The difference between the safety efforts from SENASICA and those from the agriculture education, small producers support, Shared Risk Committee (FIRCO), extension and the Marketing and Development Agricultural Markets Agency Services (ASERCA) activities are that the latest are centered in increasing productivity, competitiveness, value added and economic benefits. Nevertheless, they do not adopt certifications because they are costly, and that would increase their food costs; at the same time, it is not required by any agent along the food chain (wholesalers, intermediaries and retailers). Only when some of their buyers (supermarkets or export companies), are interested in their products, do they adopt safety standards. 5. Those hectares certified in the 2018 report of SENASICA-SAGARPA, are from organized producers who have in mind selling their products to supermarkets, exports or specific buyers interested in safety quality and standards. 6. Regarding food standards in wholesalers, traditional and street markets, they are not certified. Those REUs certified use their own means to deliver this food directly to supermarkets, or special restaurants using their own transport (and other infrastructure to keep it safe, as fridges, warehouses, and food techniques); as most of them are organized and share infrastructure, they can avoid those wholesalers, intermediaries and retailers. If some brokers are interested in certified food, they buy their product in their farms, and distribute or export it. |
| Private third-party auditor (GL). |
| 1. To sell fresh fruits and vegetables food in supermarkets they recommend Primus GFS (an American certification) which is a basic certification, compared to Global Gap and SQF that are more difficult to interpret. 2. The costs for certifications are: 900 USD for field inspections; 450 USD for harvest groups; 1500 USD in packaging. Prices plus taxes and stipends according each inspection needed, before given the final certification. 3. Requirements: first they need a diagnosis through a technician, and a set of three or four sessions before being certified. Additionally, they must have been legally registered. 4. The certification is issued annually, and if all the process and inspections were successful, they give you the certification in 45 days. |
| Director of the Agronomy School. |
| 1. The main federal agencies in charge of food certifications are SAGARPA and SENASICA. 2. There are private and public certifications; in the former we have Primus, SQF, Mexico GAP, MCS which is half private and a Civil Association. Federal certifications are mainly HACCP which is considered the most important one and synonymous of safety. Private and public certifications are voluntary and producers. 3. Some E4 REUs are certified, but mainly E5 and E6 REUs adopt those standards, when buyers (intermediaries, retailers, domestic or international) ask for and can afford them. |
| Wholesaler main office/front desk. |
| Efforts to certify wholesalers depend on the municipalities, and state food policies and budgets; the bigger the municipality, the more resources to certify some of their wholesalers’ partners; but this is not mandatory. |
| Traditional markets and street markets’ main office (n = 2). |
| Traditional markets and street markets are not certified. It is very difficult to certify all of them as they are too many people involved. |
| Ministry of Health License Office’s. |
| 1. Does not know how many restaurants are certified. 2. The commercial license is issued only once during the restaurant’s life, but restaurant owners must assist yearly to re-new the health seal and attend the NOM-251-SSA1-2009 lecture. 3. Approximately 190 restaurants take the NOM-251-SSA1-2009 lecture weekly (9500 yearly, considering only working weeks). 4. The Ministry of Health does not ask informal restaurants and street vendors to adopt that NOM, because that is not their duty. Inspections are in three areas (one for food, one for drugs, one for hospitals); for food supervision in Puebla City (2.5 million people, and 11,843 formal restaurants) they have few inspectors and scarce resources, and they supervise registered restaurants randomly or due to any complaint. Even if they can take samples from informal or street food vendors, they cannot punish them because they assume the Ministry of Economy and Commerce has given them a “permission to operate”, or if not, they cannot intervene or punish them. Additionally, even when they take samples and street food has pathogens, they move to different locations daily, so they become hard to trace. |
| Ministry of Health trainer. |
| The Ministry of Health does not ask informal restaurants and street vendors to adopt the NOM, or report them when they sell contaminated food, because they are only 10 trainers in the whole City of Puebla and it is impossible to reach all street food vendors. If the Ministry of Economy and Commerce has given them “permission to operate” or not, it is that agency’s responsibility. |
| Avocado | Mango | Tomato | Lemon | Chili | Beans | Tortilla (Corn) | Rice | Wheat (Piece of Bread) | |
|---|---|---|---|---|---|---|---|---|---|
| Number of certifications 1,2 per product | 10,346 | 1182 | 605 | 374 | 345 | None | 29 | None | None |
| Total of certifications per product as percentage 1 (n = 125) | 71.7 | 8.2 | 4.2 | 2.6 | 2.4 | None | 0.2 | None | None |
| Certified hectares 1 | 4177.0 | 983 | 279.0 | 192.0 | 259.0 | None | 577.82 | None | None |
| Main production region 1,2 | West | West | North and Center | West and Southeast | North and Center | Northwest and South | Center | West, East and South | North, West and Center |
| Worldwide exporter place 2 | 1 | Na | 1 | 1 | 1 | na | na | na | na |
| Worldwide producer place 2 | 1 | 4 | 10 | 2 | 2 | 7 | 5 | 59 | 29 |
| Per capita consumption in Mexico 2 (kg) | 8 | 12.4 | 15.2 | 14.5 | 18.1 | 10.2 | 336.6 | 10.3 | 64.0 |
| Price to consumer in supermarkets (USD/kg) 4 | 3.3 | 1.6 | 1.4 | 1.3 | 1.5 | 1.6 | 0.6 | 1.3 | 0.1 |
| Balance of trade 2 (million ton) | 5.2 | 042 | 8.3 | 3.8 | 5.5 | −0.39 | −72.6 | −5.7 | −23.1 |
| Agents along the Agri-Food Chain | Results | Actions | |||||
|---|---|---|---|---|---|---|---|
| Producers | Wholesalers | Intermediaries | Retailers | Processors/Restaurants | |||
| All agents have/know certifications | Yes | Yes | Yes | Yes | Yes | Food safety, health, well-being. Economic and social benefits. | Enhance to continue. |
| Some agents have/know certifications (Mexico’s case) | Yes = 0.7% | Yes Unknown | Yes Unknown | Yes = 12.5% | Yes = 42.8% | Efforts done to improve health through certifications for few agents, become in losses for the whole chain. | Increase budget to train and adopt inspections to specific actors of the food chain. Educate the consumer. |
| No = 99.3% | No, Unknown | No, Unknown | No = 87.5% | No = 57.2% | |||
| Other possible scenarios | No | Yes | No | No | Yes | ||
| Yes | No | Yes | Yes | No | |||
| Yes | Yes | Yes | Yes | Yes | |||
| No one have certifications | No | No | No | No | No | High level of risk in health’s people. Economic and social consequences. | Immediate federal actions on public policies and food policies. |
© 2018 by the authors. Licensee MDPI, Basel, Switzerland. This article is an open access article distributed under the terms and conditions of the Creative Commons Attribution (CC BY) license (http://creativecommons.org/licenses/by/4.0/).
Share and Cite
Mayett-Moreno, Y.; López Oglesby, J.M. Beyond Food Security: Challenges in Food Safety Policies and Governance along a Heterogeneous Agri-Food Chain and Its Effects on Health Measures and Sustainable Development in Mexico. Sustainability 2018, 10, 4755. https://doi.org/10.3390/su10124755
Mayett-Moreno Y, López Oglesby JM. Beyond Food Security: Challenges in Food Safety Policies and Governance along a Heterogeneous Agri-Food Chain and Its Effects on Health Measures and Sustainable Development in Mexico. Sustainability. 2018; 10(12):4755. https://doi.org/10.3390/su10124755
Chicago/Turabian StyleMayett-Moreno, Yesica, and Juan Manuel López Oglesby. 2018. "Beyond Food Security: Challenges in Food Safety Policies and Governance along a Heterogeneous Agri-Food Chain and Its Effects on Health Measures and Sustainable Development in Mexico" Sustainability 10, no. 12: 4755. https://doi.org/10.3390/su10124755
APA StyleMayett-Moreno, Y., & López Oglesby, J. M. (2018). Beyond Food Security: Challenges in Food Safety Policies and Governance along a Heterogeneous Agri-Food Chain and Its Effects on Health Measures and Sustainable Development in Mexico. Sustainability, 10(12), 4755. https://doi.org/10.3390/su10124755