Article

China’s Outward FDI in Indonesia: Spatial Patterns and Determinants

1
The School of Geography, Nanjing Normal University, Nanjing 210023, China
2
The Jiangsu Center for Collaborative Innovation in Geographical Information Resource Development and Application, Nanjing 210023, China
3
The Inspectorate Banjar City Government, Banjar 46311, Indonesia
*
Author to whom correspondence should be addressed.
Sustainability 2018, 10(12), 4632; https://doi.org/10.3390/su10124632
Submission received: 15 November 2018 / Revised: 29 November 2018 / Accepted: 1 December 2018 / Published: 6 December 2018

Abstract

:
China has gradually become an important world investor with the implementations of its “Going Global” and “Belt and Road” strategy initiatives. Indonesia is the world’s largest archipelagic country, and has the largest economy of the ASEAN (Association of Southeast Asian Nations). Therefore, Indonesia is an important node for China’s implementation of its “Belt and Road” initiative. However, the existing research results regarding China’s OFDI (Outward Foreign Direct Investment) in Indonesia have indicated that little focus has been placed on the distribution patterns and determinants at the provincial levels. In this study, spatial analysis and mathematical statistics methods were used to analyze the temporal and spatial pattern evolution characteristics of China’s OFDI in Indonesia for the period ranging from 2006 to 2016. Also, the mechanism of the pattern evolution was quantitatively identified. The results obtained in this research study indicated the following: (1) China’s OFDI in Indonesia was observed to be characterized by fluctuations in investment amounts and rising numbers of investment projects, also, the investment amounts and number of projects were spatially dispersed; (2) the overall spatial evolution of China’s OFDI in Indonesia was found to be characterized by certain patterns, such as “west higher than the east, and south higher than the north” patterns. Moreover, the direction of the investment gravity center was determined to be obviously distinct during different periods; (3) high-level investments were found to be focused in only a few provinces, meanwhile, the majority of the provinces continued to be in a low-level stable state of investment from China; (4) this study’s OLS (Ordinary Least Square) regression and step-wise regression models revealed that institutional factors, political relations, and human resources were the most important factors which had affected China’s OFDI in Indonesia during the study period.

1. Introduction

The Ministry of Commerce of the People’s Republic of China defines China’s Outward Foreign Direct Investment (OFDI) as economic activities in which Chinese companies or groups invest in foreign countries, Hong Kong, Macao, and Taiwan. These investments may take the form of cash, real products, intangible assets, and so on. Also, the OFDI regards controlling the operation and management rights of these foreign (overseas) enterprises as the core [1]. In 2000, China first proposed a “going global strategy”. In 2006, China’s eleventh five-year plan fully reflected the “going global strategy”. In 2013, Chinese General Secretary Xi Jinping proposed the programs of the “Silk Road Economic Belt” and the “21st-Century Maritime Silk Road”, respectively. In 2015, China promulgated the “Vision and Action to Promote the Construction of the Silk Road Economic Belt and the 21st Century Maritime Silk Road”. Under this context, Chinese enterprises actively responded to the strategy of the state and launched investment activities abroad. Both domestic and foreign markets and resources were used to launch Chinese products and services to the world. By the end of 2017, China’s OFDI stock totaled 18,000 billion dollars, which was considered the second highest ranking in the world [2].
The motives and the purpose of the “Belt and Road” initiatives reduced the resource-seeking motivation and boosted the market-seeking motivation of China’s OFDI [3]. Promoting economic integration in a large geographical coverage and economic size through the “Belt and Road” has emerged an important new economic point of view and it also contributes to the development of the world [4]. Since the implementation of this policy by the Chinese government, the OFDI in the Belt and Road region has increased significantly, and among these regions, the ten countries of ASEAN (Association South East Asian Nation) attract more than fifty percent of the OFDI stock of the total Chinese investment [5]. Before the “Belt and Road” initiatives were launched by the year of 2013, the ASEAN countries had already become a target for China and other developed countries to invest, where most of the capital is invested in the services sector (finance, real estate and trade) and in manufacturing [6].
Indonesia is the world’s largest archipelagic country, and has the largest economy of the ASEAN. Therefore, Indonesia is an important node for China’s implementation of its “Belt and Road” initiative. Furthermore, Indonesia is prospected as one of the top four of multinational enterprises (MNEs) host economies country for 2017–2019 [7]. Natural resources are very varied, the potential of the market with a large population, fairly competitive labor costs, bureaucratic reforms are constantly echoed by the government. Moreover, a higher level of openness has increased the attractiveness of foreign investment in Indonesia [8]. Until 2030 Indonesia has three major challenges, such as labor productivity, the uneven economic growth distribution, and the infrastructure bottlenecks [9].
Indonesia’s ambition to become the “Global Maritime Fulcrum” will be in line with the interests of the “Belt and Road” program, which has both direct and indirect implications and impacts on economic interests between China and Indonesia [10]. In fact, Chinese investments are mostly in the maritime silk road countries [3]. Leitao discovered that there is a positive correlation between FDI (Foreign Direct Investment) and bilateral trade promoting the economic growth in host countries [11]. In different research Najaf and Ye explain that in the short term there is no relation between FDI and economic growth, but in the long term there is a little value FDI influence to GDP [12].
The “Belt and Road” policy invited many researchers to conduct research in China’s OFDI, regarding the trend, impact, determinant, and so on. However, very limited study has been conducted to understand the spatial and determinants of Chinese investment in Indonesia as one of the key countries of the “21st-Century silk maritime road” program. This paper was developed to fill the gap of the information about the spatiotemporal distribution of Chinese investment spread across all of the Indonesian provinces, and the determinant factors influencing Chinese investment location choices. Furthermore, some scholars have studied FDI in Indonesia with firm as research units. In this study, based on the Indonesian provinces, the temporal and spatial evolution of China’s OFDI in Indonesia, along with the influencing factors, were explored in order to provide certain references for Chinese enterprises to invest in Indonesia. In addition, the goal of this study was to provide some guidance and potential applications for China’s OFDI policies in the context of the “Belt and Road” strategy initiative.

2. Literature Review

The key factors of FDI theory has been discussed in previous research such as Dunning’s theory which holds owner-specific advantages, international-specific advantages and location advantage as sufficient conditions for multinational enterprises to invest abroad [13]. Dunning’s theory is a key point for many researches conducting FDI in many countries [14,15]. Previous and recent researches have concluded that the agglomeration effects of Chinese investment in host countries are hard to deny, since the motivation and investment layout of Chinese enterprise is influenced by the existence of their fellow enterprises that already established [5,16,17]. Sánchez-Martín et al. [18] summarized three other theories beyond Dunning’s theory. The first is the neoclassical economy, where low capital and labor ratio as a key point the determinant of FDI. The second is the horizontal and vertical approaches which explain different reasons of FDI: resource-seeking activities, local market, and the cheaper factor prices. The last theory is the emergence of risk diversity, where the theory focused on political and economic risk.

2.1. Institutional Factors

Research conducted in Latin America has discovered that the public institution plays an important role in stability policy and influences the decision to attract FDI [18]. Empirical evidence has shown us that the FDI in Indonesia doesn’t spread spatially; infrastructure development in the province area and smaller size of local government institutions have a strong relationship to attracting FDI [19,20]. Kang [21] also concluded in his research that there is negative impact between economic freedom and institutional distance to the FDI. These conditions are different with FDI in developed countries such as in Europe, where strong institutions and an open market become a good combination to attract investment [22]. It is interesting to note that investors from Japan and US are more attracted by low production costs and producing exports factors, while Chinese investors more often invest in provinces for local market factors [17,23].
Demir [24] conducted research by using 134 countries’ data and found that institutional development has less significance to attract the FDI in the north–south or south–south bilateral cooperation countries. Furthermore, in the south–south FDI flow might be harmful to the development of local institutions, particularly in natural resource-rich countries. Uddin’s [25,26] research by using multivariate OLS (Ordinary Least Square) regression in Pakistan found that institutional factors contribute to attracting FDI significantly. Meanwhile in Arab countries institutional quality and country risk are important factors in determining inward FDI [27].

2.2. Political Relations

Analyzed by using Extreme Bound Analysis Chaneriga et al. [28] in their research found that geopolitical determinants have a relationship with inward FDI. Meanwhile, evidence from Pakistan shows that a strong political environment in the host country has a negative effect on attracting FDI [25].
In Tanzania, the Chinese firm successfully spillovers built their legitimacy which was moderated by media, historical ties and the distance between two countries [29]. Some recent researchers have discovered that the political risk does not interfere with the Chinese investors or other investors to invest in the host country [16,21,30,31,32]. This is in contrast with the earlier research that lower political risk attracted more investment while lower financial risk is in the opposite position [33].
A bilateral relationship between the two largest countries in East Asia (China and Indonesia) already has been established since Mao’s China’s former president and Soekarno, the Indonesian former president. However, the cold war contributes significant gap in the term of economic linkages between the two countries [10]. Although in the past the economic relationship between these two countries was not in good condition due to political reasons, since China joined the world trade market, an opportunity was opened to develop an economic relationship and ignore the political problems in the past [34]. Good political relations between the home country and the host country can require less experience before FDI, and can significantly increase the probability of the home country enterprise investing in the host country [35].
Baycan et al. [36] emphasized that international friendship cities have shifted from the “reciprocal stage” of providing communication activities to the “economic stage” of a close business relationship, thus giving multinational enterprises new ownership advantages and reflecting the inter-state political relations influence over OFDI. Wang’s use of the number of sister cities proves that the sister city is conducive to the political interaction between the two cities, building a development platform for direct investment enterprises, providing consulting services, and assisting enterprises to actively explore the market [37].

2.3. Economic Development Level

Existing research results show that various factors play a role in China’s foreign investment layout such as the level of economic development and market of host countries. The host country’s institutional environment constitutes the implementation criteria of social stability and order, and the economic system can fully reflect the economic regulation and rules of a country directly affecting the difficulty of business activities and operating costs. Multinational enterprises entering specific foreign markets must first consider whether they can adapt to their market system [38]. Soumaré [39,40] in his research found that economic growth in North Africa has strong correlation with FDI.
Evidence from Europe shows the Economic Freedom Index, FDI and the component of GDP has a long run relationship [41]. Khaliq and Noy [42] has conducted research into the relationship between FDI and economic growth factors, and showed evidence that except in mining and quarry factors, other factors have a positive correlation. By using the OLS regression model Nurrachmi [43] conducted the causality between FDI inflow and GDP growth in the period of 1970–2010 in Indonesia, and discovered there is a positive causality between FDI and GDP growth.

2.4. Openness Level

Wacker [44] has conducted research about the impact of Multi-National Corporations (MNCs) and their FDI in fifty developing countries, and there is no empirical evidence that MNCs have a negative influence on the export prices ofdeveloping countries. While Morrison [45] in his report about China’s economic rise explained that the level of openness and the degree of investment facilitation area has a significant positive effect on China’s foreign investment. Interesting evidence suggests that FDI has led to a decline of export value in the short term, but in the long run, the value of exports has increased significantly. [46,47]. However, it is still difficult to find research related with FDI from a specific country such as China.

2.5. Human Resources

Human capital of the host country is one of important factors that influences the FDI. One of the evidences is that in China, the availability of human resources and future demography are key factors which influence the decision of foreign investors to invest [48]. As China’s domestic labor costs continue to increase, foreign investment motivated by lower labor costs will gradually increase [49]. By using a number of macro-economic variables, spatially-correlated confounding factors and studying the effect of minimum wage on FDI, Fan et al. [50] concluded the increase of minimum wage in China can account for 32.3% of the increasing OFDI. Empirical evidence has significant correlation that foreign firms in Indonesia pay higher wages for labor compared to local firms, and the existence of more foreign firms in a province has raised the level of wages in a region [51].

3. Data and Research Methods

3.1. Data

This section introduces the dependent variable and six categories of explanatory variables, including investment convenience, human resources, economic development, openness level, institutional factors and political relations. Variable symbol, description, and data sources are shown in Table 1.

3.1.1. Dependent Variable: Investment and Project of China’s OFDI in Indonesia

First, we use the amount of China’s OFDI in Indonesia investment and project data from 2006 to 2016 to explore the time characteristics of China’s OFDI in Indonesia. We also use the above data to calculate the spatial concentration of China’s OFDI in Indonesia by means of the geographic concentration index. Results are shown in Figure 1. Then, in order to reveal the overall spatial evolution characteristics of China’s investment in Indonesia, we use China’s investment data for Indonesia in 2006, 2011 and 2016. The results of the spatial center of gravity analysis are shown in Figure 2, and the results of the geostatistical trend analysis are shown in Figure 3. Moreover, by using 2006, 2011, 2016 time nodes data on investment and projects, we explore the local spatial evolutionary characteristics of China’s OFDI in Indonesia by means of the natural disconnection method. The result is shown in Figure 4.

3.1.2. Explanatory Variable: Influence Factor Variables

Based on the above literature review, this study examines the factors affecting China’s OFDI in Indonesia by applying an OLS regression model and step-wise regression models analysis by using six categories of explanatory variables from 2006–2016. It is worth noting that the time limit for the time dummy variable is 2014, which is the year after Chinese General Secretary Xi Jinping’s “21st Century Maritime Silk Road” initiative in Indonesia (the policy implementation had a lag). The value for 2006–2013 is set to 0, and the value for 2014–2016 is set to 1. Moreover, due to statistical caliber changes which occurred in the statistical data of the Indonesian Statistical Yearbook, the export volumes of each province, as well as the electricity distribution capacities from 2006 to 2010, were not available. Therefore, this study used an unbalanced panel data. The OLS regression model and step-wise regression models result is shown in Table 2 and Table 3.

3.2. Research Methods

This study mainly utilized geography concentration indexing, a spatial center of gravity method, geostatistical analysis methods, and other research methods to explore the degrees of China’s OFDI concentrations in Indonesia, along with the temporal and spatial patterns of the investment. Also, OLS regression and step-wise regression models were used to explore the main factors which affected China’s OFDI in Indonesia during the study period.

3.2.1 Geographic Concentration Indexing Method

The geographical concentration index refers to the degree of concentration of economic activities in geographical spaces, with values ranging from zero to 100. The closer the geographical concentration index is to 100, the higher the agglomeration degree will be. This research study used a geographical concentration index to measure the spatial concentrations of China’s OFDI activities in Indonesia. The formula was as follows:
S = 100 × i = 1 n ( P i P ) 2
where S represents the investment geographic concentration index; P is the amount of investment and the number of projects in all of the provinces; Pi denotes the amount of investment and the number of projects in i province; and n is the number of provinces [37].

3.2.2. Spatial Center of Gravity Migration Model

This study utilized a spatial center of gravity migration model to calculate the spatial distribution of China’s OFDI in Indonesia during different years, and then connected them into lines according to the examined years in order to obtain a track of the center of gravity of each year. In this way, the overall trend of China’s OFDI in Indonesia, and its spatial distribution characteristics in each year were ascertained from a macro perspective [52]. The formula for calculating the center of gravity of each year was as follows:
X = i n m i x i i n m i , Y = i n m i y i i n m i
where X and Y represent the latitude and longitude coordinates of China’s OFDI in Indonesia in each year, respectively; n is the number of provinces during each year; xi and yi indicate the geometric center coordinates of the i provinces of each year; and mi is the total amount of investment in the i province [53].

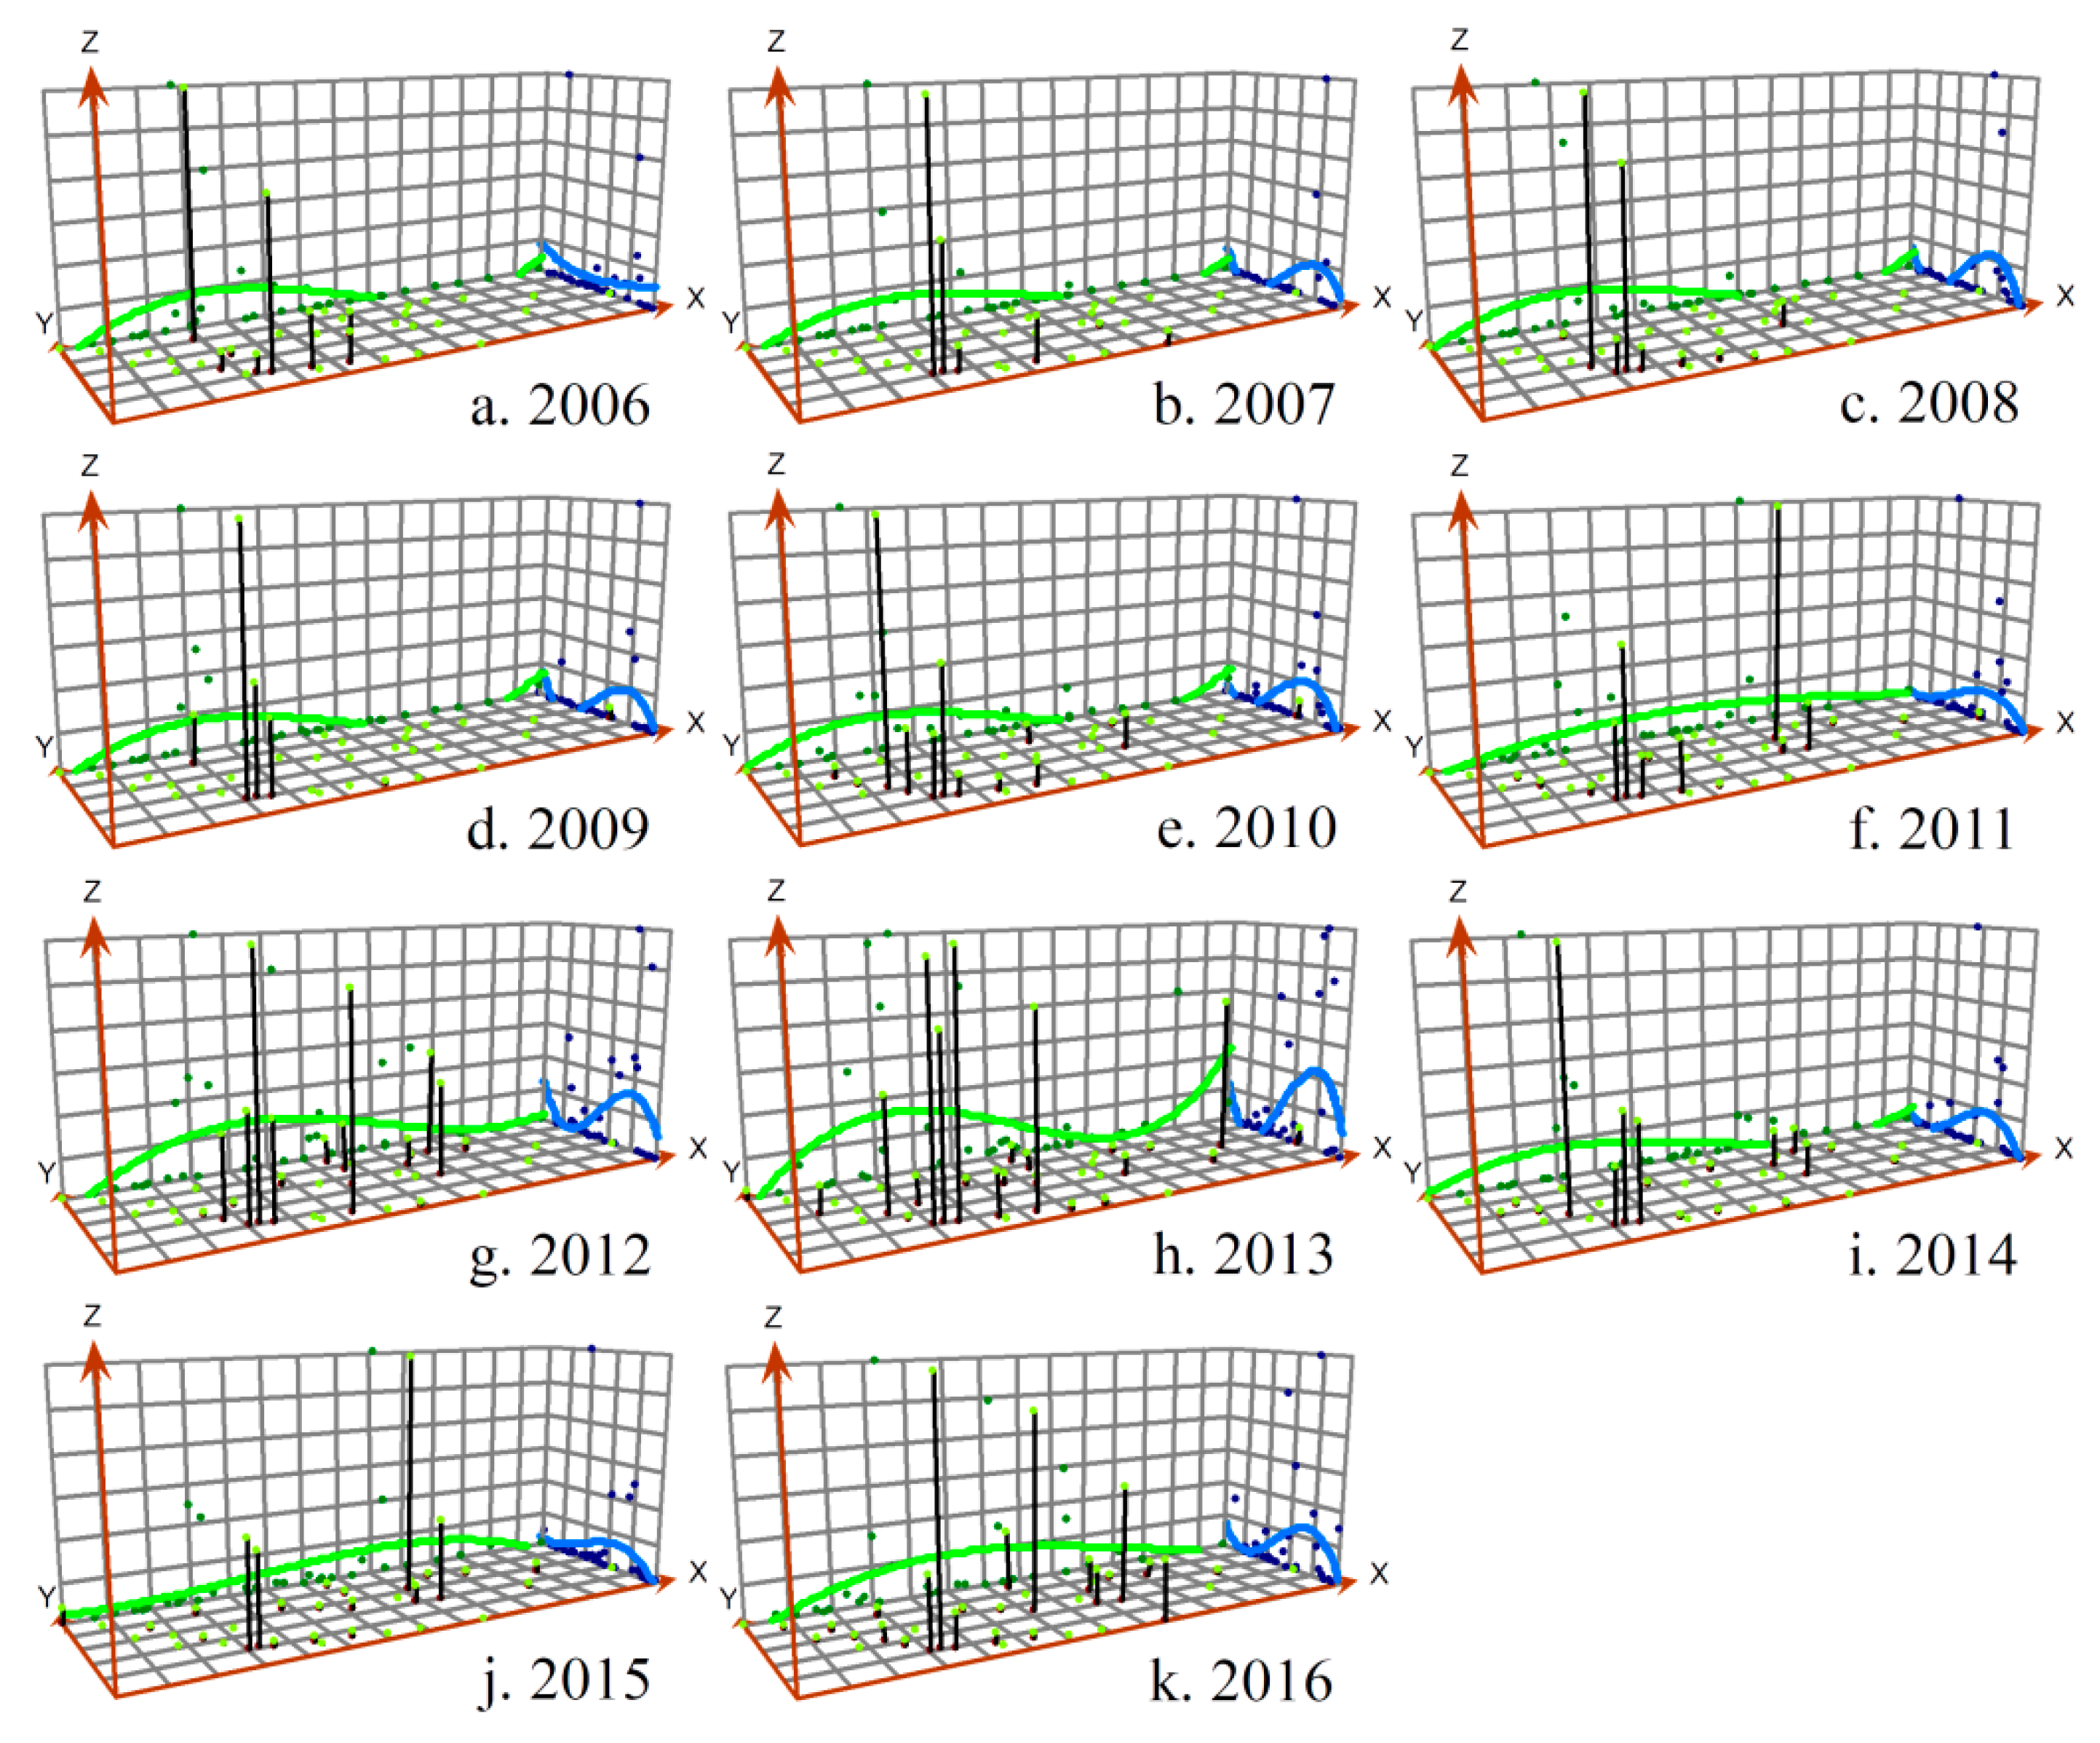
3.2.3. Geostatistical Trend Analysis

Trend surface analyses are commonly used in mathematical methods to simulate the distribution and change trends of the geographical elements of a space. This study used the trend surface to reveal the overall spatial differentiation of China’s OFDI in Indonesia [54]. The applied formula was as follows:
Z i ( x i , y i ) = T i ( x i , y i ) + ε i
T i ( x i , y i ) = β 0 + β 1 x + β 3 x 2 + β 4 y 2 + β 5 x y
where Z i ( x i , y i ) denotes that the observation value of the i sample is the plane coordinate value, and ( x i , y i ) is a plane coordinate value; T i ( x i , y i ) is a trend function; ε i is a residual; β 1 …… β 5 are the variable coefficients in the trend function; and β 0 is a constant term [55].

3.2.4. Description of the Models and Variables

Based on the literature review, this study selected the economic development levels; investment convenience; openness level; institutional factors; human resources; and political relations indicators as the key factors, and used a least squares method (OLS) to construct a model of the influencing factors of China’s OFDI in Indonesia. The expression could then be written as follows:
ln I / ln ( P + 1 ) = a 0 + a 1 ln E D i , t + a 2 ln W N i , t + a 3 ln F E i , t + a 4 ln W A i , t + a 5 ln ( F C i , t + 1 ) + a 6 ln P G D P i , t + a 7 ln E X i , t + a 8 ln F D I i , t + a 9 ln ( D T 2014 i , t + 1 ) + ε i , t
where I represents China’s OFDI in Indonesia’s provinces; P indicates the number of items; ε i , t is a model error term (random factor); a 0 is a constant term; a 1 , a 2 ……, a 9 denotes the elastic coefficient of each variable, which does not change with time and cross-section; i , t is the t-year indicator for the i-th province. With consideration given to the heteroscedasticity problem of the variable data in the model, and by avoiding a result as 0, the variables P , F C , +1, and D T 2014 +2 were taken as the logarithm.
E D represents degree of investment convenience using the province’s distribution of electricity indicator (GWH) measurements, which indicate that the province is capable of producing the necessary activities and electricity. Furthermore, the dependence of an enterprise investment on the power infrastructure can be verified.
In the above expression, W N and W A are the table of human resources, and the number of labor (persons) and monthly average worker wages (thousand rupiahs) can be used as indicators, in order to verify the strength of the Chinese enterprises’ investments in the labor demand.
F E and D T 2014 represent the institutional factors, expressed in terms of government fiscal expenditure (million rupiahs) and time dummy variables. Also, it can be used to verify the impacts of the government factors on the corporate behaviors, and the effects of the strategic cooperation policies between countries.
F C expresses political relations between the countries and utilizes a number of friendly cities in China and Indonesia to measure the role of the political relations in the choices made regarding investment destinations.
P G D P indicates the level of economic development and refers to the regional per capita GDP (thousand rupiahs) indicator, which effectively explains the level of regional development and market size as attractions for investments.
E X and F D I indicate the levels of regional openness, which is referred to as the number of exports (million dollars) and foreign inflows (million dollars). These are used to explore the relationship between the openness and China’s OFDI in Indonesia.

4. Evolution of China’s OFDI in Indonesia

4.1. Temporal Characteristics of China’s OFDI in Indonesia

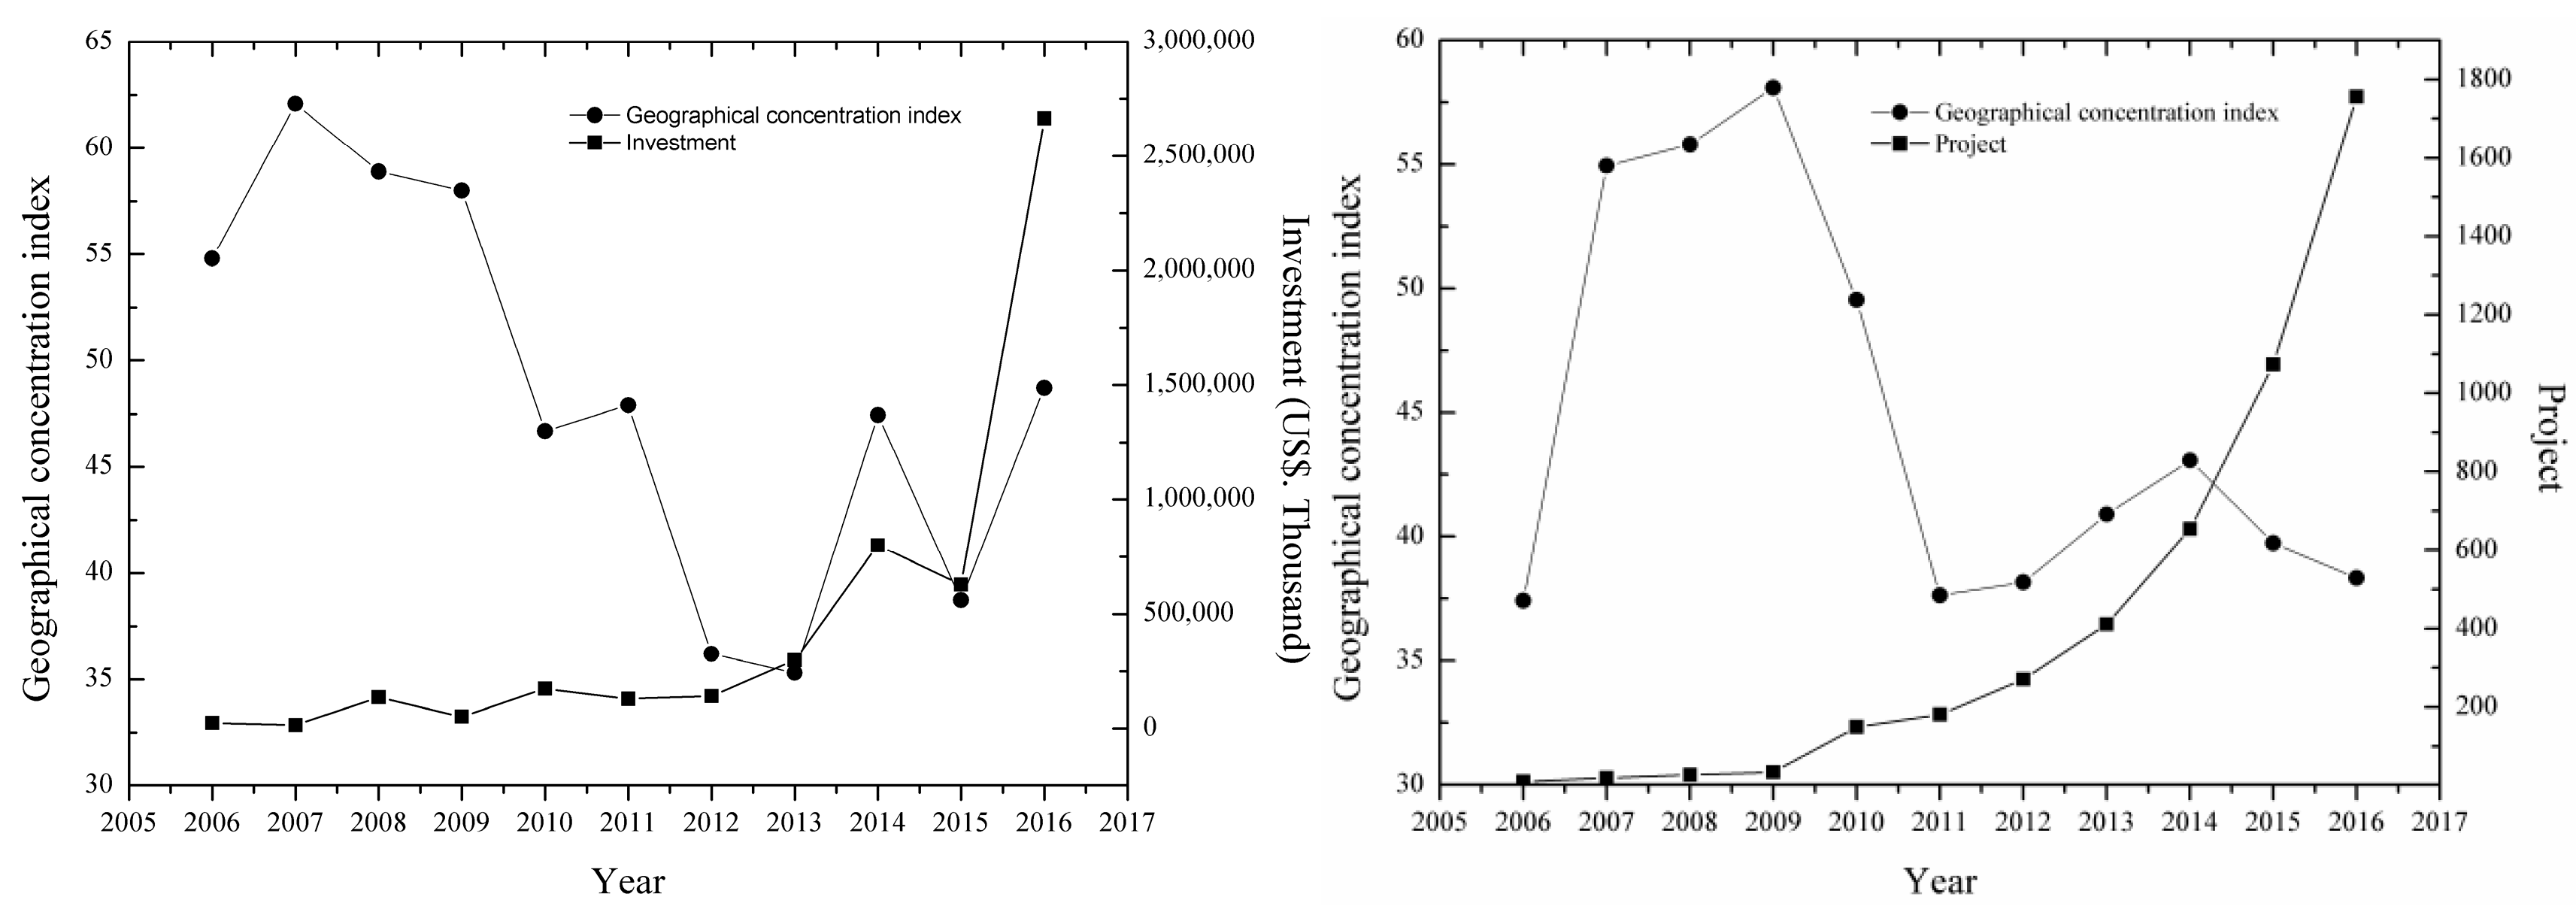
4.1.1. Continued Rise in the Amounts of Fluctuating Investments and Number of Investment Projects

Using China’s OFDI projects and investment data in Indonesia from 2006–2016, Figure 1 (right ordinate) is drawn. The curve of Figure 1 shows that China’s OFDIs in Indonesia have generally shown substantial increases. In terms of total investments, China’s OFDI in Indonesia increased from US $24 million to US $2.665 billion between 2006 and 2016. From the perspective of the number of investment projects, the total number of investment projects during the study period was observed to rapidly increase from 10 to 1756. The degree of curve change of Figure 1 also shows that China’s OFDIs in Indonesia were roughly divided into two phases: a steady growth phase (2006 to 2012); and a rapid development phase (2013 to 2016).
1. Steady growth stage: As shown in the curve in Figure 1, China’s OFDI in Indonesia grew gradually in 2006–2012, so this stage is the initial stage of China’s OFDI in Indonesia. During this period, China–Indonesia political relations continued to improve, and the two countries issued a joint declaration on a China–Indonesia strategic partnership in April 2005. The top leaders of the two countries promoted mutually beneficial economic and trade cooperation. Furthermore, China’s strong human capital, high trade openness and improved institutions, enabled the economy to develop rapidly during this period [56]. Under this background, Chinese enterprises gradually started to invest in Indonesia.
2. Rapid development stage: As shown in the curve in Figure 1, China’s OFDI in Indonesia grew very rapidly in 2013–2016. This trend can be explained by three reasons. China’s strong growth in the past decades enabled the economy to converge with advanced economies in terms of income level, meaning China has sufficient funds to support foreign investment activities [56]. In addition, the rapid rise of labor wages in China forced a large number of companies to move to countries where labor costs are low and abundant [57]. Meanwhile, The Chinese General Secretary Xi Jinping proposed the construction of the “21st Century Maritime Silk Road” in Indonesia, and Indonesia committed to become “Global Maritime Fulcrum” in hopes of attracting foreign capital to revitalize the domestic economy. Consequently, China’s OFDI in Indonesia has a “steep-climbing” trend at this stage.

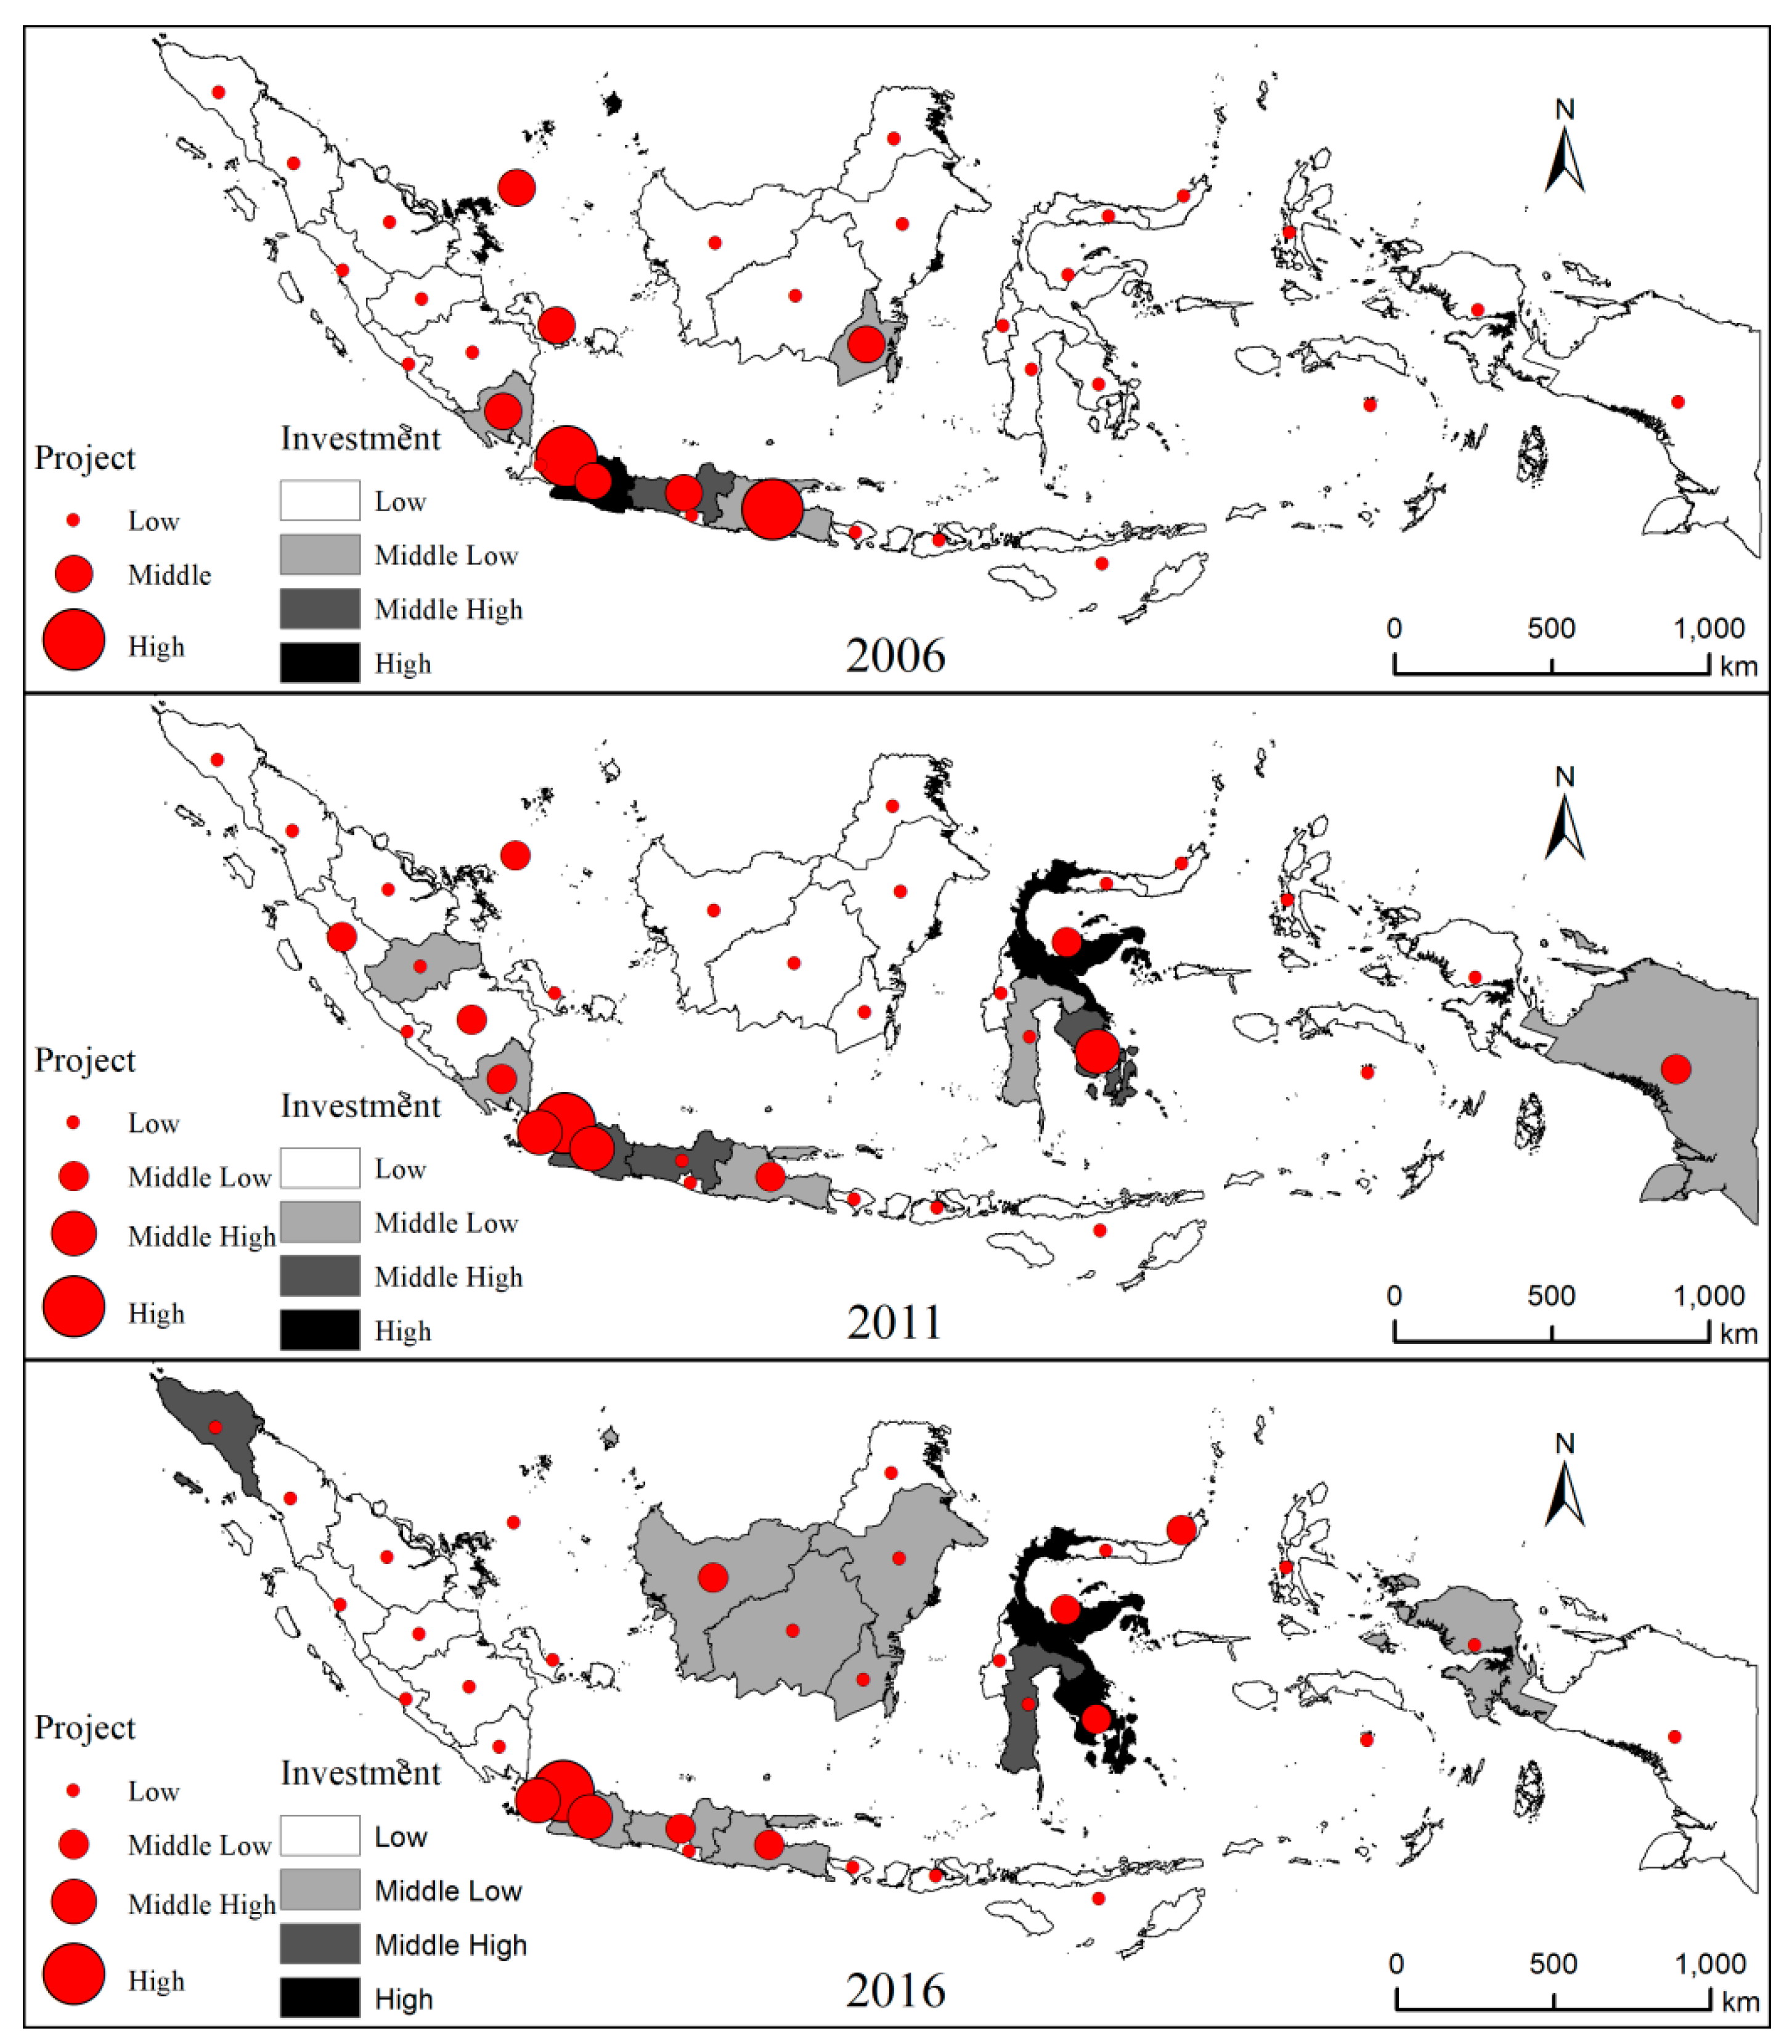
4.1.2. Investment Amounts and Number of Projects Are Generally Dispersed in Geospatial Locations

In this study, the geographical concentration index of China’s OFDI in Indonesia from 2006 to 2016 was calculated using Formula (1), in accordance with the total number of investments and projects data during each year. The goal was to measure the geographical concentrations of the investment and the diffusion situation. The results are shown in Figure 1 (left ordinate). During the examined period, the geographical concentration indexes of the investment amounts and number of projects were all between 30 and 65. The geographical concentration index of the investment amounts had dropped from 54.79 to 48.70. Also, the geographical concentration index of investment projects showed a sharp rise in small areas, and then gradually fell back. From the initial peak of 37.42 in 2006, to a peak of 58.08 in 2009, and up to a final peak of 38.32 in 2016, it could be seen that with the passage of time, the overall concentration index of the investment amounts had tended to decline. These findings indicated that China’s OFDIs in Indonesia had become decentralized. The reason was that China’s foreign investments were in a period of gradual expansion. In 2006, China had invested in only eight Indonesian provinces. These were mainly located on Java Island, where the economy was more developed and the level of openness was higher. However, only the investments on Riau Island were over 100 million dollars. The investment projects had numbered just one or two in each province at that time. In 2011, investments in Indonesia had expanded to 24 provinces, which accounted for 70.59% of the total Indonesian provinces. The investment total and the number of projects continued to steadily increase. By 2016, China had become the third largest investment country in Indonesia, and China’s OFDIs were located in almost all of the Indonesian provinces.
In this research study, the following findings were interesting to note. (1) During the initial stage of the investments (2006 to 2007), the geographical concentration index exhibited a rapid rise, and investments rapidly gathered in a geographical space. This phenomenon may be due to the lack of understanding of the initial investments made by Chinese companies in the local investment environment of Indonesia. The choice of investment locations at that moment had a certain degree of randomness. However, due to imperfect market research, as well as the proximity of the first batch of enterprises, later investing companies followed the original enterprises in site selection investment locations, which subsequently resulted in a certain degree of spatial agglomeration. (2) Generally speaking, the amounts of the investments were synchronous with the trend of the geographical agglomeration index of the number of projects. However, during short time periods (2007 to 2009; 2012 to 2013; 2015 to 2016), its agglomeration-diffusion situation had presented certain opposite trends and agglomeration peaks. Therefore, it was determined that with a short lag, the root causes of this phenomenon were as follows: first of all, since the sizes of the investment projects were different, the number of investment projects and the total investment amount did not present a strong correlation. In other words, if the number of projects was large, this did not necessarily mean that the investment amount was high. Secondly, the investment amounts were calculated based on the amount of the Indonesian party, and China’s OFDI in Indonesia included major projects. The capital investments had a phased feature (multiple divisions into two to three years of remittance), and the number of projects were signed during the same year. Therefore, China’s OFDI concentration in Indonesia and the number of projects had a certain degree of heterogeneity.

4.2. Spatial Characteristics of China’s OFDIs in Indonesia

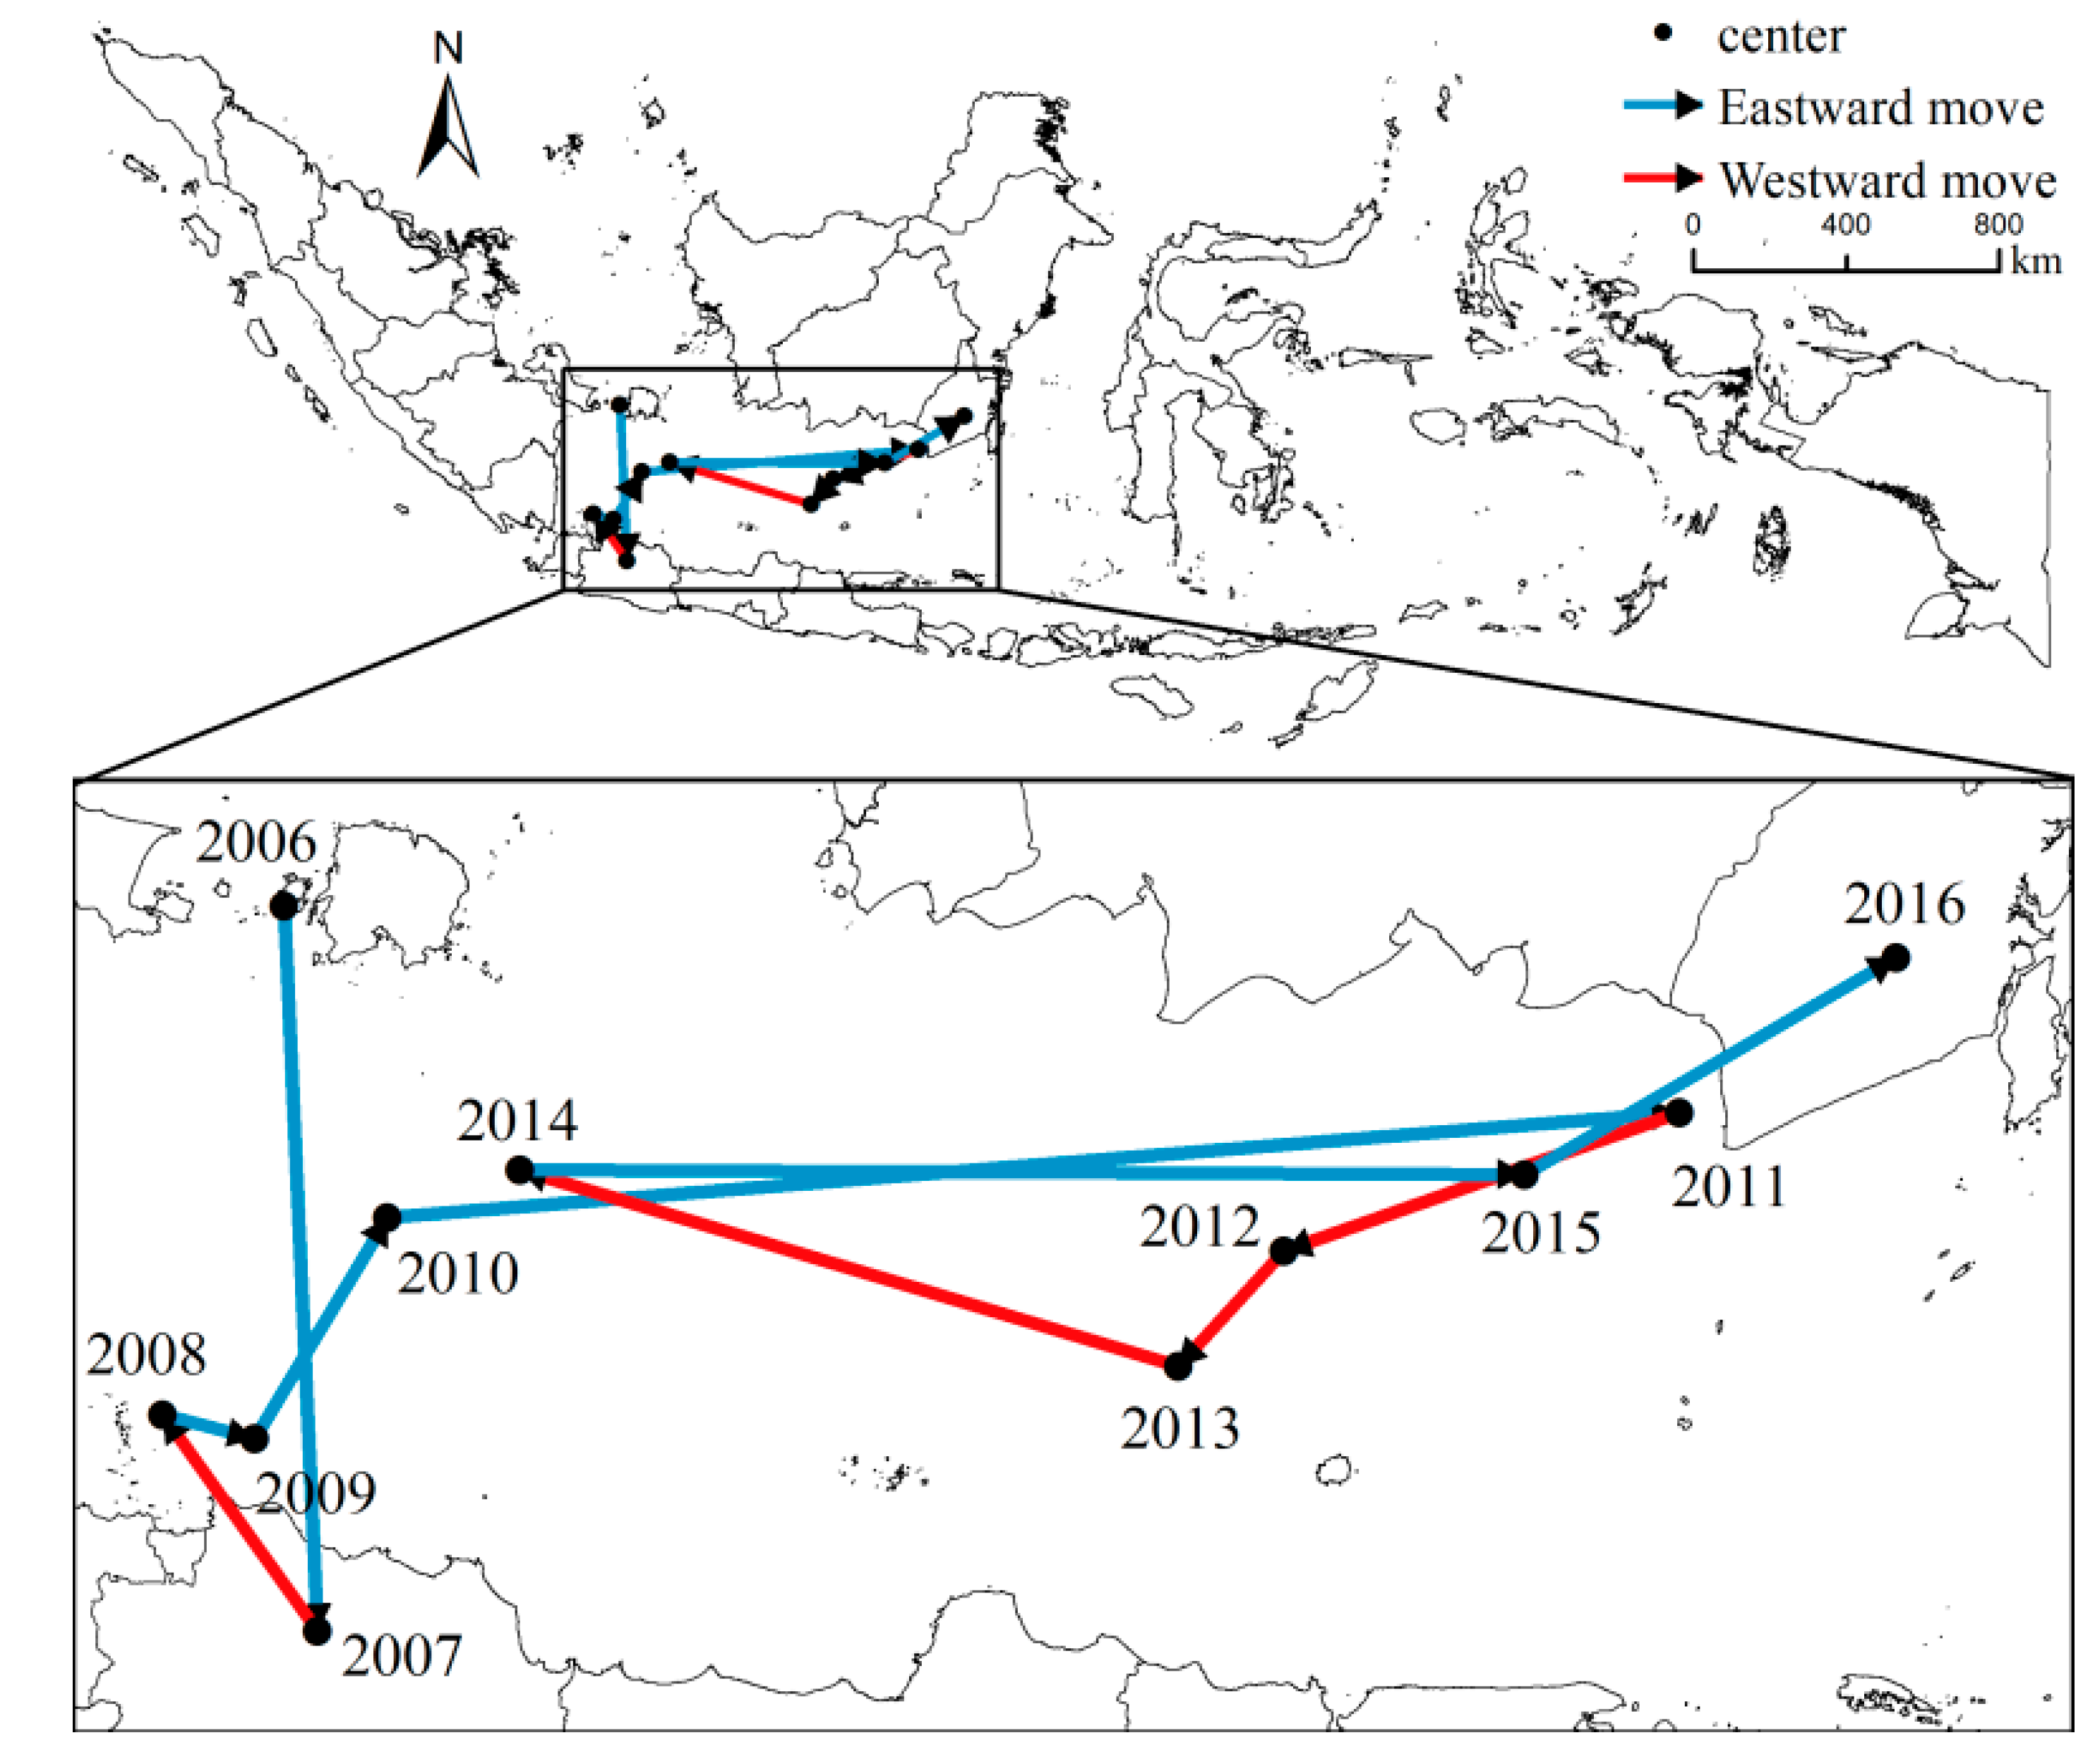
4.2.1. Overall Spatial Evolution Characteristics of China’s OFDIs in Indonesia

Due to the fact that the number of projects did not necessarily reflect the scale of the investments, it was found that the investment amount index was more realistic and comprehensive. In this study, based on the 2006 to 2016 China–Indonesia investment data, the investment gravity center of the provincial region was calculated using ArcGIS 10.2 software. Additionally, the investment center of gravity evolution curve was drawn, as detailed in Figure 2. A statistical trend analysis module in ArcGIS (Ver.10.2, Esri, Redlands, California, USA) was used, and the OFDI data were projected onto the orthogonal plane in an east–south–north direction. Then, the quadratic curve (Figure 3) was fitted to reflect the evolution of China’s OFDIs in Indonesia. The result of the above-mentioned process was the overall spatial pattern of China’s OFDIs in Indonesia.
A comparison was then made of the focus of China’s OFDI in Indonesia, along with the trend changes as follows:
(1) The spatial trend line of China’s OFDIs in Indonesia during the period ranging from 2006 to 2010 had basically maintained the overall characteristics of “west higher than east, and south higher than north”. The center of gravity remained small at between 106.76–107.89 E and 2.95–6.60 S. This study found that the spatial characteristics of China’s OFDIs were consistent with Indonesia’s socio-economic patterns. The investment activities were observed to be closely related to the size of the local economy, market demand, openness, industrial agglomeration, infrastructure constructions, and service industry development. The closer areas and regions with high levels of economic development tended to provide better investment environments for foreign investors. Therefore, the western region of Indonesia, which was characterized by better economic development, became a gathering place for Chinese investments. It was found that China’s OFDI pattern in Indonesia had generally formed a “west higher than east, and south higher than north” scenario. From the perspective of the trajectory of the gravity center of the examined space, the maximum offset was determined to be only 0.78° in the east–west direction, and 3.56° in the north–south direction. The minimum offset was only 0.17° in the east–west direction, and 0.13° in the north–south direction. In the initial exploration stage of the Chinese OFDI in Indonesia, the investment status was relatively stable in space and was determined to have had a certain inevitable connection with the investors’ cautious and tentative psychology.
(2) During the period ranging from 2011 to 2016, China’s OFDIs in Indonesia were highly volatile, and the direction of gravity center of the investments was observed to be significantly different during different time periods.
Specifically, the observed differences were divided in this study as follows:
(i) From 2011 to 2013, China’s OFDI focus in Indonesia continued to move from east to west, and four time nodes were located in the Java Sea. The “path dependence” on foreign capital was the internal force of China’s shift in focus in regard to Indonesia’s investment spaces during that period. First of all, China’s OFDIs in the area had accumulated a certain amount of experience and income over a short period of time. It was proven in practice that investment activities were more suitable in certain locations. Secondly, the economic aggregate of Java and Sumatra in the west accounted for 80% of Indonesia. In terms of political and economic absolute dominance, a good economic foundation, stable political environment, high level of openness, sufficient labor force, abundant market, as well as other excellent location factors, were found to have subtle influences on the locations of the Chinese investment enterprises. The above factors continued to attract the continuous influx of Chinese-funded enterprises and furthered the expansion of the investment scale. Therefore, China’s OFDI focus in Indonesia had still displayed a gradual shift to the western region. It can be seen from this study’s trend graph that China’s OFDIs in Indonesia had a certain agglomeration phenomenon during this stage, which was found to be a staged result of the industrial development. The east–west fitting curve was inverted by U-shaped pattern of “intermediate high two both side low” in 2011, which had changed to an “east high and west low” strong wave pattern by 2013. A north and south upward fitting curve, or a “south high and north low”, became increasingly significant, and indicated that China’s OFDI pattern in Indonesia had strong differentiation characteristics during the period ranging from 2011 to 2013. The overall investment pattern was determined to have been higher in the western region than in the eastern region, and the northern region was lower than the southern region. However, the investments in the central and southeastern regions had displayed an upward trend.
(ii) From 2014 to 2016, China’s OFDI gravity center on Indonesia’s investment space was opposite to that of the previous stage, and had continuously moved from west to east on the Java Sea. Then, as of 2016, the investment gravity center was located in South Kalimantan. It was determined that the first reason for these changes was that the “Belt and Road” initiative had proposed that Indonesia was the key to the Southeast Asian region. As a result, the Chinese government had scientifically designed and rationally invested in Indonesia, and the scale and intensity of investment increased significantly. Secondly, China’s OFDI in Indonesia had undergone a period of rapid expansion. Its investment activities were no longer limited to the Indonesian economy on the Javanese and Sumatra Islands, and the central and western parts of Kalimantan and Sulawesi had presented demands for a transportation infrastructure market. The rich gold mines, copper mines, coal, and other resources in Papua, as well as economic data that indicated that the Papua, Southeast Sulawesi, and West Papua Provinces had major development potential, and the economic shares of those provinces were rising. The above-mentioned elements forced and guided the investment center of gravity to move eastward. The third reason for the changes was that the investment industry had gradually expanded from capital-intensive industries (such as transportation infrastructures, energy, and electricity) to technology-intensive industries (such as tourism, finance, and electronic communications). Furthermore, the investment forms had changed from “quantity type” to “quality type” investments. This required changes in the location choices of the investment activities. In the trend distribution curve, it could be seen that the distribution trend of China’s OFDI in Indonesia during the period ranging from 2014 to 2016 was relatively flat. The spatial differentiation phenomenon had been alleviated, and the trend distribution had changed slightly. For example, the investment pattern was now higher in the western and southern regions in 2014. However, the eastern and northern regions were in a collapsed state, and there appeared to be trend of a slow tilting from west to east in the east–west direction in 2015. In 2016, there was a significant uplift observed in the central and southern regions. Therefore, China’s OFDI pattern in Indonesia was as follows: In the east–west direction, both of the sides were low, and the middle was high; in the north and south, the south was greater than the north.

4.2.2. Local Spatial Evolution Characteristics of China’s OFDI in Indonesia

In this research study, using the natural break method of ArcGIS, the investment amounts and the number of projects in Indonesia for the three time nodes in 2006, 2011, and 2016 were effectively divided into four grades. These were referred to as the high-value zone, middle high-value zone, middle low-value zone, and low-value zone, which were identified using numerical values. Then, the illustration shown in Figure 4 was used to explore the evolution characteristics of China’s OFDI in Indonesia’s local spatial patterns as follows:
(1) The number of investments in Indonesia’s high-level provinces was small and were mainly distributed in the developed regions. According to China’s OFDI projects in Indonesia, there were only two high-level provinces under the three time sections (three consecutive years), namely Jakarta and East Java. Only DKI Jakarta had reached the highest level for three consecutive years. The four total middle high-level provinces: North Sumatra, Banten, South East Sulawesi, and West Java. In terms of China’s OFDI in Indonesia, the highest-ranking provinces in 2006, 2011, and 2016 were as follows: West Java; Riau Island; Middle Sulawesi; DKI Jakarta; Banten; and South East Sulawesi. However, none of the aforementioned provinces had reached the highest level for three consecutive years. The middle- and high-level provinces included Banten, Middle Java, South East Sulawesi, West Java, Aceh, and South Sulawesi, which all displayed increases when compared with the number of investment projects. Also, the number of high-level provinces in the three time sections only accounted for between 5.89% and 17.65% of the all the provinces, and the proportion of middle- to high-grade provinces had ranged from 12.50% to 17.65%. The total number of middle- to high-grade provinces was greater than that of high-level provinces, which were mainly distributed in Java Island, Sumatra, and Sulawesi. The reason for these changes was that Jakarta was the capital of Indonesia, and as the political, economic, and cultural center of the country, it was also the largest city in Southeast Asia. Jakarta is known for its world-famous seaport, and its unique geographical and economic advantages have attracted the majority of investments from China. Java, Sumatra, and the islands of Sulawesi and Indonesia are the most important islands in the country. These are the largest islands in the region and contain the largest proportion of mountainous terrain. They are rich in oil, gas, coal, and metal resources, and have better industrial bases than the other Indonesian provinces. Also, the financial services industry has a high level of development, and the investment environment is relatively open. Therefore, China’s OFDIs are concentrated in the above-mentioned islands. Secondly, China’s OFDIs are highly concentrated in some areas, and the majority of the provincial investments are currently scattered due to the fact that China’s OFDI initiatives in Indonesia have begun to expand. At the present time, the high-level investment areas are often regions with frequent economic and trade activities and long investment histories. The majority of the low-level investment provinces still have fewer interactions with China. China’s OFDI is in a stage of trial and expansion in those locations, and the investment initiatives and projects are currently limited.
(2) The majority of the Indonesian provinces continued to be in a low-level stable state of investment. According to China’s OFDI projects in Indonesia, the number of the lowest-level provinces in the three time sections were 26, 24, and 25, which had accounted for 76.47%, 70.59%, and 73.53% of the total provinces, respectively. In terms of the investment amounts, the number of lowest-level provinces in 2006, 2011, and 2016 were 28, 23, and 19, respectively, which had accounted for 82.35%, 67.65%, and 55.89% of the total provinces. respectively. It was determined that the lowest-level provinces in the three time sections accounted for more than 50% of the total provinces. These findings indicated that the majority of China’s OFDIs in Indonesia were in low-level zones. One of the reasons for this was determined to be that the infrastructures of the majority of the provinces in Indonesia were seriously backward; logistics costs were too high, power supplies were insufficient, and the throughput capacities of the ports were limited. Therefore, the Chinese entities which were involved in long-distance transportation faced the problem of increasing production costs. A second reason was that the administrative inefficiency and bureaucratic style of the provincial governments were serious factors which had directly affected the approvals and operations of the Chinese enterprise investment projects, and had interfered with the investment activities of foreign-funded enterprises. The third factor was that the Indonesian people had concerns regarding China’s rising global power, and the public believed that the strength of China’s economy was a threat. Chinese products were squeezing out Indonesia’s domestic products at lower prices, forcing them to close down operation. Also, the arrival of Chinese workers had impacted employment resources and had resulted in Indonesia’s serious unemployment problem becoming more sensitive. Some of the Indonesian people had believed that the resources which were being transported to China had damaged Indonesia’s environment. This study determined that the above-mentioned reasons caused China’s OFDI in the majority of Indonesian provinces to remain at low levels.

5. Influences on China’s OFDI Location Choices in Indonesia

In this study, an OLS regression model of China’s OFDI in Indonesia was constructed using Stata software, and the coefficients were estimated. The results of this study’s Hausman test revealed that the model was suitable for the random effects, as detailed in Table 2. The results showed that the R2 of the investment random effects model and project random effects model were 0.8424 and 0.9269, respectively. These results indicated that the models were set well, and the explanatory variables could effectively explain 82.24% of China’s OFDIs in Indonesia, as well as 92.69% of the distribution of the project locations. The explanatory variables of government expenditure, number of friendly cities, GDP per capita, and export volume had all passed the significance level test of 10%. These results indicated that institutional factors, political relations, economic development levels, and openness to the outside world had significant impacts on the investments of Chinese companies in Indonesia. In this study, in order to eliminate the variable interference which had not passed the significance level test and improve the robustness of the models, a step-wise regression model was provided as a reference, as detailed in Table 3. The results showed that the step-wise regression model was able to explain the distribution of 59.24% of China’s OFDI in Indonesia, and also explain 69.76% of the distribution of the investment projects. Although the model’s interpretation ability was significantly lower than that of the random effects model, the increases in labor quantity and monthly average worker wage variables had passed the 10% significance level, which indicated that human resources had also had a certain impact.

5.1. Institutional Factors

Fiscal expenditures can reflect a government’s ability to allocate social resources. In this study, both the random effects model and the step-wise regression model showed that government fiscal expenditures had important impacts on China’s OFDI in Indonesia. However, the two models had different symbols. The random effects model showed that the provinces with high fiscal expenditures had impediments to investment. In contrast, the step-wise regression model provinces with higher fiscal expenditures were found to be more likely to significantly promote the growth of China’s OFDI projects. The first reason for this was that in the provinces with large fiscal expenditures, the degree of government control over enterprise was greater [58]. It was not conducive to decision-making in the autonomous behaviors of the enterprises and restricted the investment behaviors of the enterprises to a certain extent. Therefore, and China’s OFDI choices have lower fiscal expenditures (for example, the system quality was poor), and there may have been tax avoidance suspicions at the time [59]. Secondly, improved institutional environments also attracted China’s OFDIs. High fiscal expenditures indicated the ability to provide funds for corporate activities, improve infrastructure, along with other strong policy support [60]. Therefore, the Indonesian government’s fiscal expenditure had significant impacts on China’s corporate investments, and these were obviously two-way effects.

5.2. Political Relations

The number of friendly cities in a region reflected the close political and social ties between Indonesia’s provinces and China. The two models used in this study showed that their regression coefficients were greater than 0.3, which indicated that the close political and social relations between the regions had a strong causal relationship with corporate investment behaviors. However, the closeness of the political friendship between China and Indonesia was found to be negatively correlated with the corporate investments, which was contrary to common sense. The reason may have been that the general private enterprises wished to avoid the political risks of foreign investments. However, the ownership advantages of the state-owned enterprises had made their anti-risk abilities stronger. Therefore, for those seeking investments for resource-based purposes, the state-owned enterprises did not evade the local environments with poor political relations. China’s OFDIs in Indonesia were mainly large state-owned enterprises which had been promoted by state power initiatives [57].

5.3. Economic Development Levels

The market size and economic strength of a host country are often considered to be the main factors which attract multinational companies to invest there. The per capita GDP reflects the regional economic strength and market size [61,62]. The per capita GDP of Indonesia’s provinces had a positive effect on China’s OFDI. The regression coefficients of the economic development levels on China’s OFDI amounts and number of projects were 1.102 and 0.391, respectively. Under the condition that other variables remained unchanged, the per capita GDP of the provinces had increased by 1%, and the investment amounts and number of investment projects had increased by 1.102% and 0.391%, respectively. Generally speaking, China’s OFDI in Indonesia tended to circumvent trade barriers. It was found that investments had increased with the expansion of the provincial economic strength and market size, which in turn reflected the market’s motive for China’s OFDI in Indonesia [63].

5.4. Openness Levels

The scale of regional exports can reflect the degree and level of openness in a region [64]. This study’s random effects model and step-wise regression model showed that the symbols of the export indicators in the models were negative, which indicated that exports had some inhibitory effects on China’s OFDI. Also, there was a mutual substitution between exports and OFDIs [65,66]. China’s OFDI in Indonesia was aimed at seeking markets. Meanwhile, the larger the scale of Indonesian exports is, the greater the degree of market openness, and the closer the access to international markets will be. The investment initiatives of other countries, such as Japan and Singapore, were determined to have been easier, which inevitably put pressure on Chinese companies to seize the market share. Therefore, the greater the size of the regional exports, the more unfavorable for Chinese companies to carry out OFDI activities in Indonesia.

5.5. Human Resources

Low labor costs and abundant labor resources are known to be important factors which promote investments by multinational enterprises [67]. In this study, the monthly average wage and labor quantity passed the significance level in the step-wise regression model. The human resource index was positive in the model. Therefore, it was concluded that the labor costs and labor force had strong pulling effects on China’s OFDI in Indonesia. The increases in labor costs in China in recent years has forced China’s low-end manufacturing companies to shift to labor-rich and less expensive Indonesia. However, it should be noted that the labor cost factors were positively correlated. This was due to the fact that the labor prices were not only strongly correlated with the labor costs, but were also highly correlated with labor productivity and purchasing power. China’s OFDI in Indonesia was more inclined to seek market types [68]. It was observed that even though the Chinese investment companies tended to believe that the wages in Indonesia’s provinces were low, they would not give up vast markets and higher labor productivity in search of lower labor costs. Therefore, the effects of labor productivity and market purchasing power had exceeded the losses caused by higher labor costs. In Indonesia, the provinces with broad markets and high production efficiency were relatively developed. Under normal circumstances, the average wage level of workers in such areas was also high. Therefore, the labor cost factors were positively related to China’s OFDI in Indonesia. In addition, foreign investment companies could potentially raise the general wage level within a province or industry [69].
In summary, the following factors were found to jointly affect China’s OFDI pattern in Indonesia: institutional factors; political relations; economic development levels; openness levels; and human resources. The regression coefficient showed that institutional factors, political relations, and human resources were the most important factors which affected China’s OFDI in Indonesia. Furthermore, the economic development levels and human resources factors had played significant roles in promoting China’s OFDI in Indonesia. However, the factors of political relations and openness levels were found to have some restrictions on China’s OFDI in Indonesia. It was observed that the fiscal expenditure index had opposite effects in the different models. Therefore, it was concluded that some institutional factors had played dual roles in China’s OFDI in Indonesia. Unfortunately, the degree of investment convenience and the “Belt and Road” initiative factors did not pass the tested significance levels in this study. It was considered that the reasons may have been that the overall level of infrastructure in Indonesia was low, and therefore had had no effect on the location choices of investments. There may also have been a certain relationship between the choices of the examined factors. For example, the electricity distribution levels may not have fully represented the infrastructures necessary for production. In recent years, the “Belt and Road” initiative was proposed in China, and its policies have had a certain lag time in its planning and implementation processes [70]. However, it cannot be said that the “Belt and Road” initiative policies have had no impacts on China’s OFDI in Indonesia. In this study, the policy factors of the “Belt and Road” initiative were not tested by the significance level since they may have also been related to the setting of dummy variables and model choices.

6. Conclusions

This study used China’s OFDI in Indonesia and project data from the period ranging from 2006 to 2016, and combined the data with spatial measurement and mathematical statistics methods. The goal of this study was to attempt to reveal the evolution of China’s OFDI pattern in Indonesia and its influencing factors. The following conclusions were obtained:
(1) Characteristics of China’s OFDI in Indonesia: It was found in this study that the investment amounts had fluctuated while the number of investment projects had continued to rise. China’s OFDIs in Indonesia were divided into the following stages: a steady growth phase (2006 to 2012), and a rapid development phase (2013 to 2016). The geographical concentration index of investment amounts was observed to have dropped from 54.79 to 48.70. The geographic concentration index of the number of investment projects had rapidly risen from the initial level of 37.42 in 2006, to a peak value of 58.08 in 2009, and finally had fallen to 38.32 in 2016. The amounts of investments and the number of projects were generally dispersed in geospatial locations.
(2) Overall spatial evolution characteristics of China’s OFDI in Indonesia: this study implemented spatial center of gravity and trend surface analyses to examine the overall spatial evolution characteristics. It was found that the spatial trend line of China’s OFDI in Indonesia during the research period had basically maintained the overall characteristics of “west higher than the east, and south higher than the north”. Also, China’s overall spatial characteristics of Indonesian investments were consistent with its socio-economic differences. China’s OFDIs in Indonesia were found to be highly volatile, and the direction of the investment gravity was observed to be significantly different at different times. China’s OFDI focus in Indonesia from 2011 to 2013 continued to move from east to west. However, during the period ranging from 2014 to 2016, the investment gravity center was observed to be opposite to that of the previous stage, and had continuously migrated from west to east on the Java Sea. Finally, it was found that the investment gravity center in 2016 was located in South Kalimantan.
(3) Local spatial evolution characteristics of China’s OFDI in Indonesia: A natural break method was used in this study to classify the investment amounts and number of investment projects in Indonesia during 2006, 2011, and 2016, in order to analyze the local characteristics of the investments. The high-level investments were found to be focused in only a few provinces. The highest-level and middle- to high-level provinces were observed to be mainly distributed in the economically developed and resource-rich Java, Sumatra, and Sulawesi areas. The lowest-level provinces in the three time sections had accounted for more than 50% of the total provinces, and the majority of the provinces continued to be in low-level stable states of investment.
(4) The results of regression coefficient using the OLS regression model and the stepwise regression model indicate that, from all the indicators used in this study, the significant indicators to the variable of China’s OFDI in Indonesia are institutional factors, political relations and human resources. In addition, the economic development level and openness level also affect China’s OFDI pattern in Indonesia. It was also observed that investment convenience and the “Belt and Road” initiative factors had not passed the significance level test. This may have been related to the overall low level of infrastructure in Indonesia at the time, as well as the selection of the indicators, and the lag time of the policies. Therefore, it was assumed in this study that the investment convenience and the “Belt and Road” initiative factors had limited impact China’s OFDI in Indonesia during the study period. It is worth mentioning that the “Belt and Road” initiative indicator is highly relevant to the research background of this study, but the result releases that the influence of the “Belt and Roads” initiative in China’s OFDI in Indonesia is limited in the short-term.
This study used the Indonesian Province as a research unit in order to explore the internal spatial differences of the OFDI host country. This was considered to be a breakthrough in the existing research results. However, due to the limited data obtained in this study, it will be necessary to continue to supplement the following aspects in the future:
(1) The differences in the spatial distributions of the state-owned large enterprises and small private factories require further examination; (2) the industrial structures of China’s OFDI companies in Indonesia and how they have evolved are not yet fully understood and require further study; (3) non-examined factors, such as lacking resources, transportation, Chinese population, government corruption, and so on, may lead to variations in the results when obtained using different measurement models. In this study, the constraints of the samples had still existed. Therefore, the obtained regression results should be used cautiously. For example, the model results in this study show that the “Belt and Road” factors have limited impact on China’s OFDI in Indonesia, which is closely related to the selection of time dummy variables and models. This does not mean that the “Belt and Road” initiative in reality has no impact on China’s OFDI in Indonesia. Therefore, whether the “Belt and Road” initiative will affect China’s foreign direct investment in Indonesia requires more scholars to conduct in-depth research.

Author Contributions

In this research study, T.W. conceived and polished the language; A.S. provided data; and Y.F. analyzed the data and wrote the paper. All of authors have read and approved the final manuscript.

Funding

This research was supported by the National Natural Science Foundation of China (Grant No: 41471103).

Acknowledgments

The authors would like to acknowledge the assistance provided by the Indonesian Statistics Bureau of the Government of Indonesia who provided basic data for this study.

Conflicts of Interest

The authors declare no conflict of interest.

References

  1. The Ministry of Commerce of the People’s Republic of China. Foreign Direct Investment Statistics Bulletin. Available online: http://www.mofcom.gov.cn/article/tongjiziliao/dgzz/201309/20130900295526.shtml (accessed on 1 October 2018).
  2. The Ministry of Commerce of the People’s Republic of China. Foreign Direct Investment Statistics Bulletin. Available online: http://fec.mofcom.gov.cn/article/tjsj/tjgb/201809/20180902791493.shtml (accessed on 1 October 2018).
  3. Kang, L.; Peng, F.; Zhu, Y.; Pan, A. Harmony in diversity: Can the one belt one road initiative promote China’s outward foreign direct investment? Sustainability 2018, 10, 3264. [Google Scholar] [CrossRef]
  4. Du, J.; Zhang, Y. Does one belt one road initiative promote Chinese overseas direct investment? China Econ. Rev. 2018, 47, 189–205. [Google Scholar] [CrossRef]
  5. Liu, H.; Jiang, J.; Zhang, L.; Chen, X. OFDI agglomeration and Chinese firm location decisions under the “Belt and Road” initiative. Sustainability 2018, 10, 4060. [Google Scholar] [CrossRef]
  6. Pasierbiak, P. Development of Chinese foreign direct investment in the ASEAN (2000–2013). Dimens. Reg. Process. Asia-Pac. Reg. 2015, 413, 136–148. [Google Scholar] [CrossRef]
  7. UNCTAD. World Investment Report 2017—Investment and the Digital Economy; United Nation Publication: New York, NY, USA, 2017. [Google Scholar]
  8. Tambunan, T.T.H. Inward FDI in Indonesia and Its Policy Context. Available online: https://academiccommons.columbia.edu/doi/10.7916/D8S189C6 (accessed on 20 November 2018).
  9. McKinsey Global Institute. The Archipelago Economy: Unleashing Indonesia’s Potential. Available online: http://www.asiabusinesscouncil.org/docs/newsletter/McKinsey Indonesia.pdf (accessed on 20 November 2018).
  10. Lim, T.W. Asian diplomacy: The “fulcrum” role of two major powers in east Asia? J. Northeast Asian Hist. 2016, 13, 59–91. [Google Scholar]
  11. Leitão, N.C. The impact of foreign direct investment on economic growth: The Portuguese experience. Theor. Appl. Econ. 2013, 578, 51–62. [Google Scholar]
  12. Ali, N.; Mingque, Y. Does foreign direct investment lead to economic growth? Evidences from Asian developing countries. Int. J. Econ. Financ. 2018, 10, 109–119. [Google Scholar] [CrossRef]
  13. Dunning, J.H. Reappraising the eclectic paradigm in an age of alliance capitalism. J. Int. Bus. Stud. 1995, 26, 461–491. [Google Scholar] [CrossRef]
  14. Liu, H.Y.; Tang, Y.K.; Chen, X.L.; Poznanska, J. The determinants of Chinese outward FDI in countries along “One Belt One Road”. Emerg. Mark. Financ. Trade 2017, 53, 1374–1387. [Google Scholar] [CrossRef]
  15. Denisia, V. Foreign direct investment theories: An overview of the main FDI theories. Eur. J. Interdiscip. Stud. 2010, 2, 104–110. [Google Scholar]
  16. Quer, D.; Claver, E.; Rienda, L. Political risk, cultural distance, and outward foreign direct investment: Empirical evidence from large Chinese firms. Asia Pac. J. Manag. 2012, 29, 1089–1104. [Google Scholar] [CrossRef]
  17. Gammeltoft, P. Chinese foreign direct investment in Indonesia. CIBEM Work. Pap. Ser. 2011, 6, 1–29. [Google Scholar] [CrossRef]
  18. Sánchez-Martín, M.E.; De Arce, R.; Escribano, G. Do changes in the rules of the game affect FDI flows in Latin America? A look at the macroeconomic, institutional and regional integration determinants of FDI. Eur. J. Political Econ. 2014, 34, 279–299. [Google Scholar] [CrossRef]
  19. Kakinaka, M.; Kotani, K. Foreign direct investment and infrastructure development in Indonesia: Evidence from province data. Asian J. Empir. Res. 2014, 4, 79–94. [Google Scholar]
  20. Sodik, J.; Sarungu, J.; Soesilo, A.; Aisyah, S. Spatial dynamics and determinant of foreign direct investment in Indonesia: A comparative study of pre and post autonomous area 1990–2014. RJOAS 2018, 9, 37–51. [Google Scholar] [CrossRef]
  21. Kang, Y. Regulatory institutions, natural resource endowment and location choice of emerging-market FDI: A dynamic panel data analysis. J. Multinatl. Financ. Manag. 2018, 45, 1–14. [Google Scholar] [CrossRef]
  22. CEFTA. Trade Integration, Industry Concentration and FDI Inflows: The Experience in Central and South Eastern Europe. Available online: https://www.oecd.org/global-relations/CEFTA%20WP3_TradeFDI_NEW_Nov%202010.pdf (accessed on 20 November 2018).
  23. Gammeltoft, P.; Lepi, T.T. Chinese foreign direct investment in Indonesia: Trends, drivers and impacts. Int. J. Technol. Learn. Innov. Dev. 2013, 6, 136–160. [Google Scholar] [CrossRef]
  24. Demir, F. Effects of FDI flows on institutional development: Does it matter where the investors are from? World Dev. 2016, 78, 341–359. [Google Scholar] [CrossRef]
  25. Uddin, M.; Chowdhury, A.; Zafar, S.; Shafique, S.; Liu, J. Institutional determinants of inward FDI: Evidence from Pakistan. Int. Bus. Rev. 2018, 1–15. [Google Scholar] [CrossRef]
  26. Shah, S.H.; Ahmad, M.H.; Ahmed, Q.M. The nexus between sectoral FDI and institutional quality: Empirical evidence from Pakistan. Appl. Econ. 2016, 48, 1591–1601. [Google Scholar] [CrossRef]
  27. Aziz, O.G. Institutional quality and FDI inflows in Arab economies. Financ. Res. Lett. 2018, 25, 111–123. [Google Scholar] [CrossRef]
  28. Chanegriha, M.; Stewart, C.; Tsoukis, C. Identifyng the robust economic, geographical and politic determinants of FDI: An extreme bounds analysis. Empir. Econ. 2016, 52, 759–776. [Google Scholar] [CrossRef]
  29. Stevens, C.E.; Newenham-Kahindi, A. Legitimacy spillovers and political risk: The case of FDI in the east african community. Glob. Strategy J. 2017, 7, 10–35. [Google Scholar] [CrossRef]
  30. Khan, M.; Akbar, M. Impact of Political Risk on Foreign Direct Investment. Available online: http://mpra.ub.uni-muenchen.de/47283/ (accessed on 20 November 2018).
  31. Nazeer, A.M.; Masih, M. Impact of Political Instability on Foreign Direct Investment and Economic Growth: Evidence from Malaysia. Available online: https://mpra.ub. uni-muenchen.de/79418/ (accessed on 20 November 2018).
  32. Topal, M.H.; Gul, O.S. The effect of country risk on foreign direct investment: A dynamic panel data analysis for developing countries. J. Econ. Libr. 2016, 3, 141–155. [Google Scholar]
  33. Hayakawa, K.; Kimura, F.; Lee, H.H. How does country risk matter for foreign direct investment? Dev. Econ. 2013, 51, 60–78. [Google Scholar] [CrossRef]
  34. Atje, R.; Gaduh, A.B. Indonesia-China economic relations: An indonesian perspective. Econ. Work. Pap. Ser. 1999, 52, 1–24. [Google Scholar]
  35. Buthe, T.; Milner, H.V. The politics of foreign direct investment into developing countries: Increasing FDI through trade agreements. Am. J. Political Sci. 2008, 52, 741–762. [Google Scholar] [CrossRef]
  36. Levent, T.B.; Kundak, S.; Gulumser, A.A. City-to-city linkages in a mobile society: The role of urban networks in Eurocities and Sister Cities. Int. J. Serv. Technol. Manag. 2008, 10, 83–109. [Google Scholar] [CrossRef]
  37. Wang, M.J.; Xu, Y.P. Chinese OFDI in America: Basic features and determinants. Acta Geogr. Sin. 2017, 72, 1373–1391. [Google Scholar] [CrossRef]
  38. Selimi, S.N.; Zekiri, S.J. Internationalization of businesses and selection of entry modes in other markets. ILIRIA Int. Rev. 2017, 7, 64–81. [Google Scholar] [CrossRef]
  39. Soumaré, I. Does FDI improve economic development in north African countries? Appl. Econ. 2015, 47, 5510–5533. [Google Scholar] [CrossRef]
  40. Belloumi, M. The relationship between trade, FDI and economic growth in Tunisia: An application of the autoregressive distributed lag model. Econ. Syst. 2014, 38, 269–287. [Google Scholar] [CrossRef]
  41. Sayari, N.; Sari, R.; Hammoudeh, S. The impact of value-added components of GDP and FDI on economic freedom in Europe. Econ. Syst. 2018, 42, 282–294. [Google Scholar] [CrossRef]
  42. Khaliq, A.; Noy, I. Foreign direct investment and economic growth: Empirical evidence from sectoral data in Indonesia. J. Econ. Lit. 2017, 45, 313–325. [Google Scholar] [CrossRef]
  43. Rininta, N. The Causality of FDI Inflow and Economic Growth in Indonesia. Available online: http://mpra.ub.uni-muenchen.de/46572/ (accessed on 20 November 2018).
  44. Wacker, K.M. Do multinationals deteriorate developing countries’ export prices? The impact of FDI on net barter terms of trade. World Econ. 2016, 39, 1974–1999. [Google Scholar] [CrossRef]
  45. Morrison, W.M. China’s Economic Rise: History, Trends, Challenges, and Implications for the United States. Available online: http://www.fas.org/sgp/crs/row/RL33534.pdf (accessed on 20 November 2018).
  46. Albahi, M. Export-import and foreign direct investment (FDI): Indonesian economic study. IOSR J. Econ. Financ. 2016, 7, 37–44. [Google Scholar] [CrossRef]
  47. Mahadika, I.N.; Kalayci, S.; Altun, N. Relationship between GDP, foreign direct investment and export volume: Evidence from Indonesia. Int. J. Trade Econ. Financ. 2017, 8, 51–54. [Google Scholar] [CrossRef]
  48. Salike, N. Role of human capital on regional distribution of FDI in China: New evidences. China Econ. Rev. 2016, 37, 66–84. [Google Scholar] [CrossRef]
  49. Tao, D.; Yang, D.T. Has China lost its global labor advantage? IZA Discuss. Pap. Ser. 2010, 15, 482–504. [Google Scholar] [CrossRef]
  50. Fan, H.; Lin, F.; Tang, L. Minimum wage and outward FDI from China. J. Dev. Econ. 2018, 135, 1–19. [Google Scholar] [CrossRef]
  51. Lipsey, R.E.; Sjolom, F. Foreign direct investment and wages in Indonesian manufacturing. J. Dev. Econ. 2004, 73, 415–422. [Google Scholar] [CrossRef]
  52. Jin, S.T.; Li, B.; Yang, Y.C.; Shi, P.J.; Shi, K.B.; Da, F.W. The distribution of cities in China and its influencing factors. Geogr. Res. 2015, 34, 1352–1366. [Google Scholar] [CrossRef]
  53. Li, Z.J. The regional gravity evolution of consumption, economy and population based on the multiple time scales in China. Econ. Geogr. 2014, 34, 85–90. [Google Scholar] [CrossRef]
  54. Liu, Y.S.; Yang, R. The spatial characteristics and formation mechanism of the county urbanization in China. Acta Geogr. Sin. 2012, 8, 1011–1020. [Google Scholar] [CrossRef]
  55. Yang, H.M. Changing spatial pattern and accessibility of primary and secondary schools in a poor mountainous county: A case study of Song County, Henan Province. Prog. Geogr. 2018, 4, 556–566. [Google Scholar] [CrossRef]
  56. Lee, J.W. China’s economic growth and convergence. World Econ. 2017, 40, 2455–2474. [Google Scholar] [CrossRef]
  57. Liang, Y.T.; Huang, H.Y.; Liu, Y.; Zhou, Z.K. Location choice of Chinese multinational enterprise in Southeast Asian based on the perspective of enterprise ownership. Sci. Geogr. Sin. 2018, 38, 645–653. [Google Scholar] [CrossRef]
  58. Goodspeed, T.; Vaquez, M.Z.; Zhang, L. Are Other Government Policies More Important than Taxation in Attracting FDI? A Working Paper 06-28; Department of Economic International Studies Georgia State University: Atlanta, GA, USA, 2006; Available online: https://icepp.gsu.edu/files/2015/03/ispwp0614.pdf (accessed on 3 December 2018).
  59. Lampreave, P. Anti-Tax avoidance measures in China and India: An evaluation of specific court decisions. Bull. Int. Tax. 2013, 67, 49–60. [Google Scholar]
  60. Ajudua, E.I.; Davis, O.J.P.; Government expenditure, foreign direct investment and economic growth in Nigeria. J. Econ. Sustain. Dev. 2015, 6, 8. Available online: https://www.iiste.org/Journals/index.php/JEDS/article/viewFile/21907/22248 (accessed on 5 November 2018).
  61. Bengoa, M.; Sanchez-Robles, B. Foreign direct investment, economic freedom and growth: New evidence from Latin America. Eur. J. Political Econ. 2003, 19, 529–545. [Google Scholar] [CrossRef]
  62. Borensztein, E.; De Gregorio, J.; Lee, J.-W. How does foreign direct investment affect economic growth? J. Int. Econ. 1997, 46, 115–135. [Google Scholar] [CrossRef]
  63. Lu, J.; Liu, X.; Wang, H. Motives for outward FDI of Chinese private firm: Firm resources, Industry Dynamics and Government Policies. Manag. Organ. Rev. 2010, 7, 223–248. [Google Scholar] [CrossRef]
  64. Tadese, B.; Ryan, M. Export platforms and the industry-specific FDI-Trade relationship. J. Econ. Integr. 2005, 20, 644–671. [Google Scholar] [CrossRef]
  65. Gray, H.P. International Trade and Foreign Direct Investment: The Interface in Globalization, Trade and Foreign Direct Investment; Dunning, J.H., Ed.; Elsevier: Oxford, UK, 1998; pp. 19–27. [Google Scholar]
  66. Camarero, M.; Tamarit, C. The export and import demand for manufactured goods: The role of FDI. Rev. World Econ. 2004, 140, 347–375. [Google Scholar] [CrossRef]
  67. Braconier, H.; Norback, P.-J.; Urban, D. Multinational enterprises and wage cost: Vertical FDI revisited. J. Int. Econ. 2005, 67, 446–470. [Google Scholar] [CrossRef]
  68. Deng, P. Outward investment by Chinese MNCs: Motivation and implications. Bus. Horiz. 2004, 47, 8–16. [Google Scholar] [CrossRef]
  69. Lipsey, R.E.; Sjöholm, F. FDI and wage spillovers in Indonesian manufacturing. Rev. World Econ. 2004, 140, 321–332. [Google Scholar] [CrossRef]
  70. Cesare, L.D.; Sportelli, M. Fiscal policy lags and income adjustment processes. Chaos Soliton Fractals 2013, 45, 433–438. [Google Scholar] [CrossRef]
Figure 1. China’s OFDI in Indonesia: Number of projects and concentration indexes from 2006 to 2016.
Sustainability 10 04632 g001
Figure 2. China’s focus on Indonesian investments from 2006 to 2016.
Sustainability 10 04632 g002
Figure 3. Spatial trends of China’s OFDIs in Indonesia from 2006 to 2016.
Sustainability 10 04632 g003
Figure 4. Local spatial evolution of China’s OFDI in Indonesia.
Sustainability 10 04632 g004
Table 1. Model variables and data sources.
Variable NameVariable SymbolVariable DescriptionData Sources
Investment Dependent variableIndonesian Coordinating Investment Board
Project
Investment convenienceEDElectricity distribution in Indonesian provinces (GWH)The Indonesian statistical yearbook
Human resourcesWNThe number of labors in Indonesian provinces (person)The Indonesian statistical yearbook
WAMonthly average worker wages in Indonesian provinces (thousand rupiahs)The Indonesian statistical yearbook
Economic developmentPGDPPer capita GDP in Indonesian provinces (thousand rupiahs)The Indonesian statistical yearbook
Openness levelEXExport amount in Indonesian provinces (million dollars)The Indonesian statistical yearbook
FDIAll foreign direct investment in Indonesia provinces (million dollars)The Indonesian statistical yearbook
Institutional factorsFEGovernment fiscal expenditures in Indonesia provinces (million rupiahs)The Indonesian statistical yearbook
DT2014One year after “21st Century Maritime Silk Road” was proposedTime dummy variable
Political relationsFCThe number of friendly cities in China and IndonesiaThe China Friendship Cities Federation website
Table 2. Random effects regression model results.
VariableInvestment Random Effects ModelProject Random Effects Model
Regression CoefficientZ ValueSig.Regression CoefficientZ ValueSig.
ED1.8521.320.1881.0801.310.191
WN1.0210.840.403−0.796−1.060.288
FE−3.801−2.210.027−0.104−0.130.897
WA1.4160.390.7000.5340.240.808
FC−3.180−1.700.089 −0.273−0.220.824
PGDP1.4021.950.0510.3911.410.159
EX−0.290−2.280.022−0.087−1.990.046
FDI0.6241.390.1660.0500.330.743
DT2014−0.206−0.120.9070.8531.150.248
Table 3. Step-wise regression model results.
VariableInvestment Step-Wise
Regression Model
Project Step-Wise
Regression Model
Regression CoefficientT ValueSig.Regression CoefficientT ValueSig.
EX−0.198−1.740.099
WN1.3764.610.000
FC−3.959−3.470.003
FE 0.8715.660.000
WA 2.5032.970.008

