Article

Relations between Agri-Environmental, Economic and Social Dimensions of Farms’ Sustainability

by
Piotr Sulewski
1,*,
Anna Kłoczko-Gajewska
2 and
Wojciech Sroka
3
1
Faculty of Economic Sciences, Department of Economics and Organisation of Enterprises, Warsaw University of Life Sciences—WULS, Nowoursynowska 166, 02-787 Warsaw, Poland
2
Faculty of Economic Sciences, Department of Economics and Economic Policy, Warsaw University of Life Sciences—WULS, Nowoursynowska 166, 02-787 Warsaw, Poland
3
Institute of Economic and Social Sciences, University of Agriculture in Krakow, Al. Mickiewicza 21, 31-120 Krakow, Poland
*
Author to whom correspondence should be addressed.
Sustainability 2018, 10(12), 4629; https://doi.org/10.3390/su10124629
Submission received: 14 November 2018 / Revised: 2 December 2018 / Accepted: 3 December 2018 / Published: 6 December 2018
(This article belongs to the Section Sustainable Agriculture)

Abstract

:
Attempts to measure sustainability of farms are usually based on indicators of a set of sustainability dimensions. According to the literature, analyses should (but quite often do not) cover not only the level, but also the relations between the sustainability dimensions, because we could expect complementarity, synergies or competition between the sustainability goals. The aim of this paper was to measure and assess the interdependencies between dimensions of farms’ sustainability. The research was carried out on 601 farms that participate in the Polish Farm Accountancy Data Network (FADN), with the use of standard FADN data supported by additional information from interviews. Based on many variables, economic, environmental, social, and composite sustainability indices were collected. From the correlation and correspondence analyses it was concluded that the farms reached the balance of all three dimensions simultaneously when the level of sustainability indices was medium, while a high level of sustainability in one dimension made it very difficult to reach a high level in the others. It was also emphasized that assessing farms’ sustainability with the use of a simple aggregation of variables may be not correct since sustainability goals may compete with each other.

1. Introduction

The concept of sustainable development became a popular topic for discussion among economists and politicians after the publication of the Report of the World Commission on Environment and Development, “Our Common Future”. The report contained one of the most commonly used definitions of sustainable development: “to ensure that it meets the needs of the present without compromising the ability of future generations to meet their own needs” [1] (p. 54). Reaching this goal is possible only when the decisions are made taking into account economic, social and environmental issues [2,3]. When analyzing sustainability, we should be aware of the fact that the concept of “sustainable development” is multidimensional. Consequently, its analyses should include interdependencies between its dimensions, since ultimately it is the joint effect of all processes taking place within all the sustainability components that matters, and not the level of each of the parameters taken separately (or a simple sum of these). Concentrating on only one of the dimensions (e.g., environmental) is valuable, as it makes identifying certain problems easier. Nevertheless it does not improve our understanding of the true sustainability of an object or a system as a whole [4]. This seems to be particularly important in the case of agriculture, where family farms dominate and play a key role in the long-term maintenance of rural areas specializing in agricultural activities [5]. Family farming is also linked with sustainability by various socio-economic characteristics, greater concern for the use of natural resources, and concentration on environmentally respectful practices [5,6]. As Ikerd [7] emphasized, family farms “are the best hope for a sustainable future for farming and for humanity”; however, this requires reaching a harmony between environmental, social and economic perspectives of sustainability. In this context, the objective of this paper was to identify and evaluate the relationships between basic dimensions of sustainability at a farm level. The hypothesis was that farms are in general characterized by significant differences between their levels of sustainability, depending on their dimensions. Confirming this would suggest that assessing farm sustainability based only on one composite indicator would lead to improper assessment of farm sustainability (in the cases when one sustainability dimension would receive a very high grade, and the other a very low one). We take the view that sustainability is an integral whole, thus a low level of one dimension cannot be substituted by a high level of another—especially on a farm level, where sustainability is dependent on the farm’s weakest link.

2. Principals of the Sustainability Concept—Literature Review

2.1. Origin of the Sustainability Concept

According to Ciegis et al. [4], in economic papers there are over 100 definitions of sustainable development, while Hayati [8] found as many as 44 definitions of sustainable agriculture published between 1984 and 2016. Taking into consideration the number and variety of the definitions published within the last 30 years, it seems reasonable to look for the roots of sustainability and sustainable development in order to understand the principles of this idea. Although the origins of discussions on the sustainable development concept are most commonly associated with the report “Our Common Future” mentioned in the Introduction [1,9,10], its history is much longer [11,12], especially if we refer not only to theoretical deliberations, but to practical actions as well, particularly in agriculture and forestry. The concept of keeping the land fertile for future generations and at the same time increasing the yields for present users is not new. One of the oldest concepts of such a kind was practiced in China, where the earliest records of integrated crop and livestock farming date back to 1600–800 BC [13]. In European history there were also some practices that we can nowadays understand as referring to sustainable agriculture, such as the three-field system and (since the 17th century) four-field rotation [14]. Concern for the soil quality most probably had more to do with caring for food security rather than with being environmentally aware, especially in the pre-industrial era when the human impact on the environment was either small or not understood.
Forestry was the first type of economic activity where people realized the impact of day-to-day actions on the environment in the long run. Probably the first formal publication describing management according to sustainability principles was a book by Hans Carl von Carlowitz (1645–1714) entitled Sylvicultura economica [15]. The author used the term “nachhaltende Nutzung gebe” (ensure sustainable use), which leads us to the term “Nachhaltigkeit” (sustainability) [16]. As Vehkamäki [16] (p. 3) indicates, “the sustainability expressed in his book (…) has had the threefold meaning from the beginning: economic, social and ecological sustainability”. Almost one hundred years later (1805), a German forester, Georg Ludwig Hartig, wrote the following definition of sustainability in his “Instructions for the Taxation of Forests”: “There will be no sustainable forest industry if lumbering in the forests is not based on sustainability. Every wise forest authority must assess the use of the state’s forest without delay and in such a way that our descendants can obtain at least as much gain from them as today’s generation does” (quoted in [15] (p. 12)). A similar opinion was shared by Plater [17] (p. 13), the author of the first Polish handbook of forestry; he stated that those “who cut their forests out of measure […] do wrong to their descendants”, while “those who use less than they would be able to do, […] deceive themselves”. Additionally, he stressed the aesthetical value of forests, affecting the wellbeing of people who walk in the nature.
Modern discussion on sustainability issues began when a book, “Spaceship Earth”, was published in 1966 by Barbara Ward. Basing on her 20-year experience of dealing with poverty in underdeveloped countries, she concluded that economic development cannot be seen separately from the problems of the natural environment. Limited resources and space were noticed also by Kenneth E. Boulding [18] and R. Carson [19]. A significant document, widely commented on, was the report published in 1972 by the Club of Rome ”The Limits to Growth”. It contained a catastrophic vision of decline in both population and industrial output if the economic growth paradigm continued to dominate. The concept of “sustainable development” was clearly articulated in another book by B. Ward (and R. Dubos): “Only One Earth. The Care and Maintenance of a Small Planet” [20,21], published after the UN conference “Human Environment” in 1972. Even though the conference attendants failed to conceptualize the complex relations between the natural environment and economic growth [22], the conclusions drawn from the discussions (published by Ward and Dubos) set the directions for future actions of humankind to ensure good living conditions both for present and future generations. These materials were later used by Brundtland and her team [1] to prepare the report that nowadays is a groundwork for most of the discussions on sustainability.

2.2. Dimensions of Sustainability

Even though the essence of the sustainability concept is clear enough [4], researchers use many different sustainability definitions and interpretations [23,24,25,26]. It can be assumed that the variety of approaches is the result of the universality of the concept [27,28,29]. Despite their variability, most of the definitions cover three types of goals, interpreted as the dimensions of sustainability: environmental, economic, and social [2,25,30]. In practice, sustainable development requires such actions that are economically viable, ecologically sound and socially acceptable. However, most authors concentrate on the way humankind uses natural resources [31]. There are also some publications concentrating on ethical aspects of the problem [32]. Many publications suggest widening the perspective in order to cover more dimensions than just social, economic, and environmental dimensions. It is quite popular to add an institutional component [33,34,35]. Some authors go a step further, covering more than four dimensions—for instance Seghezzo [36] suggested using five dimensions: “place” understood in terms of nature, culture and politics, and additionally “permanence” and “persons”. On the other hand, Mauerhofer [37] presented a completely different approach: a ”3-D Sustainability”. He described a three-dimensional cone consisting of three types of capital (natural, social and economic) and three types of capacity (environmental, social, economic), while the cone’s diagonal sides represent the limits of the environmental system. The attempts to widen the classical three-dimensional understanding of sustainability can be understood as a search for a more practical approach to the concept, because the realization of sustainable development remains highly problematic [4,38]. Nevertheless, all of the sustainability dimensions are relatively rarely interpreted as a system, and not merely as a set of indicators. This issue is addressed in the next part of the paper.

2.3. Integrating Economic, Social, and Environmental Dimensions

Integration of economic, social, and environmental dimensions is crucial to achieving sustainable development [39]. According to Voinov and Smith [31], this approach is important, because a long-term development of one subsystem is somewhat dependent on the others. According to them, economic and ecological components should be considered together, including their interplay, because finally they constitute one system. A similar view is represented by Ciegis et al. [4], Jiliberto [40] and Bardy et al. [35] (after Kahuthu [41]). Sadok et al. [42] (p. 163) point to a similar problem, highlighting that in order to assess sustainability in a realistic way, we need “the integration of diverse information concerning economic, social and environmental objectives; and the handling of conflicting aspects of these objectives as a function of the views and opinions of the individuals involved in the assessment process”. The need for integrated perception of sustainability was also indicated by Saifi and Drake [43], who—referring to Norgaard’s [44] “Development Betrayed”—emphasized the dynamic nature of this phenomenon. According to these authors [43] (p. 24), “the challenge of agricultural sustainability can be fruitfully addressed within an analytical framework that consciously and explicitly considers agricultural development as consisting of processes of coevolution involving agriculture and the surrounding ecological and socioeconomic systems”.
The relevance of studying relationships between various dimensions of sustainable development is also indicated by Pierantoni [45], although she notes that sustainability can be defined in relation to only one dimension (environmental or social). However, in such a case the interpretation of sustainability focuses on impact analysis, which is useful mostly for analyzing short periods. This view is shared by Ciegis et al. [4] (p. 33), who indicate that in a one-dimensional analysis “sustainability only involves specific problems in a certain dimension, and hence relationships with development in other fields may be very weak”.
The discussion on the choice of sustainability dimensions is closely linked with the concepts of “strong” and “weak” sustainability [46,47,48]. If realizing the sustainability concept in practice means leaving for the future generations the same amount of capital as we possess now, the question is: should we count all the types of capital (natural, man-made and human) together or each of them separately? Those who claim that the types of capital are substitutable allow the calculation of all of them jointly. This approach is labelled “weak sustainability”, while “strong sustainability” is based on an assumption that types of capital are not substitutable but complementary and, thus, should be calculated separately [46,48,49]. In practice it would mean that non-renewable resources shouldn’t be used for production processes at all. This approach can be tempting when we want to save the natural environment, but in practice it is very difficult to follow, especially if we also take into account social issues (increase of the well-being of people) [48,49]. The most important thing is to identify the critical natural capital, that is, the resources which perform irreplaceable functions [50].
Agriculture makes use of such non-renewable resources as the soil and its ecosystem. Nevertheless, sustainable agriculture can follow not only “weak”, but also “strong” sustainability rules. The key issue is to define the critical natural capital that has to be passed to the future generations as a legacy. Such a legacy is, without doubt, the soil; even though it exists for centuries, it can be made unfertile through improper farming practices. As a consequence, the assessment of agricultural systems in terms of sustainability is, in practice, done as the assessment of agricultural practices’ correctness. It should be also noted that the dichotomy of “strong” and “weak” sustainability is not the only existing approach, as for example, Turner et al. [51] suggested using four different sustainability levels, depending on the level of realizing social and economic goals.

2.4. Measuring Sustainability of Agriculture (Branch and Farm Level)

Agriculture plays an important role in sustainability issues [52,53]. Despite the variety of definitions used by researchers, there are some common features of what we call ”sustainable agriculture”. According to the mainstream approach, it is based on three basic rules: “ecological soundness” (which refers to the preservation and improvement of the natural environment); “economic viability” (which refers to maintenance of yields and productivity of crops and livestock); and “social acceptability”, which refers to self-reliance, equality and improved quality of life [54,55,56,57]. Some researchers widen this three-dimensional concept. For instance, Rasure ([58] after [8] (p. 19)), while describing multi-dimensional aspects of sustainability, indicated 13 dimensions of sustainable agriculture, such as “technological appropriateness, economic feasibility, economic viability, environmental soundness, temporal stability, efficiency of resource use, local adaptability, social acceptability, political acceptability, administrative manageability, cultural desirability, equity and productivity”.
Empirical research of sustainability is most often based on indicators that are supposed to reflect the level of compliance of the observed parameter with the sustainability paradigm [59,60]. However, we should not forget that these indicators are not perfect [59,61]. The assessment of sustainability is very difficult because of its dynamic character [62]; this refers to measuring sustainability in agriculture, as well. A broad set of indicators referring to both sustainable development in general and sustainable agriculture specifically can be found, among others, in publications of the following authors: Briassoulis [63], UN [64], Hayati [8], Reytar et al. [65], Hayati et al. [66], Latruffe et al. [60], and Majewski [3]. Ideally, the indicators should cover subsystems such as the farm field (where agronomic factors are paramount), the farm unit (where microeconomic concerns are primary), the regional physical environment (where ecological factors are central), and national as well as international economies (where macroeconomic issues are the most important) [67].
Briassoulis [63] stresses that the bulk of the indicators used by researchers refer to a single dimension of sustainable development. Many of the papers concentrate on the agro-ecological component of the sustainability (e.g., [3,8,68,69,70,71,72]). The agro-ecological component is most often measured by the assessment of soil erosion, soil quality, water quality, quality of agricultural practice, use of fertilizers, use of pesticides, crop rotation, cultivation technologies, trends in climate changes, the renewal of organic matter in soil, soil coverage index, etc. A literature review prepared by Reytar et al. [65] concludes that most of the existing indicators of sustainability referring to agriculture (regardless of the level of analysis) concentrate mostly on various aspects of the environmental dimension. However, some of the papers put more stress on the social [73,74,75] or economic aspects of sustainability [76,77,78,79]. The social aspect is most often measured by the level of education, experience and skill in farming, social status of the family, ways of supporting decision making, living conditions, involvement in community issues, safety, etc. The economic dimension most often covers work productivity, efficiency, agricultural income, revenue, off-farm income, and production potential measured as the asset value. Nevertheless, social sustainability of farms (and, more broadly, of agriculture) is the dimension that would need the most development of indicators in the future [60]. The emphasis on the environmental dimension can be explained by the specificity of agricultural production, which depends strongly on the natural environment, and especially on the quality of soil [80,81,82,83].
Similar to the case of the general sustainability concept, researchers dealing with sustainability in agriculture stress the importance of integrating the sustainability dimensions [4,26] through aggregating partial indicators. Many researchers make an effort to capture various dimensions of sustainability by preparing composite indicators [84,85]. The indicators can be calculated using a variety of methods. The most popular of these consists of calculating sums or weighted means, or using normalization techniques (linear scaling techniques, Gaussian normalization distance to target, ranking by experts, categorical scales etc.) [60,86,87]. There are also some more sophisticated methods. For instance, Štreimikienė and Baležentis [88] listed a set of methods used for aggregating three dimensions of sustainability. These are (among others): the goal programming model, principal component analysis, multi-criteria decision-making (MCDM) method or the analytic hierarchy process (AHP). Sustainability assessment through such methods is usually based on the expert assessment of alternatives [88]. Talukder et al. [84] (p.11) underline that “the aggregation of a multidimensional set of indicators into a unique composite indicator can facilitate the understanding of a complex concept such as agricultural sustainability”. Nevertheless, it is important to remember that the choice of aggregation method can affect the results and, in consequence, the assessment of the level of sustainability [84,89]. While talking about agriculture and farms in particular, an important drawback is the lack of access to appropriate data [90]. The main shortcomings of the aggregation methods are losing important information as a result of calculating means and adding constructs that are not comparable [91]. Even though synthetic indicators seem useful to assess sustainability of particular items, they may in fact lead to oversimplification. This is why their real value is still discussed [92,93]. For instance, it is disputable whether low levels of one dimension (for example, environment) can be compensated by high levels in another dimension (usually economic). It is a common problem in calculating aggregated indicators [4,31,35,42]. This approach leads to the use of the “weak sustainability” approach. The authors of this paper, looking for relations between the sustainability dimensions (that can be roughly understood as three types of capital) assumed that it is impossible to make up for negligence in the environmental protection layer with economic results. This approach places us close to the “strong sustainability” concept.
It is not common to analyze relations between various sustainability components; however, some publications on this issue do exist. Such an effort was made by Rajaram and Das [94], who suggested using “a fuzzy rule-based approach” to model the interactions of sustainability components in an agro-ecosystem. As well as Saifi and Drake [43], as was written above, the European Commission stressed the need to analyze relations between sustainability dimensions [95]. There are also some papers containing analyses of dependencies between chosen sustainability components and sets of farms’ characteristics. For instance, Piedra-Muñoz et al. [5] tried to assess relations between sustainability (understood in terms of socio-economic characteristics, environmentally respectful practices and innovation) and profitability. This approach somewhat reflects relations between the economic dimension and the remaining sustainability dimensions. The case study analysis presented by Piedra-Muñoz et al. revealed that socio-economic and environmental-innovative components of sustainability are the drivers of profitability. Interdependencies and synergy effects of sustainability components were recently analysed by Galdeano-Gómez et al. [96,97], while relations between the social and economic dimensions were examined by Torres et al. [98]. The possible conflict between economic and environmental goals was presented by Dillon et al. [92]. Nevertheless, the relations between sustainability components seem seriously under-researched. Thus, the authors of this paper tried to fill this gap, at least partially.
3. Materials and Methods

3.1. Case Study Area—Background Information on Polish Agriculture

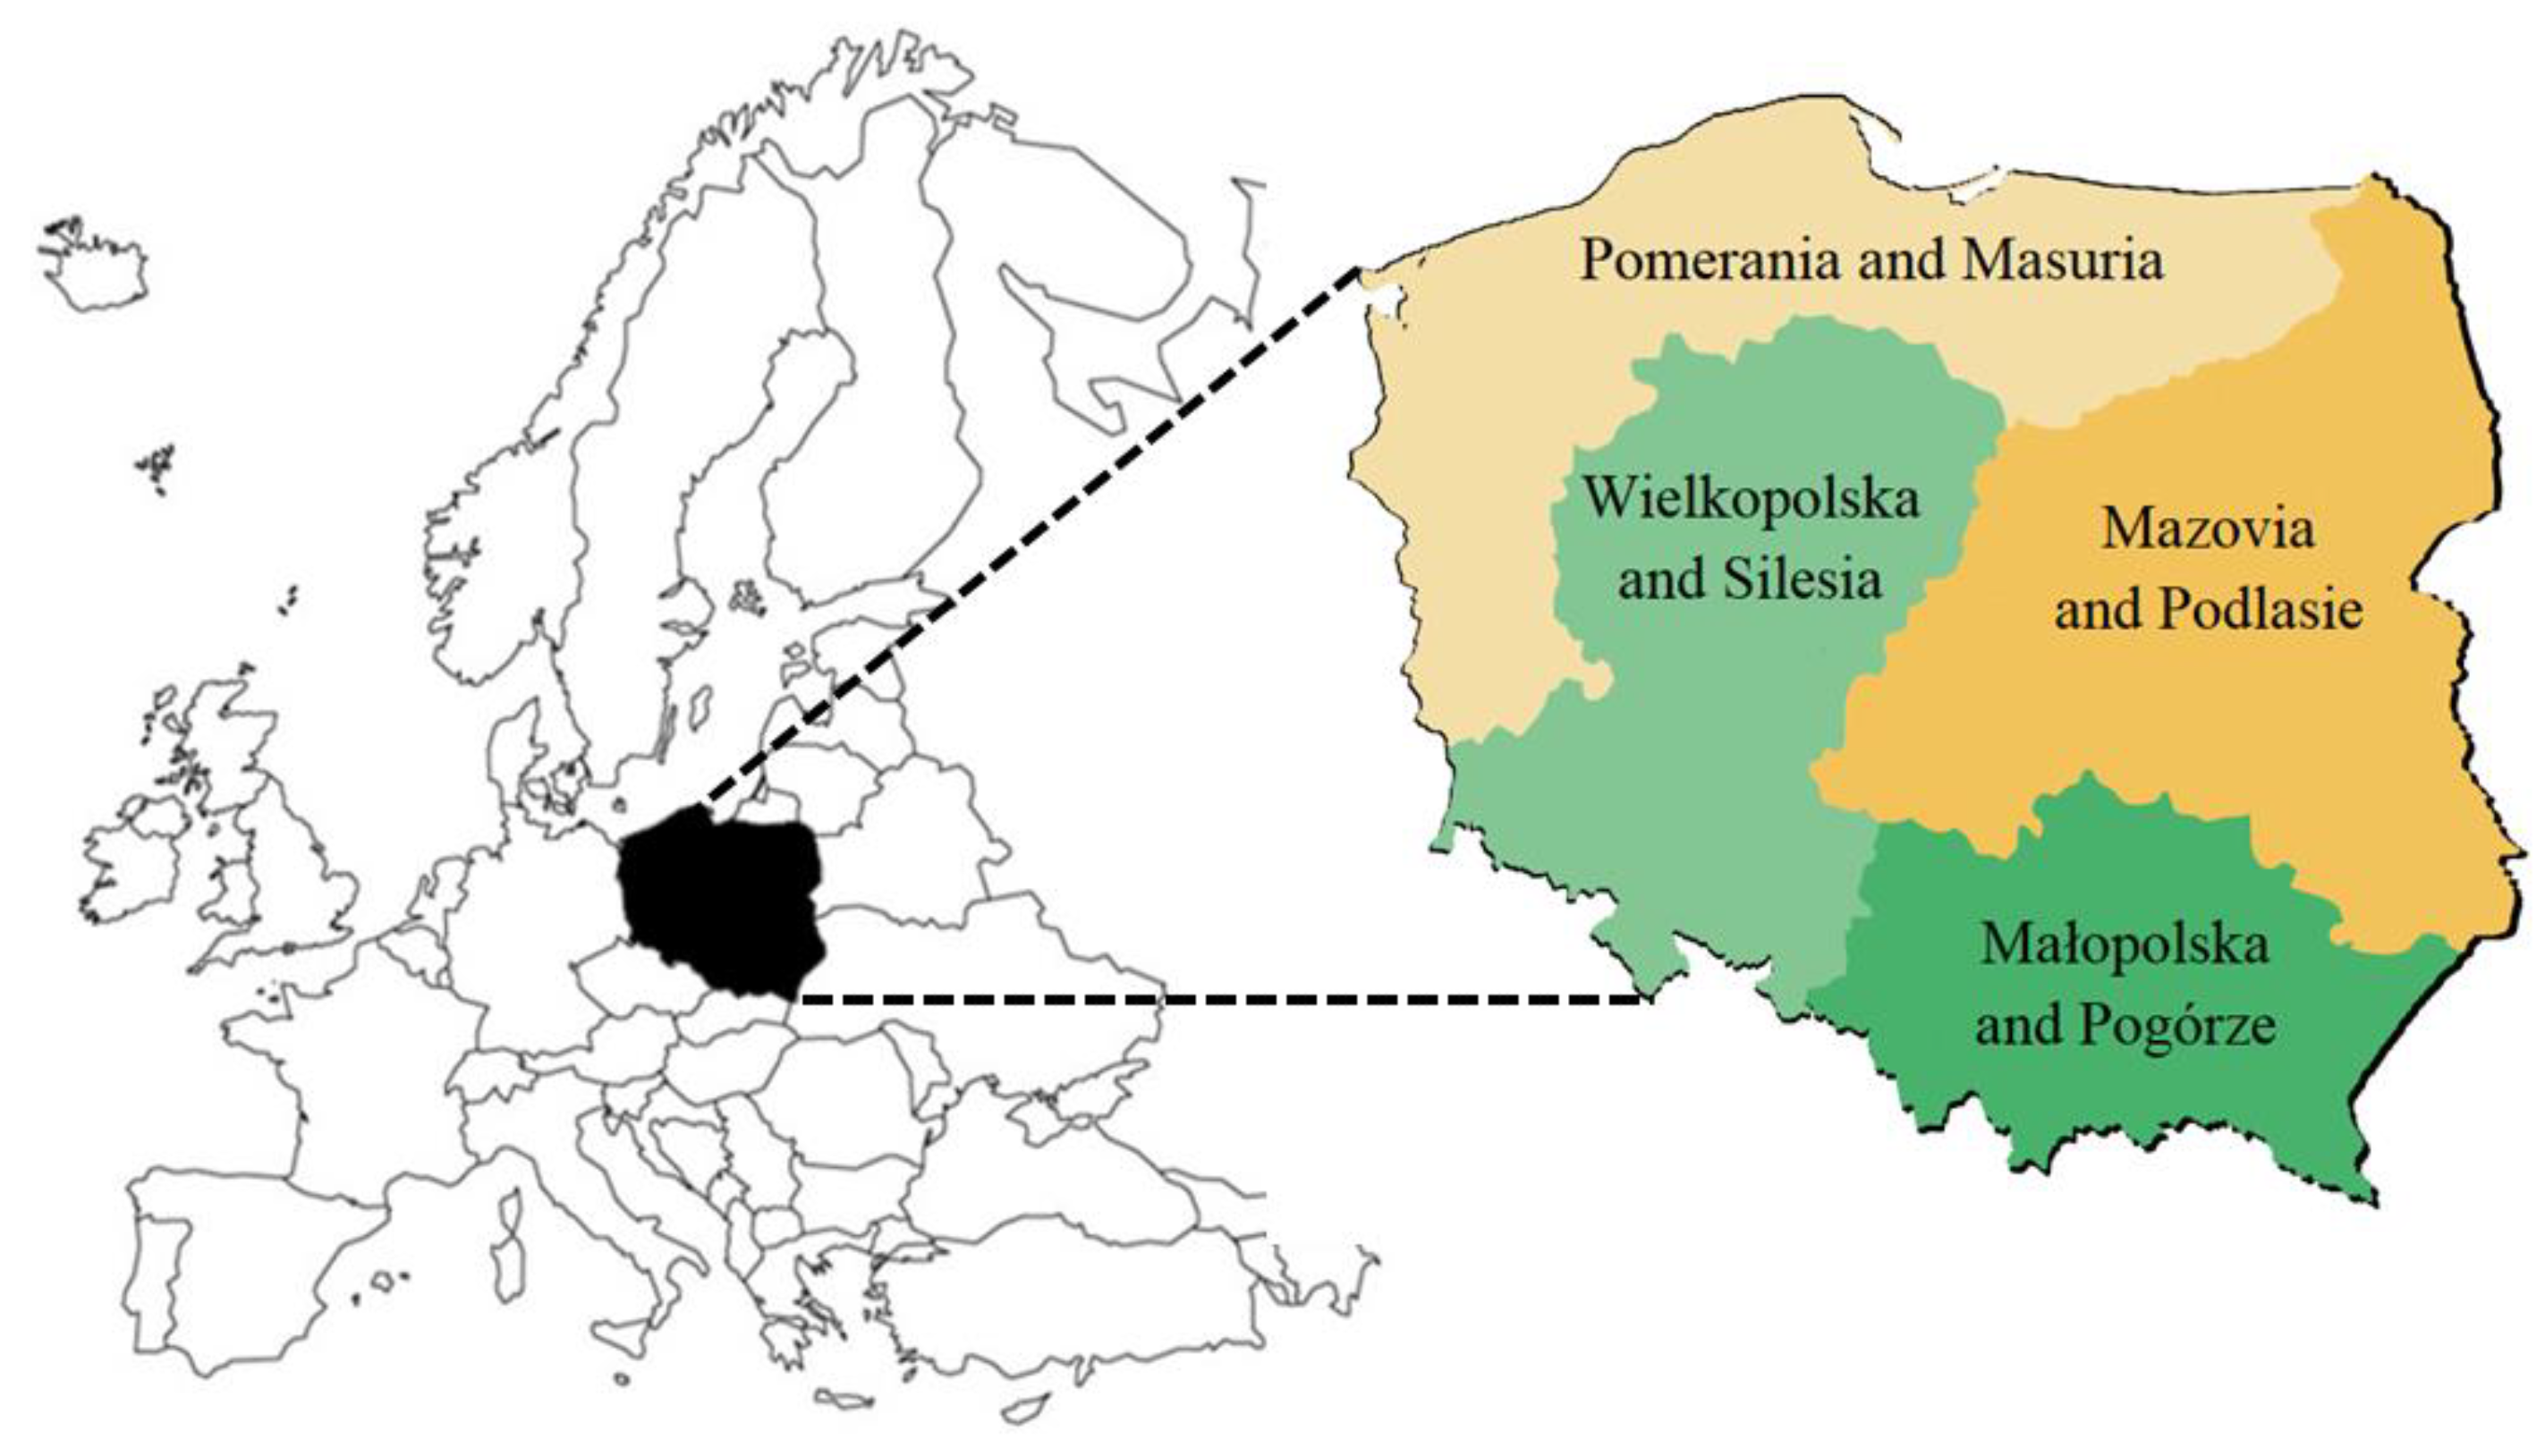
Poland is the largest country in Central and Eastern Europe (Figure 1). Poland’s utilised agricultural area constitutes one-fifth of the whole agricultural area of the EU, giving Poland third place in the Union, after France and Spain. Moreover, Polish farms constitute 12.5% of all farms in EU (after Romania and Italy), thus the impact of Polish farms on the natural environmental and agricultural market in EU is significant [99]. Compared to other EU countries, Polish farming is rather labor-intensive, however, this is changing [100].
Polish agriculture is based mostly on family farms. Characteristically, the farms are small (with significant regional variability), as an average farm covers 10.3 ha of utilised agricultural area (EU average is 18 ha) [100]. Contrary to the majority of post-socialist countries, Polish agriculture has never been dependent on state-owned farms, as over three-quarters of agricultural land has always been in private hands [101]. Consequently, farming is usually a family tradition, quite often supported by appropriate education, but not always (according to the national census, in 2010 only 41% of owners of individual farms had agricultural education, and half of them had finished only a special course) [102]. Farms in Poland are highly diversified by size, both in terms of occupied area and production potential. Table 1 presents the number of farms in Poland according to their economic size, calculated as the value of standard output.
This paper covers only farms participating in the Farm Accountancy Data Network (FADN), excluding the smallest ones, such as semi-subsistence farms or hobby farms. FADN covers only farms producing for the market, which in Poland means reaching EUR 4000 of standard output [103]. Consequently, the results of all further analyses concern only about 50% of farms, producing 94% of standard output, and at the same time covering 87% of utilized agricultural area and giving work to 67% of agricultural working units (Table 2).
Most of the farms participating in the Polish FADN are of mixed type, growing plants as well as breeding animals (45%). About one-quarter of the farms specialize in field crops, 13% in milk production, and the remainder concentrate on other grazing livestock (mainly cattle or sheep), other permanent crops, horticulture, pigs, and poultry (Figure 2).

3.2. Methods

This paper consists of two main parts. The first concerns measuring the sustainability level of farms (in general and by dimensions). The second part contains the analysis of interdependencies between the indicators of particular sustainability dimensions; it is based on correlation analysis and correspondence analysis.

3.2.1. Data Collection

Data used in this research were gathered from two sources: the Farm Accountancy Data Network database and structured face-to-face interviews with farmers. The FADN sample in Poland covers 12 100 respondents representing 730 000 farms exceeding EUR 4000 of standardized production. The database contains detailed information on costs, production values, and financial results of the farms, as well as basic information on the organization of work. Our sample consisted of 601 farms participating in the Polish FADN system. These objects were selected using a layer/random selection procedure, which covered:
  • 4 layers based on the criterion of specialization
  • 3 layers based on the criterion of standard production
  • 4 layers, which corresponded to the regions
The number of farms surveyed in each layer was determined using the Neyman [105] method in a manner analogous to that used for determining the sample size for FADN [106]:
n h = n N h σ h k = 1 L N k σ k
where:
  • nh—sample size in layer h,
  • n—sample size,
  • Nh—size of population in layer h,
  • σh—standard deviation standard h,
  • L—number of layers.
Interviews with farmers were conducted by advisers from regional extension centers, who coordinated the collection of data within the FADN system. Field surveys were carried out in 2017 and concerned behavioral aspects of the operation of farms, in particular attitudes towards environmental and societal aspects of sustainability. The data from interviews was added to relevant data available in the FADN database (farm costs, production values, financial results, and basic organizational data). Given that the applied layer-random sampling method reflects the structure of farms in the population surveyed by FADN, we can assume that it is representative for the population of farms being in scope of observation of the Polish FADN (in terms of economic size, type of production and region). The procedure of two-phase sampling are described in detail in statistical literature [107,108].

3.2.2. Variables Used in the Analysis

Basing on the literature review, we prepared a set of 109 parameters that could help to assess farm sustainability. Only the parameters that could clearly indicate the level of sustainability in a chosen dimension were used in further analyses. Basing on the method of Géniaux et al. [86], these parameters (Data Z = (z1,…, zp)) were the basis for the calculation of 51 “diagnostic variables” (Variables X = (x1,…, xn)) that were later aggregated into seven partial sustainability indicators (Sub-indicators Y = (y1,…, yi)):
  • indicator of the correctness of agricultural practice in plant production
  • indicator of the correctness of agricultural practice in livestock production
  • environmental perception indicator
  • economic potential indicator
  • production potential indicator
  • indicator of living conditions
  • mental comfort indicator
A more detailed description of all the parameters and variables can be found in the paper [109]. In the next phase of the research these sub-indicators were aggregated to assess three sustainability dimensions: economic, environmental, and social (Dimensions: M = (m1, …, m3)). All diagnostic variables were scaled to the 0-1 interval with the use of percentile method. (In descriptive statistics, this approach is used to categorize large datasets from highest to lowest values, or vice versa. Quartile, percentile and decile are a form of a quantile which divides a set of observations into samples that are easier to analyse and measure [110]). Each of the variable scores were assigned appropriate percentile ranks (objects from the highest percentile were given rank 1, from the next one 0.99, etc.). The “percentile rank” was further treated as a transformed value of the variable. Aggregated indicators were calculated as average values of appropriate sets of variables (or sets of indicators of lower level). The use of percentile ranks allowed for a rather even distribution of the transformed variables (which is important when we look for dependencies between certain indicators) and reduced the influence of the outliers.

3.2.3. Correlation Analysis and Multiple Correspondence Analysis (MCA)

The analytical work began with the correlation analysis (r-Pearson) of sustainability components. Taking into consideration that such a complex issue as sustainability involves interdependencies between its components, partial correlations were also calculated, to determine “clear” relations between the parameters, without the influence of the remaining ones. They were calculated with the use of the following formula:
r x i x j / x k = r x i x j r x i x k r x j x k ( 1 r x i x k 2 ) ( 1 r x j x k 2 )
where:
  • r x i x j / x k —partial correlation between variables x i and x j when the value of x k is fixed
  • r —correlation between the pair of variables.
In order to better understand the interdependencies between sustainability dimensions, the correlation analysis was followed by multiple correspondence analysis (MCA) [111,112,113]. Its logic is similar to that of factor analysis, but the use of qualitative data allows for more intuitive analysis of the data matrices. In order to transfer data from additive to ordinal, we divided them in the following way: sustainability indicator below or equal to 0.33 was described as low, above 0.66 as high, and all the remaining ones as medium. Of course, this simplification of the original data means losing many details from the picture, but allows us to grasp main tendencies. In the case of multiple correspondence analysis, the data is presented in a Burt matrix [114]. The Burt matrix is symmetrical (in this case 4 × 4) and consists of two-way frequency crosstabulation tables. The analysis of the Burt matrix can be complemented by two-dimensional or three-dimensional graphs, with the use of the method described by [115]. The procedure begins with the choice of the number of dimensions. Figure 3 presents the procedure used in the multiple correspondence analysis.

4. Results

4.1. Correlations between the Sustainability Components

Table 3 contains basic information (minimum, maximum, mean, and standard deviation) on the values of indices representing sustainability dimensions: economic, environmental, and social, as well as the composite indicator. Evidently, average values of indicators do not differ significantly depending on the dimension. The highest range (max–min) is observed in the economic dimension, and the smallest in the social one. We can conclude that farmers producing for the market have relatively similar living conditions and social comfort, while there are much higher differences in the economic potential of their farms.
These indices allow us to assess the level of the farms’ sustainability (in general and in particular dimensions), as well as to compare the farms with each other. Nevertheless, they do not allow us to draw conclusions on the nature of the relationships between these parameters in practice. This issue will be addressed in the following parts of the paper.
The relationships between the sustainability dimensions (including also the composite sustainability indicator) were analysed with the use of r-Pearson correlation. The results are presented in Table 4. It is clearly visible that there is a linear relation only between the sub-indices and the aggregated index (as a result of the aggregation procedure), while relations between the sub-indices are not so clear. All of the correlation coefficients were statistically significant (the significance of the correlations was tested with the use of the t-test for significance for a Pearson product-moment correlation coefficient) at p = 0.05, however, the correlations between social and environmental dimensions were weak (0.12). The economic indicator was correlated with the remaining two at the level close to 0.3. As for correlations between the composite sustainability indicator and each of its dimensions, it was the highest for the economic sub-indicator (0.82).
The complexity of the sustainability concept suggests that the relationships between indicators for specified dimensions may be affected by the others variables. In order to eliminate this potential influence, we have calculated partial correlations, which allow us to observe “pure” relations between two parameters after eliminating the aggregated influence of other dimensions of sustainability. The partial correlation coefficients were visibly higher than the previous ones, and—what is even more interesting—they were negative (Table 5). This suggests that a higher level of one dimension indicator is followed by a lower level of another. The highest correlation was visible between economic and environmental dimensions (−0.66), followed by the correlation between social and economic dimensions (−0.46). All were statistically significant at p = 0.05. This means that we can observe dependencies such as “profitable, but at the cost of the natural environment”, or “profitable, but at the cost of private life”, etc. Of course, in practice such relations are modified by other variables, but we should be aware of these dependencies while discussing the problems of sustainability.

4.2. Multiple Correspondence Analysis (MCA)

Table 6 presents the Burt matrix containing the sustainability dimensions. We can see that among 188 farmers characterized by a high level of environmental sustainability, only 56 scored high in the economic dimension, and only 43 in the social dimension. Moreover, only 65 reached the highest level of the aggregate indicator. Simultaneously, out of 105 farmers characterized by a high level of the economic dimension, only 56 reached a high level of the environmental indicator, and 30 of the social indicator. It is worth noting that it was much more probable to reach a medium level of more than one dimension, than in the case of a high one. For example, among 409 farms characterized by a medium level of the economic dimension, as many as 85% were characterized by a medium level of the social dimension, and 70% in the environmental dimension. We can also see that medium level of sustainability in sub-indicators was quite often followed by a medium level of the composite indicator. It can be concluded that for the farmers who are characterized by a medium level of any sub-indicator, it is not too difficult to keep the remaining sub-dimensions at a medium level. Generally speaking, a high level of an indicator in one sub-dimension is followed by lower level of indicator in the other, which confirms the conclusions derived from the analysis of partial correlations.
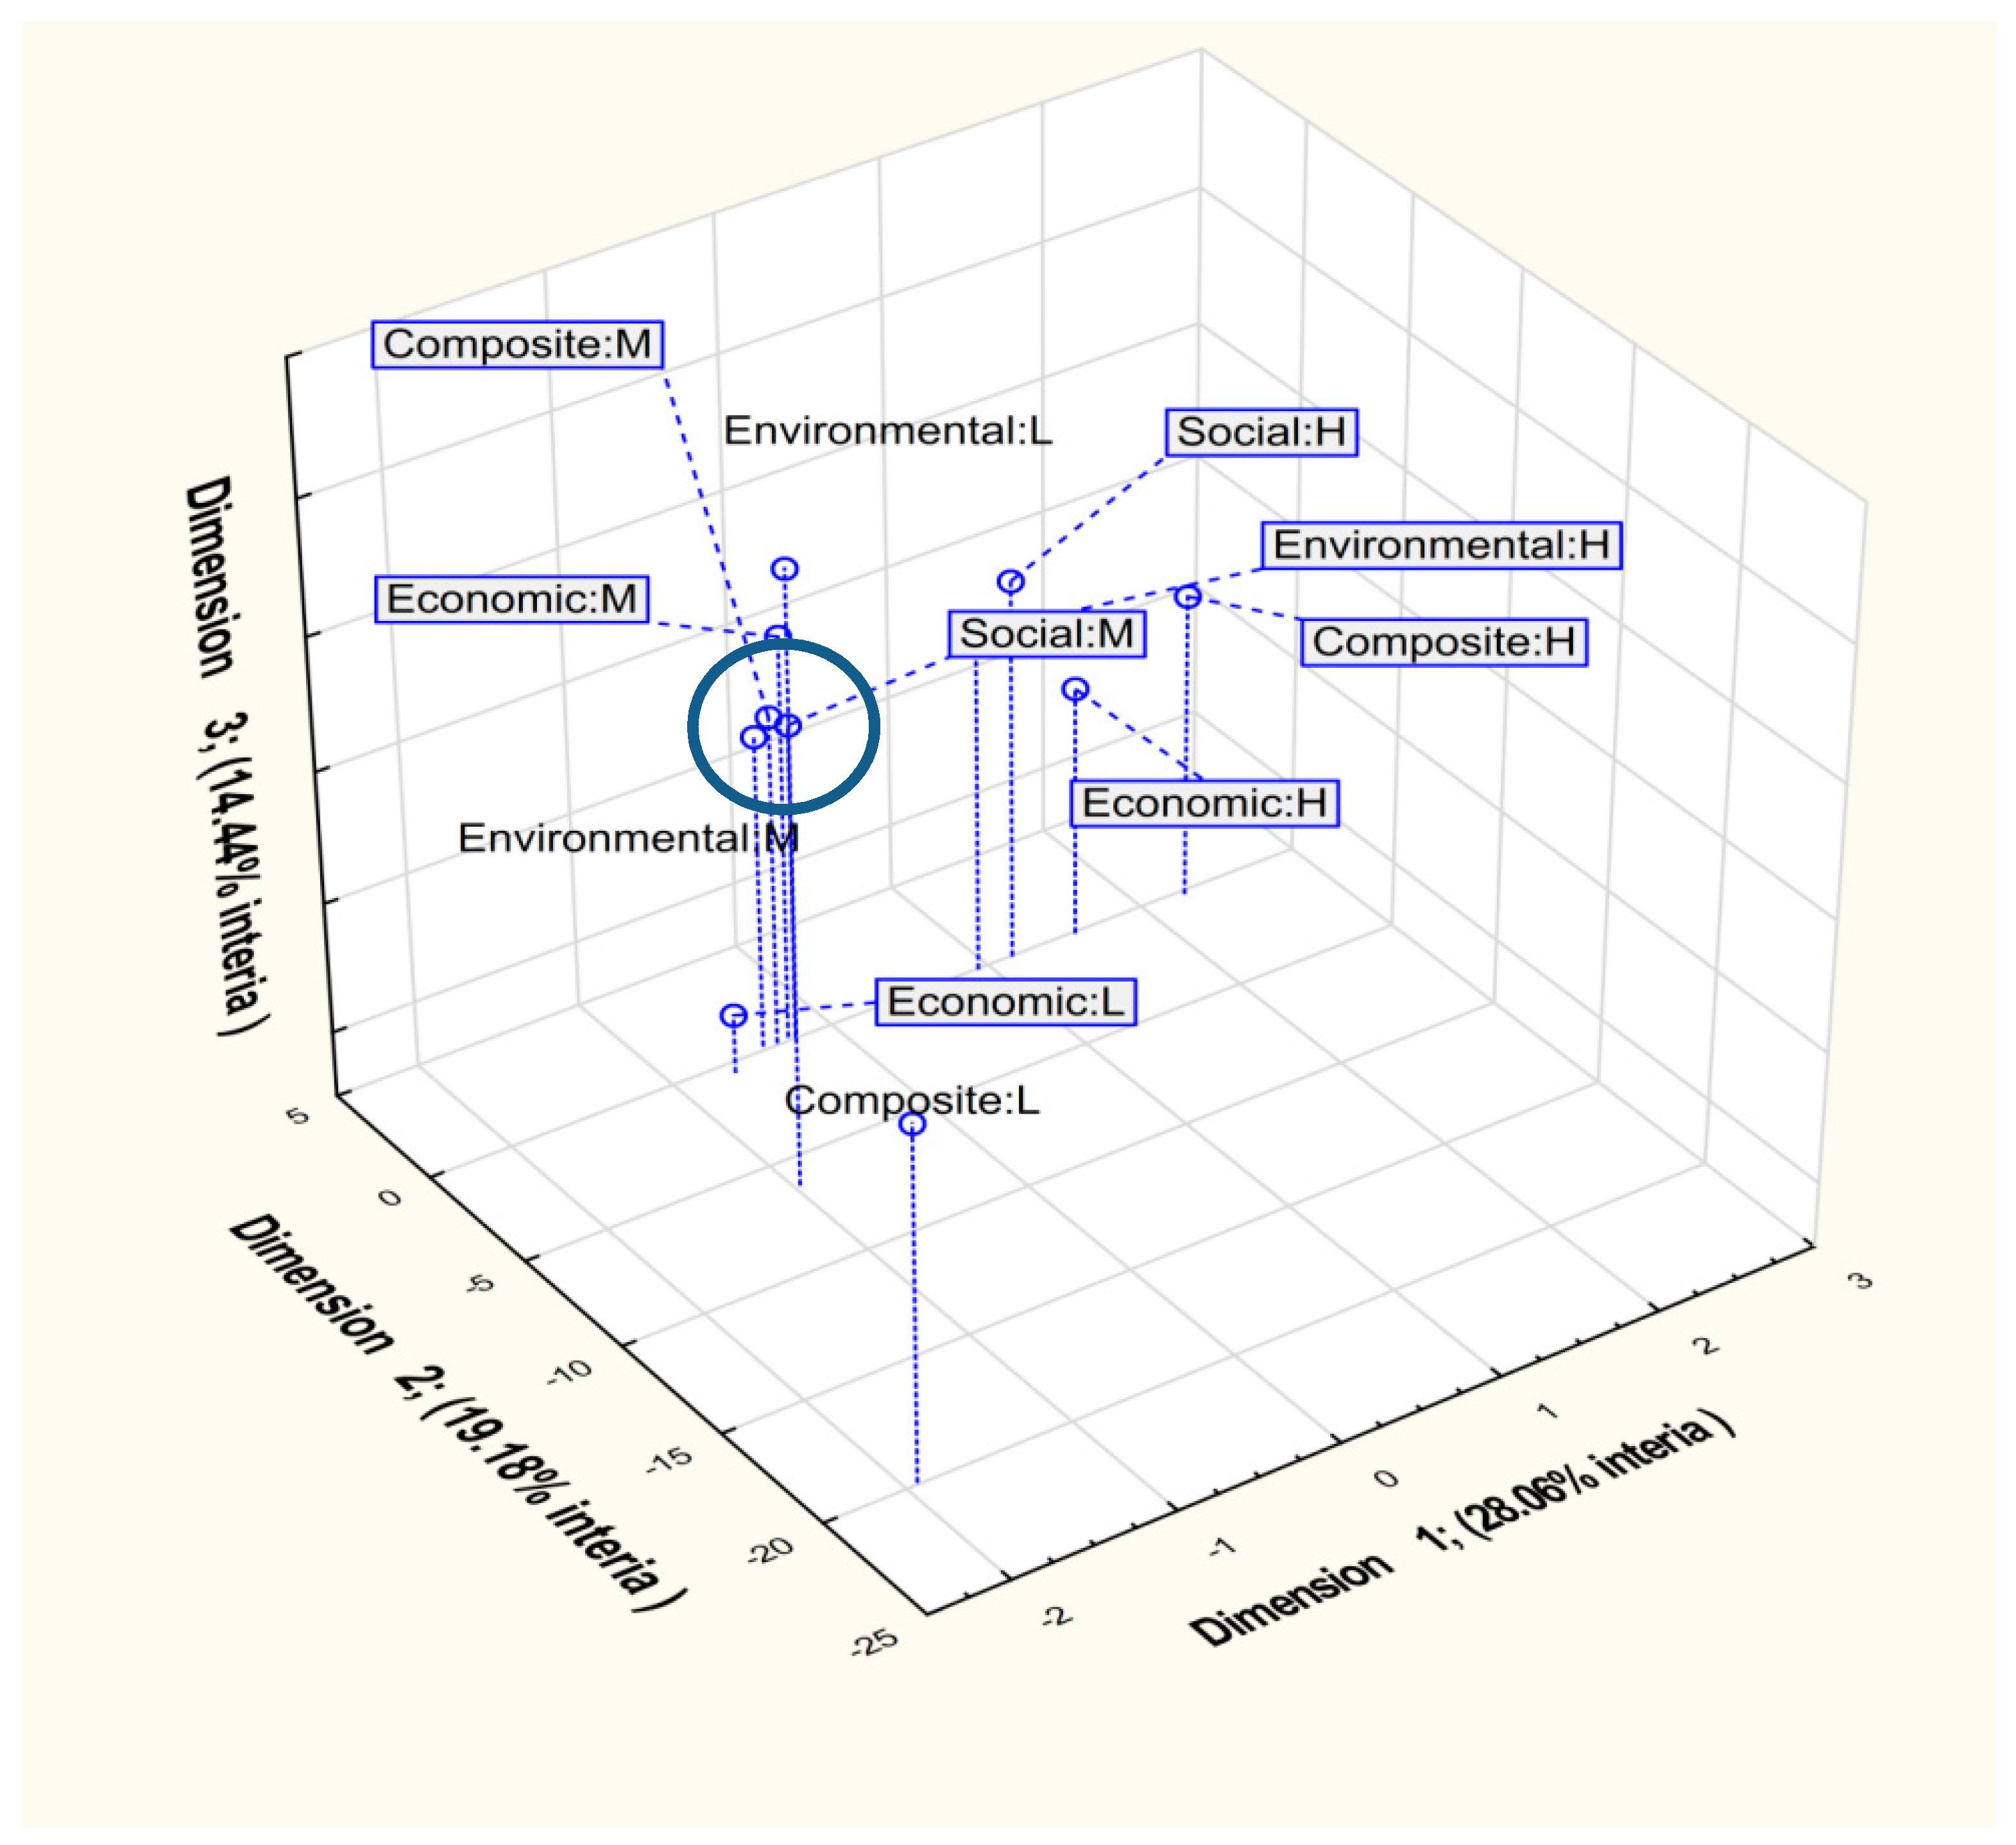
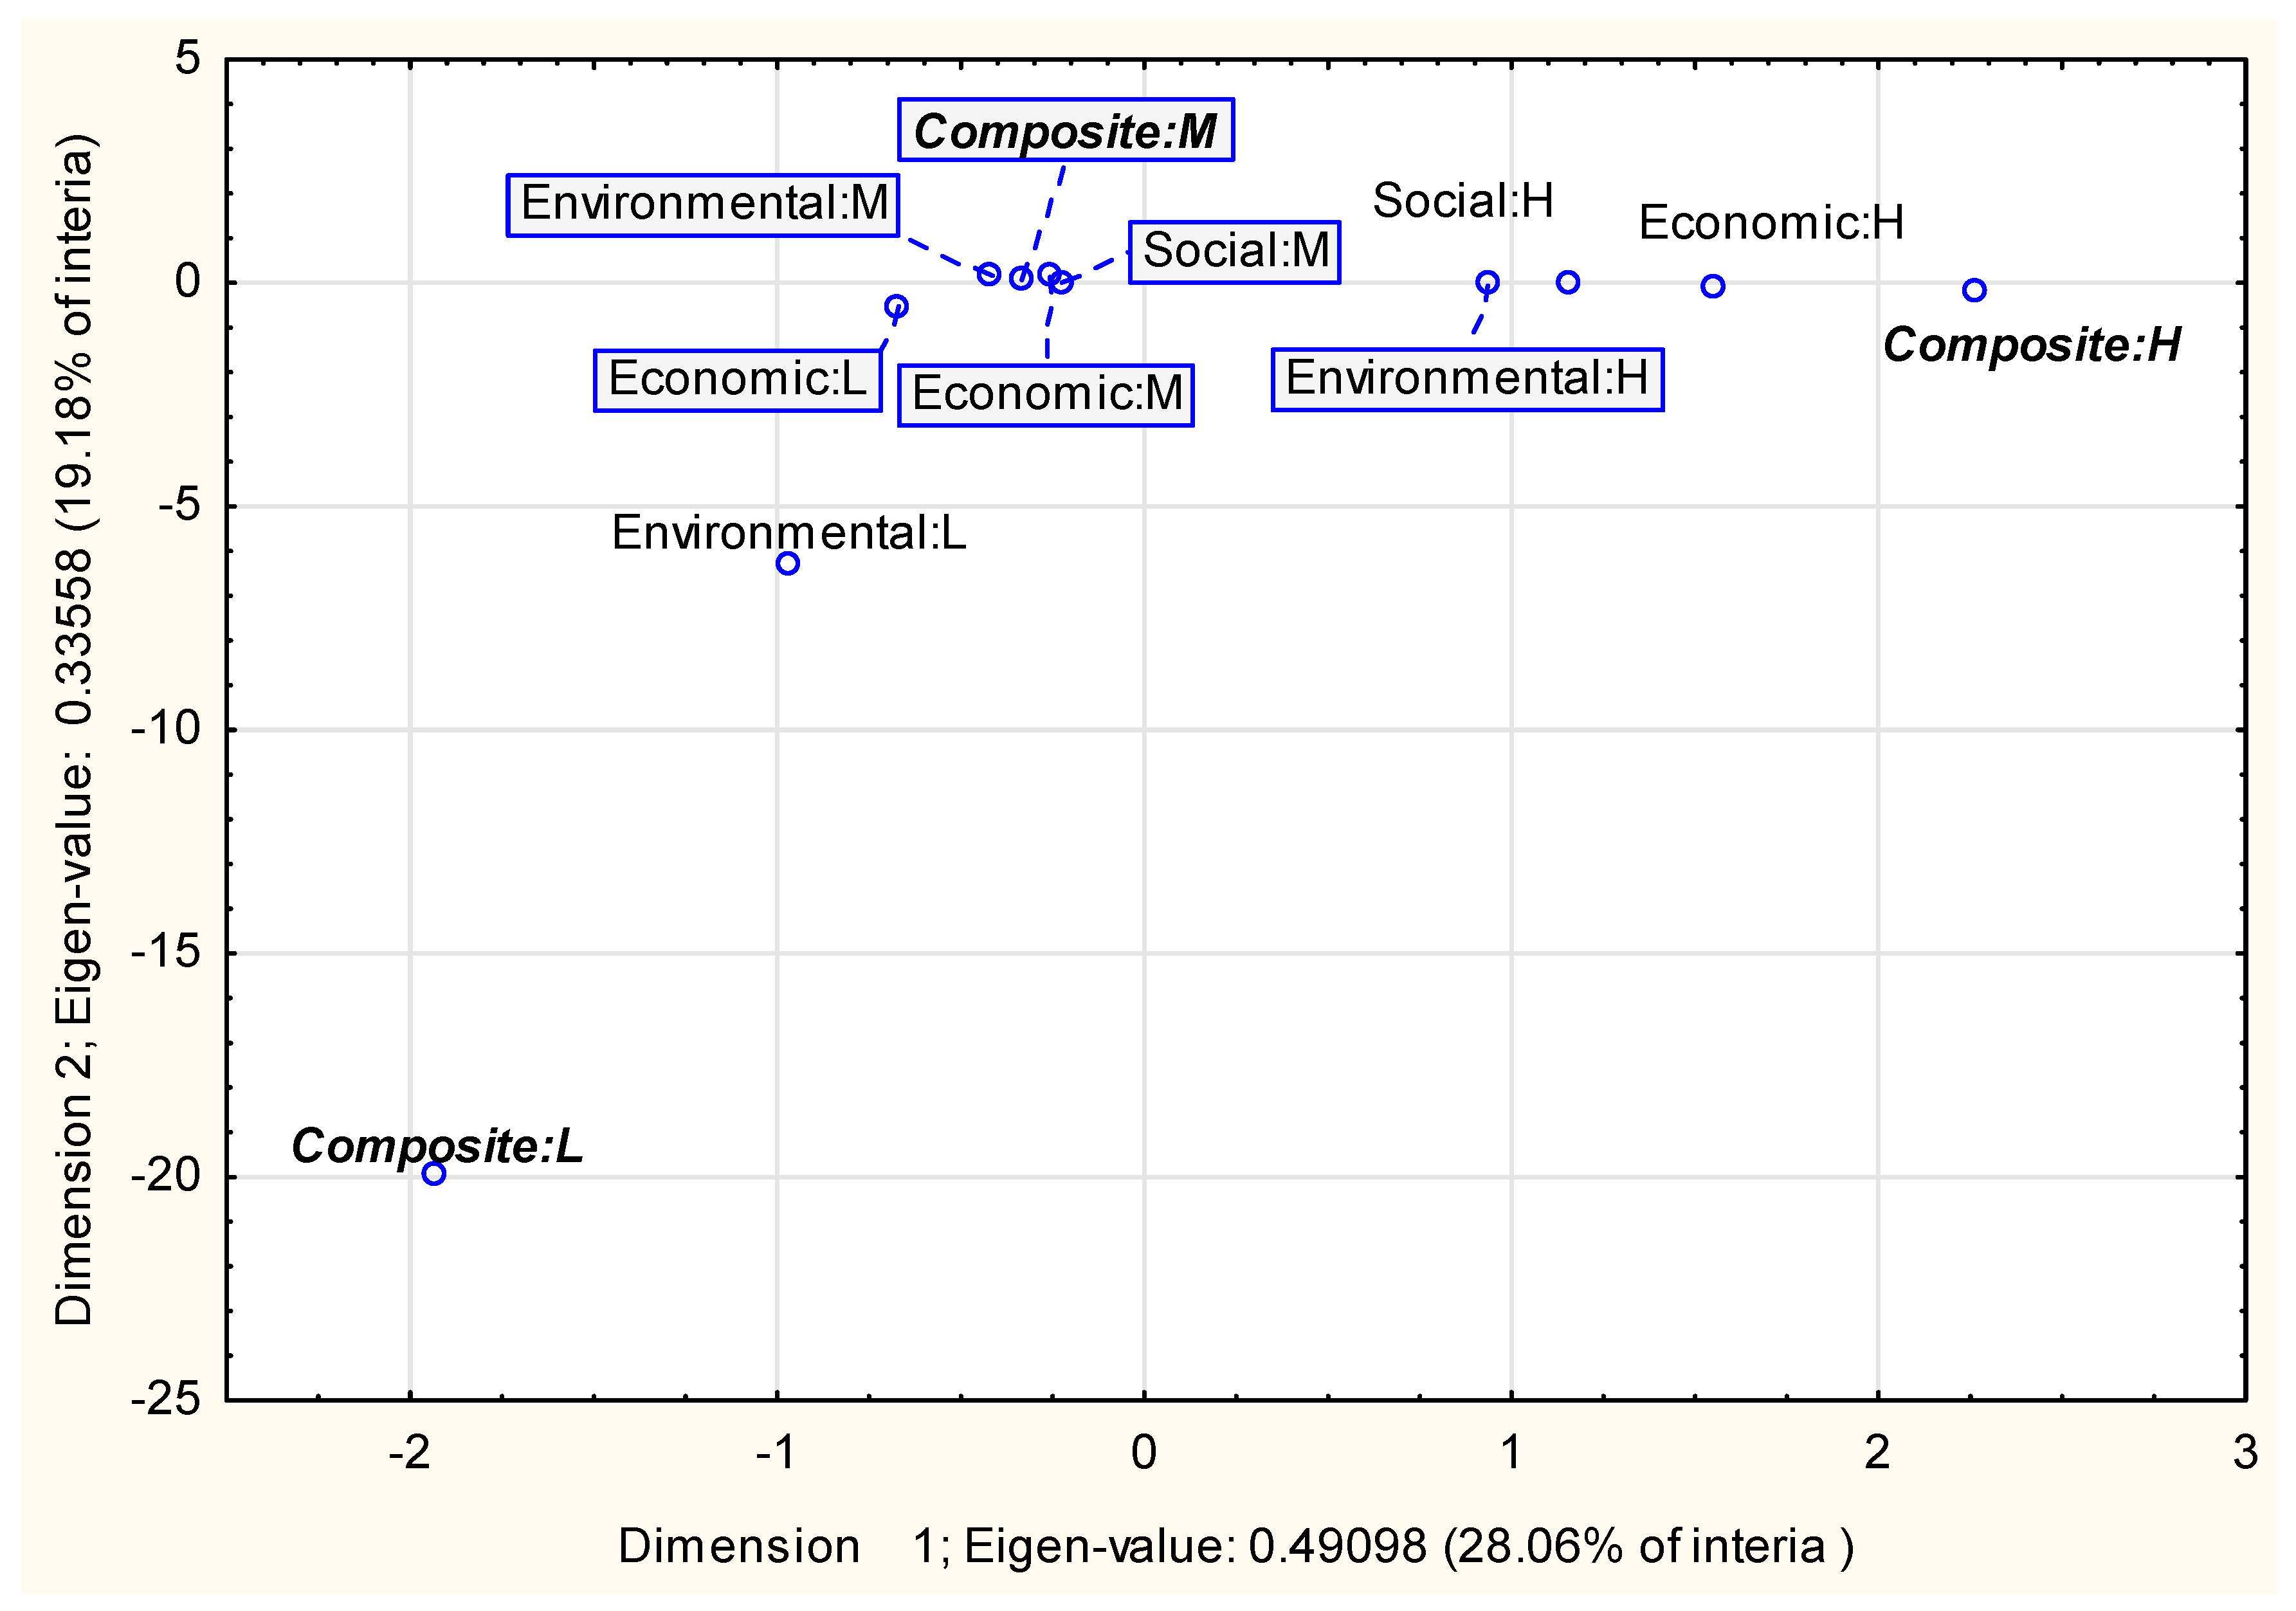
The analysis of the Burt matrix can be complemented by two-dimensional or three-dimensional graphs, with the use of a method described by [114]. The correspondence analysis revealed that we will cover 100% of data variability (in this method called “inertia”, which can be seen as the equivalent of variance) if we use a seven-dimensional system (Appendix A). However, a much more intuitive three-dimensional system covers as much as 60% of inertia, which seems satisfactory. The three-dimensional graph being the result of the correspondence analysis (Figure A1 in Appendix B) is rather difficult to interpret, but it contains at least two distinguishable groups of objects. This suggests some relationship between the sustainability dimensions. For instance, low levels of the environmental, economic and composite dimensions are situated relatively far from the other ones, which means that a low level of these indicators is not connected with a low level of the other indicators. In practice it means that a farm that has low level of sustainability in terms of economic results does not necessarily receive a low grade in the environmental dimension, etc. In order to make the analysis clearer, we have presented the data in three two-dimensional graphs (Figure A2, Figure A3 and Figure A4 in Appendix B).
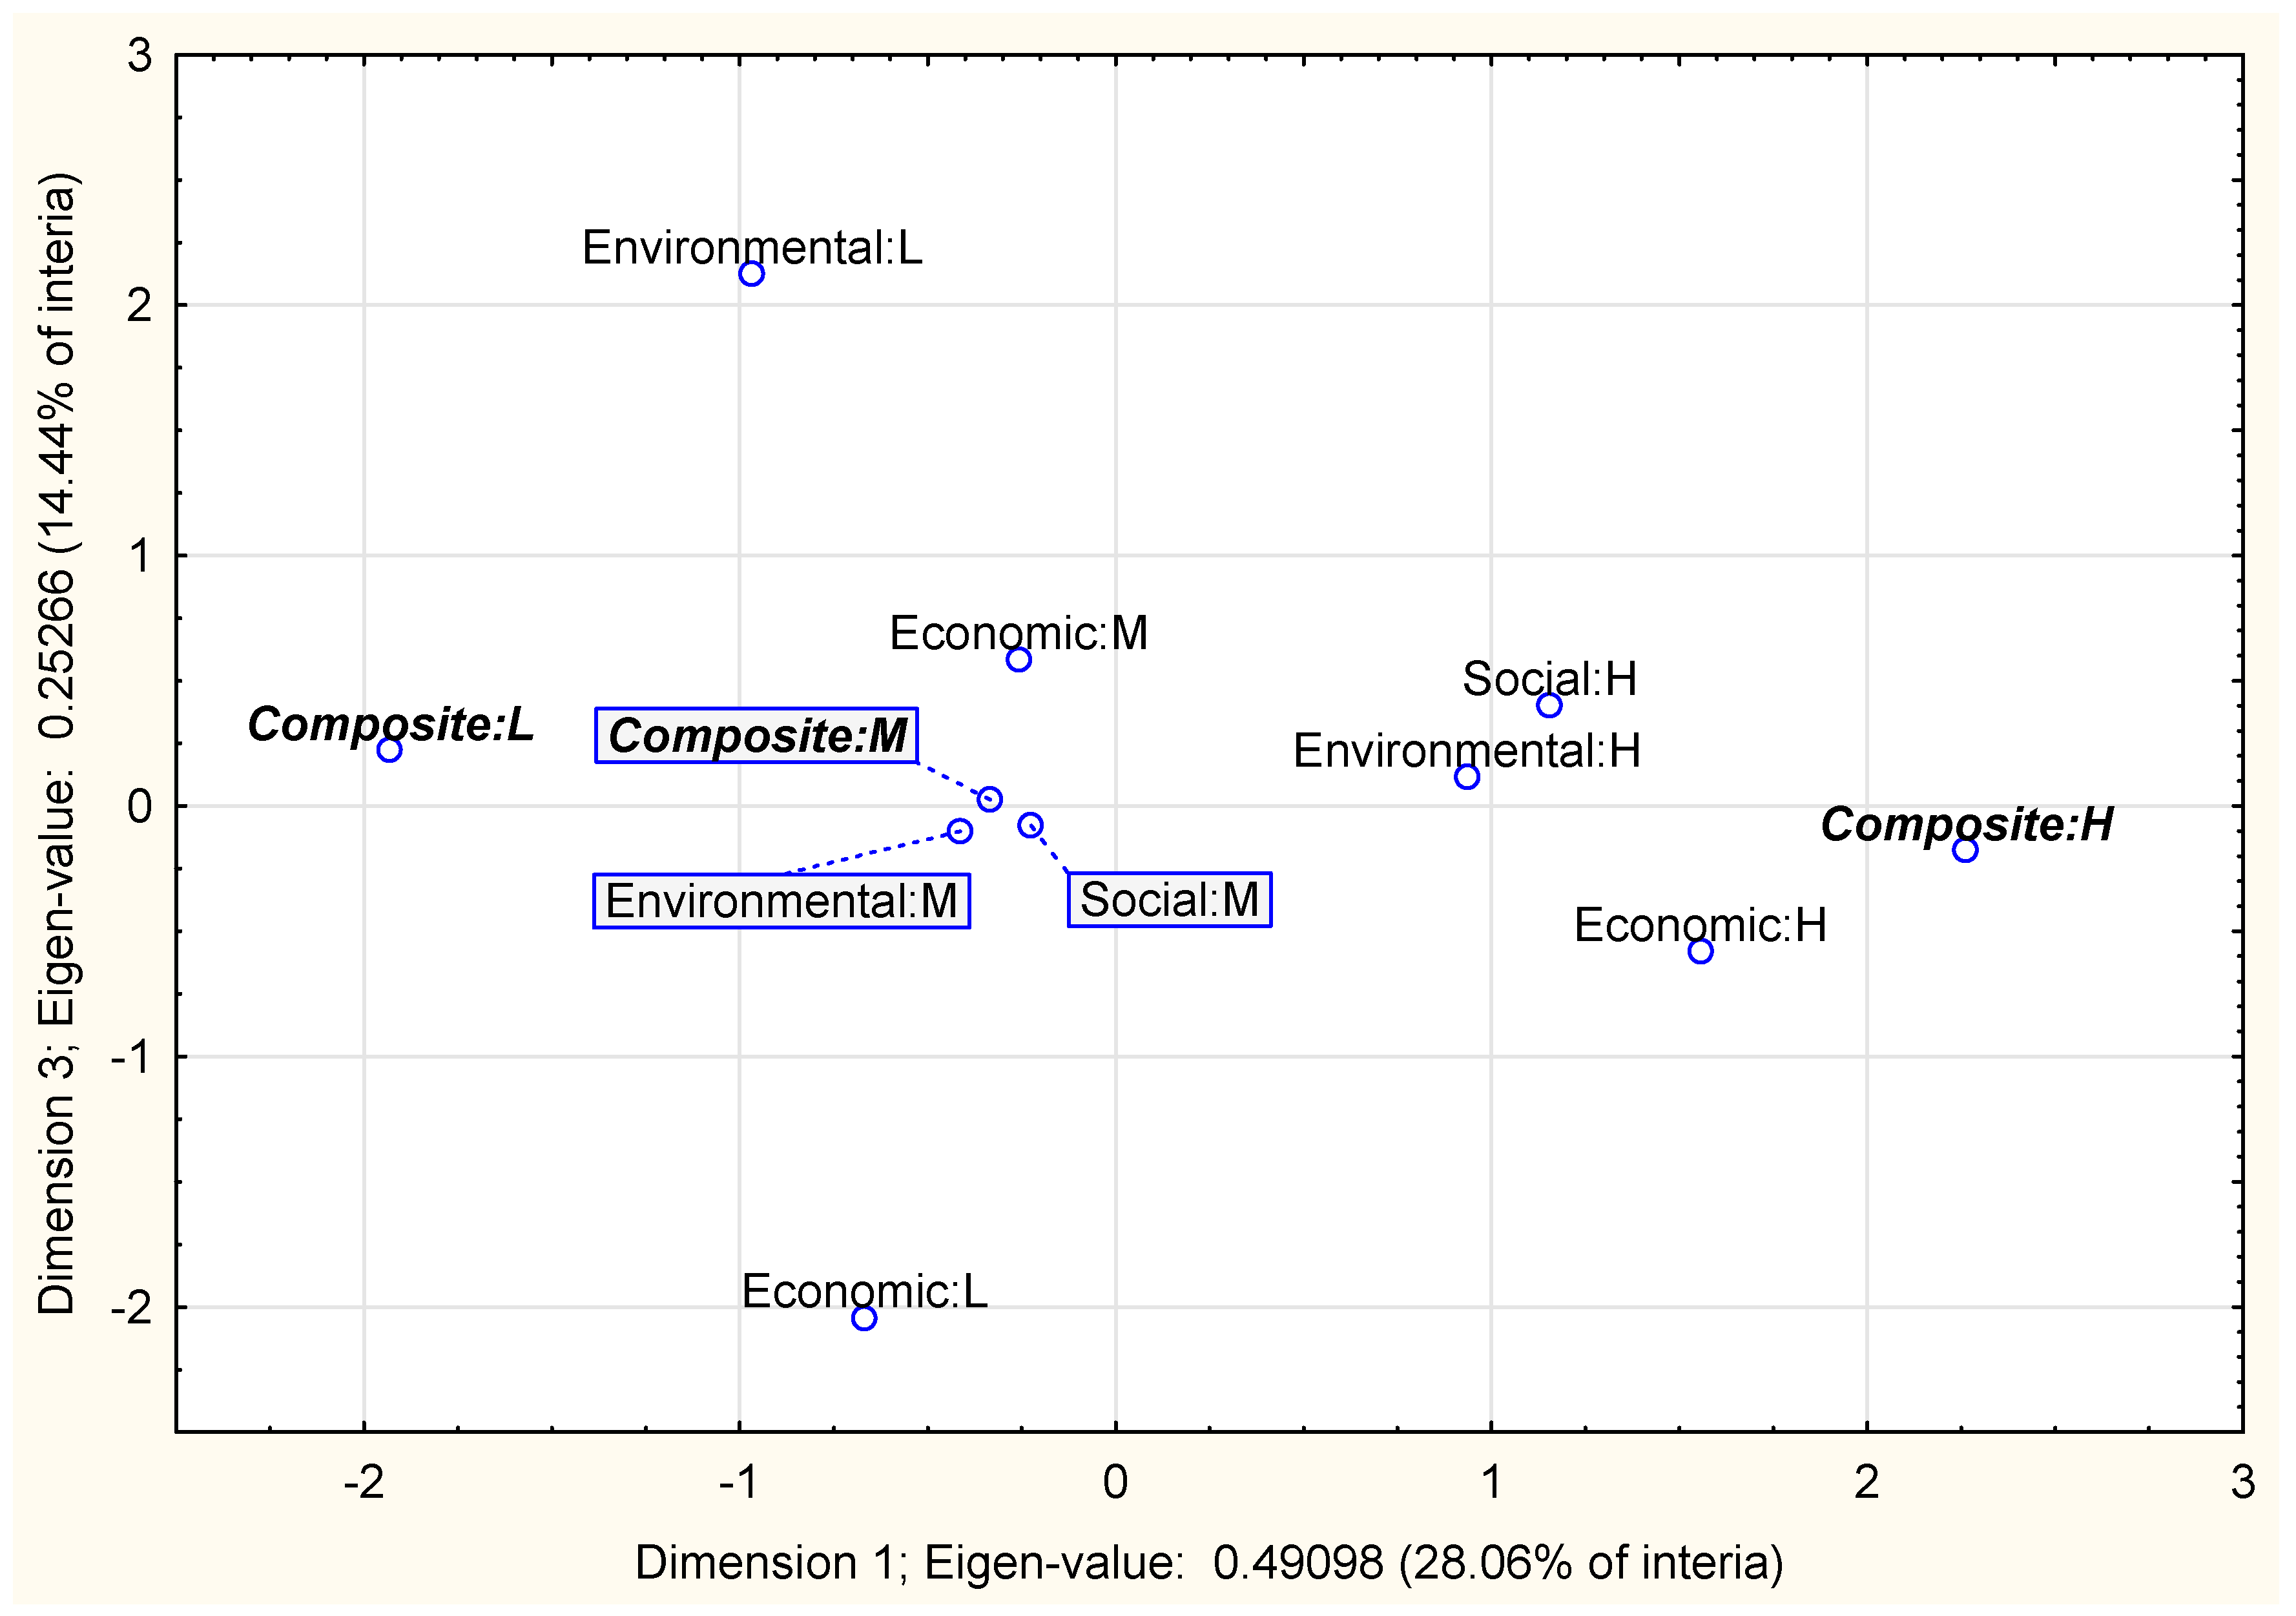
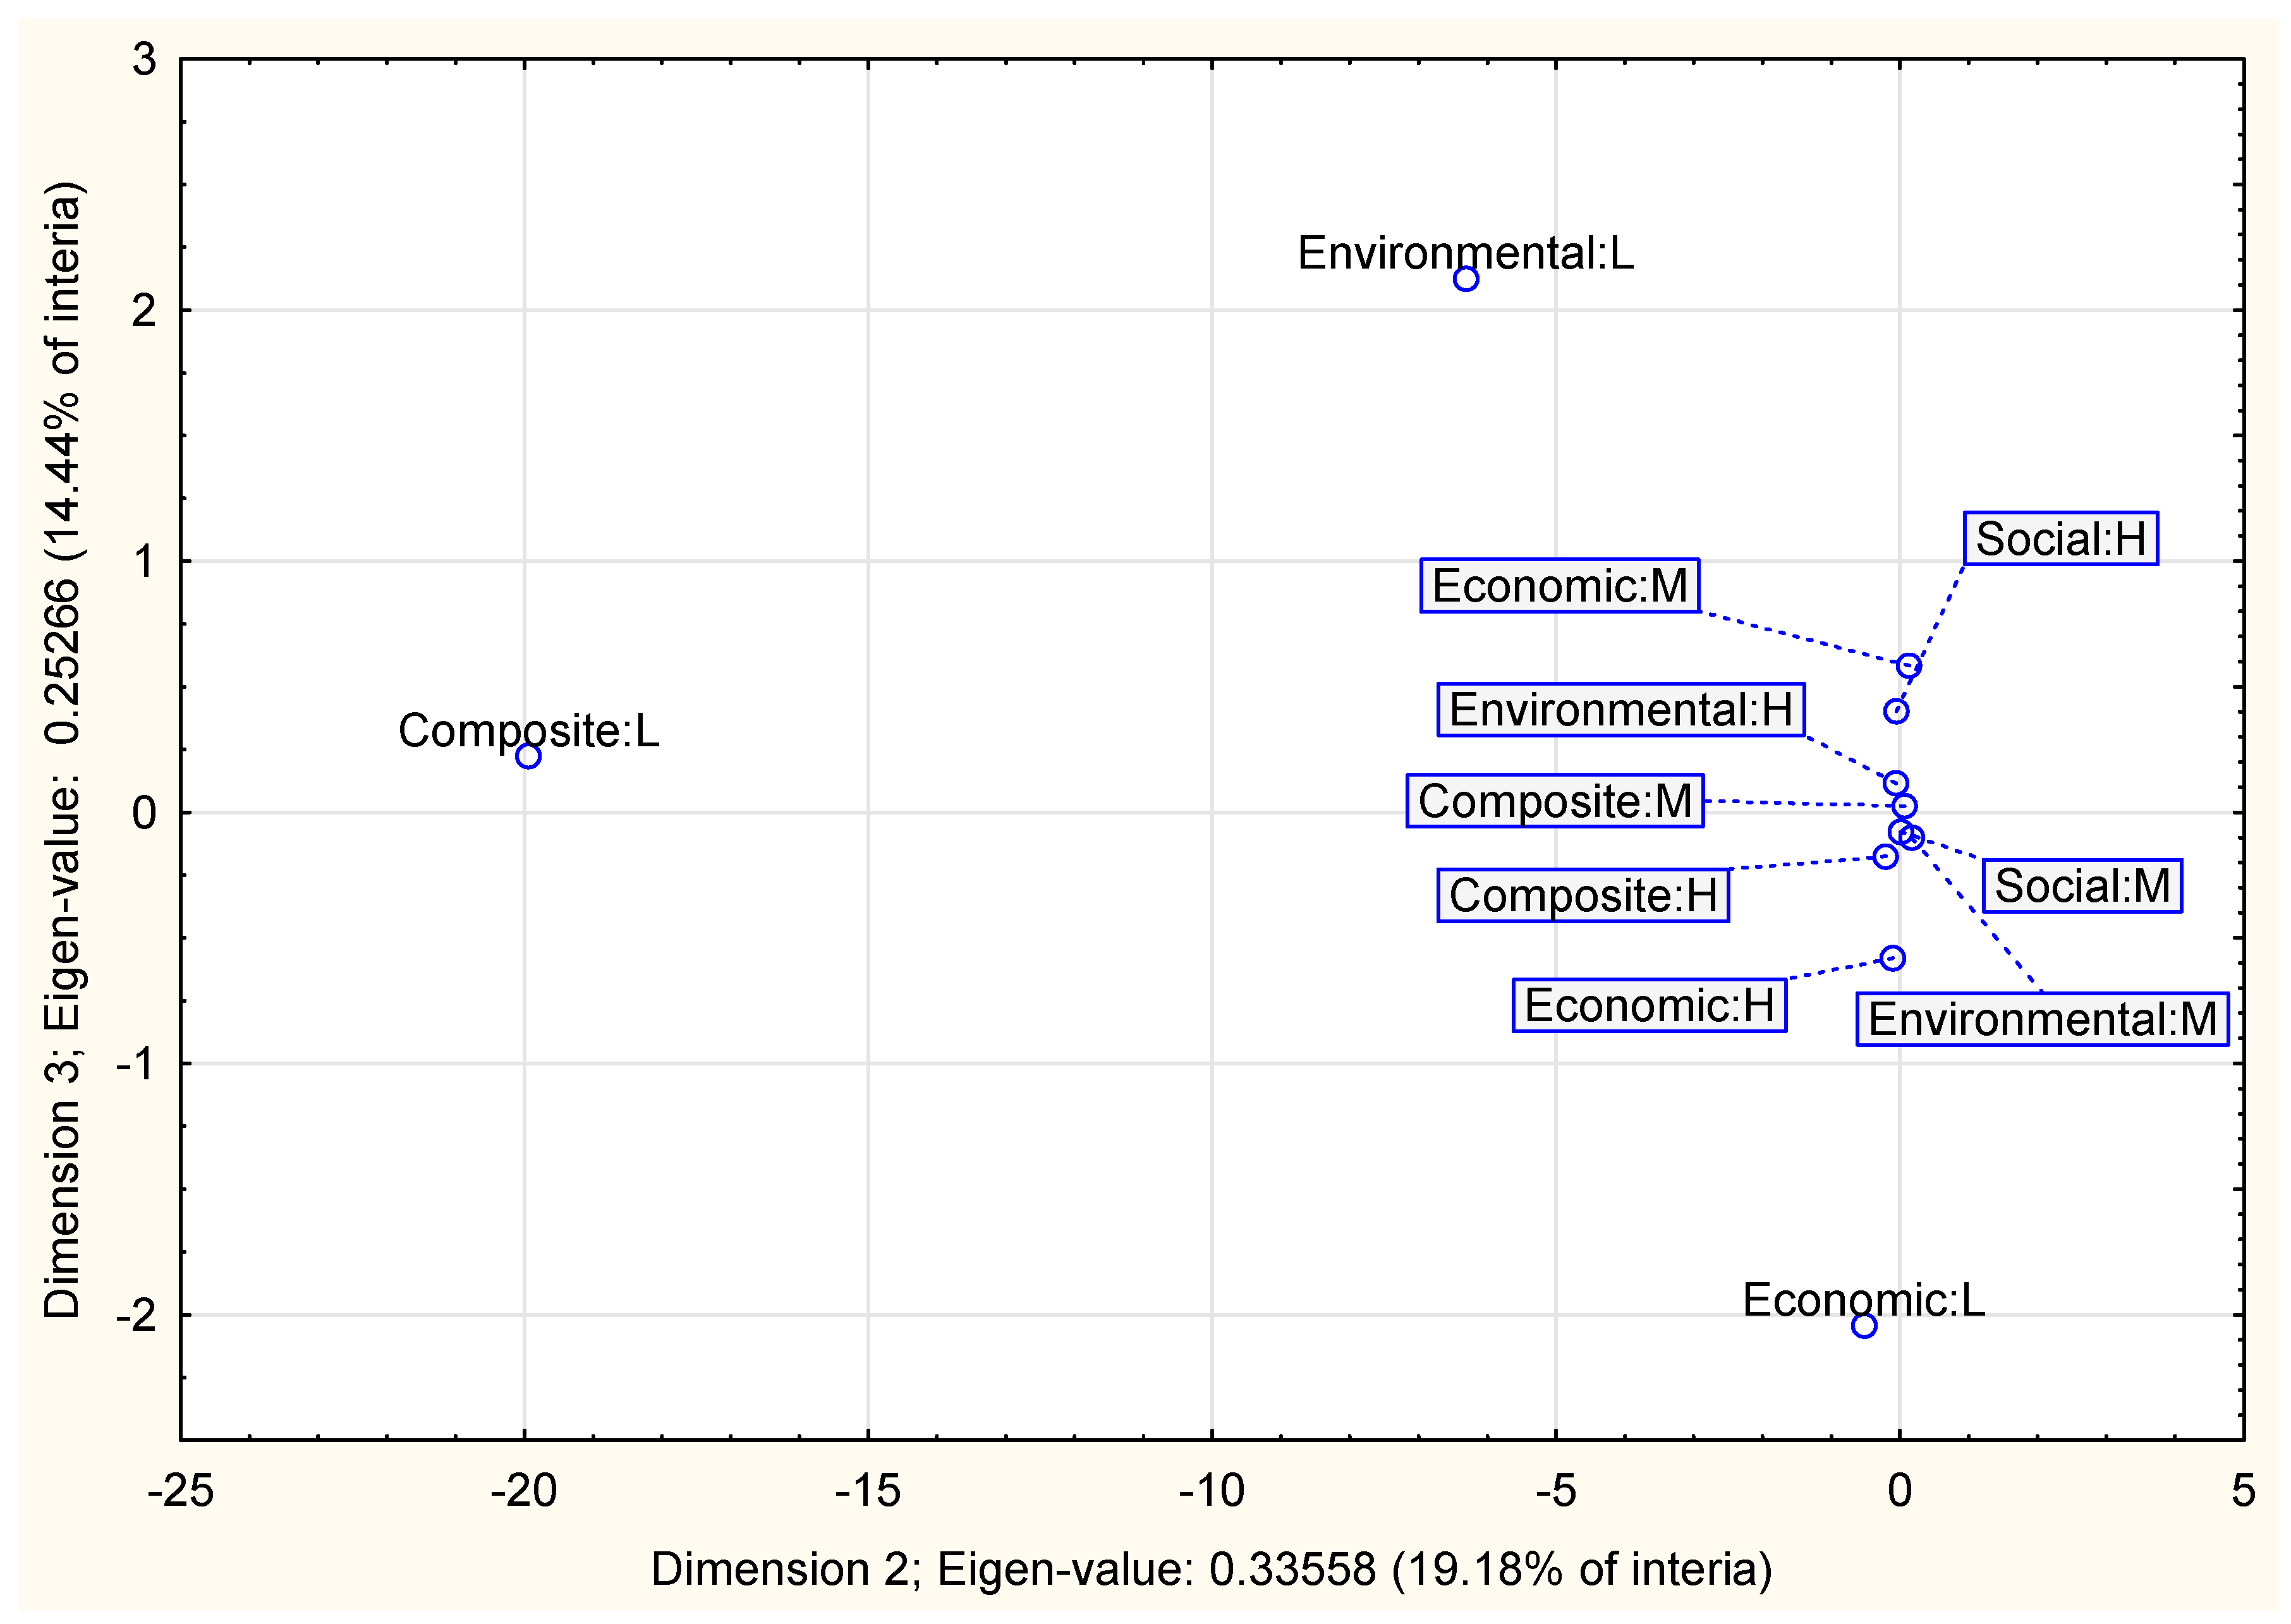
The analysis of relationships between dimensions 1 and 2 reveals (Figure A2 in Appendix B) that points marking medium levels of sustainability are situated close to each other. It suggests that a medium level of any of the sustainability indicators is in line with a medium level of the remaining indicators. The points showing high or low levels of the composite indicator are clearly far from the rest. Similar conclusions can be drawn from the analysis of Figure A3 and Figure A4 (Appendix B).
Detailed information concerning coordinates of particular points, as well as the parameters describing their contributions to inertia, are presented in Table 7. Most of the points are well represented, only Social M (medium) and Social H (high) are of lower quality. Generally speaking, the original relationships between the levels of sustainability dimensions are reflected in the coordinate system at acceptable levels.
The results of the correspondence analysis suggest that medium values of the sustainability indices are usually quite strongly connected with each other, and the relationships between high levels of the indices are much weaker. It suggests that in the case of a high level of one sustainability dimension there is a competition between sustainability goals. The goals can be achieved simultaneously at the medium level of fulfilling the sustainability ideal (which seems true for most of the farmers). Relatively few farmers are able to reach high level of sustainability in all of the dimensions simultaneously.

5. Discussion

Since the Brundtlant report [1] was published, scholars have continued to discuss the sustainability concept, and the problem of implementation and evaluation of sustainable agriculture is a fundamental challenge for agricultural research, practice, and policy [115]. According to the European Commission [95], there are interdependencies and synergies between environmental, social and economic objectives, “however they are not always mutually supportive; they even can compete with each other”. Such relations are typical for the model of economic development implemented since the industrial revolution, where economic growth is reached at the cost of the natural environment [12,117,118]. Rage against exploiting the natural environment was in fact the groundwork of developing the sustainable development concept [20,119], as well as the “green revolution”.
The results of the correspondence analysis described above reveal that there is competition between some of the sustainability components. Farms that reached a medium level of at least one sustainability dimension quite often reached medium levels in the remaining dimensions. This suggests the existence of some balance between the dimensions, which is good information. However, it concerns only the medium level of sustainability. The bad news is that it is very rare for farms characterized by a high level of sustainability in one dimension to reach high levels in any of the remaining dimensions. The practical meaning of these findings is that reaching the sustainability goals in all dimensions simultaneously is very difficult, because there is a competition or even conflict between them [120]. This confirms earlier findings of this issue in fields other than agriculture [9,121,122,123].
As for agriculture, according to the best knowledge of the authors there was no similar research published, however, we can look for some analogies in the existing body of literature. Basing on the example of Ireland, Dillon et al. [92] suggested that there is a potential conflict between economic and environmental dimensions of sustainability; according to their observations, the more intensive milk production caused higher pollution. In general, it is quite often assumed that there is a negative relationship between farm size and environment but, according to Matthews [124] (p. 9), that relations, if it exists, is indirect rather than direct (“Environmental impact is determined by land use intensity, and the presumption is that larger farms make more intensive use of their land, and thus leave a larger environmental ‘footprint’ than do smaller farms”).
Nevertheless, some authors reveal that some of the sustainability dimensions are convergent. According to research carried out among farmers in Kansas by Norman et al. [125], the prevailing attitude among the farmers was that all three components of sustainability had to be pursued at the same time, if progress was to be achieved. Piedra-Muñoz et al. 2016 [5] assessed the relationships between farm sustainability and profit in a Spanish region. According to them, there is no inherent contradiction between improving profit and improving sustainability. However, the role of social and cultural context should be underlined—according to Galdeano-Gómez et al. [75], the social influence may be relevant in both environmental and economic terms, particularly in agriculture (family farms) where productive structures are linked with social structures. In another publication, Galdeano-Gómez et al. [97] showed that changes in particular sustainability components in the analysed region coincided with the changes in farmers’ awareness. These authors stressed the importance of the sustainability of agricultural systems and of the synergy effects between “productivity, economic objectives and ecological intensification”.
Positive relationships between farm profit, on one hand, and social and economic sustainability, on the other, was found by Torres et al. [98], who researched organic farmers. Lately, interesting analyses concerning relationships between various sustainability components were carried out by Galdeano-Gómez et al. [96]. They analysed the changes with time of the sustainability components in the southeast of Spain. They found positive crossed effects among various environmental, economic and social components. The results revealed that the reduction of pressures on natural resources were positively linked with the improvement of economic and social indicators. They also observed that an increase in the economic indicators can be observed along with an improved social index, better resources management, and reduction of pressures on the environment.
Due to the differences in the results, it is interesting to quote an in-depth literature review by Mazzi et al. [126]. They analysed papers published in scientific journals between 2000 and 2015, concerning the direction of the relationship between the environmental and business performances of enterprises from various fields. It was concluded that it is not possible to find an answer to the “Porter-Wagner dilemma” (is the environment a “strategic competitive factor”, as in the “Porter point of view”, or is it a “luxury good”, as in the “Wagner point of view”?). The main reason for the unclear results was—according to Mazzi et al. [126]—the adoption of different indicators, which could not be overcome even by rigorous methods of analysis. It seems that clear and comparable results can be obtained only with the use of universal indicators.

6. Conclusions and Policy Implications

The authors of this paper made an attempt to assess relationships between the sustainability dimensions at a farm level. Simple correlation analysis revealed significant but low positive correlations between sustainability dimensions. However, partial correlations gave the opposite results—relatively strong negative correlations between sustainability dimensions. We can interpret these results as an existence of competition between sustainability goals, which seems logical: better economic results can be obtained at the cost of environmental pressure, or the level of stress. The correlation analysis was followed by multiple correspondence analysis. It revealed that farms characterized by a medium level of sustainability in one dimension usually achieved medium levels in other dimensions, while farms characterized by a high level of one dimension were less likely to reach a high level in any other dimension.
The results suggest that in practice it is difficult to realise the sustainable development paradigm in all the dimensions at one time, even though it is desirable to do it. Nowadays, it is one of the biggest challenges for the common agricultural policy (CAP). It seems that, despite the fact that the sustainability goals were not explicitly mentioned in the first CAP documents, some of the ideas were already visible in the first phases of CAP creation. Dillon et al. [92] (p. 8) underline that “the concepts of economic and social sustainability essentially underpinned the creation of the CAP in the 1960s through its objectives of sustaining an adequate standard of living and a secure food supply”. However, the scholars’ and policymakers’ awareness of the problem did not change the practice to a satisfactory extent. It is undisputable that farms should be profitable, however, this should be done with the respect to the natural environment. It seems that this is still a challenge.
The policy-makers are aware of complex interdependencies between the sustainability components, because the European Commission [95] (p. 3) has underlined that “economic, social and environmental objectives can to a certain degree develop synergies. However, they are not always mutually supportive; they even can compete with each other. Where this is the case, the concept of sustainability refers to the need to strike the right balance between its three elements. Political choices concerning one out of these three elements must at least ensure that certain minimum standards with respect to the other two are observed”.
According to the results of this research, a model of keeping balance between the sustainability dimensions can be observed in practice. Most of the farmers who reached a medium level of sustainability in one dimension did so also in the remaining ones, which means that a certain minimum was fulfilled in all the dimensions. Much higher differences were observed if one of the dimensions was on a high level, which suggests certain competition between the sustainability goals. In practice it means that reaching a high level in all the sustainability dimensions is quite a challenge. It seems especially important when discussing future CAP reforms that express the need for sustainable development [127]. We can assume that in present conditions (at least in Poland) reaching sustainability goals in all the dimensions is not an easy task.

Author Contributions

Conceptualization, P.S., A.K.-G. and W.S.; Formal analysis, P.S.; Investigation, W.S.; Methodology, P.S. and A.K.-G.; Writing—original draft, P.S.; Writing—review & editing, A.K.-G.

Funding

This research is a part of the project financed by the National Science Centre, Poland, (2015/19/B/HS4/02273).

Conflicts of Interest

The authors declare no conflict of interest.

Appendix A

Table A1. Singular values, eigenvalues and percentage of inertia explained in the correspondence analysis.
No. of DimensionsSingular ValueEigen-ValuesPerc. of InertiaCumulative Percentages of InertiaChi Squares
10.7007000.49098028.0559928.05601454.479
20.5792930.33558019.1760347.2320994.123
30.5026500.25265714.4375461.6696748.471
40.4715320.22234312.7053074.3749658.668
50.4372040.19114710.9227185.2976566.255
60.4053010.1642699.3867794.6843486.629
70.3049990.0930245.31567100.0000275.575
Source: own calculations.

Appendix B

Figure A1. 3D plot of coordinates for sustainability indicators (dimension 1, 2, and 3). Source: own elaboration.
Sustainability 10 04629 g0a1
Figure A2. 2D plot of column coordinates, dimension 1 and 2. Source: own elaboration.
Sustainability 10 04629 g0a2
Figure A3. 2D plot of column coordinates, dimension 1 and 3. Source: own elaboration.
Sustainability 10 04629 g0a3
Figure A4. 2D plot of column coordinates, dimension 2 and 3. Source: own elaboration.
Sustainability 10 04629 g0a4

References

  1. World Commission on Environment Development. Our Common Future; United Nations: New York, NY, USA, 1987. [Google Scholar]
  2. Emas, R. The Concept of Sustainable Development: Definition and Defining Principals; Brief for GSDR; Florida International University: Miami, FL, USA, 2015. [Google Scholar]
  3. Majewski, E. Trwały rozwój i trwałe rolnictwo. Teoria i praktyka gospodarstw rolnych—Sustainable Development and Sustainable Agriculture. Theory and Practice of Agricultural Farms; SGGW Publishing: Warsaw, Poland, 2008. [Google Scholar]
  4. Ciegis, R.; Ramanauskiene, J.; Martinkus, B. The Concept of Sustainable Development and its Use for Sustainability Scenarios. Inzinerine Èkon. Eng. Econ. 2009, 2, 28–37. [Google Scholar]
  5. Piedra-Muñoz, L.; Galdeano-Gómez, E.; Pérez-Mesa, J.C. Is Sustainability Compatible with Profitability? An Empirical Analysis on Family Farming Activity. Sustainability 2016, 8, 893. [Google Scholar] [CrossRef]
  6. Bosc, P.M.; Berdegué, J.; Goïta, M.; van der Ploeg, J.D.; Sekine, K.; Zhang, L. Investing in Smallholder Agriculture for Food Security; Report by the High Level Panel of Experts on Food Security and Nutrition; Committee on World Food Security: Rome, Italy, 2013. [Google Scholar]
  7. Ikerd, J. Family Farms: Our Promise for a Sustainable Future. In Pennsylvania Farmers Union Annual Convention; Dixon University: Harrisburg, PA, USA, 2013. [Google Scholar]
  8. Hayati, D. A Literature Review on Frameworks and Methods for Measuring and Monitoring Sustainable Agriculture; Technical Report n.22; Global Strategy Technical Report: Rome, Italy, 2017. [Google Scholar]
  9. Redclift, M. Sustainable development (1987–2005): An oxymoron comes of age. Spéc. Issue Crit. Perspect. Sustain. Dev. 2005, 13, 212–227. [Google Scholar] [CrossRef]
  10. Flint, R.W. Practice of Sustainable Community Development; Springer Science + Business Media: New York, NY, USA, 2013. [Google Scholar]
  11. Du Pisani, J.A. Sustainable development—Historical roots of the concept. Environ. Sci. 2006, 3, 83–96. [Google Scholar] [CrossRef]
  12. White, L. The historical roots of our ecologic crisis [with discussion of St Francis; reprint, 1967]. In Ecology and Religion in History; Harper and Row: New York, NY, USA, 1974. [Google Scholar]
  13. Pretty, J.; Bharucha, Z.P. Sustainable intensification in agricultural systems. Ann. Bot. 2017, 114, 1571–1596. [Google Scholar] [CrossRef] [PubMed]
  14. McDowall, D. An Illustrated History of Britain; Longman: Essex, UK, 1994. [Google Scholar]
  15. Spindler, E. The History of Sustainability. The Origins and Effects of a Popular Concept. In Sustainability in Tourism; Jenkins, I., Schröder, R., Eds.; Springer Gabler: Wiesbaden, Germany, 2013. [Google Scholar]
  16. Vehkamäki, S. The concept of sustainability in modern Times. In Sustainable Use of Renewable Resources—From Principles to Practices; Jalkanen, A., Nygren, P., Eds.; Department of Forest Ecology, University of Helsinki: Helsinki, Finland, 2005. [Google Scholar]
  17. Plater, L. Gopodarstwo Leśne; Zawadzki, J., Ed.; Zawadzki: Vilnius, Lithuania, 1807. [Google Scholar]
  18. Boulding, K.E. The Economics of the Coming Spaceship Earth. In Environmental Quality in a Growing Economy; Johns Hopkins University Press: Baltimore, MD, USA, 1966. [Google Scholar]
  19. Carson, R. Silent Spring; Houghton Mifflin Company: Boston, MA, USA, 1962. [Google Scholar]
  20. Ward, B.; Dubos, R. Only One Earth. The Care and Maintenance of a Small Planet; W.W Norton and Company: New York, NY, USA; London, UK, 1972. [Google Scholar]
  21. Satterthwaite, D. Barbara Ward and the Origins of Sustainable Development; International Institute for Environment and Development: London, UK, 2006. [Google Scholar]
  22. Seyfang, G.; Jordan, A. The Johannesburg Summit and Sustainable Development: How effective are environmental conferences? In Yearbook of International Co-operation on Environment and Development 2002/2003; Stokke, O.S., Thommessen, Ø.B., Eds.; Earthscan: Abingdon, UK, 2002; pp. 19–39. [Google Scholar]
  23. Daly, H.E. Sustainable Development: Definitions, Principles, Policies; World Bank: Washington, DC, USA, 2002. [Google Scholar]
  24. Harris, J.M. Basic Principles of Sustainable Development; Global Development and Environment Institute Working Paper 00-04; Tufts University: Medford, MA, USA, 2000. [Google Scholar]
  25. Giovannoni, E.; Fabietti, G. What Is Sustainability? A Review of the Concept and Its Applications. In Integrated Reporting; Department of Business and Law University of Siena: Siena, Italy, 2013; pp. 21–40. [Google Scholar]
  26. Ikerd, J. Understanding and Managing the Multi-Dimensions of Sustainable Agriculture. In Proceedings of the Southern Region Sustainable Agriculture Professional Development Program Workshop, SARE Regional Training Consortium, Gainesville, FL, USA, 15 January 1997. [Google Scholar]
  27. Anand, S.; Sen, A. Sustainable Human Development: Concepts and Priorities; Human Development Report Office (HDRO), United Nations Development Programme (UNDP), Human Development Occasional Papers (1992–2007); Harvard University: Cambridge, MA, USA, 1994. [Google Scholar]
  28. UNEP. Universality in the Post 2015 Sustainable Development Agenda; UNEP Post 2015 Note #9; OHCHR Human Rights and Post: Geneva, Switzerland, 2015. [Google Scholar]
  29. Long, G. The Idea of Universality in the Sustainable Development Goals. Ethics Int. Aff. 2015, 29, 203–222. [Google Scholar] [CrossRef]
  30. Dumanski, J.; Terry, E.; Byerlee, D.; Pieri, C. Performance Indicators for Sustainable Agriculture; Discussion Note; The World Bank: Washington, DC, USA, 1998. [Google Scholar]
  31. Voinov, A.; Smith, C. Dimensions of Sustainability; Discussion Paper; International Institute of Ecological Economics: Solomons, MD, USA, 1998. [Google Scholar]
  32. Solow, R.M. Sustainability: An economist’s perspective. In Economics of the Environment: Selected Readings; Dorfman, R., Dorfman, N.S., Eds.; W.W. Norton: New York, NY, USA, 1993. [Google Scholar]
  33. UNCED. United Nations Conference on Environment & Development Agenda 21; United Nations: Rio de Janeiro, Brazil, 1992. [Google Scholar]
  34. Helm, D. The assessment: Environmental policy objectives, instruments, and institutions. Oxf. Rev. Econ. Policy 1998, 14, 1–19. [Google Scholar] [CrossRef]
  35. Bardy, R.; Rubens, A.; Massaro, M. The Systemic Dimension of Sustainable Development in Developing Countries. J. Organ. Transform. Soc. Chang. 2015, 12, 22–41. [Google Scholar] [CrossRef]
  36. Seghezzo, L. The five dimensions of sustainability. Environ. Politics 2009, 184, 539–556. [Google Scholar] [CrossRef]
  37. Mauerhofer, V. 3-D Sustainability: An approach for priority setting in situation of conflicting interests towards a Sustainable Development. Ecol. Econ. 2008, 64, 496–506. [Google Scholar] [CrossRef]
  38. Mawhinney, M. Sustainable Development: Understanding the Green Debates; John Wiley & Sons: Hoboken, NJ, USA, 2002. [Google Scholar]
  39. United Nations. Integrating the Three Dimensions of Sustainable Development: A Framework and Tools; Greening of Economic Growth Series; United Nations: New York, NY, USA, 2015. [Google Scholar]
  40. Jiliberto, H.R. A Holarchical Model for Regional Sustainability Assessment. J. Environ. Assess. Policy Manag. 2004, 6, 511–538. [Google Scholar] [CrossRef]
  41. Kahuthu, A. Economic Growth and Environmental Degradation in a Global Context. Environ. Dev. Sustain. 2006, 8, 55–68. [Google Scholar] [CrossRef]
  42. Sadok, W.; Angevin, F.; Bergez, J.E.; Bockstaller, C.; Colomb, B.; Guichard, L.; Reau, R.; Dore, T. Ex ante assessment of the sustainability of alternative cropping systems: Implications for using multi-criteria decision-aid methods. A Review. Agron. Sustain. Dev. 2007, 28, 163–174. [Google Scholar] [CrossRef]
  43. Saifi, B.; Drake, L. A coevolutionary model for promoting agricultural sustainability. Ecol. Econ. 2008, 65, 24–34. [Google Scholar] [CrossRef]
  44. Norgaard, R.B. Development Betrayed: The End of Progress and a Co-Evolutionary Revisioning of the Future; Routledge: London, UK, 1994. [Google Scholar]
  45. Pierantoni, I. A few remarks on methodological aspects related to sustainable development. In Measuring Sustainable Development. Integrated Economic, Environmental and Social Frameworks; OECD: Paris, France, 2004. [Google Scholar]
  46. Pearce, D.; Barbier, E.; Markandya, A. Sustainable Development. Economics and Environment in the Third World; Earthscan Publications Ltd.: London, UK, 1990. [Google Scholar]
  47. Pearce, D. Economic Value and the Natural World; Earthscan: London, UK, 1993. [Google Scholar]
  48. Daly, H.E. Sustainable Development: From Concept and Theory to Operational Principles. Popul. Dev. Rev. Suppl. Resour. Environ. Popul. Present. Knowl. Future Options 1990, 16, 25–43. [Google Scholar] [CrossRef]
  49. Thompson, P. Agricultural sustainability: What it is and what it is not. Int. J. Agric. Sustain. 2007, 5, 5–16. [Google Scholar] [CrossRef]
  50. Chiesura, A.; de Groot, R. Critical natural capital: A socio-cultural perspective. Ecol. Econ. 2003, 44, 219–231. [Google Scholar] [CrossRef]
  51. Turner, R.K.; Pearce, D.; Bateman, I. Environmental Economics: An Elementary Introduction; The John Hopkins University Press: Baltimore, MD, USA, 1994. [Google Scholar]
  52. Pretty, J. Agricultural sustainability: Concepts, principles and evidence. Philos. Trans. R. Soc. Lond. B Biol. Sci. 2008, 363, 447–465. [Google Scholar] [CrossRef]
  53. United Nations. Resolution Adopted by the General Assembly on 25 September 2015. Transforming Our World: The 2030 Agenda for Sustainable Development; Seventieth Session; Distr. General 21; United Nations: New York, NY, USA, 2015. [Google Scholar]
  54. Zhen, L.; Routrayb, J.K.; Zoebischc, M.A.; Chend, G.; Xiea, G.; Chenga, S. Three dimensions of sustainability of farming practices in the North China Plain. A case study from Ningjin County of Shandong Province, PR China. Agric. Ecosyst. Environ. 2005, 105, 507–522. [Google Scholar] [CrossRef]
  55. Hansen, J.W. Is agricultural sustainability a useful concept? Agric. Syst. 1996, 51, 185–201. [Google Scholar] [CrossRef]
  56. Velten, S.; Leventon, J.; Jager, N.; Newig, J. What Is Sustainable Agriculture? A Systematic Review. Sustainability 2015, 7, 7833–7865. [Google Scholar] [CrossRef] [Green Version]
  57. Rigby, D.; Caceres, D. Organic farming and the sustainability of agricultural system. Agric. Syst. 2001, 68, 21–40. [Google Scholar] [CrossRef]
  58. Rasure, K.A. Sustainable Agricultural Development; Oxford Books Company: New Delhi, India, 2010. [Google Scholar]
  59. Olsson, J.A.; Bradley, K.; Hilding-Rydevik, T.; Ruotsalainen, A.; Aalbu, H. Indicators for Sustainable Development; Paper for Discussion; European Regional Network on Sustainable Development: New York, NY, USA, 2004. [Google Scholar]
  60. Latruffe, L.; Diazabakana, A.; Bockstaller, C.; Desjeux, Y.; Finn, J.; Kelly, E.; Ryan, M.; Uthes, S. Measurement of sustainability in agriculture: A review of indicators. Stud. Agric. Econ. 2016, 118, 123–130. [Google Scholar] [CrossRef]
  61. Bell, S.; Morse, S. Sustainability Indicators Past and Present: What Next? Sustainability 2018, 10, 1688. [Google Scholar] [CrossRef]
  62. Ikerd, J. Two related but distinctly different concepts: Organic farming and sustainable agriculture. Small Farm Today 1993, 101, 30–31. [Google Scholar]
  63. Briassoulis, H. Sustainable Development and its Indicators: Through a (Planner’s) Glass Darkly. J. Environ. Plan. Manag. 2001, 44, 409–427. [Google Scholar] [CrossRef]
  64. United Nations. Indicators of Sustainable Development: Guidelines and Methodologies, 3rd ed.; United Nations: New York, NY, USA, 2007. [Google Scholar]
  65. Reytar, K.; Hanson, C.; Henninger, N. Indicators of Sustainable Agriculture: A Scoping Analysis; Installment 6 of “Creating a Sustainable Food Future”; World Resources Institute: Washington, DC, USA, 2014. [Google Scholar]
  66. Hayati, D.; Ranjbar, Z.; Karami, E. Measuring agricultural sustainability. In Biodiversity, Biofuels, Agroforestry and Conservation Agriculture; Lichtfouse, E., Ed.; Springer: Amsterdam, The Netherlands, 2010. [Google Scholar]
  67. Lowrance, R.; Hendrix, P.F.; Odum, E.P. A hierarchical approach to sustainable agriculture. Am. J. Altern. Agric. 1986, 1, 169–173. [Google Scholar] [CrossRef]
  68. Van Der Werf, H.M.; Petit, J. Evaluation of the environmental impact of agriculture at the farm level: A comparison and analysis of 12 indicator-based methods. Agric. Ecosyst. Environ. 2002, 93, 131–145. [Google Scholar] [CrossRef]
  69. Repar, N.; Jan, P.; Dux, D.; Nemecek, T.; Doluschitz, R. Implementing farm-level environmental sustainability in environmental performance indicators: A combined global-local approach. J. Clean. Prod. 2017, 140, 692–704. [Google Scholar] [CrossRef]
  70. De Olde, E.M.; Oudshoorn, F.W.; Sørensen, C.A.; Bokkers, E.A.; De Boer, I.J. Assessing sustainability at farm-level: Lessons learned from a comparison of tools in practice. Ecol. Indic. 2016, 66, 391–404. [Google Scholar] [CrossRef]
  71. Binder, C.R.; Feola, G.; Steinberger, J.K. Considering the normative, systemic and procedural dimensions in indicator-based sustainability assessments in agriculture. Environ. Impact Assess. Rev. 2010, 30, 71–78. [Google Scholar] [CrossRef]
  72. Hammond, A.; Adriaanse, A.; Rodenburg, E.; Bryant, D.; Woodward, R. Environmental Indicators: A Systematic Approach to Measuring and Reporting on Environmental Policy Performance in the Context of Sustainable Development; World Resources Institute: Washington, DC, USA, 1995. [Google Scholar]
  73. Campbell, H.; Fairweather, J.; Hunt, L.; McLeod, C.; Rosin, C. Social Dimensions of Sustainable Agriculture: A Rationale for Social Research in ARGOS; ARGOS Work. Paper; Agriculture Research Group on Sustainability: Christchurch, New Zealand, 2004. [Google Scholar]
  74. Bacon, C.M.; Getz, C.; Kraus, S.; Montenegro, M.; Holland, K. The social dimensions of sustainability and change in diversified farming systems. Ecol. Soc. 2012, 17, 41. [Google Scholar] [CrossRef]
  75. Galdeano-Gómez, E.; Pérez-Mesa, J.C.; Godoy-Durán, A. The social dimension as a driver of sustainable development: The case of family farms in southeast Spain. Sustain. Sci. 2016, 11, 349–362. [Google Scholar] [CrossRef]
  76. O’Donoghue, C.; Devisme, S.; Ryan, M.; Conneely, R.; Gillespie, P.; Vrolijk, H. Farm economic sustainability in the European Union: A pilot study. Stud. Agric. Econ. 2016, 118, 163–171. [Google Scholar] [CrossRef]
  77. Smith, C.S.; McDonald, G.T. Assessing the sustainability of agriculture at the planning stage. J. Environ. Manag. 1998, 52, 15–37. [Google Scholar] [CrossRef] [Green Version]
  78. Pannell, D.J.; Glenn, N.A. Framework for the economic evaluation and selection of sustainability indicators in agriculture. Ecol. Econ. 2000, 33, 135–149. [Google Scholar] [CrossRef]
  79. Hatai, L.D.; Sen, C. An Economic Analysis of Agricultural Sustainability in Orissa. Agric. Econ. Res. Rev. 2008, 21, 273–282. [Google Scholar]
  80. Christen, O.; O’Halloran-Wietholtz, Z. Indikatoren für eine nachhaltige Entwicklung der Landwirtschaf–Indicators for a Sustainable Development in Agriculture; Institut fur Landwirtschaft und Umwelt: Berlin, Germany, 2002. [Google Scholar]
  81. Kuś, J.; Krasowicz, S. Przyrodniczo-organizacyjne uwarunkowania zrównoważonego rozwoju gospodarstw rolnych. Pamiętnik Puławski 2001, 124, 273–288. [Google Scholar]
  82. Verhulst, N.; Govaerts, B.; Verachtert, E.; Castellanos-Navarrete, A.; Mezzalama, M.; Wall, P.; Chocobar, A.; Deckers, J.; Sayre, K.D. Conservation agriculture, improving soil quality for sustainable production systems. In Advances in Soil Science: Food Security and Soil Quality; CRC Press: Boca Raton, FL, USA, 2010; pp. 137–208. [Google Scholar]
  83. Balbi, S.; del Prado, A.; Gallejones, P.; Geevan, C.P.; Pardo, G.; Pérez-Miñana, E.; Manrique, R.; Hernandez-Santiago, C.; Villa, F. Modeling trade-offs among ecosystem services in agricultural production systems. Environ. Model. Softw. 2015, 72, 314–326. [Google Scholar] [CrossRef] [Green Version]
  84. Talukder, B.; Hipel, K.W.; van Loon, G.W. Developing Composite Indicators for Agricultural Sustainability Assessment: Effect of Normalization and Aggregation Techniques. Resources 2017, 6, 66. [Google Scholar] [CrossRef]
  85. Rigby, D.; Woodhouse, P.; Young, T.; Burton, M. Constructing a farm level indicator of sustainable agricultural practice. Ecol. Econ. 2001, 39, 463–478. [Google Scholar] [CrossRef]
  86. Géniaux, G.; Bellon, S.; Deverre, C.; Powell, B. Sustainable Development Indicator Frameworks and Initiatives; Report No.: 49 November 2009 of the EU FP6 project SEAMLESS, Ref: PD2.2.1; Seamless: New York, NY, USA, 2009. [Google Scholar]
  87. Salzman, J. Methodological Choices Encountered in the Construction of Composite Indices of Economic and Social Well-Being; Center for the Study of Living Standards: Ottawa, ON, Canada, 2003. [Google Scholar]
  88. Štreimikienė, D.; Baležentis, A. Integrated Sustainability Index: The Case Study of Lithuania. Intellect. Econ. 2013, 7, 289–303. [Google Scholar] [CrossRef]
  89. Pillarisetti, J.R.; van den Bergh, J.C.J.M. Sustainable Nations: What Do Aggregate Indicators Tell Us? TI 2008-012/3 Tinbergen Institute Discussion Paper; Tinbergen Institute: Amsterdam, The Netherlands, 2008. [Google Scholar]
  90. Ryan, M.; Hennessy, T.; Buckley, C.; Dillon, E.J.; Donnellan, T.; Hanrahan, K.; Moran, B. Developing farm-level sustainability indicators for Ireland using the Teagasc National Farm Survey. Ir. J. Agric. Food Res. 2016, 55, 112–125. [Google Scholar] [CrossRef] [Green Version]
  91. Bockstaller, C.; Guichard, L.; Makowski, D.; Aveline, A.; Girardin, P.; Plantureux, S. Agro-Environmental indicators to assess cropping and farming systems. A review. Agron. Sustain. Dev. 2008, 28, 139–149. [Google Scholar] [CrossRef]
  92. Dillon, E.; Hennessey, T.; Hynes, S.; Commins, V. Assessing the Sustainability of Irish Agriculture; RERC Working Paper Series 08-WP-RE-09; RERC: Un Chau, Hong Kong, 2010; pp. 1–38. [Google Scholar]
  93. Nardo, M.; Saisana, M.; Saltelli, A.; Tarantola, S. Tools for Composite Indicators Building; Joint Research Centre-European Commission: Ispra, Italy, 2005. [Google Scholar]
  94. Rajaram, T.; Das, A. Modeling of interactions among sustainability components of an agro-ecosystem using local knowledge through cognitive mapping and fuzzy inference system. Expert Syst. Appl. 2010, 37, 1734–1744. [Google Scholar] [CrossRef]
  95. European Commission. A Framework for Indicators for the Economic and Social Dimensions of Sustainable Agriculture and Rural Development; European Commission: Brussels, Belgium, 2001. [Google Scholar]
  96. Galdeano-Gómez, E.; Aznar-Sánchez, J.A.; Pérez-Mesa, J.C.; Piedra-Muñoz, L. Exploring Synergies Among Agricultural Sustainability Dimensions: An Empirical Study on Farming System in Almeria (Southeast Spain). Ecol. Econ. 2017, 140, 99–109. [Google Scholar] [CrossRef]
  97. Galdeano-Gómez, E.; Aznar-Sánchez, J.A.; Pérez-Mesa, J.C. Sustainability dimensions of agricultural development in Almería (Spain): The experience of 50 years. In Proceedings of the 52nd Congress of the European Regional Science Association: “Regions in Motion–Breaking the Path”, Bratislava, Slovakia, 21–25 August 2012. [Google Scholar]
  98. Torres, J.; Valera, D.L.; Belmonte, L.J.; Herrero-Sánchez, C. Economic and Social Sustainability through Organic Agriculture: Study of the Restructuring of the Citrus Sector in the “Bajo Andarax” District (Spain). Sustainability 2016, 8, 918. [Google Scholar] [CrossRef]
  99. Central Statistical Office. Rolnictwo w 2017 r. Analizy Statystyczne; Central Statistical Office: Warsaw, Poland, 2018.
  100. Central Statistical Office. Charakterystyka Gospodarstw Rolnych w 2016 r; Central Statistical Office: Warsaw, Poland, 2017.
  101. Central Statistical Office. History of Poland in Numbers; Central Statistical Office: Warsaw, Poland, 2014.
  102. Central Statistical Office. Pracujący w gospodarstwach rolnych. Powszechny spis rolny 2010–Working on Farms. Universal Agricultural Census; Central Statistical Office: Warsaw, Poland, 2012.
  103. FADN. Wyniki Standardowe 2016 uzyskane przez gospodarstwa rolne uczestniczące w Polskim FADN; Część, I., Ed.; Wyniki Standardowe: Warszawa, Poland, 2017. [Google Scholar]
  104. European Commission. Agriculture and Rural Development-Fram Accountancy Data Network. Available online: http://ec.europa.eu/agriculture/rica/methodology2_en.cfm#tuafooraamoc (accessed on 8 November 2018).
  105. Neyman, J. On the Two Different Aspects of the Representative Method: The Method of Stratified Sampling and the Method of Purposive Selection. J. R. Stat. Soc. 1934, 97, 558–625. [Google Scholar] [CrossRef]
  106. FADN. Plan wyboru próby gospodarstw rolnych Polskiego FADN 2008 (Plan of Sampling for Polish FADN); IERiGŻ-PIB: Warsaw, Poland, 2008. [Google Scholar]
  107. Kalton, G. Introduction to Survey Sampling. Series: Quantitative Applications in the Social Sciences; SAGE Publications: Newbury Park, London, UK; New Delhi, India, 1983. [Google Scholar]
  108. Cochran, W.G. Sampling Techniques; John Wiley & Sons: New York, NY, USA; Chichester, UK; Brisbane, Australia; Toronto, ON, Canada; Singapore, 1977. [Google Scholar]
  109. Sulewski, P.; Kloczko-Gajewska, A. Development of the sustainability index of farms based on surveys and FADN sample. Probl. Agric. Econ. 2018, 3, 32–56. [Google Scholar] [CrossRef]
  110. Investopedia. Decile. Available online: https://www.investopedia.com/terms/d/decile.asp#ixzz5LaeRBJGW (accessed on 3 November 2018).
  111. Hill, M.O. Correspondence Analysis: A Neglected Multivariate Method. J. R. Stat. Soc. Ser. C (Appl. Stat.) 1974, 23, 340–354. [Google Scholar] [CrossRef]
  112. Greenacre, M. Correspondence Analysis in Practice, 2nd ed.; Chapman & Hall/CRC Taylor & Francis Group: Boca Raton, FL, USA; London, UK; New York, NY, USA, 2007. [Google Scholar]
  113. Abdi, H.; Valentin, D. Multiple Correspondence Analysis. In Encyclopaedia of Measurement and Statistics; Sage: Thousand Oaks, CA, USA, 2007. [Google Scholar]
  114. Clausen, S.E. Applied Correspondence Analysis; Sage Publications: Thousand Oaks, CA, USA, 1998. [Google Scholar]
  115. Van Cauwenbergh, N.; Biala, K.; Bielders, C.; Brouckaert, V.; Franchois, L.; Garcia Cidad, V.; Hermy, M.; Mathijs, E.; Muys, B.; Reijnders, J.; et al. SAFE—A hierarchical framework for assessing the sustainability of agricultural systems. Agric. Ecosyst. Environ. 2007, 120, 229–242. [Google Scholar] [CrossRef]
  116. StatSoft. Textbook. Available online: http://www.statsoft.com/textbook/correspondence-analysis (accessed on 8 November 2018).
  117. Meadows, D.H.; Meadows, D.; Randers, J.; Behrens, W.W., III. The Limits to Growth: A Report to the Club of Rome; Potomac Associates: Washington, DC, USA, 1972. [Google Scholar]
  118. Sachs, I. La Troisième Rive. A la Recherche de l’Écodéveloppement; François Bourin Editeur: Paris, France, 2008. [Google Scholar]
  119. Pingali, P.; Raney, T. From the Green Revolution to the Gene Revolution: How will the Poor Fare? ESA Working Paper; ESA: Paris, France, 2005. [Google Scholar]
  120. Hansmann, R.; Mieg, H.A.; Frischknecht, P. Principal sustainability components: Empirical analysis of synergies between the three pillars of sustainability. Int. J. Sustain. Dev. World Ecol. 2013, 19, 451–459. [Google Scholar] [CrossRef]
  121. Spaiser, V.; Ranganathan, S.; Swain, R.B.; Sumpter, D.J.T. The sustainable development oxymoron: Quantifying and modelling the incompatibility of sustainable development goals. Int. J. Sustain. Dev. World Ecol. 2017, 24, 457–470. [Google Scholar] [CrossRef]
  122. Pradhan, P.; Costa, L.; Rybski, D.; Lucht, W.; Kropp, J.P. A Systematic Study of Sustainable Development Goal (SDG) Interactions. Earth’s Future 2017, 5, 1067–1179. [Google Scholar] [CrossRef]
  123. Nilsson, M.; Griggs, D.; Visbeck, M. Map the interactions between Sustainable Development Goals. Nature 2016, 534, 320–322. [Google Scholar] [CrossRef] [PubMed]
  124. Matthews, A. Sustainable Development Research in Agriculture: Gaps and Opportunities for Ireland; Trinity Economic Paper; Department of Economics, Trinity College: Dublin, Ireland, 2003. [Google Scholar]
  125. Norman, D.; Janke, R.; Freyenberger, S.; Schurle, B.; Kok, H. Defining and Implementing Sustainable Agriculture; Kansas Sustainable Agriculture Series; Kansas State University: Manhattan, KS, USA, 1997. [Google Scholar]
  126. Mazzi, A.; Toniolo, S.; Manzardo, A.; Ren, J.; Scipioni, A. Exploring the Direction on the Environmental and Business Performance Relationship at the Firm Level. Lessons from a Literature Review. Sustainability 2016, 8, 1200. [Google Scholar] [CrossRef]
  127. European Commission. Communication from the Commission to the European Parliament, the Council, the European Economic and Social Committee and the Committee of the Regions; The Future of Food and Farming; European Commission: Brussels, Belgium, 2017; COM (2017) 713 final. [Google Scholar]
Figure 1. Study area—Poland with Farm Accountancy Data Network (FADN) regions. Source: own elaboration based on [103].
Sustainability 10 04629 g001
Figure 2. Structure of farms participating in the Polish FADN in 2016 (according to TF8 typology). Source: own computation based on FADN [103].
Sustainability 10 04629 g002
Figure 3. The procedure of multiple correspondence analysis. Source: [114].
Sustainability 10 04629 g003
Table 1. Number of farms in Poland, by economic size (2016).
Standard Output in Thousand EuroNumber of Farms (Thousands)Share of Total Number (%)Share of Farms Participating in Polish FADN (%)
lower than 4650.447does not apply
very small (4 ≤ € < 8)249.11837
small (8 ≤ € < 25)289.22142
medium-small (25 ≤ € < 50)106.6813
medium-large (50 ≤ € < 100)58.145
large and very large (≥100)30.422
total1383.9100100
Source: own computation based on [100,103].
Table 2. Coverage field of the observation FADN in Poland in 2013.
Farms (%)Standard Output (%)Utilized Agricultural Area (%)Agricultural Working Units (%)
52948767
Source: [104].
Table 3. Basic characteristics of indicators of sustainability dimensions (theoretical range of variability 0–1).
ParameterDimension of SustainabilityComposite Indicator
Agri-EnvironmentalSocialEconomic
empirical minimum0.220.350.130.32
empirical maximum0.910.830.860.79
mean0.60.570.510.56
standard deviation0.120.090.150.09
Source: own research.
Table 4. R-Pearson correlation coefficients of sustainability dimensions’ indicators (N = 601).
Dimensions of SustainabilityParametersDimensions of Sustainability
Agri-EnvironmentalSocialEconomicComposite
Agri-environmentalr(X.Y)10.120.270.67
test–t--2.91976.9422.05
p-value--0.00360.00000.0000
Socialr(X.Y)--10.320.59
test–t----8.3817.93
p-value----0.00000.0000
Economicr(X.Y)----10.82
test–t------35.63
p-value------0.0000
Compositer(X,Y)------1
Source: own research.
Table 5. Partial correlations between indicators of sustainability dimensions (impact of aggregated dimension controlled).
Dimension of SustainabilityParametersDimension of Sustainability
Agri-EnvironmentalSocialEconomic
Agri-environmentalr(X,Y)1−0.46−0.66
test–t--−12.75−21.64
p-value--0.00000.0000
Socialr(X,Y)--1−0.35
test–t----−9.35
p-value----0.0000
Economicr(X,Y)----1
test–t------
p-value------
Source: own research.
Table 6. Burt Matrix for analysed categories of sustainability indexes (numbers in the matrix indicate the number of farms in each of the categories).
Indicators of Sustainability DimensionsValues of IndicatorsIndicators of Sustainability Dimensions
EnvironmentalEconomicSocialComposite
Values of indicators: L—low, M—medium, H—high
LMHLMHMHLMH
EnvironmentalL90027081180
M04040692864935054039113
H00188161165614543012365
EconomicL2691687008071860
M72861160409034861038623
H0495600105753005055
SocialM835014580348755030146240
H154437613009806038
CompositeL10010010100
M839112386386504626005220
H013650235540380078
Source: own research.
Table 7. Coordinates and contributions to inertia (judging the quality of a solution). (Detailed explanations of the parameters given in this table can be found at the websiteof statsoft [116]).
Name of the pointCoordinatesMassQualityRelative InertiaInertia
DimensionDimension
123123
Environmental:M−0.410.17−0.10.170.430.050.060.010.01
Environmental:L−0.97−6.312.1300.690.140.010.440.07
Environmental:H0.94−0.060.120.080.410.10.1400
Social:M−0.230.01−0.080.210.290.020.0200.01
Social:H1.16−0.050.40.040.290.120.1100.03
Economic:M−0.260.140.580.170.910.050.020.010.23
Economic:L−0.67−0.52−2.040.040.830.120.030.030.6
Economic:H1.56−0.1−0.580.040.590.120.2200.06
Composite:M−0.330.070.030.220.770.020.0500
Composite:L−1.93−19.940.2200.670.1400.490
Composite:H2.26−0.2−0.180.030.770.120.3400
Source: own calculations.