A Comparative Study on the RFS Program of Korea with the US and UK


Abstract
1. Introduction
1.1. Research Objective
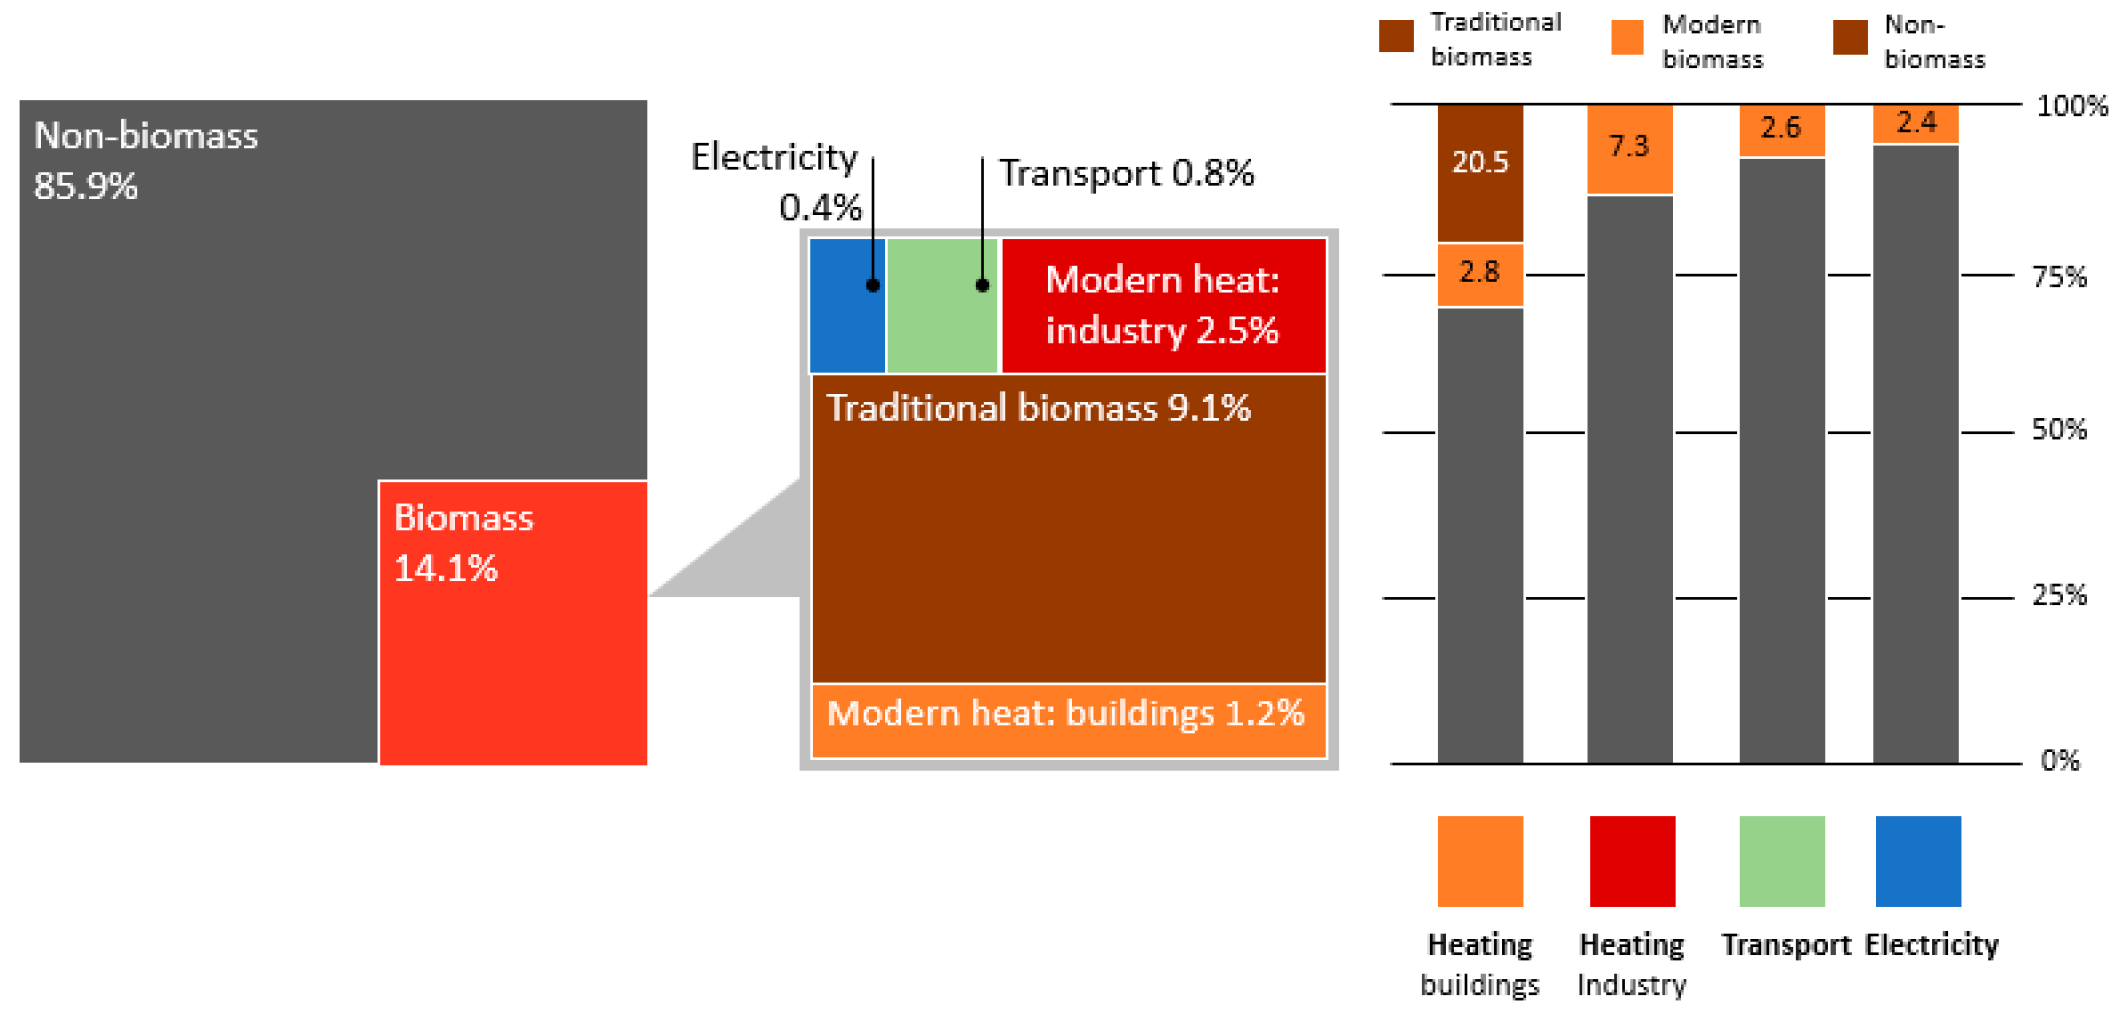
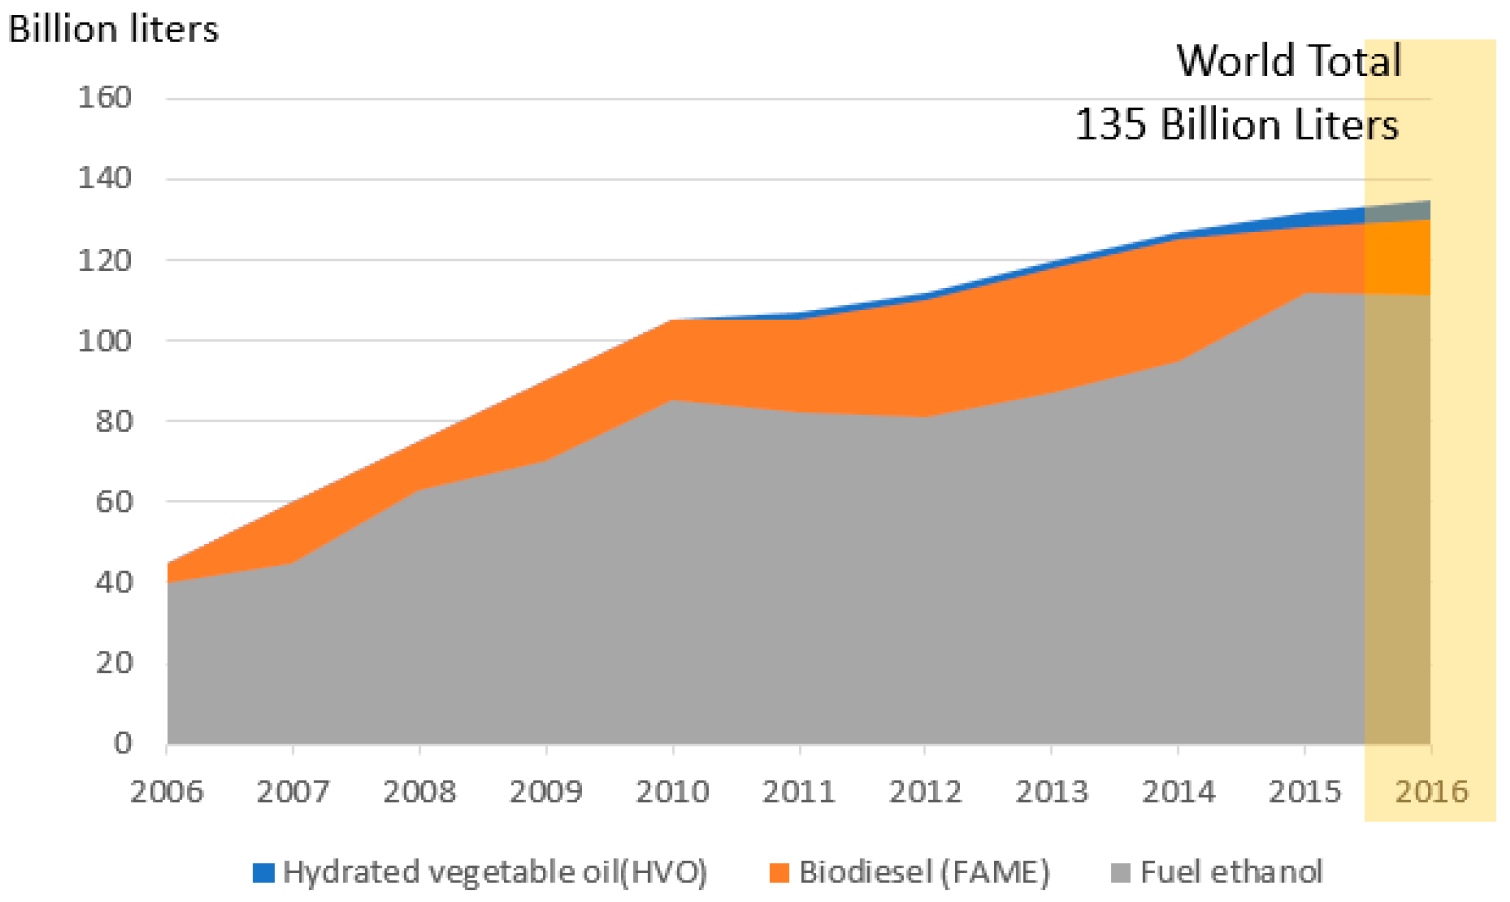
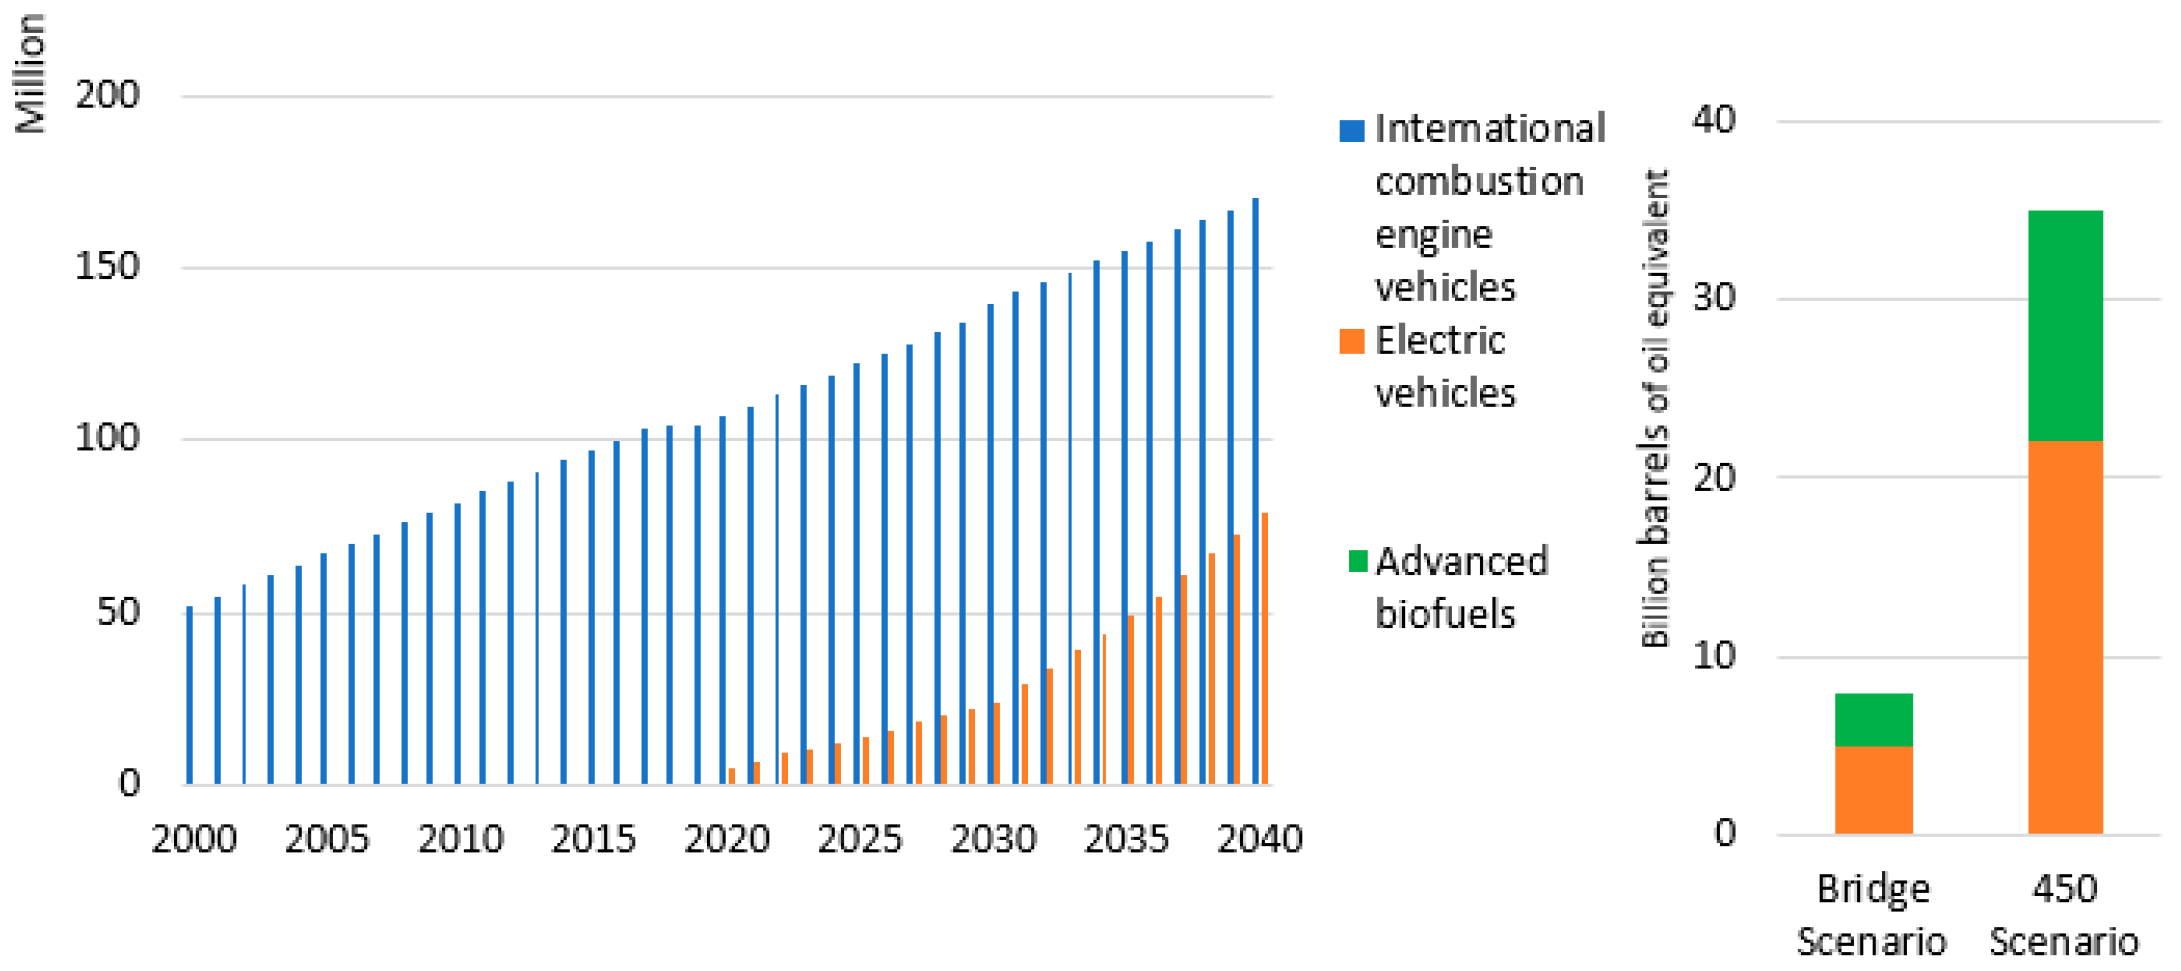
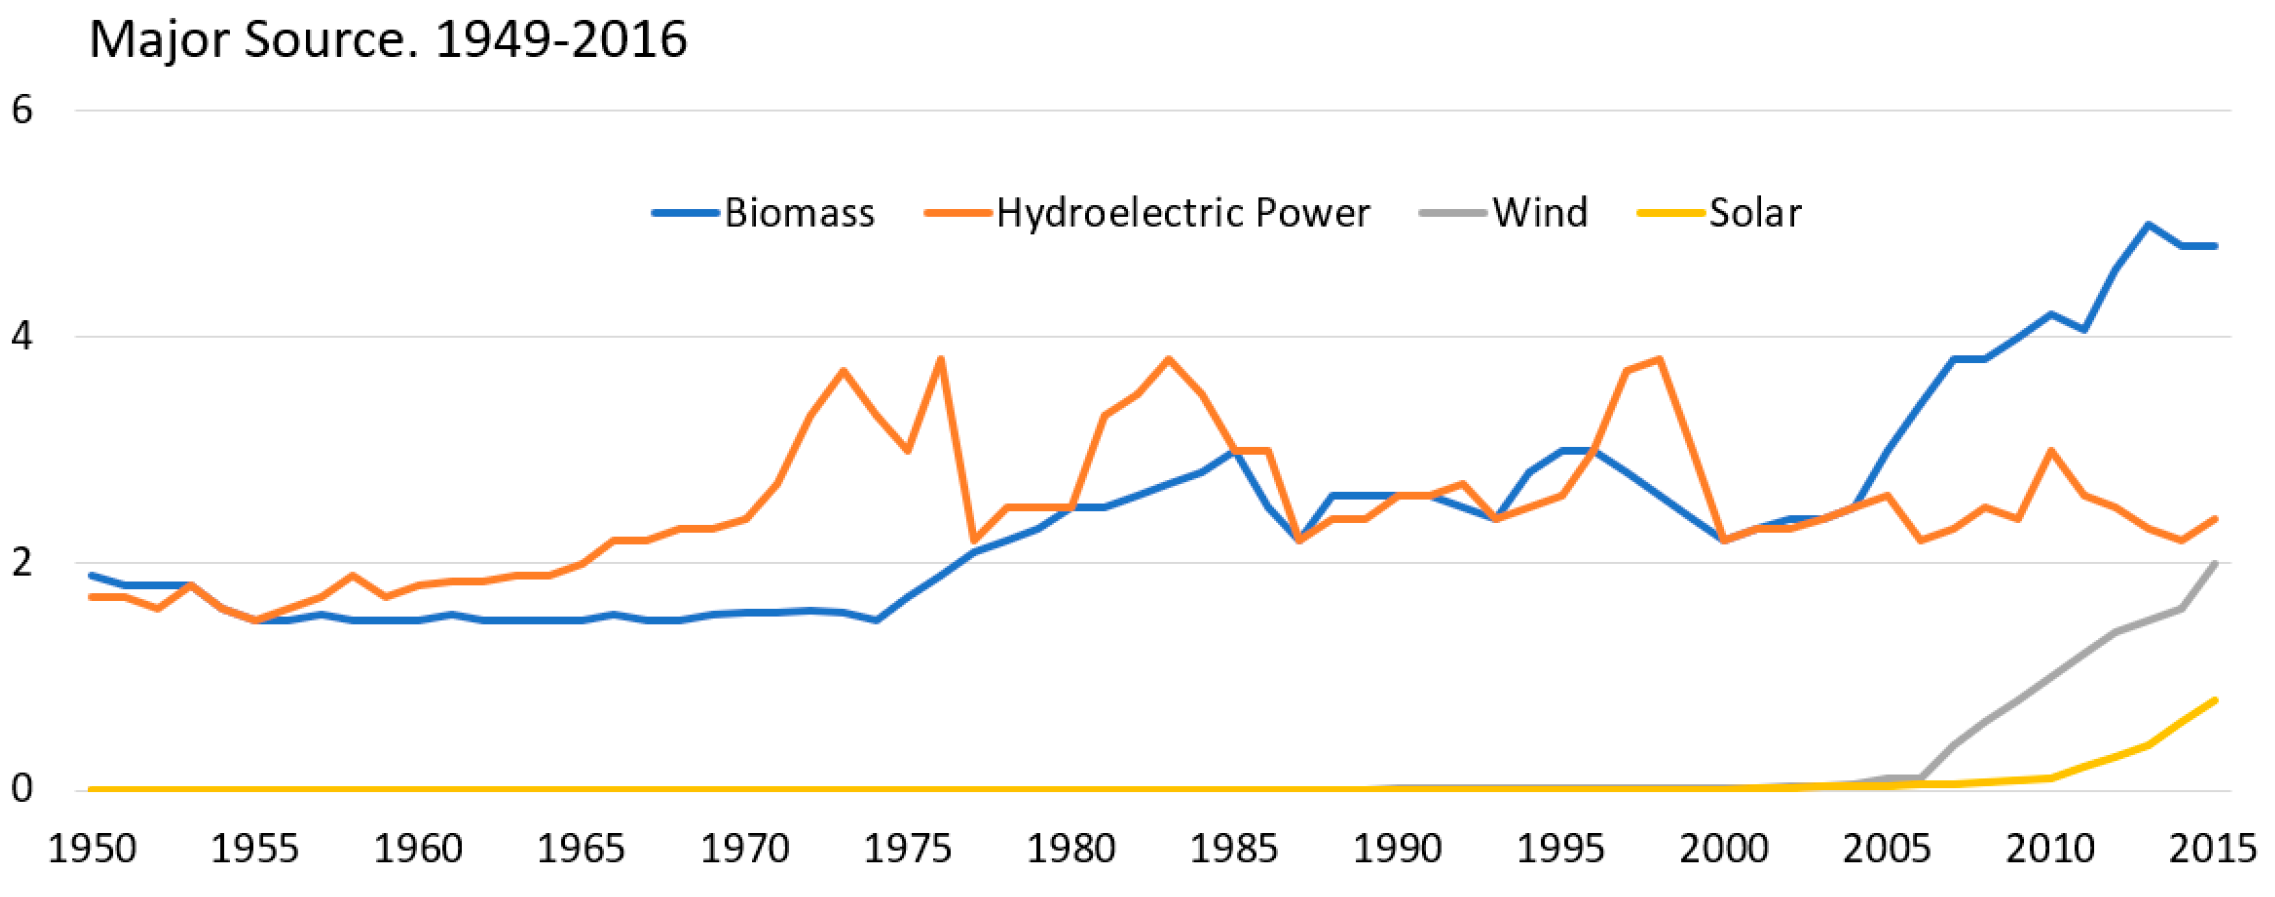
1.2. Biofuel in the World Energy Supply
1.2.1. Biofuel in the US
1.2.2. Biofuel in the EU
1.2.3. Biofuel in the UK
1.2.4. Biofuel in Korea
1.3. Comparison of RFS Program by Country
2. Data and Methods
2.1. Sustainability of Biodiesel in the US
2.2. Sustainability of Biodiesel in the UK
2.3. Sustainability of Biodiesel in Korea
2.4. Method
3. Results
4. Discussion
5. Conclusions
Author Contributions
Funding
Conflicts of Interest
Glossary
| Symbol/Acronym | Description |
| B | Biodiesel |
| CH4 | Methane |
| CI | Carbon Intensity |
| CO2 | Carbon Dioxide |
| DfT | Department for Transportation |
| DLUC | Direct Land Use Change |
| EISA | Energy Independence and Security Act |
| EPA | Environmental Protection Agency |
| ETBE | Ethyl tert-butyl ether |
| EU RED | EU Renewable Energy Directive |
| EVs | Electric Vehicles |
| FAME | Fatty Acid Methyl Ester |
| FFB | Fresh Fruit Bunches |
| GREET | Greenhouse Gases, Regulated Emissions, and Energy Use in Transportation |
| GHG | Greenhouse Gas |
| HVO | Hydrotreated Vegetable Oil |
| IEA | International Energy Agency |
| ILUC | Indirect Land Use Change |
| INDC | Intended Nationally Determined Contribution |
| KEA | Korea Energy Agency |
| K-Petro | Korea Petroleum Quality & Distribution Authority |
| LCA | Lifecycle Assessment |
| LUC | Land Use Change |
| NUTS2 | Nomenclature of Territorial Units for Statistics |
| PFAD | Palm Fatty Acid Distillate |
| RFS | Renewable Fuel Standards |
| RO | Renewables Obligation |
| RSB | Roundtable on Sustainable Biofuels |
| RTFO | Renewable Transport Fuel Obligation |
| RTFC | Renewable Transport Fuel Certificates |
| UCO | Used Cooking Oil |
| WWF | World Wildlife Fund |
Appendix A

| Biofuel and Bioliquid Production Pathway | Typical Greenhouse Gas Emissions (gCO2eq/MJ) | Default Greenhouse Gas Emissions (gCO2eq/MJ) |
|---|---|---|
| Sugar beet ethanol | 33 | 40 |
| Wheat ethanol (process fuel not specified) | 57 | 70 |
| Wheat ethanol (lignite as process fuel in CHP plant) | 57 | 70 |
| Wheat ethanol (natural gas as process fuel in conventional boiler) | 46 | 55 |
| Wheat ethanol (natural gas as process fuel in CHP plant) | 39 | 44 |
| Wheat ethanol (straw as process fuel in CHP plant) | 26 | 26 |
| Corn (maize) ethanol, Community produced (natural gas as process fuel in CHP plant) | 37 | 43 |
| Sugar cane ethanol | 24 | 24 |
| The part from renewable sources of ETBE | Equal to that of the ethanol production pathway used | |
| The part from renewable sources of TAEE | Equal to that of the ethanol production pathway used | |
| Rape seed biodiesel | 46 | 52 |
| Sunflower biodiesel | 35 | 41 |
| Soybean biodiesel | 50 | 58 |
| Palm oil biodiesel (process not specified) | 54 | 68 |
| Palm oil biodiesel (process with methane capture at oil mill) | 32 | 37 |
| Waste vegetable or animal oil biodiesel | 10 | 14 |
| Hydrotreated vegetable oil from rape seed | 41 | 44 |
| Hydrotreated vegetable oil from sunflower | 29 | 32 |
| Hydrotreated vegetable oil from palm oil (process not specified) | 50 | 62 |
| Hydrotreated vegetable oil from palm oil (process with methane capture at oil mill) | 27 | 29 |
| Pure vegetable oil from rape seed | 35 | 36 |
| Biogas from municipal organic waste as compressed natural gas | 17 | 26 |
| Biogas from wet manure as CNG | 13 | 16 |
| Biogas from dry manure as CNG | 12 | 15 |
Appendix B
- Irrespective of whether the raw materials were cultivated inside or outside the territory of the Community, energy from biofuels and bioliquids shall be taken into account for the purposes referred to in points (a), (b) and (c) only if they fulfil the sustainability criteria set out in paragraphs 2 to 6:
- (a)
- Measuring compliance with the requirements of this Directive concerning national targets;
- (b)
- Measuring compliance with renewable energy obligations;
- (c)
- Eligibility for financial support for the consumption of biofuels and bioliquids.
However, biofuels and bioliquids produced from waste and residues, other than agricultural, aquaculture, fisheries and forestry residues, need only fulfil the sustainability criteria set out in paragraph 2 in order to be taken into account for the purposes referred to in points (a), (b) and (c). - The greenhouse gas emission saving from the use of biofuels and bioliquids taken into account for the purposes referred to in points (a), (b) and (c) of paragraph 1 shall be at least 35 %. With effect from 1 January 2017, the greenhouse gas emission saving from the use of biofuels and bioliquids taken into account for the purposes referred to in points (a), (b) and (c) of paragraph 1 shall be at least 50 %. From 1 January 2018 that greenhouse gas emission saving shall be at least 60 % for biofuels and bioliquids produced in installations in which production started on or after 1 January 2017. The greenhouse gas emission saving from the use of biofuels and bioliquids shall be calculated in accordance with Article 19 (1). In the case of biofuels and bioliquids produced by installations that were in operation on 23 January 2008, the first subparagraph shall apply from 1 April 2013.
- Biofuels and bioliquids taken into account for the purposes referred to in points (a), (b) and (c) of paragraph 1 shall not be made from raw material obtained from land with high biodiversity value, namely land that had one of the following statuses in or after January 2008, whether or not the land continues to have that status:
- (a)
- Primary forest and other wooded land, namely forest and other wooded land of native species, where there is no clearly visible indication of human activity and the ecological processes are not significantly disturbed;
- (b)
- Areas designated:
- (i)
- By law or by the relevant competent authority for nature protection purposes; or
- (ii)
- For the protection of rare, threatened or endangered ecosystems or species recognized by international agreements or included in lists drawn up by intergovernmental organizations or the International Union for the Conservation of Nature, subject to their recognition in accordance with the second subparagraph of Article 18(4); unless evidence is provided that the production of that raw material did not interfere with those nature protection purposes;
- (c)
- Highly biodiverse grassland that is:
- (i)
- Natural, namely grassland that would remain grassland in the absence of human intervention and which maintains the natural species composition and ecological characteristics and processes; or
- (ii)
- Non-natural, namely grassland that would cease to be grassland in the absence of human intervention and which is species-rich and not degraded, unless evidence is provided that the harvesting of the raw material is necessary to preserve its grassland status.
The Commission shall establish the criteria and geographic ranges to determine which grassland shall be covered by point (c) of the first subparagraph. Those measures, designed to amend nonessential elements of this Directive, by supplementing it shall be adopted in accordance with the regulatory procedure with scrutiny referred to in Article 25(4). - Biofuels and bioliquids taken into account for the purposes referred to in points (a), (b) and (c) of paragraph 1 shall not be made from raw material obtained from land with high carbon stock, namely land that had one of the following statuses in January 2008 and no longer has that status:
- (a)
- Wetlands, namely land that is covered with or saturated by water permanently or for a significant part of the year;
- (b)
- Continuously forested areas, namely land spanning more than one hectare with trees higher than five meters and a canopy cover of more than 30%, or trees able to reach those thresholds in situ;
- (c)
- Land spanning more than one hectare with trees higher than five meters and a canopy cover of between 10% and 30%, or trees able to reach those thresholds in situ, unless evidence is provided that the carbon stock of the area before and after conversion is such that, when the methodology laid down in part C of Annex V is applied, the conditions laid down in paragraph 2 of this Article would be fulfilled.
The provisions of this paragraph shall not apply if, at the time the raw material was obtained, the land had the same status as it had in January 2008.
Appendix C
| Issue | Compulsory Standards | Optional Standards |
|---|---|---|
| Soil erosion: Protect soil through appropriate measures | Minimum soil cover | Retain terraces |
| Minimum land management reflecting site-specific conditions | ||
| Soil organic matter: Maintain soil organic matter levels through appropriate practices | Arable stubble management | Standards for crop rotations |
| Soil structure: Maintain soil structure through appropriate measures | Appropriate machinery use | |
| Minimum level of maintenance: Ensure a minimum level of maintenance and avoid the deterioration of habitats | Retention of landscape features, including, where appropriate, hedges, ponds, ditches trees in line, in group | Minimum livestock stocking rates or/and appropriate regimes |
| Establishment and/or retention of habitats | ||
| Avoiding the encroachment of unwanted veg | Prohibition of the grubbing up of olive trees | |
| Protection of permanent pasture | Maintenance of olive groves and vines in good vegetative condition | |
| Protection and management of water: Protect water against pollution and run-off, and manage the use of water | Establishment of buffer strips along water courses (1) | |
| Where use of water for irrigation is subject to authorization, compliance with authorization procedures |
References
- Union of Concerned Scientists. Each Country’s Share of CO2 Emission. Available online: https://www.ucsusa.org/global-warming/science-and-impacts/science/each-countrys-share-of-co2.html#.WurW3ogvzIU (accessed on 1 October 2018).
- Chow, E.; Thukral, N. Malaysia to Respond with ‘Might and Tact’ If EU proceeds with Palm Oil Curbs. JakartaGlobe. Available online: https://jakartaglobe.id/international/malaysia-respond-might-tact-eu-proceeds-palm-oil-curbs-minister/ (accessed on 1 October 2018).
- Renewables 2017 Global Status Report; REN21 Secretariat: Paris, France, 2017; pp. 45–51. ISBN 978-3-9818107-6-9.
- Energy and Climate Change: World Energy Outlook Special Report; OECD/IEA: Paris, France, 2015; Available online: https://www.iea.org/publications/freepublications/publication/WEO2015SpecialReportonEnergyandClimateChange.pdf (accessed on 1 October 2018).
- DeCicco, J. Biofuels turn out to be a climate mistake – here’s why. Available online: https://theconversation.com/biofuels-turn-out-to-be-a-climate-mistake-heres-why-64463 (accessed on 1 October 2018).
- 2017 global fuel ethanol production by country [Chart]. In 2018 Ethanol Industry Outlook; Renewable Fuels Association (RFA): Washington, DC, USA, 2018; p. 13. Available online: http://www.ethanolresponse.com/wp-content/uploads/2018/02/2018-RFA-Ethanol-Industry-Outlook.pdf (accessed on 1 October 2018).
- Renewable energy consumption [Figure 10.1]. In Monthly Energy Review; U.S. Energy Information Administration, Government Printing Office: Washington, DC, USA, 2018. Available online: https://www.eia.gov/totalenergy/data/monthly/pdf/sec10_2.pdf (accessed on 1 October 2018).
- Fargione, J.; Hill, J.; Tilman, D.; Polasky, S.; Hawthorne, P. Land clearing and the biofuel carbon debt. Science 2008, 319, 1235–1238. [Google Scholar] [CrossRef] [PubMed]
- Searchinger, T.; Heimlich, R.; Houghton, R.A.; Dong, F.; Elobeid, A.; Fabiosa, J.; Tokgoz, S.; Hayes, D.; Yu, T. Use of U.S. croplands for biofuels increases greenhouse gases through emissions from land-use change. Science 2008, 319, 1238–1240. [Google Scholar] [CrossRef]
- Fredriksson, G.; Roth, A.; Tagliapietra, S.; Zachmann, G. The Impact of Brexit on the EU Energy System; IP/A/ITRE: Brussels, Belgium, 2017; ISBN 978-92-846-2255-9. Available online: http://www.europarl.europa.eu/RegData/etudes/STUD/2017/614181/IPOL_STU(2017)614181_EN.pdf (accessed on 2 October 2018).
- Valin, H.; Peters, D.; Van den Berg, M.; Frank, S.; Havlik, P.; Forsell, N.; Hamelinck, C. The Land Use Change Impact of Biofuels Consumed in the EU: Quantification of Area and Greenhouse Gas Impacts; Ecofys: Utrecht, The Netherlands, 2015; Available online: https://ec.europa.eu/energy/sites/ener/files/documents/Final% 20Report_GLOBIOM_publication.pdf (accessed on 1October 2018).
- Nelson, A. MEPs vote to ban the use of palm oil in biofuels. The Guardian, 4 April 2017. Available online: https://www.theguardian.com/sustainable-business/2017/apr/04/palm-oil-biofuels-meps-eu-transport-deforestation-zsl-greenpeace-golden-agri-resources-oxfam (accessed on 11 November 2018).
- The EU’s war on palm oil. Available online: https://www.aseantoday.com/2018/03/the-eus-war-on-palm-oil/ (accessed on 11 November 2018).
- Observatory of Economic Complexity (OEC). Indonesia. Available online: https://atlas.media.mit.edu/en/profile/country/idn/ (accessed on 2 October 2018).
- Guillaume, T.; Kotowska, M.; Hertel, D.; Knohl, A.; Krashevska, V.; Kukuh, M.; Scheu, S.; Kuzyakov, Y. Carbon costs and benefits of Indonesian rainforest conversion to plantations. Nat. Commun. 2018, 9, 2388. [Google Scholar] [CrossRef]
- Renewable Transport Fuel Obligation (RTFO). Available online: http://mrl.uk.com/renewable-transport-fuel-obligation-rtfo/ (accessed on 11 November 2018).
- Renewable Transport Fuel Obligation Guidance Part One: Process Guidance Year 11: 15/4/18 to 31/12/18. Moving Britain Ahead; Department for Transport: London, UK, 2018. Available online: https://assets.publishing.service.gov.uk/government/uploads/system/uploads/attachment_data/file/694277/rtfo-guidance-part-1-process-guidance-year-11.pdf (accessed on 2 October 2018).
- Kim, J.G.; Min, K.I.; Jang, E.J.; Kim, S.; Lee, D.M.; Park, J.Y.; Lee, M.E.; Choi, W.H.; Ahn, S.H. Study on Establishment of Biofuel Promotion Policy for Transportation; K-Petro: Seongnam, Korea, 2016. [Google Scholar]
- A Road Map to Cut Greenhouse Gas Emissions by 37 Percent. Available online: http://2030ghg.or.kr/references/?mod=document&uid=15 (accessed on 10 November 2018).
- Yoon, B.H. The new government stresses renewable energy and will increase blend rate of biodiesel. Available online: http://www.ebn.co.kr/news/view/902953 (accessed on 2 October 2018).
- Kim, B.H. Palm Plantation Indiscriminate Felling. Emits Three Times More Greenhouse Gas Emissions than Diesel. Available online: http://news.hankyung.com/article/ 2018031895191 (accessed on 2 October 2018).
- Shim, N.Y. Let’s Reduce Carbon. The Diesel Price Will Grow Again Next Year. Available online: http://www.asiae.co.kr/news/view.htm?idxno=2017102022481273270 (accessed on 2 October 2018).
- Biodiesel Rate Will Be Increased in Diesel. So, What about the Price of Oil. Available online: http://www.yonhapnews.co.kr/bulletin/2015/03/03/0200000000AKR20150303187100003.HTML (accessed on 2 October 2018).
- Kang, K.J. $46 million additional burden is expected to refineries in Korea by RFS. Available online: http://news.joins.com/article/18415013 (accessed on 2 October 2018).
- An, Y.I. Can biofuel work to reduce GHGs? Available online: https://news.sbs.co.kr/news/endPage.do?news_id=N1002850508 (accessed on 2 October 2018).
- Renewable Fuel Standard. Available online: https://www.knrec.or.kr/business/rfs_about.aspx (accessed on 11 November 2018).
- Renewable Fuel Standard Program. Available online: https://www.epa.gov/renewable-fuel-standard-program/overview-renewable-fuel-standard (accessed on 11 November 2018).
- Renewable Transport Fuel Obligation Guidance Part Two: Carbon and Sustainability Year 11: 15/4/18 to 31/12/18. Moving Britain Ahead; Department for Transport: London, UK, 2018; Available online: https://assets.publishing (accessed on 11 November 2018).
- Sustainability of Bioenergy; Commission Staff Working Document: Impact Assessment; European Commission: Brussels, Belgium, 2016; Available online: https://ec.europa.eu/energy/sites/ener/files/documents/1_en_impact_assessment_part4_v4_418.pdf (accessed on 2 October 2018).
- Statutes for Renewable Fuel Standard Program. Available online: https://www.epa.gov/renewable-fuel-standard-program/statutes-renewable-fuel-standard-program (accessed on 11 November 2018).
- Hamelinck, C.; Zabeti, M. Low Carbon Biofuels for the UK; Ecofys: Utrecht, The Netherlands, 2016; Available online: https://epure.org/media/1418/ecofys-2016-low-carbon-biofuels-for-the-uk.pdf (accessed on 11 November 2018).
- Renewable Fuel Standard Program. U.S. Environmental Protection Agency (EPA), Last updated 19 September 2018. Available online: https://www.epa.gov/renewable-fuel-standard-program (accessed on 2 October 2018).
- Fuel Pathways under Renewable Fuel Standard. EPA, Last Updated 6 June 2017. Available online: https://www.epa.gov/renewable-fuel-standard-program/fuel-pathways-under-renewable-fuel-standard (accessed on 2 October 2018).
- Enström, A. GHG Reduction with Solid Separation in POME Ponds: Introducing New Emission Factors for Alternative CH4 Reduction Techniques. Available online: https://www.iscc-system.org/wp-content/uploads/2017/08/2.-Reducing-the-Impact-of-Methane-Emissions-2.pdf (accessed on 2 October 2018).
- Overview for Renewable Fuel Standard. EPA, Last Updated 7 June 2017. Available online: https://www.epa.gov/renewable-fuel-standard-program/overview-renewable-fuel-standard#pathways (accessed on 2 October 2018).
- Lifecycle Greenhouse Gas Emissions for Select Pathways [Table]. EPA. 2016. Available online: https://www.epa.gov/sites/production/files/2016-07/documents/select-ghg-results-table-v1.pdf (accessed on 2 October 2018).
- EPA Issues Notice of Data Availability Concerning Renewable Fuels Produced from Palm Oil under the RFS Program. EPA, Office of Transportation and Air Quality. 2011. Available online: https://www.epa.gov/sites/ production/ files/2015-08/documents/420f11046.pdf (accessed on 2 October 2018).
- Kotrba, R. US Biodiesel Production, Imports Remain Strong Amid Uncertainty. Available online: http://www.biodieselmagazine.com/articles/2516126/us-biodiesel-production-imports-remain-strong-amid-uncertainty (accessed on 2 October 2018).
- Elgowainy, A.; Han, J.; Ward, J.; Joseck, F.; Gohlke, D.; Lindauer, A.; Ramsden, T.; Biddy, M.; Alexander, M.; Barnhart, S.; et al. Cradle-to-Grave Lifecycle Analysis of US Light-Duty Vehicle-Fuel Pathways: A Greenhouse Gas Emissions and Economic Assessment of Current (2015) and Future (2025–2030) Technologies; Argonne National Laboratory, Energy Systems Division: Chicago, IL, USA, 2016. Available online: https://greet.es.anl.gov/publication-c2g-2016-report (accessed on 2 October 2018).
- Neslen, A. UK Defies EU over Indonesian Palm Oil Trade. The Guardian. 9 March 2018. Available online: https://www.theguardian.com/environment/2018/mar/09/uk-defies-eu-over-indonesian-palm-oil-trade-leaked-papers-show (accessed on 2 October 2018).
- Richards, A. Iceland Supermarket Vows to Ban Palm Oil in Own-Brand Products. Evening Standard. Available online: https://www.standard.co.uk/news/uk/iceland-supermarket-vows-to-ban-palm-oil-in-ownbrand-products-a3810141.html (accessed on 2 October 2018).
- Renewable Energy Association (REA) News. UK Palm Oil-Based Biodiesel Consumption Is Zero to Date in 2015/16. 31 May 2016. Available online: https://www.r-e-a.net/news/uk-palm-oil-based-biodiesel-consumption-is-zero-to-date-in-2015-16 (accessed on 2 October 2018).
- Renewables Obligation: Sustainability Criteria; Ofgem, Fuelling and Sustainability Team, Renewable Electricity: London, UK, 2016. Available online: https://www.ofgem.gov.uk/system/files/docs/2016/03/ofgem_ro_sustainability_criteria_guidance_march_16.pdf (accessed on 2 October 2018).
- Directive 2009/28/EC of the European Parliament and of the Council of 23 April 2009 on the Promotion of the Use of Energy from Renewable Sources and Amending and Subsequently Repealing Directives 2001/77/EC and 2003/30/EC. Official Journal of the European Union. 2009. Available online: https://eur-lex.europa.eu/legal-content/EN/TXT/PDF/?uri=CELEX:32009L0028&from=EN (accessed on 2 October 2018).
- New UK Biofuel Targets Take Effects April 15. Revista RPAnews. Available online: http://revistarpanews. com.br/noticias/64-internacional/5748-new-uk-biofuel-targets-take-effect-april-15 (accessed on 2 October 2018).
- Hong, W.A. Study on the Improvement of the Cold Properties of Biodiesel and Biodiesel-Blended. Master’s Thesis, Seoul National University of Science and Technology, Seoul, Korea, 2017. Available online: http://www.riss.kr/link?id=T14733130 (accessed on 2 October 2018).
- National Greenhouse Gas Inventory Report of Korea; Greenhouse Gas Inventory and Research Center: Seoul, Korea, 2017; Available online: http://www.gir.go.kr/home/board/read.do;jsessionid=Dl2BTno8jLQAFQTQLXOvEWZEB633Q2RJVbXS9E23Oc72O0xCM8JxzCNaDhjgVUEp.og_was_servlet_engine1?pagerOffset=0&maxPageItems=10&maxIndexPages=10&searchKey=&searchValue=&menuId=36&boardId=41&boardMasterId=2&boardCategoryId= (accessed on 2 October 2018).
- 2030 Road Map. Available online: http://2030ghg.or.kr/references/?mod=document&uid=15 (accessed on 10 November 2018).
- Malins, C. Driving Deforestation; Cerulogy and Rainforest Foundation: Oslo, Norway, 2018; Available online: https://d5i6is0eze552.cloudfront.net/documents/Publikasjoner/Andre-rapporter/Cerulogy_Driving-deforestation_Jan2018.pdf?mtime=20180122234132 (accessed on 10 November 2018).
- Tessum, C.; Hill, J.; Marshall, J. Life cycle air quality impacts of conventional and alternative light-duty transportation in the United States. Proc. Natl. Acad. Sci. USA 2014, 111, 18490–18495. [Google Scholar] [CrossRef]


| Korea | US | UK | |
|---|---|---|---|
| Program | RFS | RFS | RTFO |
| Implement agency | KEA, K-Petro | EPA | DfT |
| Start year | 2015 | RFS 1: 2007.9~2010.11 RFS 2: 2010.12~2022 | 2008 |
| Volume target | Blending 3% biodiesel with conventional diesel (2018~2020) | 36 billion gallons of renewable fuel by 2022 | Biofuel volume - 2018: 7.3%, 2020: 9.8%, 2032: 12.4% |
| Renewable fuel under the RFS | Biodiesel | Biomass-based diesel Cellulosic and Advanced biofuel Total renewable fuel | Biofuel, partial biofuels, renewable fuels of non-biological origin (RFNBOs) and fuels that are part RFNBO, part non-RFNBO |
| Obligated parties | Refineries or imports of diesel fuel | Refineries or imports of gasoline or diesel fuel | Suppliers of transport and nonroad mobile machinery fuel |
| Compliance | Blending biodiesel into transportation fuel | Blending renewable fuels into transportation fuel obtaining credits, Renewable Identification Numbers (RINs) to meet an EPA-specific renewable volume obligation | Mandatory sustainability criteria have to be met for biofuels to be issued with Renewable Transport Fuel Certificates (RTFCs) and count towards suppliers’ obligations |
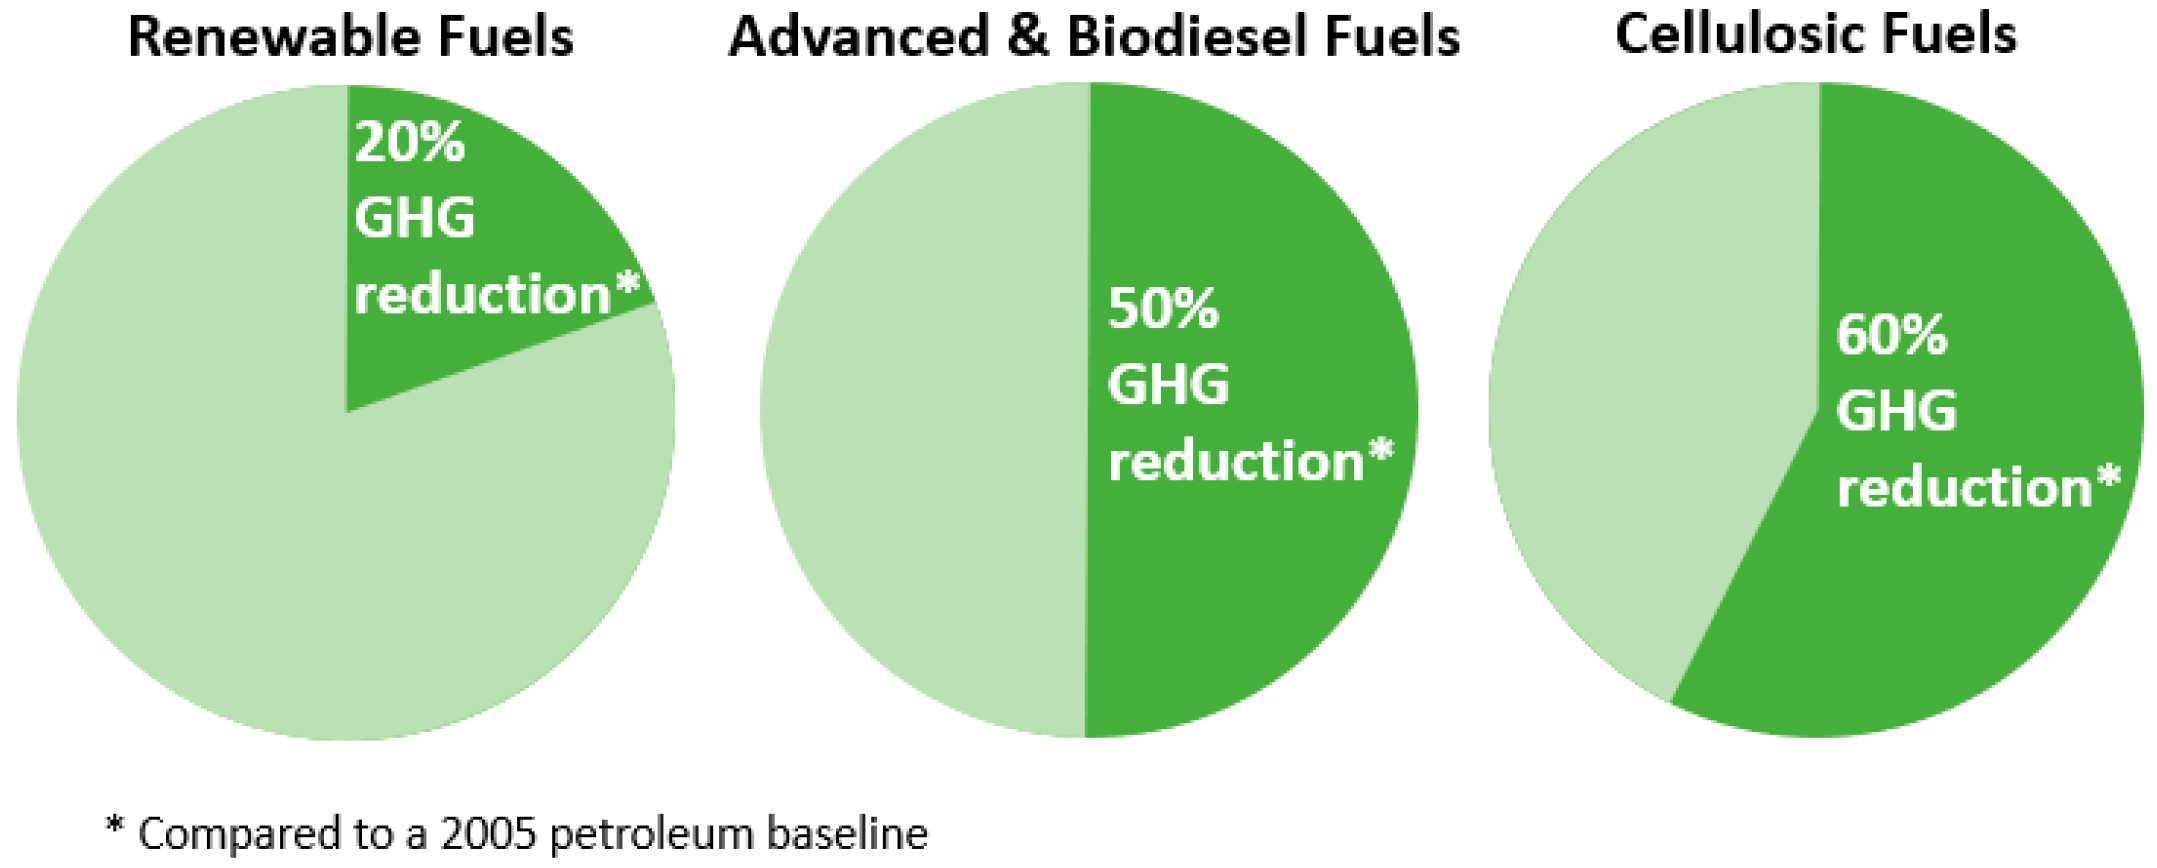
| Fuel pathway (Sustainability) | All of the biodiesels blended are granted to be 100% GHG reduction, carbon neutral | Lifecycle GHG reduction (as compared to a 2005 petroleum baseline)
| At least 60% lower carbon footprint than their fossil fuel alternatives GHG, 83.8 gCO2eq/MJ |
| Feedstock | Production Process | Ag. Impact | LUC | Feedstock Transport | Fuel Production | Fuel Dist. & Use | Net Emissions | % Reduction |
|---|---|---|---|---|---|---|---|---|
| Algal oil | Transesterification (Open pond, mid) | 0.0 | 0.0 | 0.0 | 31.5 | 1.5 | 33.0 | 66% |
| Transesterification (PBR, mid) | 0.0 | 0.0 | 0.0 | 26.3 | 1.5 | 27.8 | 71% | |
| Canola oil | Transesterification | 8.2 | 33.9 | 1.6 | 2.9 | 1.5 | 48.1 | 50% |
| Cellulose from corn stover | Fischer-Tropsch process | 11.6 | −11.2 | 1.2 | 5.4 | 2.0 | 9.0 | 91% |
| Palm oil | Transesterification | 4.8 | 46.1 | 1.3 | 25.1 | 3.4 | 80.7 | 17% |
| Hydrotreating | 4.8 | 46.8 | 2.0 | 30.9 | 2.2 | 86.7 | 11% | |
| Soy bean oil | Transesterification | −8.8 | 33.6 | 2.7 | 13.2 | 1.5 | 42.2 | 57% |
| Switch-grass | Fischer-Tropsch process | 6.5 | 13.1 | 1.6 | 5.4 | 2.0 | 28.6 | 71% |
| Yellow grease | Transesterification | 0.0 | 0.0 | 2.7 | 9.6 | 1.5 | 13.8 | 86% |
| Petroleum | Refining | 0.0 | 0.0 | 0.0 | 18.0 | 79.0 | 97.0 | 0% |
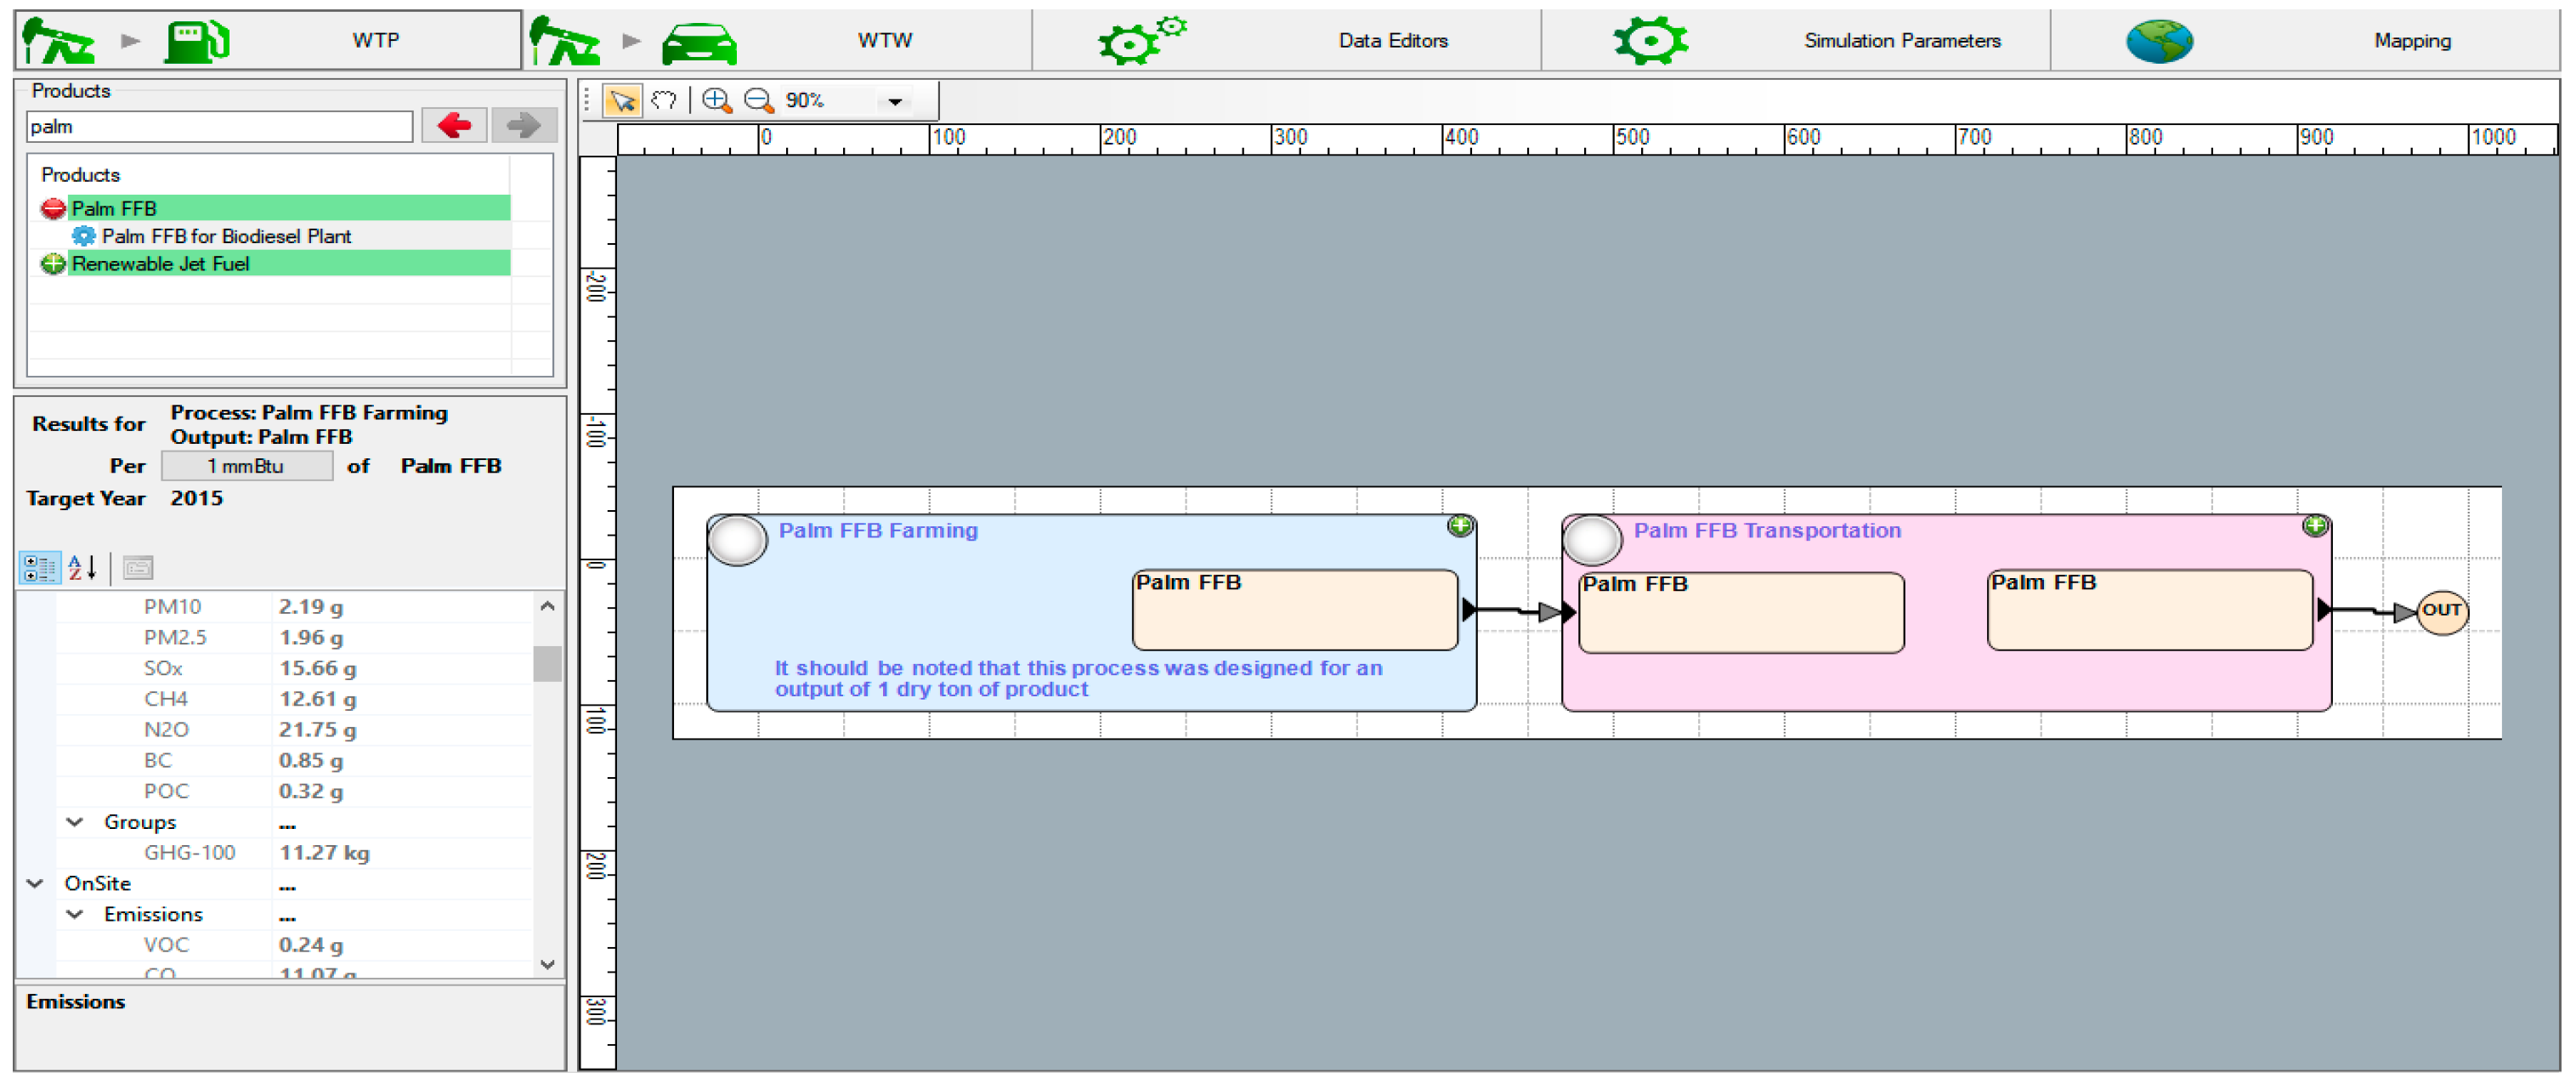
| Emissions | Feedstock | Fuel |
|---|---|---|
| Loss factor | 1.000 | |
| Unit | per mmBtu | per mmBtu |
| Total energy | 73,005 | 243,951 |
| Fossil fuels | 72,341 | 184,803 |
| Coal | 1,802 | 10,100 |
| Natural gas | 43,444 | 127,123 |
| Petroleum | 27,095 | 47,579 |
| Water consumption | 3.575 | 4.651 |
| VOC | 5.904 | 5.430 |
| CO | 12.704 | 11.621 |
| NOx | 33.699 | 68.841 |
| PM10 | 2.004 | 5.230 |
| PM2.5 | 1.754 | 4.664 |
| SOx | 14.471 | 39.803 |
| BC | 0.705 | 0.802 |
| OC | 0.302 | 1.757 |
| CH4 | 12.373 | 29.676 |
| N2O | 19.659 | 0.170 |
| CO2 | 5,104 | 12,498 |
| CO2 (w/C in VOC & CO) | 5,143 | 12,533 |
| GHGs | 10,723 | 13,468 |
| Before 1 January 2017 | 1 January ~31 December 2017 | On or after 1 January 2018 | ||
|---|---|---|---|---|
| For bioliquids produced in an installation that started producing bioliquid before 1 January 2017 | For bioliquids not produced in an installation that started producing bioliquid before 1 January 2017 | |||
| GHG emission threshold | 35% | 50% | 50% | 60% |
| Bioliquid Production Pathway | Default CI [gCO2eq/MJ] | Disaggregated Default Values [gCO2eq/MJ] | GHG Saving | ||
|---|---|---|---|---|---|
| Cultivation | Processing | Transport & Distribution | |||
| Palm oil biodiesel (process not specified) | 68 | 14 | 49 | 5 | 19% |
| Rape seed biodiesel | 52 | 29 | 22 | 1 | 38% |
| Soybean biodiesel | 58 | 19 | 26 | 13 | 31% |
| Waste vegetable or animal biodiesel | 14 | 0 | 13 | 1 | 83% |
| General Information | Country of Origin Information | Land Use | CI | Indirective RED Compliance | |||||||
|---|---|---|---|---|---|---|---|---|---|---|---|
| Consignment. No. | Fuel Type | Biofuel Feedstock | Production Process | Country of Origin | NUTS2 Compliance | Land Use on 1 January 2008 | Carbon Intensity | GHG | Bio-diversity | C-stock | RED Compliance |
| 01 | Bio-ethanol | Wheat | Unknown | UK | Y | Cropland- protected | 70 | N | Y | Y | N |
| 02 | Bio-ethanol | Wheat | Natural gas CHP | Croatia | HRO4 | Cropland- protected | 44 | N | Y | Y | N |
| 03 | Bio-ethanol | Bio- gasses | - | Brazil | N/A | - | 35 | Y | N | N | N |
| 04 | Bio-diesel | Oilseed rape | - | UK | Y | Cropland- non-protected | 52 | N | Y | Y | N |
| 05 | Bio-diesel | UCO | - | Waste/non- ag. residue | N/A | Waste/non- ag. residue | 14 | Y | Y | Y | Y |
| 06 | Biogas | Dry manure | - | Waste/non- ag. residue | N/A | Waste/non- ag. residue | 15 | Y | Y | Y | Y |
| Fuel | Feedstock | Process Characteristic | CI (gCO2eq/MJ) | Carbon Saving (%) |
|---|---|---|---|---|
| Bioethanol, ETBE, TAME | Corn (produced within the EU) | Natural gas a process fuel in CHP plant | 43 | 49 |
| Wheat | Lignite as process fuel in CHP plant | 70 | 16 | |
| Natural gas as process fuel in conventional boiler | 55 | 34 | ||
| Natural gas as process fuel in CHP plant | 44 | 47 | ||
| Straw as process fuel in CHP plant | 26 | 69 | ||
| Biodiesel (Methyl ester) | Palm | Methane capture at oil mill | 37 | 56 |
| Biodiesel (HVO) | Palm | Methane capture at oil mill | 29 | 65 |
| Feedstock | 2006 | 2008 | 2010 | 2012 | 2014 | 2015 | |
|---|---|---|---|---|---|---|---|
| Domestic | UCO | 16 | 57 | 78 | 121 | 144.3 | 147.1 |
| Tallow | - | - | - | - | 14.9 | 27.4 | |
| Others | 0.4 | 0.1 | - | - | 5.3 | 4.5 | |
| Subtotal | 16.4 | 57.1 | 78 | 121 | 164.5 | 179.0 | |
| Imported | Soybean | 46 | 69 | 80 | 19 | 3.5 | 2.8 |
| Palm fatty acid distillate (PFAD) | - | 30 | 102 | 136 | 154.8 | 169.6 | |
| Palm oil | - | 34 | 69 | 62 | 21.4 | 28.3 | |
| UCO | - | 0.1 | 25 | 38 | 34.8 | 34.5 | |
| Tallow (Beef) | - | - | - | - | - | - | |
| Others | - | 16 | 4 | 9 | 5.2 | 7.1 | |
| Subtotal | 46 | 149.1 | 280 | 264 | 219.7 | 242.3 | |
| Total | 62.4 | 149.1 | 280 | 385 | 384.2 | 421.5 | |
| Localization rate | 26.3 | 27.7 | 21.8 | 31.4 | 42.8 | 42.5 | |
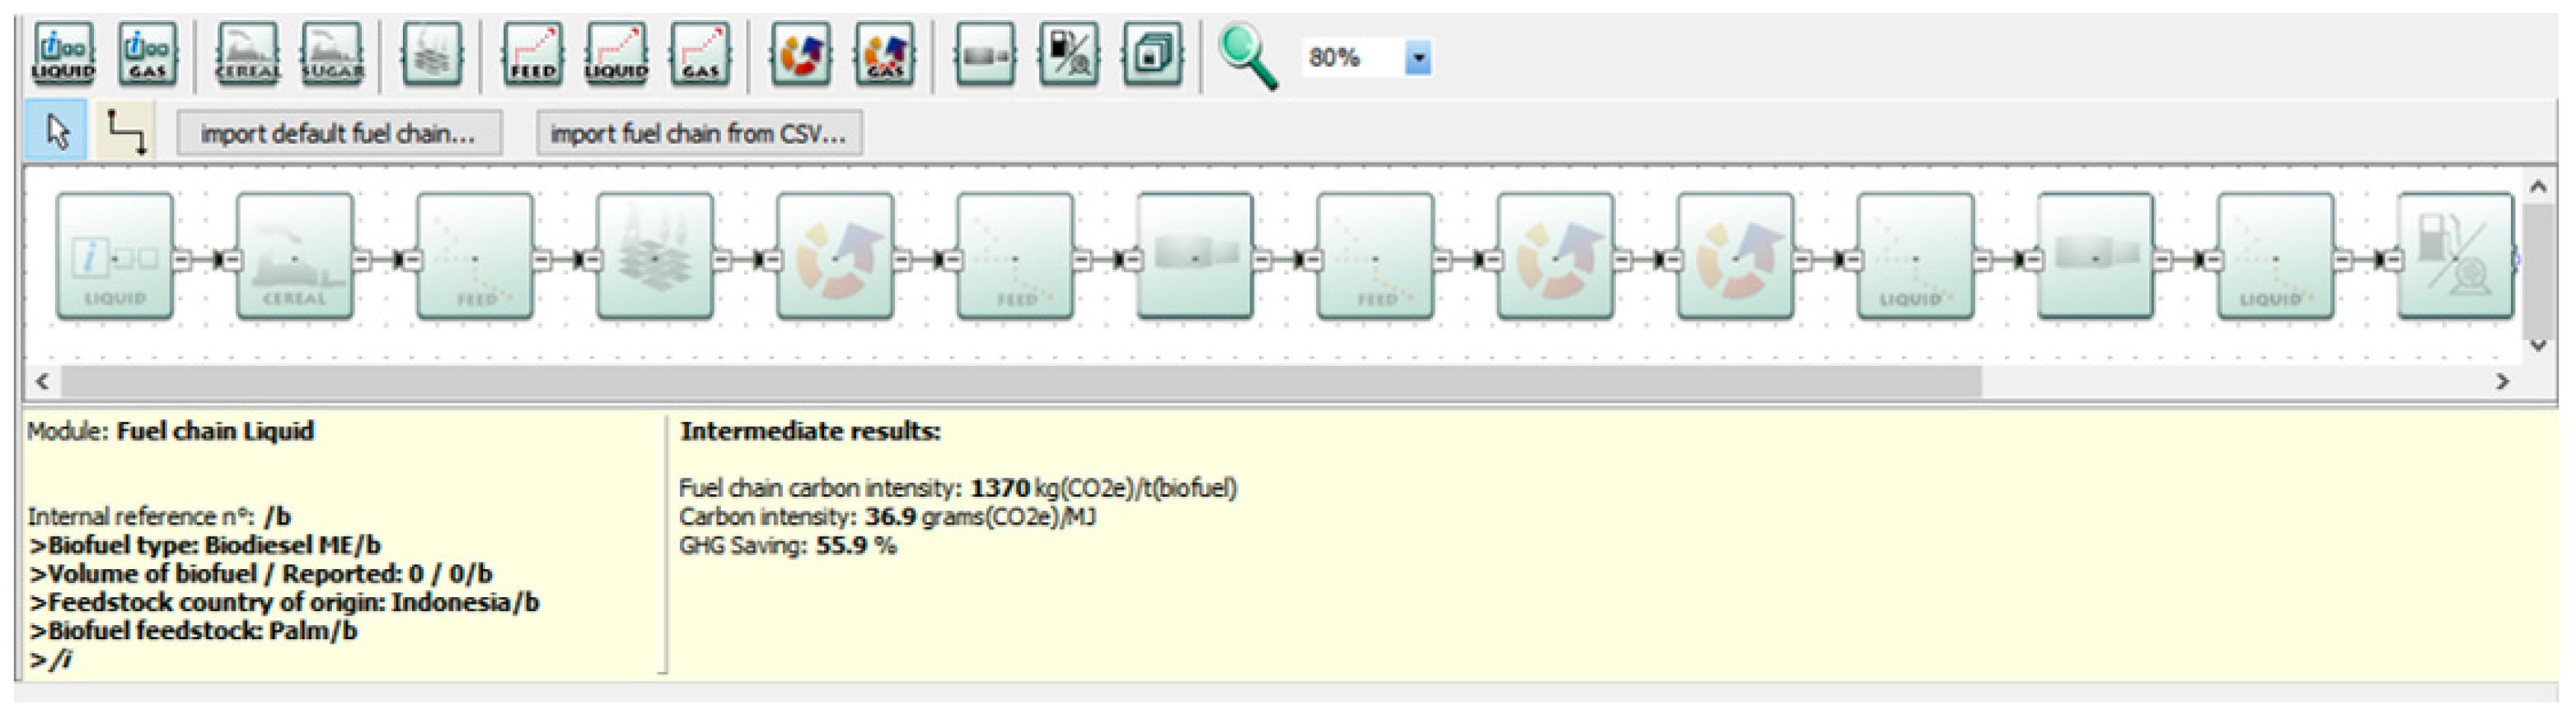
| 103ton | Percent | CI (gCO2eq/MJ) | CI (kgCO2eq/t(Biofuel) | GHG Emissions (103 tCO2eq) | |
|---|---|---|---|---|---|
| UCO | 181.6 | 43% | 14 | 471 | 85.5 |
| Tallow | 27.4 | 7% | 14 | 471 | 12.9 |
| PFAD | 169.6 | 40% | 37 | 1370 | 232.4 |
| Palm oil | 28.3 | 7% | 37 | 1370 | 39.5 |
| Others | 14.4 | 3% | - | - | - |
| Total | 421.5 | 100% | 370.2 |
| Energy Used (103TOE) | Total GHG Emission (103tCO2eq) | |
|---|---|---|
| Diesel | 17,358.0 | 53,898.5 |
| Biodiesel | 441.0 | - |
| Total | 17,799.0 | 53,898.5 |
| Energy Used (103TOE) | % of Total | Total GHG Emission (103tCO2eq) | % of Total | |
|---|---|---|---|---|
| Diesel | 17,358.0 | 97.5 | 53,898.5 | 99.3 |
| Biodiesel | 441.0 | 2.5 | 370.2 | 0.7 |
| Total | 17,799.0 | 100.0 | 54,268.7 | 100.0 |
| No-Biodiesel Scenario | GHG Emission (103tCO2eq) | |||
|---|---|---|---|---|
| 103 TOE | Amount inc/dec | GHG Total | Amount inc/dec | |
| Diesel | 17,799.0 | +441.0 | 55,267.9 | +1,369.4 |
| Biodiesel | 0.0 | −441.0 | 0.0 | −370.2 |
| Net increase in GHG in a no-biodiesel scenario | +999.2 | |||
| Feedstock | The Amount that Can Be Secured | Feedstock Cost | Unit Cost of Production | Ranking Supply Potential |
|---|---|---|---|---|
| Palm and PFAD | ★★★★★ | ★★★★ | ★★★★★ | 1 |
| Domestic UCO | ★★★★ | ★★★★ | ★★★★ | 2 |
| Domestic tallow | ★★★ | ★★★★ | ★★★★ | 3 |
| Domestic waste oil | ★★ | ★★★★★ | ★★ | 4 |
| Domestic rape oil | ★★★ | ★ | ★★★★★ | 5 |
| Domestic Microalgae | ★ | ★ | ★ | 6 |
© 2018 by the authors. Licensee MDPI, Basel, Switzerland. This article is an open access article distributed under the terms and conditions of the Creative Commons Attribution (CC BY) license (http://creativecommons.org/licenses/by/4.0/).
Share and Cite
Shin, J.-Y.; Kim, G.-W.; Zepernick, J.S.; Kang, K.-Y. A Comparative Study on the RFS Program of Korea with the US and UK. Sustainability 2018, 10, 4618. https://doi.org/10.3390/su10124618
Shin J-Y, Kim G-W, Zepernick JS, Kang K-Y. A Comparative Study on the RFS Program of Korea with the US and UK. Sustainability. 2018; 10(12):4618. https://doi.org/10.3390/su10124618
Chicago/Turabian StyleShin, Jung-Yull, Gun-Woo Kim, Janet S. Zepernick, and Kyu-Young Kang. 2018. "A Comparative Study on the RFS Program of Korea with the US and UK" Sustainability 10, no. 12: 4618. https://doi.org/10.3390/su10124618
APA StyleShin, J.-Y., Kim, G.-W., Zepernick, J. S., & Kang, K.-Y. (2018). A Comparative Study on the RFS Program of Korea with the US and UK. Sustainability, 10(12), 4618. https://doi.org/10.3390/su10124618