1. Introduction
Public support of Research and Development (R&D) plays an important role in national economic policies. This is perfectly sensible since R&D expenditure is often regarded as a necessary condition for innovation, which is in turn one of the key determinants of sustainable economic growth [
1]. The importance of R&D and innovation for quality of life, social welfare and the environment, which are important elements of sustainable development in general, has been confirmed by much research (for example [
2,
3,
4]). At the micro level, companies may even tend to innovate and produce more sustainable production systems as a response to new social and environmental issues [
5]. However, those positive effects are usually supposed to be more or less just “side effects” of innovation. The main reason why agents invest in R&D and innovate is probably to gain a competitive advantage and to achieve better performance. Using the resource based view (RBV) framework proposed by [
6], R&D expenditure may be viewed as one of the key resources contributing to the sustainable competitive advantage of a company [
7] Truly, enterprises that have a meaningful R&D strategy and invest in R&D tend to gain a competitive advantage over their competitors [
8,
9]. Such an advantage can be treated as sustainable only when it manifests in constantly better performance [
10]. Damanpour and Evan [
11] argue that innovation is a crucial factor for a firm’s performance, growth, and survival. At this point we arrive at the “economic sustainability” of a company–which is in fact the ability of a company to stay in business [
12]. Doan and MacGillivray [
12] see economic sustainability to be an integral part of sustainable development and growth, relying mainly on a company’s financial performance and assets management. Out of all performance measures, the centerpiece of a company’s economic sustainability and sustainable economic growth possibly lies in its increased value added and productivity [
13]. Intuitively, economic sustainability should be closely related to competitiveness as only those companies that are competitive can endure for the long term. Of course, competitiveness is quite a broad term that should be specified in line with particular research. However, the value added performance indicators seem to be adequate for measuring competitiveness as well as for economic sustainability. The relationship between value added and related indicators and a firm’s competitiveness can be found in various textbooks and research papers, for example Lind [
14], Meredith, J. and Shaffer, S. [
15] or Jones and Tilley [
16]. Specifically, Lind [
14] states that “
The significance of added value lies in the fact that value creation is what makes enterprises competitive”.
On the macroeconomic level, such increased performance of firms, in particular their value added, should subsequently foster the economic growth of the whole country, eventually leading to sustainable economic growth.
In fact, the relationships between R&D expenditure and innovation as well as between innovation and economic growth is a backbone of modern endogenous growth theories like the ones of references [
17,
18,
19]. Moreover, innovation can also trigger spillover effects that may generate new innovation and boost the economy even further [
20,
21,
22].
The importance of R&D and innovation for sustainable economic growth is strongly visible in the EU agenda Europe 2020, where “smart, sustainable and inclusive growth” has become a new strategic goal for the EU. Member states are supposed to reach a share of 3% of R&D expenditure on GDP. The EU claims that supporting R&D should help member states to maintain sustainable economic growth with lower unemployment, higher competitiveness and lower regional disparities [
23]. Besides those economic factors, innovation should lead to improvements in populations’ health, a reduction of emissions or efforts to fight global warming – thus leading eventually to sustainable development.
Also, OECD and other institutions almost constantly recommend supporting R&D to achieve innovation, higher competitiveness and sustainable growth. Great attention is paid mainly to supporting the private sector, which is considered to have a major share of total R&D expenditures in most developed countries [
24].
There are several reasons to support R&D in the private sector. Two of them are probably mentioned most often. The first is that the private sector tends to be pro-cyclical, which means that in a recession, it severely cuts down on R&D expenditure, which in turn deepens the recession [
25]. The second is the convention that supporting private R&D will encourage projects which would not be carried out without support due to the private sector’s tendency to under-invest in R&D. However, as the spillover effects of innovation influence even those who do not invest, the total effect of R&D investment is higher for the whole economy than for the private entity itself [
26,
27]. This assumption justifies supporting private R&D since the final benefit for the whole society is likely to exceed the benefit of the supported subject and the public cost.
As the current political discourse towards R&D support is very strong, questioning and evaluating the effects of this support is becoming very important. Of course, a crucial question arises: what exactly is the outcome or the effect that the support is supposed to deliver? As we can read in Europe 2020 and other R&D-oriented strategies of national governments, the main goal is to increase competitiveness and to achieve sustainable economic growth [
23]. However, it is less obvious how this general goal should be evaluated in terms of specific indicators.
It can be stated that there are several major areas which contemporary R&D evaluation research focuses on. In the first place, many studies deal with the effects of public R&D support on private R&D spending (the so-called leverage effect), usually along with an analysis of the existence and the power of the crowding out effect public support has on private investment. A second area of evaluation research focuses on the effect of R&D subsidies on innovation. They try to discover what impact support has on indicators like registered patents or the introduction of new products and services. The third area focuses on the effects of R&D subsidies on performance indicators. These studies are answering the question about what effect R&D subsidies have on firms’ performance indicators such as value added or ROA.
Nevertheless, to assess the effects of R&D support on sustainable growth, it seems appropriate to choose a combined approach. The expected causation chain: “public support-higher private R&D expenditure-innovation-competitiveness & economic sustainability” can be flawed or broken in any link. Focusing the evaluation solely on one relationship might lead to distorted results. Specifically, if support leads to innovation but innovation does not lead to better performance and growth (for any reason which we discuss later) then the support scheme only seems to be effective when we measure innovation activity, but this is a false effectivity. Such support cannot be truly treated as effective and contributing to higher competitiveness and eventually to sustainable economic growth.
The aim of this paper is to address the effect of public R&D support of private companies on their economic sustainability. We use a combined approach to evaluate what effects public R&D support have on the private sector in the Czech Republic–a country where the microeconomic evaluation of public policies has not received much attention thus far [
28]. First, we analyze if public R&D subsidies to private companies have had an effect on traditional R&D outcomes, which is innovation capacity as measured by patents. Secondly, we focus on the effect of R&D support on companies’ performance as expressed by financial indicators: value added and value added per unit of labor cost. We want to discover if R&D subsidies are an incentive for innovations, and we particularly want to find if it really brings a competitive edge to companies by leading to better performance and, presumably, economic sustainability.
2. Literature Review
As outlined above, there are several main areas of contemporary R&D evaluation. However, these largely empirical studies often produce results that are heterogeneous or even contradictory to expected outcomes. Regarding the effect of public support on private R&D investment and expenditure (the leverage effect), David et al. [
29] have compared nineteen micro-econometric studies and found half of them to be without effect. Bronzini and Iachini [
30] analyzed the effect of R&D subsidies on private R&D investment in Italy and found the subsidies had no significant effect. On the other hand, Brautzsch et al. [
31] have come to the conclusion that R&D support in Germany during the economic crisis of 2008 and 2009 was very successful, inducing a substantial leverage effect and counteracting the GDP decline by 0.5% in 2009. Czarnitzki and Hussinger [
32] confirmed the positive effects of public subsidies on private R&D spending in Germany as well. Dai and Cheng [
33] analyzed the effect of public subsidies on corporate R&D investment in China and found that the leverage effect is limited, having a certain saturation point.
Regarding the effects of R&D subsidies on innovation, the first issue researchers have to deal with is how to measure them. Innovations are generally regarded as the generation, adoption, and implementation of new ideas, internal processes, and products or services [
34,
35]. This is quite a wide definition, however, that cannot be supported with available data. Patents are the most common indicator of innovation used to date since researchers assume that innovations tend to be patented by the inventor [
36]. Although linking patents to innovation seems logical and justified, especially in specific industries like pharmacy (80% of innovation is patented–Arundel and Kabla [
37]), there are doubts if patents are a sufficient measurement of innovation in general. Girliches [
38] and Pakes and Girliches [
39] point out that patents are very heterogeneous and industry-dependent. Not all innovations need to be patented, the economic effect of patents is questionable, and their effect on productivity is also doubtful. They claim that patents should not be taken as substitutes for microeconomic indicators such as a firm’s productivity. In fact, this is also the point we address in our article. Miller [
40] estimated that approximately up to 60% of patents (in relation to industry) are not truly innovative and do not lead to further development or growth. Cohen et al. [
41] point out that small and medium enterprises tend to avoid patent registration completely since the transaction cost of the registration is too high for them in comparison to the effect of innovation. Nevertheless, patents continue to be one of the most commonly used indicators of innovation in practical evaluation, especially because they are supposed to be linked to a firm’s performance [
42]. Also, patents have a great advantage of being available–the national patent databases are usually available and rich, and there is often no better innovation indicator available for a particular country [
43]. The results of studies dealing with the effect of R&D on innovative activity, mainly patents, seem to be quite mixed again. Branstetter and Sakakibara [
44] find that participation in a government-sponsored research consortium increased the patenting activity of Japanese firms. Czarnitzki and Hussinger [
32] found a positive effect of publicly stimulated R&D on patenting activity in Germany, and Bruhn and McKenzie [
45] found a higher probability of domestic patents and publications resulting from the subsidized project in Poland. Jaffe and Le [
46] found positive effects of public R&D subsidies on firms’ patents in New Zealand, while they found no effects on trademarks. Bronzini and Piselli [
47] find that direct support of R&D via grants had a significant impact on the number of patents in Italy. On the other hand, Hall and Maffioli [
48] do not find a statistically significant impact on patents or new product sales in Latin America (although with positive effects on R&D intensity and no crowding out effect). Cappelen et al. [
49] find that the Norwegian R&D support scheme does not appear to contribute to innovations in the form of new products for the market or patenting. Sidorkin and Srholec [
50] found that supported enterprises applied more for local (Czech) patent protection but subsidies did not stimulate internationally recognized patent protection.
Regarding the effects of R&D subsidies on beneficiaries’ performance, the results of contemporary evaluations are heterogeneous again. Sissoko [
51] found that the support program Eureka in France had mixed results. It seems that less productive firms benefited from the program, while firms with initially higher productivity tended to lag behind the control group after support. No significant effect of R&D support on value added in the manufacturing industry is documented in Merito [
52], which deals with the Italian FSRA program. Also, Nam [
53] finds no effect of the South Korean R&D program KTIPS on the sales of supported firms. On the other hand, Bondonio et al. [
54] conducted a comprehensive study of the effects of R&D support in seven EU member states (Germany, France, Italy, Spain, the United Kingdom, Austria, and Hungary) and concluded that the support programs, mainly the national ones, have had positive effects on value added, sales, employment and labor productivity.
The heterogeneity in the results of various studies as demonstrated above can at least be partly explained by the methods researchers use and the indicators they use for evaluation. There is quite a wide array of methods used for R&D evaluation, and most of them suffer from more or less serious drawbacks (see Cerulli [
55] for summary). However, from a strictly scientific perspective, there should be only one truth, and the selection of methods should not affect it. Moreover, most of the studies listed above use very similar counterfactual designs and are in fact not substantially different. What can truly be a source of great difference in the results is the heterogeneity in R&D policies among the states, as Correa et al. [
56] mention. As the R&D policies differ, their impact differs as well. Then we can have some countries with successful R&D policies, which have a great effect on supported subjects, while other countries have ineffective R&D policies. This will be reflected mainly in national studies but will affect cross-country models as well. It should also be stressed that the outcome of this paper is strongly influenced by the R&D support scheme carried out in the Czech Republic.
Obviously, the evaluation of contemporary R&D support at the firm’s level brings very heterogeneous results, regardless of the observed output. Moreover, researchers often limit their studies to specific outcomes like patents, induced R&D expenditure (leverage effect) or performance indicators. However, when dealing with R&D support from the perspective of companies’ economic sustainability, we should address the whole causation chain. In this paper, we are trying to answer the question of whether the assumed causation between R&D support-innovation-competitiveness and economic sustainability really works. We simultaneously assess the effect of R&D support on patents (which serves as a rough proxy for innovation similarly to Bronzini and Piselli [
47] or Hassana and Tuccic [
43]) and on competitiveness as a necessary condition of economic sustainability for any company and consequently for sustainable economic growth. For R&D support to be truly effective in terms of economic sustainability, the beneficiaries should not only produce more patents but also have their competitiveness increased. Although our research is not entirely new, there are only a limited number of studies dealing with the connection between support and innovation and competitiveness. And, to date, no such study has been carried out for the case of the Czech Republic.
3. Data and Method
In our research, we focus on evaluating the effect of public R&D support on private companies’ innovation and economic sustainability. As outlined above, we understand economic sustainability as the ability of a company to stay in business. Intuitively, we assume that only competitive companies are able to stay in business for a long period of time. Therefore, economic sustainability must be tightly related to competitiveness and relevant performance indicators. We use a counterfactual design that is quite typical for such types of evaluations [
57] and was used by most of the studies listed in the literature review. A counterfactual design can help us to reveal the real impact of R&D support on beneficiaries by comparing the situation with support to the situation without support. However, in reality only one outcome after intervention (the actual outcome) is known, and the would-be outcome is unknown, because the subject was either supported or not–both options are not possible at the same time. For the would-be situation, a control group is created. The effect of a particular program or support is the difference between these two groups in outcome variables. However, as participants and non-participants would have different outcomes even without intervention due to observable and unobservable factors [
58], selection bias can occur. A standard method to minimize such bias is to employ propensity score matching (PSM). The basic idea of propensity score matching is to match the supported subjects to similar subjects in a control group, which was not supported. Matched subjects should be as close as possible in all relevant pre-treatment characteristics (so called covariates) that might affect treatment’s expected outcome.
However, the proper application of matching relies on the assumption of conditional independence (CIA), also referred to as unconfoundedness [
59,
60]. This assumption means that, given a set of observable covariates that are not affected by treatment, potential outcomes are independent of treatment assignment [
57]. In practice, the conditional independence assumption means that all variables that influence treatment assignment and potential outcomes simultaneously are known by the researcher [
58]. Such an assumption is quite large, and it strongly relies on the expertise of the researcher. Moreover, there is no way to test if CIA was met. Usually the researcher decides which covariates to employ on the basis of previous theoretical and empirical research [
58]. A substantial bias reduction in post-estimation might also point at the proper selection of covariates. In our evaluation, we use covariates that were used frequently in similar analyses and can have substantial effect on the outcome (see below).
To separate time invariant factors that may affect the outcome, the PSM is combined with difference in difference (DiD). The difference in difference method is widely used in counterfactual analyses and simply calculates the average difference in outcomes separately for participants and non-participants before and after intervention. It then calculates the difference between the average changes in outcomes between both groups. Combining DiD with PSM is suitable (and common) because PSM ensures the similarity of both groups while DiD controls for time invariant factors. As a result, such an approach theoretically yields a fully efficient estimator [
61].
R&D support is mainly being implemented in the Czech Republic directly as direct subsidies and grants. We deal only with this type of support since the next most important tool is tax credits, which only amount to 7% of the total public support of R&D in the Czech Republic and are therefore negligible. In our analysis, we focus on the direct R&D public support of the private sector in the Czech Republic, using a unique data source. By merging four independent databases–a database covering financial data (provided by Bisnode company), ISVAV–the national database of R&D public subsidies, the Patent Office database for the number of patents and the TACR database of unsuccessful applicants, we get a source that is suitable for performing a counterfactual analysis. Combining these four sources of data was necessary since each of them alone lacks necessary information (see below). The initial dataset consisted of 555 supported private companies and 1074 unsuccessful applicants. Support was given to private companies between the years 2007-2010 (period of support). 2004–2006 was selected as a period before support and 2011–2012 as a period after support. Unfortunately, data from earlier and later years could not be obtained from these databases.
Our final data source consists of 747 private companies, of which 258 were supported and 489 were unsuccessful applicants for R&D support. We focus on two fields of interest–sustainable growth and innovation activity. Value added (in logarithms) and value added per labor cost were selected as outcome indicators of companies’ economic sustainability and sustainable economic growth. We believe these indicators are able to describe how the performance of a company changes over time, including its productivity (value added per labor cost is one of the common productivity indicators–see reference [
62]) and are in line with the company’s definition of competitiveness and consequently of economic sustainability and growth as outlined above.
For innovation activity, we use a standard indicator–registered patents. We opt for a 0–1 dummy, where 0 stands for no patent activity at all and 1 for at least 1 patent registered during the period. For indicators of competitiveness, we use average values for the periods before (2004–2006) and after support (2011–2012). For patents, we use the total number of patents before and after support, wherein the time span was intentionally widened to 2000–2006 as the period preceding support and 2007–2014 as the period following support. Adopting such a wider time span was suitable for two reasons. Firstly, patents should generally be evaluated over a longer time span since their development and registration takes time; moreover, the patent data were accessible in such a wider span. Secondly–we included the period of support itself because there were various R&D programs and activities that required patents as one of the outcomes of program participation. Therefore, it is quite likely that beneficiaries registered their patents even during the period of support.
Table 1 shows the basic statistics of these outcome variables divided into two groups according to the 0–1 dummy variable
treat. For supported
treat = 1 and not supported
treat = 0.
Obviously, treated firms had higher innovation activity (more patents) before and after support, even in relative terms (the growth rate of patents was higher too). Regarding the indicators of competitiveness however, the situation seems to be unsettled. While the value added grew more in companies that did not receive support, the value added per labor cost increased more in supported ones.
However, taking the whole group of applicants can yield a selection bias due to unobserved characteristics that affect the outcome, as explained above. Therefore, we apply the Propensity Score Matching method to avoid selection bias and to have both groups as similar as possible. For PSM it is crucial to select proper covariates–indicators that can influence output but are not influenced by program participation. Besides the value added, registered patents and value added per labor cost before support, which enable the matching of similar subjects in terms of outcomes before support, we have chosen the following covariates (all reflect the situation before support as well):
Company’s size. Size covariate is a dummy variable having instances for micro level firms with less than 10 employees, small firms with 10–49 employees, medium size companies with 50–250 employees and large companies with more than 250 employees. Controlling for the subject size is inevitable as the size may affect the outcome but also the probability of getting the support substantially. It is present in all similar analyses.
Age and age square. Age of firms is measured in months until 1 January 2007. Again, age can affect the outcome as well as the probability of being supported. Older companies might be more experienced with having a larger market share or have more experience with applying for support. Age is again a standard variable included in analyses of this type.
Assets in logarithm before support. This variable is complementary to size, reflecting the financial size of the company. It controls for the rare cases when a rather small company has abundant resources, and it helps to match companies with similar financial size.
Affiliation of the company to hi-tech industry or hi-tech services. Most of the companies from both groups–control and treated alike–belong to NACE category C, J or M (more than 80%). However, these categories are quite wide (especially C), and the R&D focus of the firms may be extremely different even inside those industrial groups. We decided to assess the R&D orientation of the company by introducing two dummy variables that show if the particular firm belongs to either the hi-tech manufacturing industry or hi-tech services, often referred to as knowledge-intensive services, or none of them. Such a classification was made using the Eurostat NACE classification of hi-tech industries and knowledge-based services on NACE Rev 2, 2 digit level.
Table 2 and
Table 3 summarize the covariate’s descriptive statistics.
Obviously, supported companies tend to be more hi-tech oriented, larger and with higher asset endowments than unsupported ones. Regarding outcome variables before support–it seems that, even before support, the beneficiaries were more innovative (more patents) but less efficient (lower value added per personnel cost).
4. Results
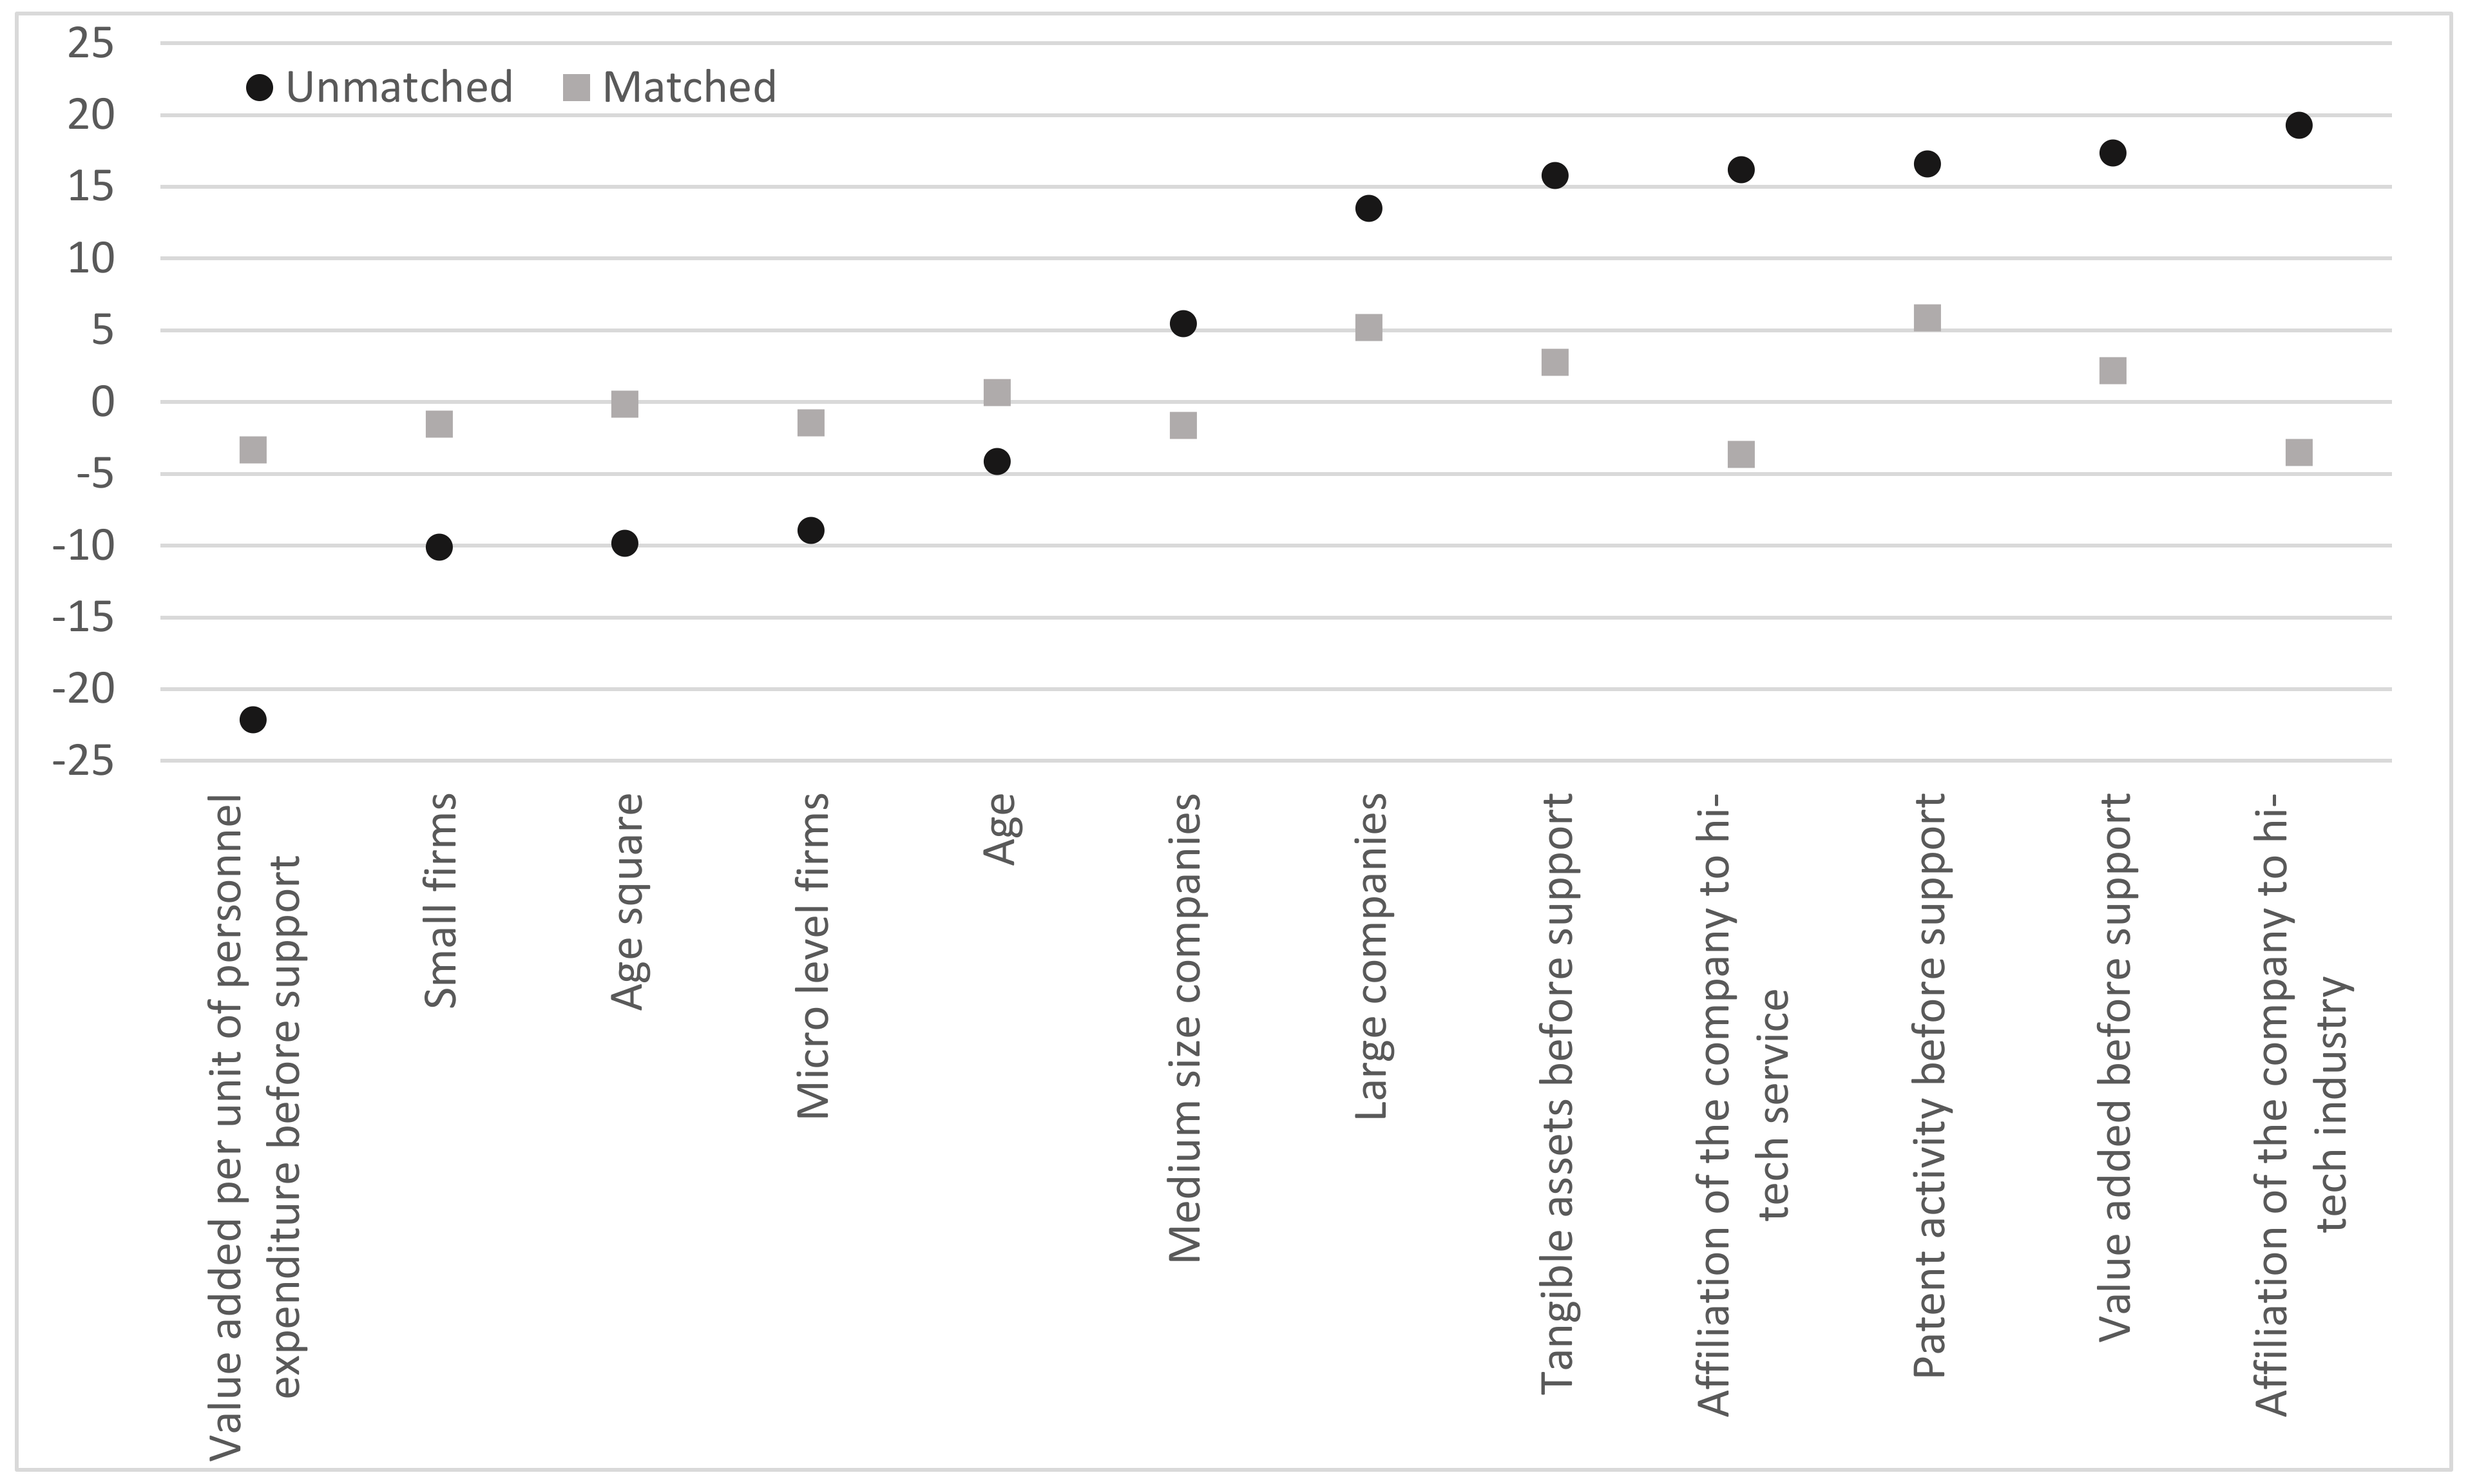
The first step of our analysis has to be the selection of a control group according to a similarity in covariates as stated above. We employ the Propensity Score Matching technique utilizing logistic regression. Besides the logistic regression itself, we have to define a region of common support, which is the area where control and treated groups overlap in their scores. Also, balancing tests have to be conducted to check for equal distributions within quantiles regarding propensity scores and covariates–this issue will be addressed later.
Table 4 shows the logistic regression results.
We can see that companies from hi-tech industries or services and with higher patent activity were more likely to receive R&D support. Quite interestingly, the probability of receiving support also rises with a decline in efficiency in terms of value added per unit of labor cost.
After the estimation of propensity scores (ps), we estimate the ATET–average treatment effect on treated companies. This is the effect which R&D support had on supported companies in comparison to unsupported ones in the control group. For the matching of propensity scores, several techniques can be chosen–nearest neighbor (NN), caliper, radius or Kernel matching. We use the standard NN matching here and add Kernel matching (KM) with bootstrap (300 replications) to see if the results are suitably independent on matching technique.
Table 5 exhibits the results.
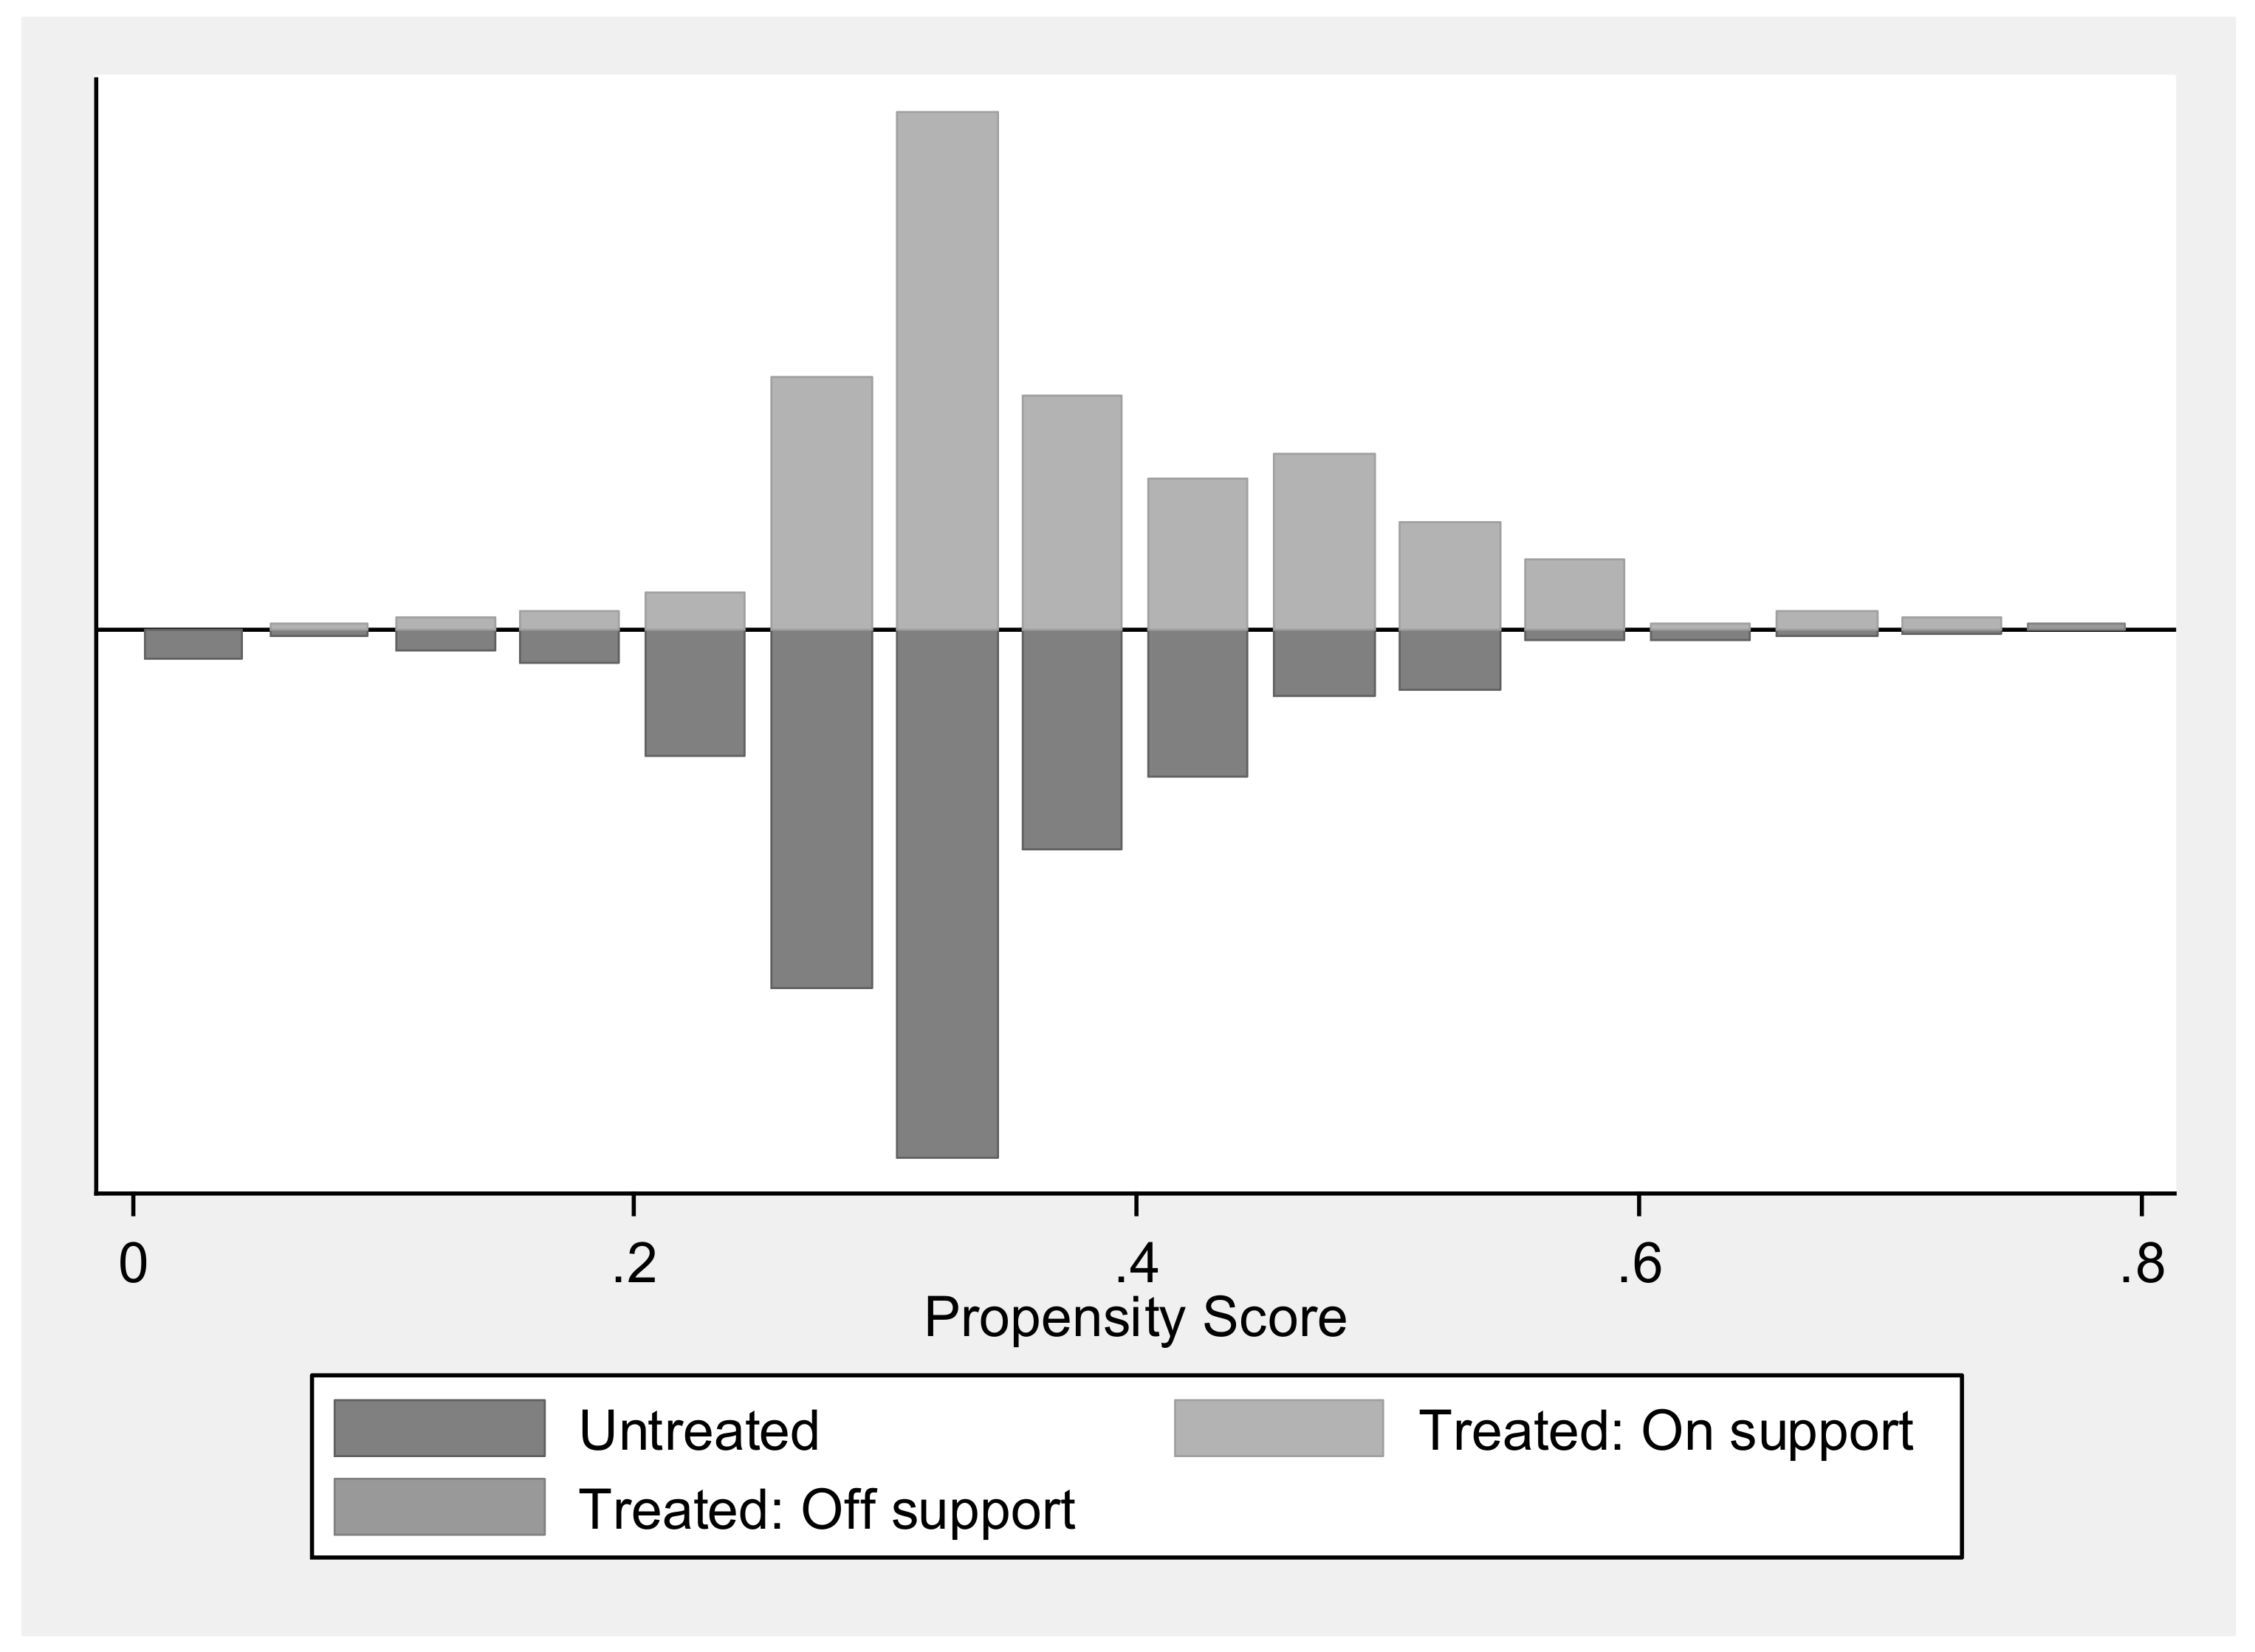
It is quite clear that the effect of R&D support on competitiveness–value added and value added per labor cost, is quite inconclusive. R&D support simply does not have a statically significant effect on these variables in the short run, regardless of the method we use. Regarding innovation activity, however, we see a positive and statistically significant impact of program participation–supported firms are more likely to develop patents than unsupported ones, and the estimated effect is 12% more patents registered by supported firms. Obviously, our results are very similar regarding the matching technique used. The selection of the control group was properly done as shown in
Appendix A. The region of common support is well defined (
Figure A2 in
Appendix A)–propensity scores of participants and non-participants are overlapping. We also see that bias was greatly reduced and both groups are balanced in means and variance (
Table A1 and
Figure A1 in
Appendix A).
For Czech R&D support, we may say that it motivates companies to develop and register more patents, but this patent inflow is not reflected in value added or productivity in the short run. We may formulate several considerations of why the Czech R&D policy yields such outcome. First: we deal with short run effects and patents could have effects in a longer term. We may not deny such an argument yet. Second: the policy is primarily based on direct subsidies, which might attract companies with problems rather than successful companies. Third: patents are usually monitoring indicators in support programs, so supported companies produce patents at whatever cost–meaning these patents are not used or sold further. Fourth: the idea that patents represent innovations and higher competitiveness is flawed itself, as Kleinknecht et al. [
63] and Pessoa [
64] pointed out. Regardless of those possible reasons, Czech R&D policy as oriented toward the private sector should be questioned, at least regarding its purpose. If it is meant to lead to higher competitiveness, better performance and eventually sustainable economic growth, than the current policy is probably failing, at least in the short term.
5. Conclusions
The aim of this paper was to analyze the effects of public R&D support of private companies in the Czech Republic from the perspective of economic sustainability. Supporting private R&D is common practice in developed economies today. Backed mainly by endogenous growth theory, R&D is viewed as one of the main engines of economic growth. As such, it is appealing for policy makers to support it. The idea behind it is quite straightforward–more R&D means more innovations, which leads to higher competitiveness and sustainable growth–on the micro and macro level alike. However, the existing research does not bring such straight and conclusive evidence. On the contrary, the outcomes are very heterogeneous. Moreover, a vast majority of contemporary research on public R&D support and its impact on the economy is limited to assessing the leverage effect or patent activity and often leaves the effect on performance indicators behind. Nevertheless, performance indicators reflect the competitiveness of companies and their economic sustainability in the first place–what else other than value added, sales or productivity should represent the ability of a company to succeed and reach sustainable economic growth?
In our article, we have tried to analyze the R&D policy in the Czech Republic conducted in the period 2007–2010. We used a counterfactual approach utilizing PSM (Propensity Score Matching) in combination with the difference in difference method to address two issues–competitiveness (and implicitly economic sustainability) and innovation activity.
Regarding the propensity to R&D support, we conclude that hi-tech industries and services with higher patent activity before support in particular have had a higher probability to be supported. This finding is not very surprising - it is quite in line with common sense and the typical R&D policy orientation. Interestingly, besides these covariates, it also seems that enterprises with lower efficiency in terms of value added per labor cost tend to be supported in the case of Czech Republic. This may be partially caused by a higher share of private research institutes in the treated sample. Such a possible bias between the control and treated group was of course reduced by consequent matching.
Regarding innovation activity, we discover that the R&D policy was successful–supported companies are more likely to register patents than unsupported ones (there is a 12% positive difference). However, when we analyze valued added and value added per labor cost as indicators of competitiveness, we cannot find any significant relation. This may just be because innovations need a longer time period to bring a competitive advantage. However, other, less optimistic scenarios are possible as well–supported enterprises produce patents that are registered but not used further, for example.
We may conclude that the often-assumed causation chain: R&D support-innovation-competitiveness & economic sustainability is possibly flawed in the case of the Czech Republic and its R&D policy. Although there is a positive effect on innovation activity (patents), there is no significant effect on competitiveness indicators. Therefore, we may conclude that the effect of public R&D support of private companies is probably ineffective from the point of view of economic sustainability. However, this conclusion must be interpreted in accordance to certain limitations of the study. First, some simplifications were necessary. We deal with the economic sustainability that is supposed to be closely related to competitiveness and is just a sub-group of sustainability. We have narrowed the rather wide idea of competitiveness to two indicators that are often used but cannot describe competitiveness fully. We have used patents as a proxy for innovation activity–again, a widely used simplification that does not perfectly cover the innovation process. These simplifications have been made especially because of the data availability of selected indicators. Second, we focus only on the short-term effects after the support was carried out, while patents or innovations can manifest over a longer time period. Third, we analyze only the case of the Czech Republic and therefore our conclusions are locally-limited. Fourth, the sample had to be reduced due to data availability. Although the sample is still representative and results are externally and internally valid, some information might have been lost. As Dvoulety and Blazkova [
65] propose, it would be good for the future to ensure that any program’s applicants have a duty to report and provide data necessary for future evaluation purposes.
Nevertheless, our conclusion should at least trigger debate among R&D policy makers and implementers in the Czech Republic. Such a debate is crucial for a complex Czech R&D policy evaluation in the future. Our research reveals that indicators that are now common in R&D policy evaluation, like newly registered patents (but presumably other commonly used indicators like induced R&D expenditure as well) are not reflecting the true purpose of R&D support, which is to enhance competitiveness and sustainable economic growth. It seems to be necessary to also analyze other, especially financial, indicators related to competitiveness. Evaluating the impact of R&D support on indicators like value added, labor productivity or ROA seems to be vital for proper R&D policy evaluation in the future. Upcoming research might also be extended to deal with other R&D policy outputs like total factor productivity (similarly to Nillson [
66]) or to take the spatial specifics into account (Kveton and Horák [
67]). Moreover, it would also be worthwhile to make a similar analysis with a longer time horizon in upcoming years. For now, within the limitations outlined above, we may conclude that the Czech R&D policy promotes higher innovation activity but it is not reflected in short run competitiveness indicators. Therefore, we cannot claim it helps companies to reach economic sustainability and sustainable economic growth.


