1. Introduction
Under pressing international competition and environmental constraints on resource shortages, the development of emerging industries has become a typical strategy for major countries in the world to achieve new heights of economic and technological development [
1,
2,
3].
At present, China is encountering a critical period of comprehensively deepening reforms, optimizing industrial structure, and accelerating the transformation of economic development methods. In order to change the mode of economic development and respond to economic and environmental crises, a significant recent industrial specialization policy is proposed [
4,
5,
6] to develop strategic emerging industries (SEIs), which represent the future direction of industrial development and provide strong guidance for future economic and social development [
7,
8,
9].
A collaborative innovation network is an important organizational form for promoting the sustained, healthy, and stable development of SEIs. It is also promising to become a booster for promoting the sustainable development of national innovation systems [
10,
11,
12]. A collaborative innovation network of SEIs aims to establish a benign cooperation mechanism, explore the optimal evolution path, and then achieve a healthy and orderly evolution. With the development of China’s SEIs in recent years, an increasing number of scholars have focused on the research of collaborative innovation network of SEIs [
13]. The development of SEIs does not only depend on technological innovation but also has its own special model [
14,
15]. However, at present, collaborative innovation network members, such as enterprises, universities, and research institutes in China’s SEIs clusters have few innovation interactions with each other. Innovative resources are decentralized and lack effective integrations, and fewer occurrences of interactive learning and collaborative innovation are within the clusters [
16]. Therefore, how to effectively stimulate the collaborative innovation of SEIs is an important issue for the Chinese government at this stage.
The evolutionary game theory focuses on the interaction among different players or groups. It is also well employed as the evaluation criterion in making decisions to find the frequencies of strategies adopted in the population during evolutionary game process [
17,
18,
19]. It is used in many research areas such as business and economics [
20,
21,
22]. Furthermore, there have been researches using game theory to study industry dynamics, collaborative innovation, and innovation network. Ji et al. applied evolutionary game theory approach to study green purchasing relationships for the manufacturing industry and observe the cooperation tendency of multi-stakeholders [
23]. Liu et al. built an evolutionary game model to investigate the relationship between auto manufacturers and governments to explore the dynamic tendency of China’s electric vehicle industry [
24]. Liu et al. presented an evolutionary game model on patent cooperation network to analyze the relationship between industries and university and research institutes [
25]. Wu et al. used game-based learning theory to build an evolutionary model of low-carbon strategies based on the game between the government and enterprises [
26]. Ozkan-Canbolata et al. applied evolutionary game theory to develop the generation and evolution of strategic innovation [
27].
Some scholars have pointed out that government subsidies are the major sources of large-scale investment in SEIs in the future and have a positive impact on R&D investment [
28,
29,
30,
31,
32]. Government is not only the promoter for collaborative innovation network development of SEIs, but also a participant in collaborative innovation network and plays a crucial role in driving the development of SEIs. The government could promote collaborative innovation network development for SEIs by formulating incentives and punishments based on actual conditions. Therefore, adding the government as a stakeholder to the game system of collaborative innovation network is a key approach. Moreover, it is of great significance to analyze how the government could effectively promote the cooperation innovation among collaborative innovative network members such as enterprises, universities, and research institutes.
Nowadays, an increasingly number of promising methodologies has been used to investigate SEIs. The Logistic regression early-warning model is constructed to analyze the impact of industrial activities on the ecological environment for SEIs [
6]. An analysis of variance (ANOVA) model and
t-tests were employed to examine the technological specialization of strategic emerging industries in 31 provinces in Mainland China [
8]. Miao et al. used the parametric stochastic frontier analysis method and the logarithmic CobbDouglas production function to analyze the driving effect of technological innovation in strategic emerging industries on energy utilization efficiency [
9]. However, very few studies have considered the three-population evolutionary game model in investigating the collaborative innovation network in SEIs. In this paper, we attempt to utilize the mathematical game theory model to address the following research questions for SEIs: (1) How can government affect cooperation of collaborative innovative network by using incentives and punishments as financial instruments? (2) Under government’s interventions, what are the evolutionary responses from collaborative innovative network members and which strategy should be used? (3) How do different government scenarios and policies influence the activities and cooperation of collaborative innovative network members? (4) What is the optimal solution and strategy in each scenario?
The remainder of the paper is organized as follows.
Section 2 provides assumptions and model framework, followed by
Section 3 in which the game model is constructed.
Section 4 presents the simulation experiments and result discussions. Finally, concluding remarks and some suggestions are provided in
Section 5.
2. Foundation of Model
As the government does not directly participate in the cooperation between enterprises, universities, and research institutions in the collaborative innovation network of SEIs, it uses macro-policies to promote the cooperation of various entities. However, with the development of a collaborative innovation network, the government will formulate and adjust policies according to the actual conditions. Therefore, in order to investigate how the government can guide the development of collaborative innovation network for SEIs, this paper constructs an autonomous game system.
In this game system, the government plays a role in leading the development of SEIs, provides certain financial subsidies to enterprises, universities and research institutions in collaborative innovation network of SEIs according to recent development orientation and the stage of SEIs’ life cycle [
33]. Meanwhile, the effects of government’s funding policies on cooperation innovation are often not obvious because of information asymmetry [
34]]. Therefore, punishment policies could be added to government’s financial intervention strategy in order to address the issue of cooperation vulnerability caused by free-riding behavior [
35,
36].
2.1. Assumptions
The core members of collaborative innovation network in SEIs mainly include enterprises, universities and research institutes, etc. Due to certain similar characteristics of universities and research institutes, they are classified into one category, namely URIs population. The proposed approach is based on the following assumptions:
Assumption 1. Assume the government as a stakeholder to the game system of collaborative innovation network in SEIs.
Assumption 2. Government population, enterprises population and URIs population are all rational. Each of them cannot accurately obtain the other population’s strategic choices. Only by learning to constantly adjust and optimize their own strategic choices can they find the optimal strategy.
Assumption 3. When one of enterprises population and URIs population positively cooperates and the other one cooperates negatively, the one who cooperates negatively can obtain additional income from the free riding. The one who positively cooperates needs to increase innovation input in order to maintain the collaborative innovation between enterprises and URIs.
2.2. Model Framework
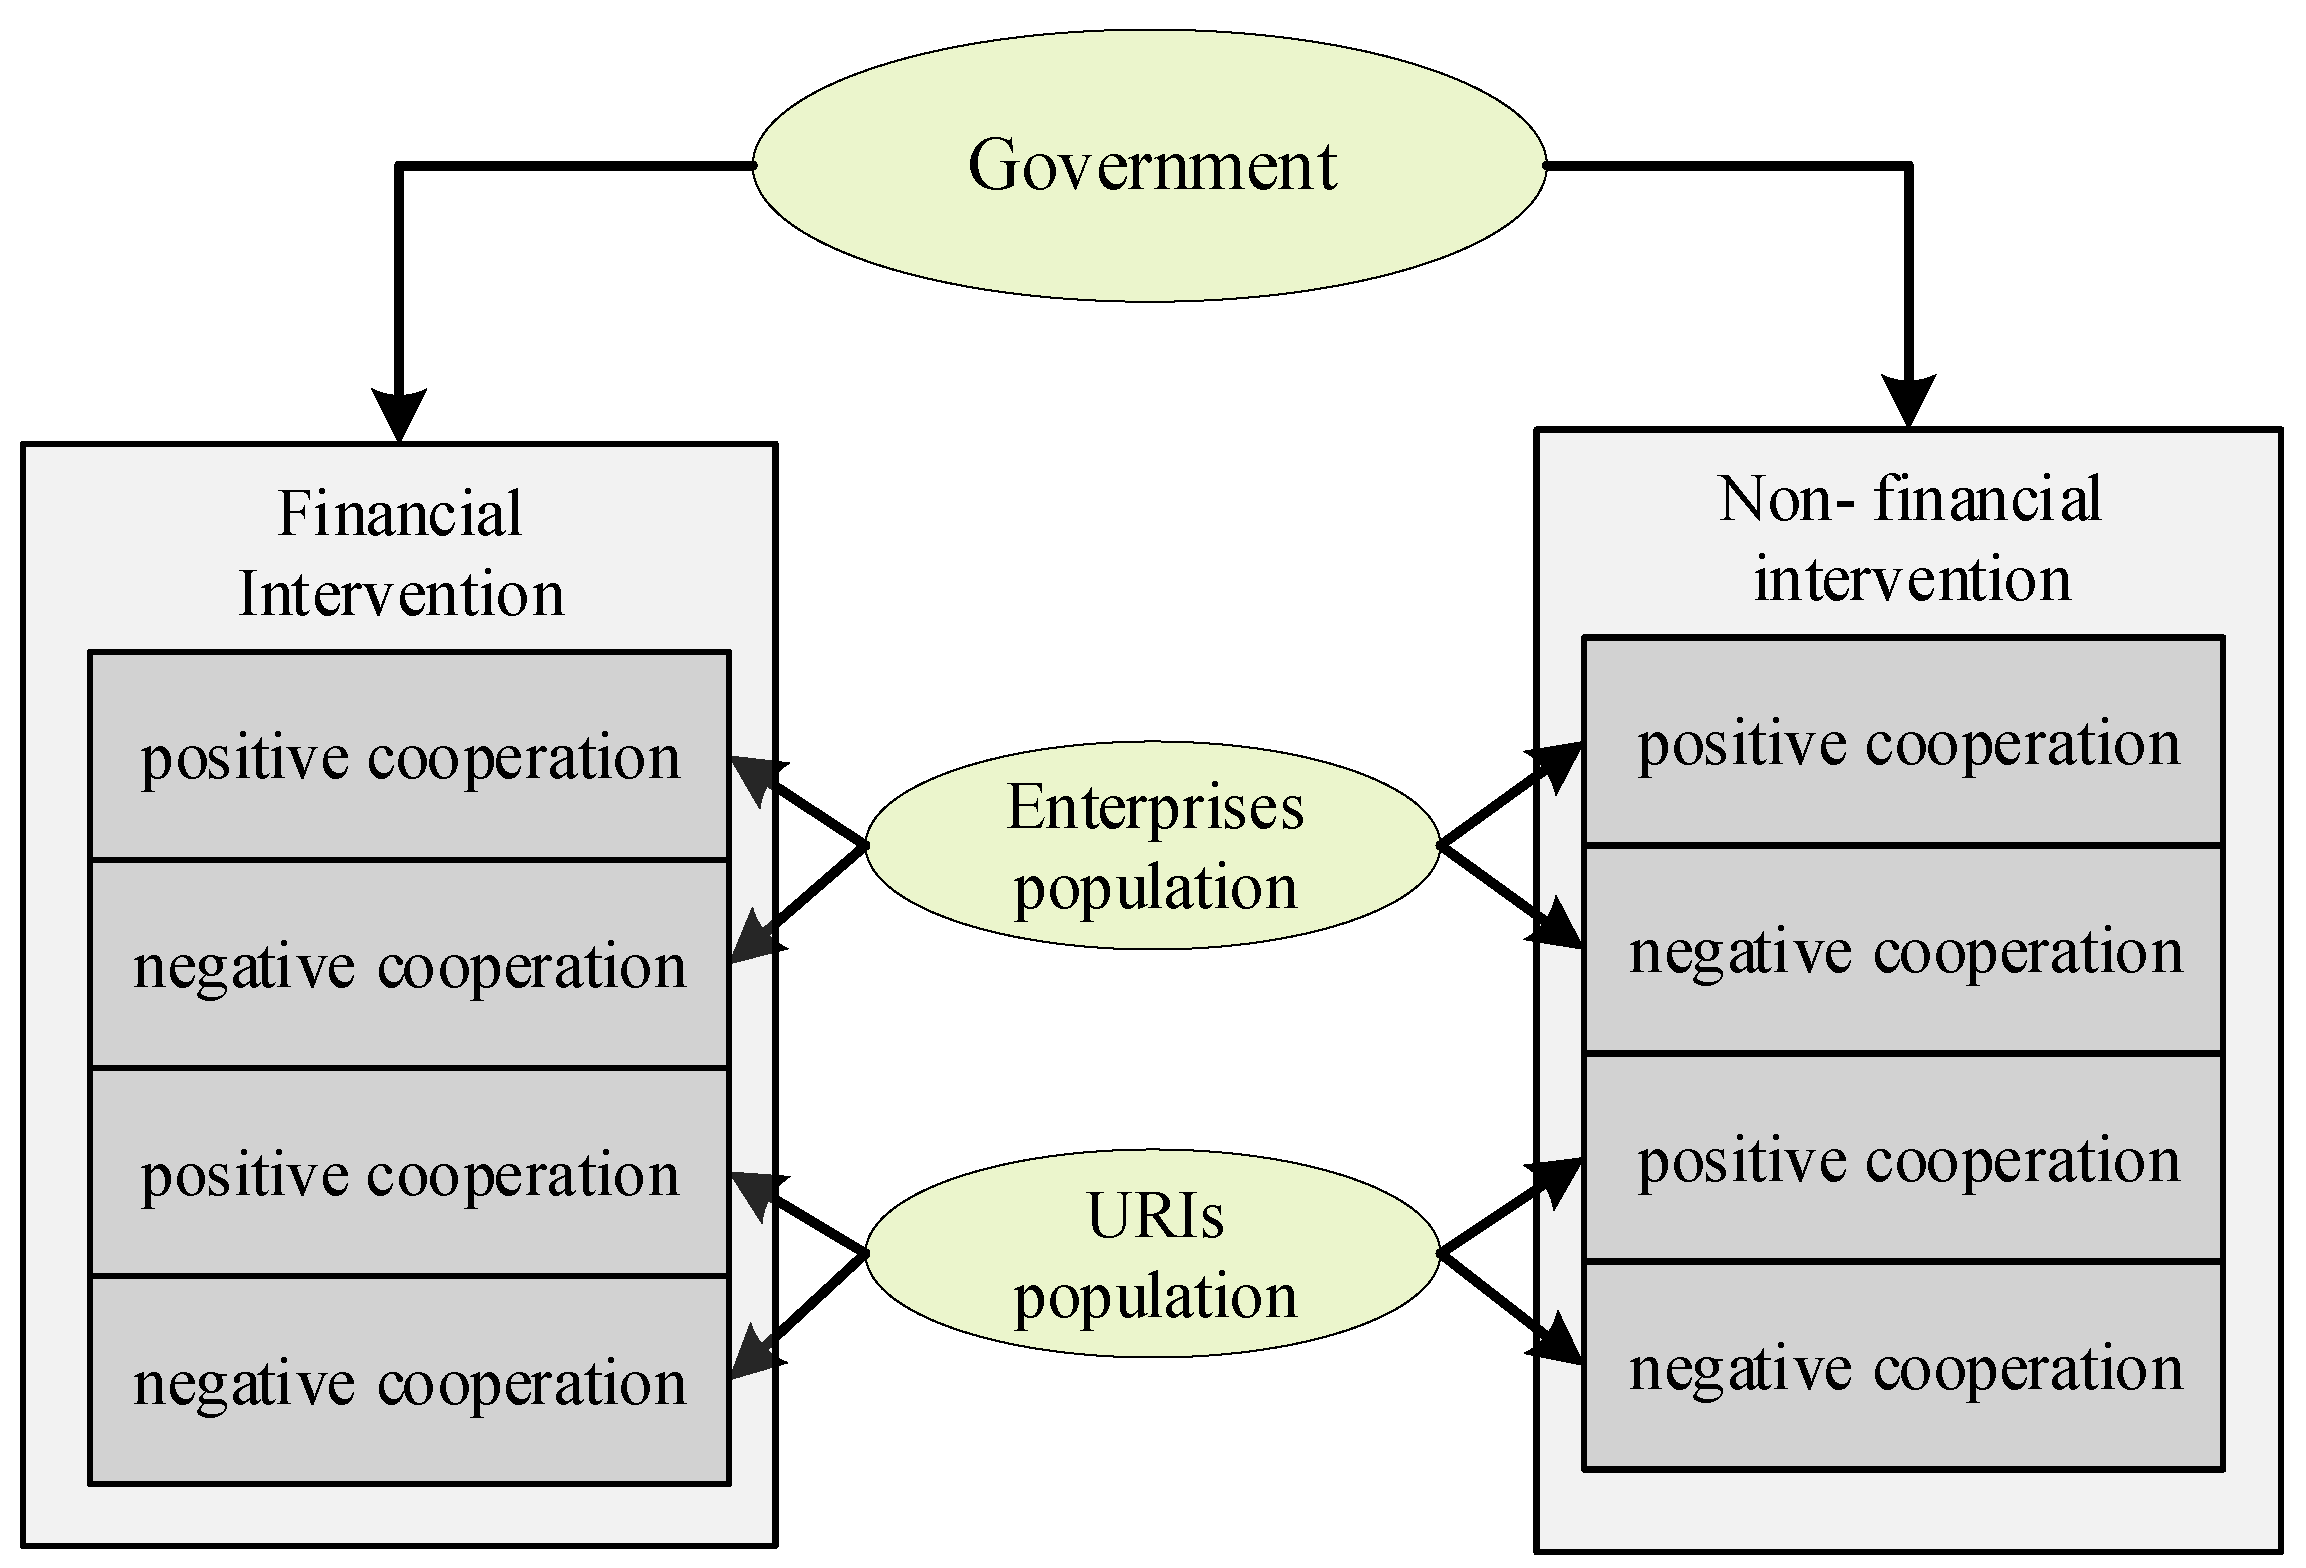
There are three game populations in this game system: enterprises population, URIs population and government population, as shown in
Figure 1. Two strategies are defined for the government population. The first one is a strategy where the government provides financial intervention and in the second strategy the government offers no intervention. The strategy set of government population is {financial intervention, non-financial intervention}. Government’s financial intervention involves incentives for every cooperator and punishments for negative cooperation, incentives mainly include financial support, preferential policies, etc., while punishments mainly refer to financial penalties. Government’s non-intervention means that the government does not take administrative measures to intervene, allowing enterprises and URIs to develop freely. The government will benefit from cooperative innovation between enterprises and URIs, including taxes and so on. In addition, the implementation of government’s incentive policies will attract more enterprises and URIs to join in collaborative innovation network of SEIs and gain more benefits (
) from these new members.
Moreover, two different strategies have been considered for enterprises and URIs, namely positive cooperation and negative cooperation respectively. The strategy set of enterprises population is {positive cooperation, negative cooperation}, and the strategy set of URIs population is also {positive cooperation, negative cooperation}. Enterprises’ positive cooperation means that enterprises provide sufficient personnel, material resources and financial support to URIs. Enterprises’ negative cooperation means that enterprises do not provide sufficient innovation resources and support to URIs, and only maintains the lowest level of cooperative innovation. URIs’ positive cooperation includes providing enterprises with sufficient capital, technical knowledge and other R&D elements. URIs’ negative cooperation means that they only maintain the lowest level of cooperative innovation. We use a three-population evolutionary game model to analyze the game between local governments population, enterprises population and URIs population.
3. Model Construction
3.1. List of Symbols
In order to clearly understand the meaning of each variable, symbols and notations used through the paper are shown below (
Table 1):
3.2. Payoff Matrix
Based on the above assumptions, list of symbols and foundation of model, we construct the evolutionary game payoff matrix of cooperation relationship between enterprises and URIs in collaborative innovation network of SEIs under government financial intervention, as shown in
Table 2.
In the matrix above, we describe the enterprises’, URIs’ and government’s revenue under different strategies. All of game strategies are listed in the left two columns in
Table 2. Correspondingly, in the right three columns, the revenue of enterprises, URIs, and government are represented separately.
In order to simulate as much as possible in regard to how the government’s financial intervention can better promote the development of SEIs, we have considered the long-term benefits and costs, free-riding benefits [
37] and costs, government revenue and costs and other factors.
(1) When both parties are actively collaborating, the total revenue of the enterprise/URIs includes positive cooperation benefits (/), positive cooperation costs (/), long-term positive cooperation benefits (/), long-term positive cooperation costs (/), and incentives (/) and punishments (/).
(2) When one of partners cooperates negatively and the other cooperates positively, the negative cooperator will free-ride. The total revenue for each partner at this time includes the minimum cooperation benefits (/), the minimum cooperation costs (/), incentives, punishments (/) and the benefits of free riding.
Although the positive partner has the willingness to cooperate actively, due to the negative cooperation of the other party, the synergy effects does not occur. At the same time, the positive partner will pay additional innovation inputs () for collaborative innovation between the two partners because of the negative one’s free riding. In addition, the negative one can get extra income () through free riding. Specifically, the cooperation costs that enterprises/ URIs pay for free riding is respectively /, while the extra benefits from free riding is .
(3) The total government revenue includes the cost of government’s financial intervention (), government’s revenue increment from new enterprises and URIs attracted to join the collaborative innovation network by government’s incentives (), incentives, punishments, and government’s revenue increments when enterprises and URIs adopt different cooperation strategy (, , D12).
3.3. Stability Analysis
We set
x as the frequency of individual in enterprises adopting the positive cooperation strategy. Similarly, the symbol
y is set as the frequency of individual in URIS adopting the positive cooperation strategy. In addition, the frequency of individuals in governments adopting financial intervention strategy is
z. Correspondingly, the frequency of individuals in enterprises that adopt the negative cooperation strategy is 1 −
x while the frequency of individuals in URIs that adopt negative cooperation strategy is 1 −
y, and the frequency of individuals in governments adopting non-financial intervention strategy is 1 −
z. Based on the evolutionary game theory, replicator dynamics is used to indicated the learning and evolution mechanism of individuals in cooperation innovation [
38].
Set the expected profit of enterprises’ positive cooperation as , the expected profit of enterprises’ negative cooperation as , the average expected profit of enterprises as , the expected profit of URIs’ positive cooperation as , the expected profit of URIs’ negative cooperation as , the average expected profit of URIs as , the expected profit of government’s financial intervention as , the expected profit of government’s non- intervention as , the average expected profit of government as .
,
and
can be obtained as follows:
where
According to the dynamic formulas of evolutionary game, the dynamic replication system of government, enterprises and URIs can be obtained as follows:
It could be seen that the above replication dynamic system is a set of nonlinear systems and the first derivative is continuous. According to modern control theory, this system can determine the stability of the equilibrium point based on Lyapunov stability first theorem [
39]. The system’s coefficient matrix is solved by using Taylor’s formula. After Taylor’s formula is expanded, the system omits high-order terms and obtains the Jacobian matrix as follows:
where
We can obtain eight unconditional equilibrium points of the evolutionary game system for cooperation relationship in collaborative innovation network under government’s financial intervention, they are (0,0,0), (1,0,0), (0,1,0), (0,0,1), (1,0,1), (1,1,0), (0,1,1), (1,1,1). When
∈ (0,1) and Formulas (23)–(25) are satisfied, (
) is also the equilibrium point.
When (x, y, z) = (0, 0, 0), , matrix eigenvalue , , . If , (i = 1, 2, 3). Therefore, equilibrium point (0, 0, 0) is asymptotically stable. If , , , while , this point is unstable.
If
, then
. Lyapunov stability first theorem cannot determine whether this point is an asymptotically stable point. According to Formulas (10)–(12) and Lyapunov’s definitions of stable and asymptotically stable equilibrium point, the equilibrium point (0,0,0) is Lyapunov stable but not Lyapunov asymptotically stable. Further, by the definition of Lyapunov stable, it can be proved that if
, the points which exist on the straight line from the equilibrium point (0,0,0) to point (0,0,
) are Lyapunov stable but not asymptotically stable. Since discussing this critical state has little practical significance for the practical issues studied in this paper, in fact, it could avoid these scenarios (e.g.,
) by changing the value of the actual variable (e.g., decreasing the value of
). In the following, we do not discuss similar critical states. Similarly, the stability of other equilibrium points is as shown in
Table 3.
According to
Table 3, (0,0,0), (0,0,1), (1,1,0), (1,0,1), (0,1,1), (1,1,1) may be locally asymptotically stable points, while (1,0,0), (0,1,0) are unstable points under any conditions. For governments, enterprises and URIs, apart from one of enterprises and URIs adopts negative cooperation strategy and the other one adopts positive cooperation strategy under the government’s non-intervention, the rest situations may be final stabilization strategy of the game system.
4. Simulations and Discussions
Numerical studies are adopted in MATLAB software to investigate cooperation strategies’ changes of government, enterprises and URIs in SEIs’ collaborative innovation network in the case of changing initial variables of the system and to verify and analyze the stability of the equilibrium point.
From
Table 3, it can be found that the determination of locally asymptotically stable points of the game system is constrained by 10 constraints. The positive and negative of each constraint will affect the stability of the system. From the view of government intervention, this paper discusses the influence of stabilization strategy decision conditions
and
on system stability.
To sum up, this article divides the system’s asymptotically stable points into three scenarios, a total of 16 situations. To approximately simulate the evolution path of the system under full probability, x, y and z are respectively assigned every 0.111 from 0.0005 to 1, t is assigned from 0 to 50, so that it firstly can reduce the influence of the deviation of the MATLAB2016B software on the simulation results by using Runge-Kutta methods (variable-step) to solve nonlinear differential equations, and secondly can be more comprehensively and clearly to observe the overall evolution of the game system under different initial states.
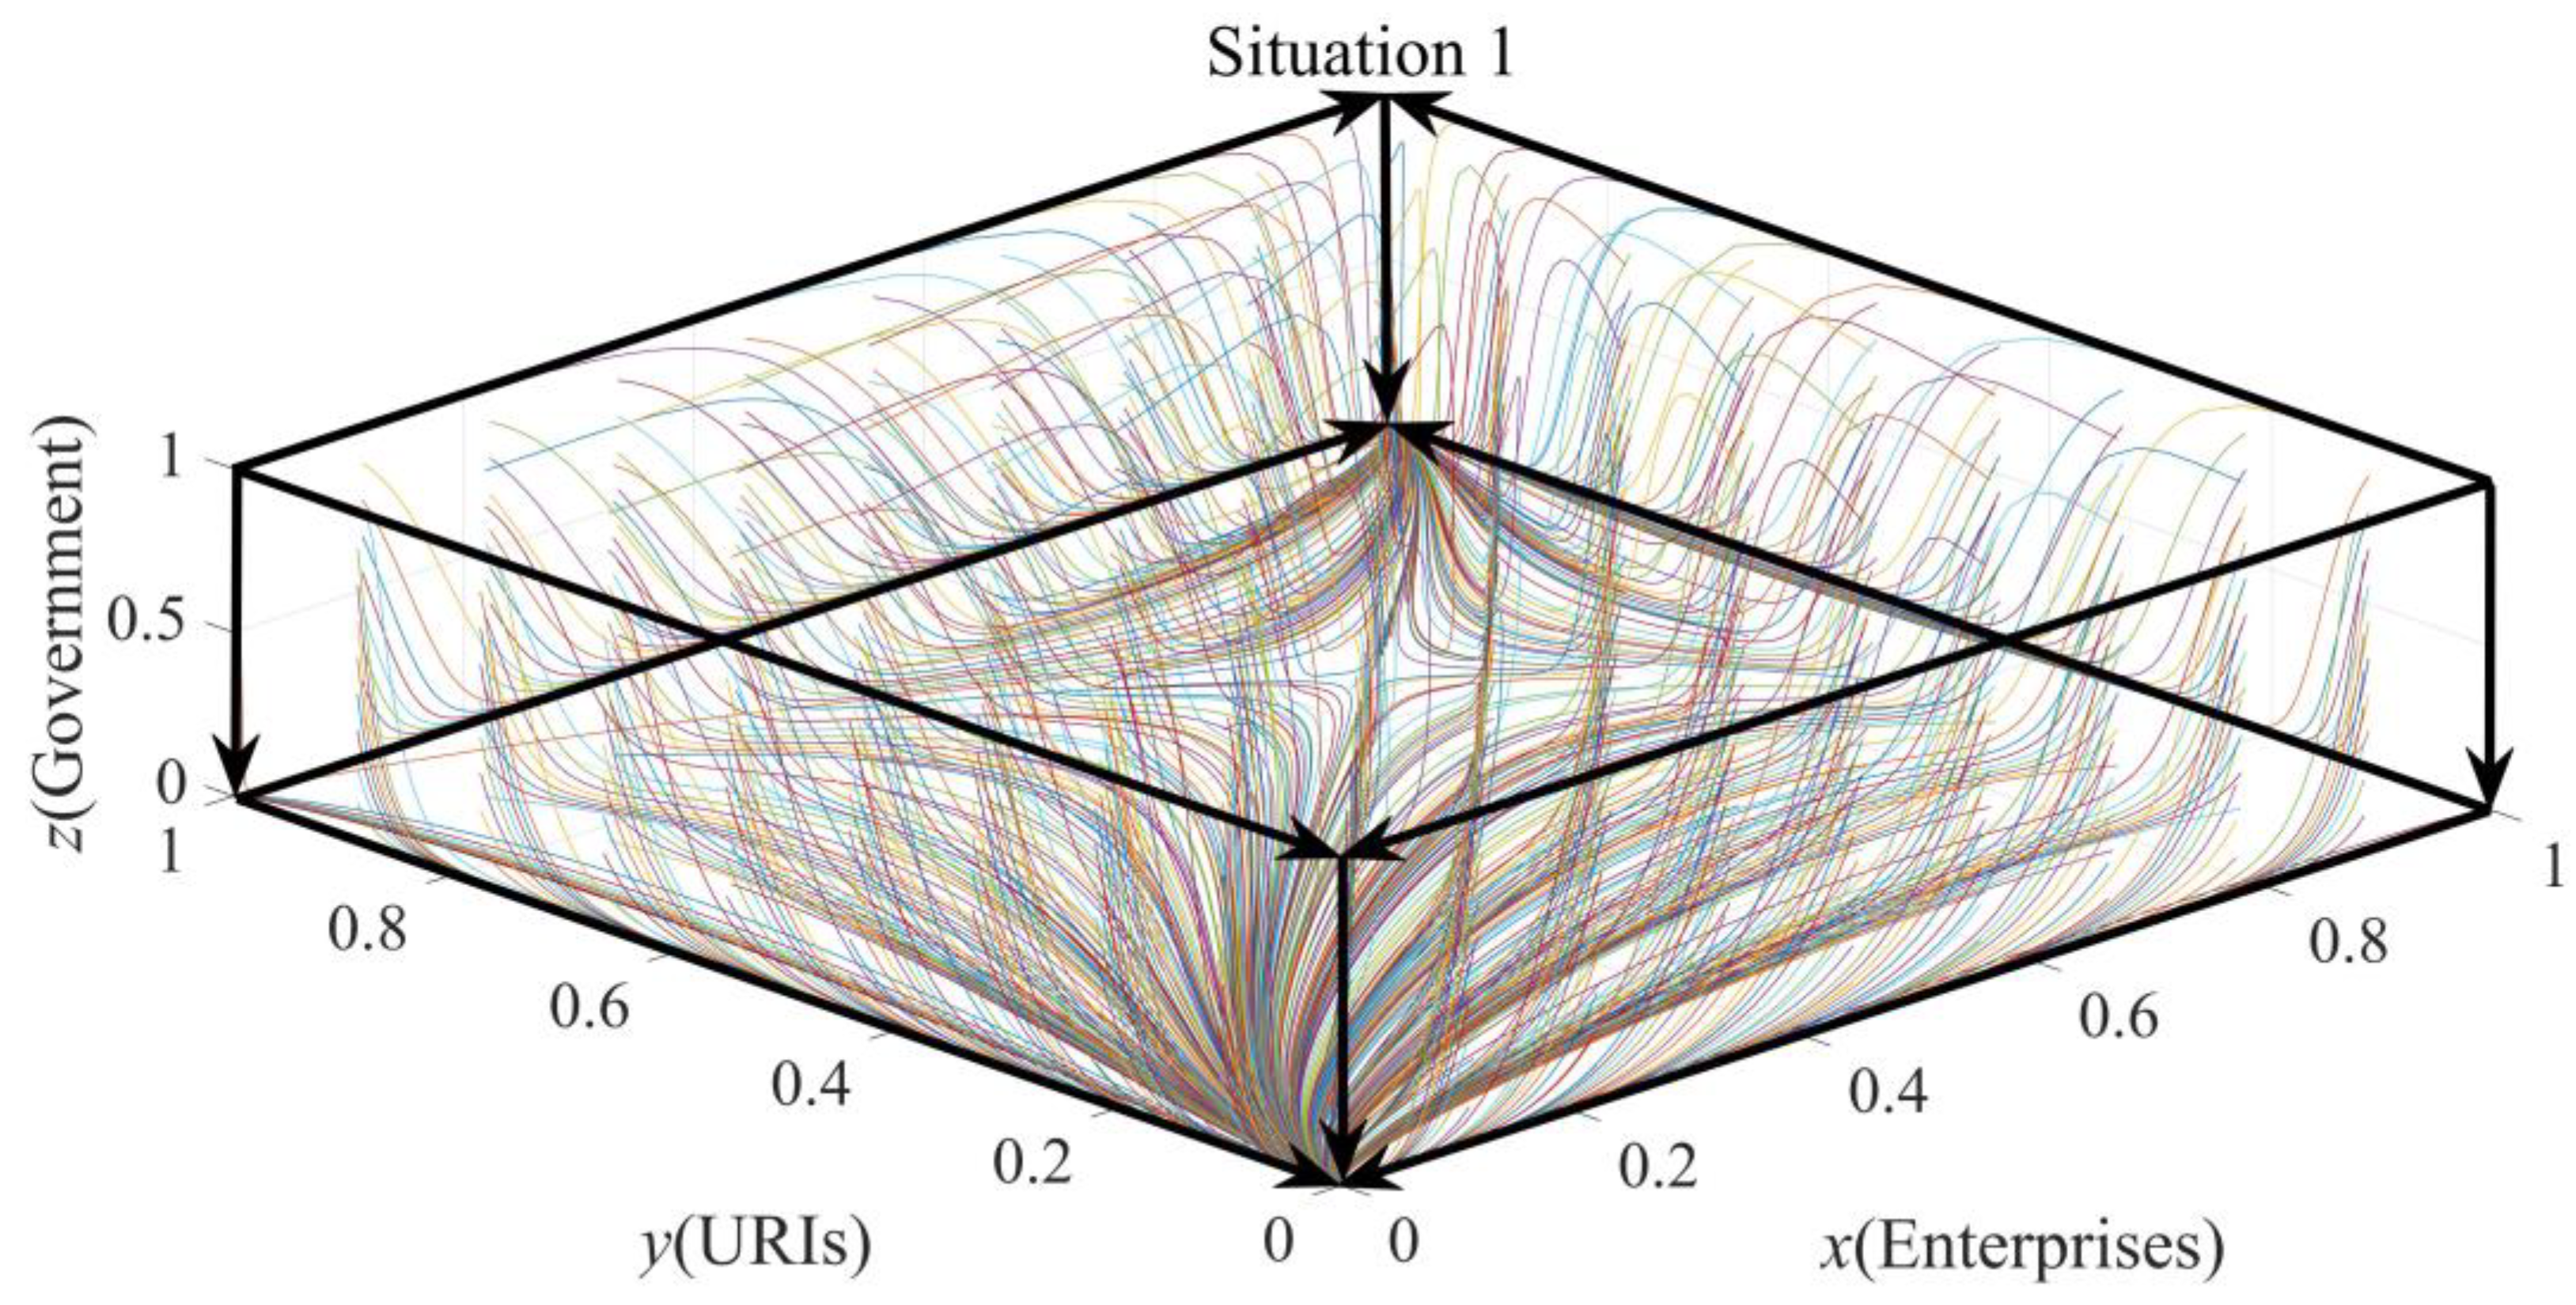
(1)
Scenario 1: When
, namely government’s incentive and punishment policies are not properly formulated so that government cannot obtain benefits from financial intervention. Ultimately, government will adopt non-intervention as evolutionarily stable strategy (ESS). The equilibrium points (0,0,0) and (1,1,0) may be stable points of the system. According to the above situation, and assignments are shown in
Table 4.
Substitute the assignments of initial conditions in
Table 4 into dynamic replication equation of three populations’ game, simulation diagrams can be then obtained as shown in
Figure 2.
Figure 2 shows approximately the evolution paths of all points in Situation 1. The equilibrium point (0,0,0) and (1,1,0) are ESSs. Finally, all of the rest point will evolute to ESS over time.
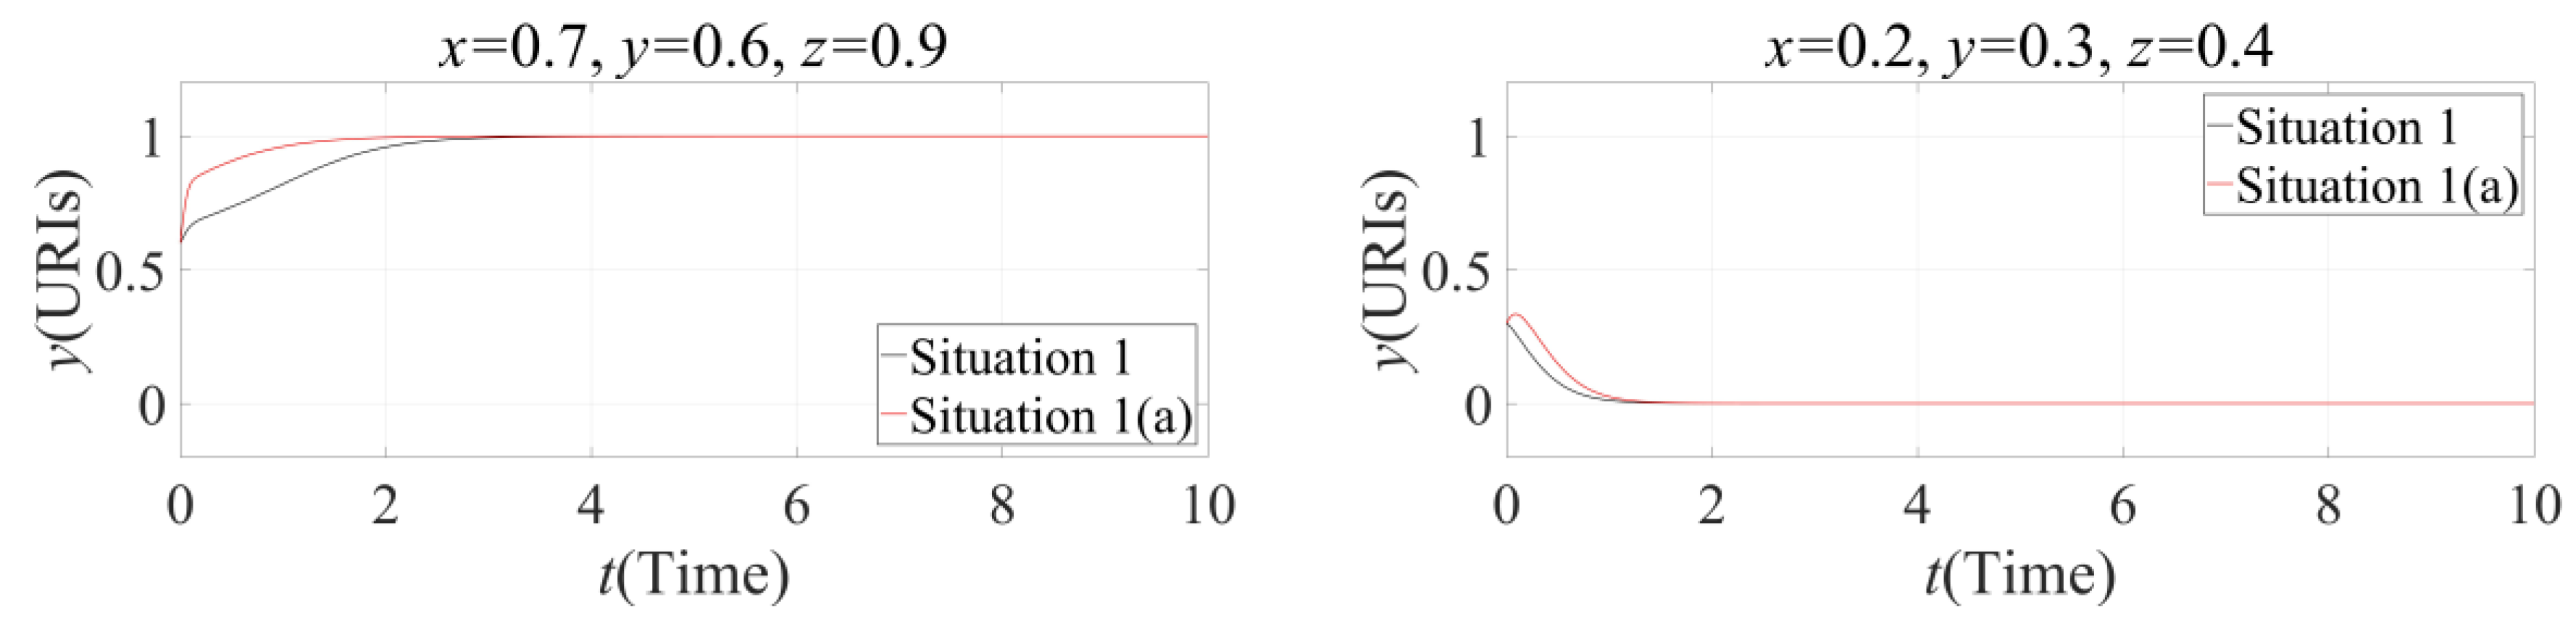
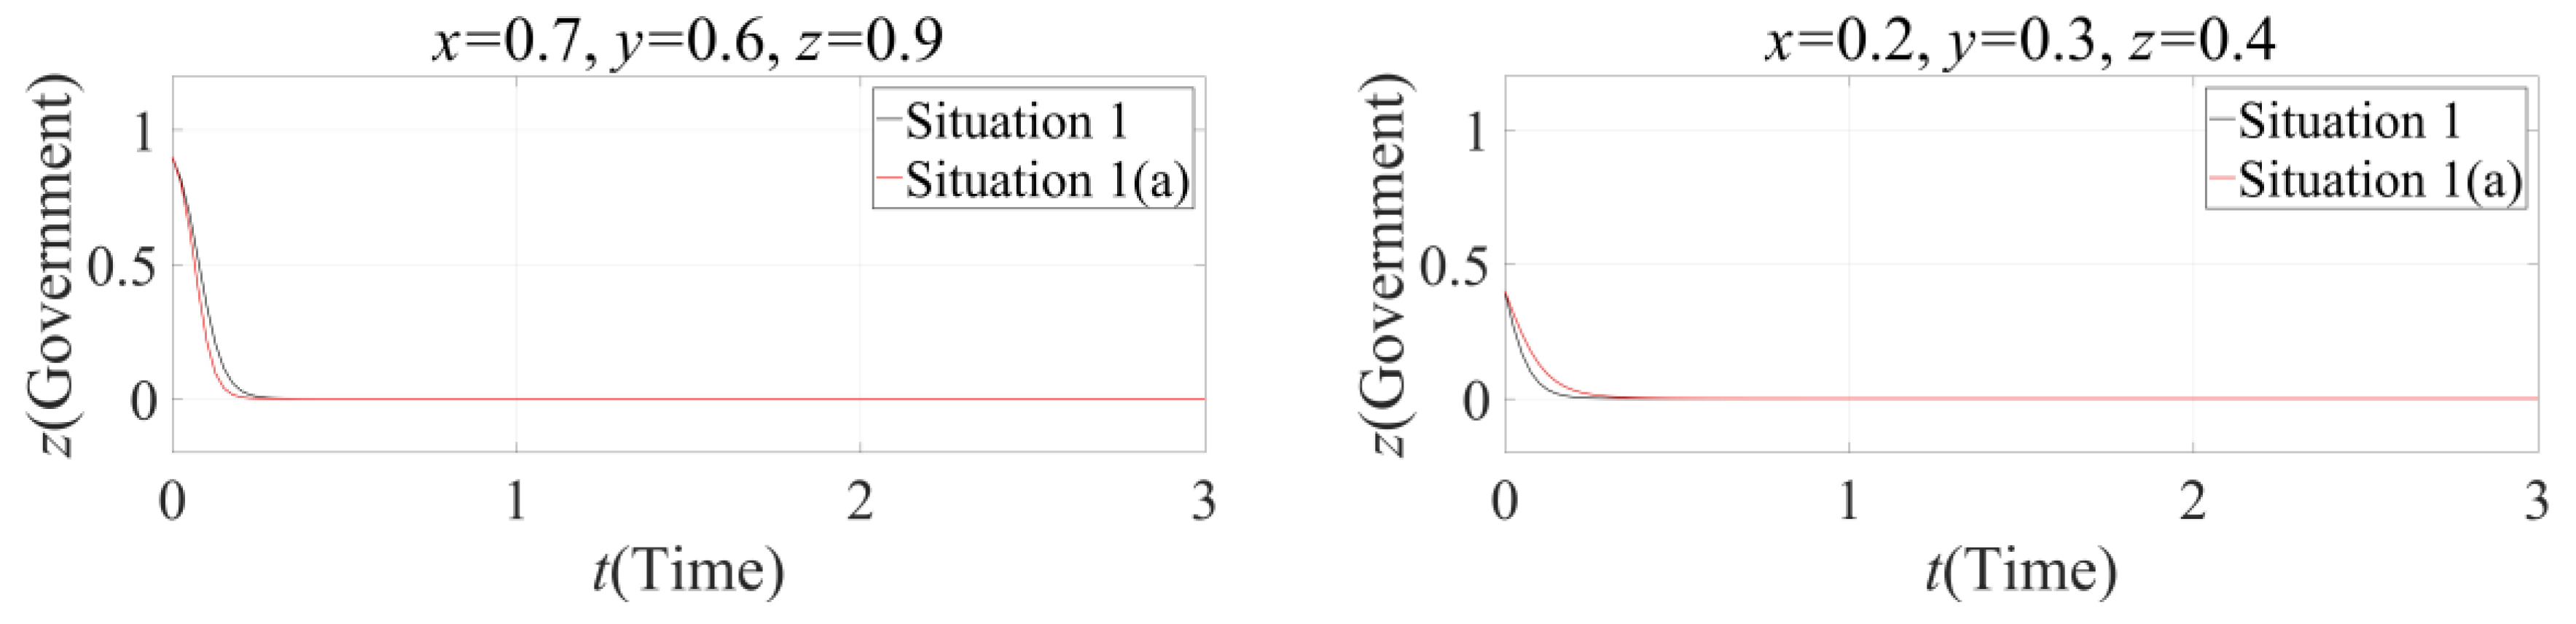
Moreover, in
Table 4 above, it can be seen that the amount of incentives and punishments given by government to enterprises and URIs in Situation 1(a) is larger than that in Situation 1. In order to more clearly observe the impact of increased incentives and penalties on the cooperation between enterprises and URIs in this scenario, in the next
Figure 3,
Figure 4 and
Figure 5, we observe the evolution trajectory of them under the two situations. Respectively let
x = 0.7,
y = 0.6,
z = 0.9, and
x = 0.2,
y = 0.3,
z = 0.4 in Situation 1 and 1(a). Evolution path diagrams of of
x,
y and
z are as shown as follows.
In this scenario, although enterprises and URIs can obtain more benefits from positive cooperation, they also undertake the risk of the other one’s free riding. Collaborative innovation network is unstable, and the quality of collaborative innovation is very low.
From the evolution trajectories in
Figure 3 and
Figure 4, it could been seen that in Scenario 1, if the numerical value of
x or
y is large, increasing the amount for incentives and punishments can improve the frequency of enterprises’ and URIs’ positive cooperation. However , if the numerical value of
x or
y is small, although the government can make them have the trend of positive cooperation by increasing the amount for incentives and punishments, both of enterprises and URIs will eventually cooperate negatively with each other over time. At the same time, the government will eventually select non-financial intervention as ESS.
(2)
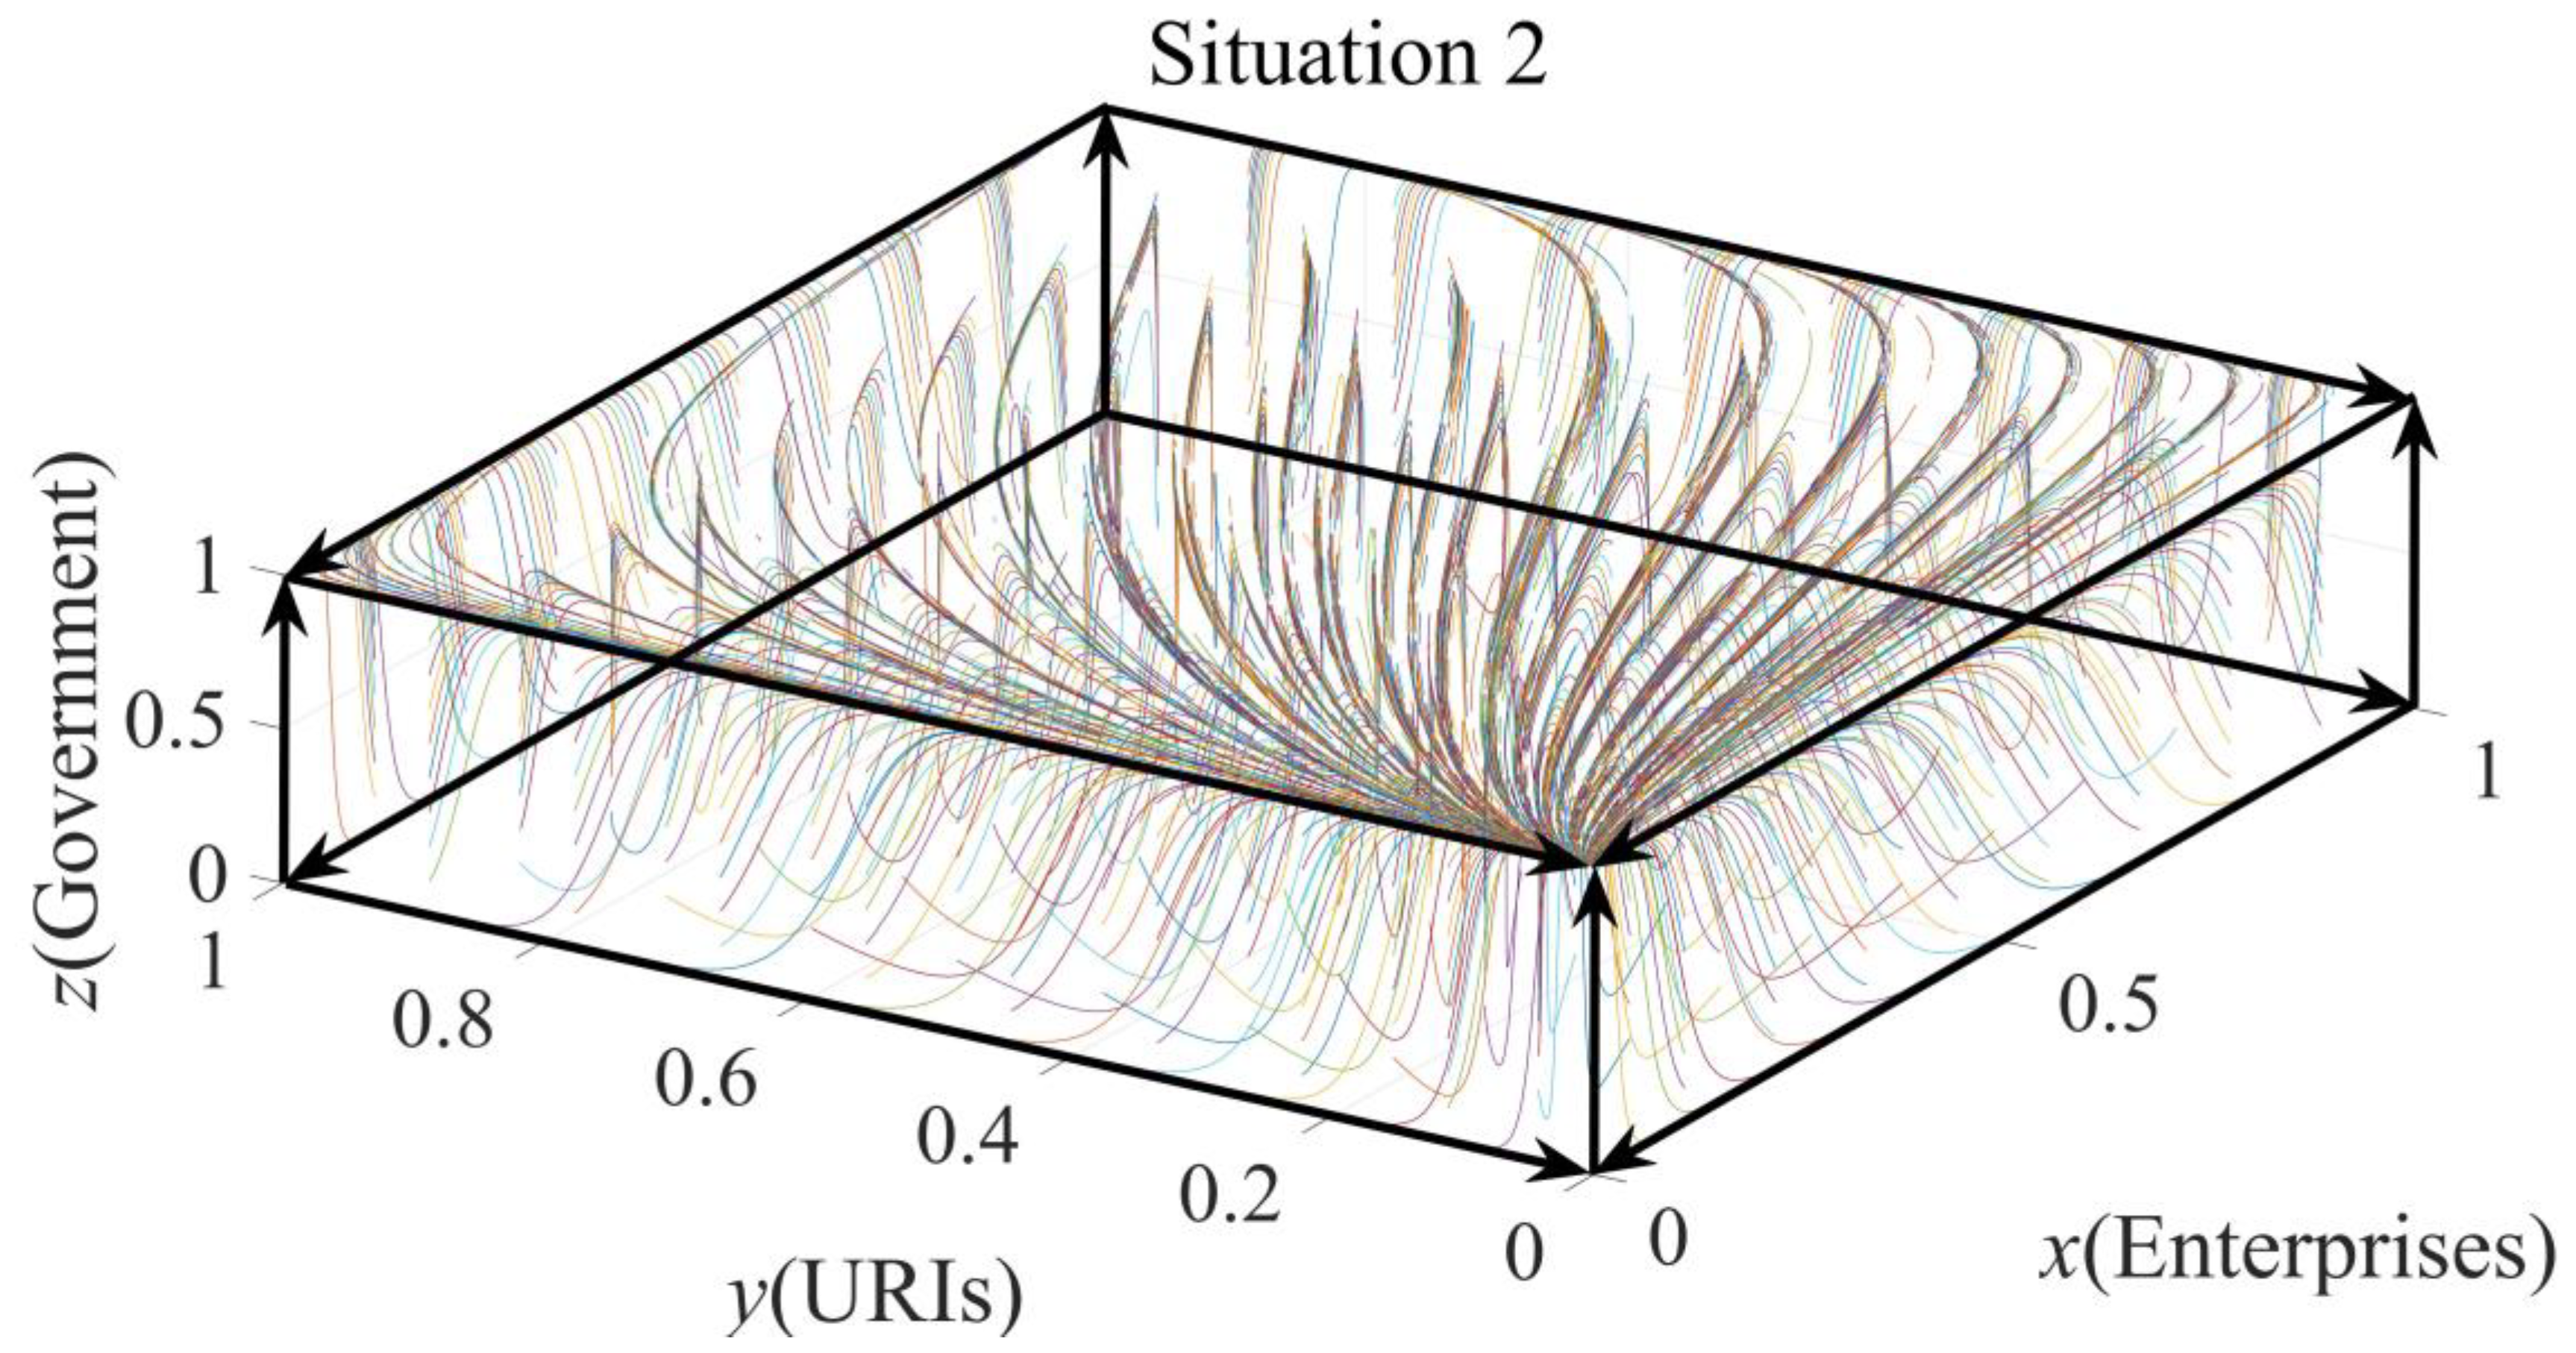
Scenario 2: When
, namely the government sets the amount for incentives and punishments based on actual conditions, making it possible to obtain profits under financial intervention, here government will adopt financial intervention as stabilization strategy. (0,0,1), (1,1,1), (1,0,1) and (0,1,1) may be stable points of the system, and assignments are shown in
Table 5.
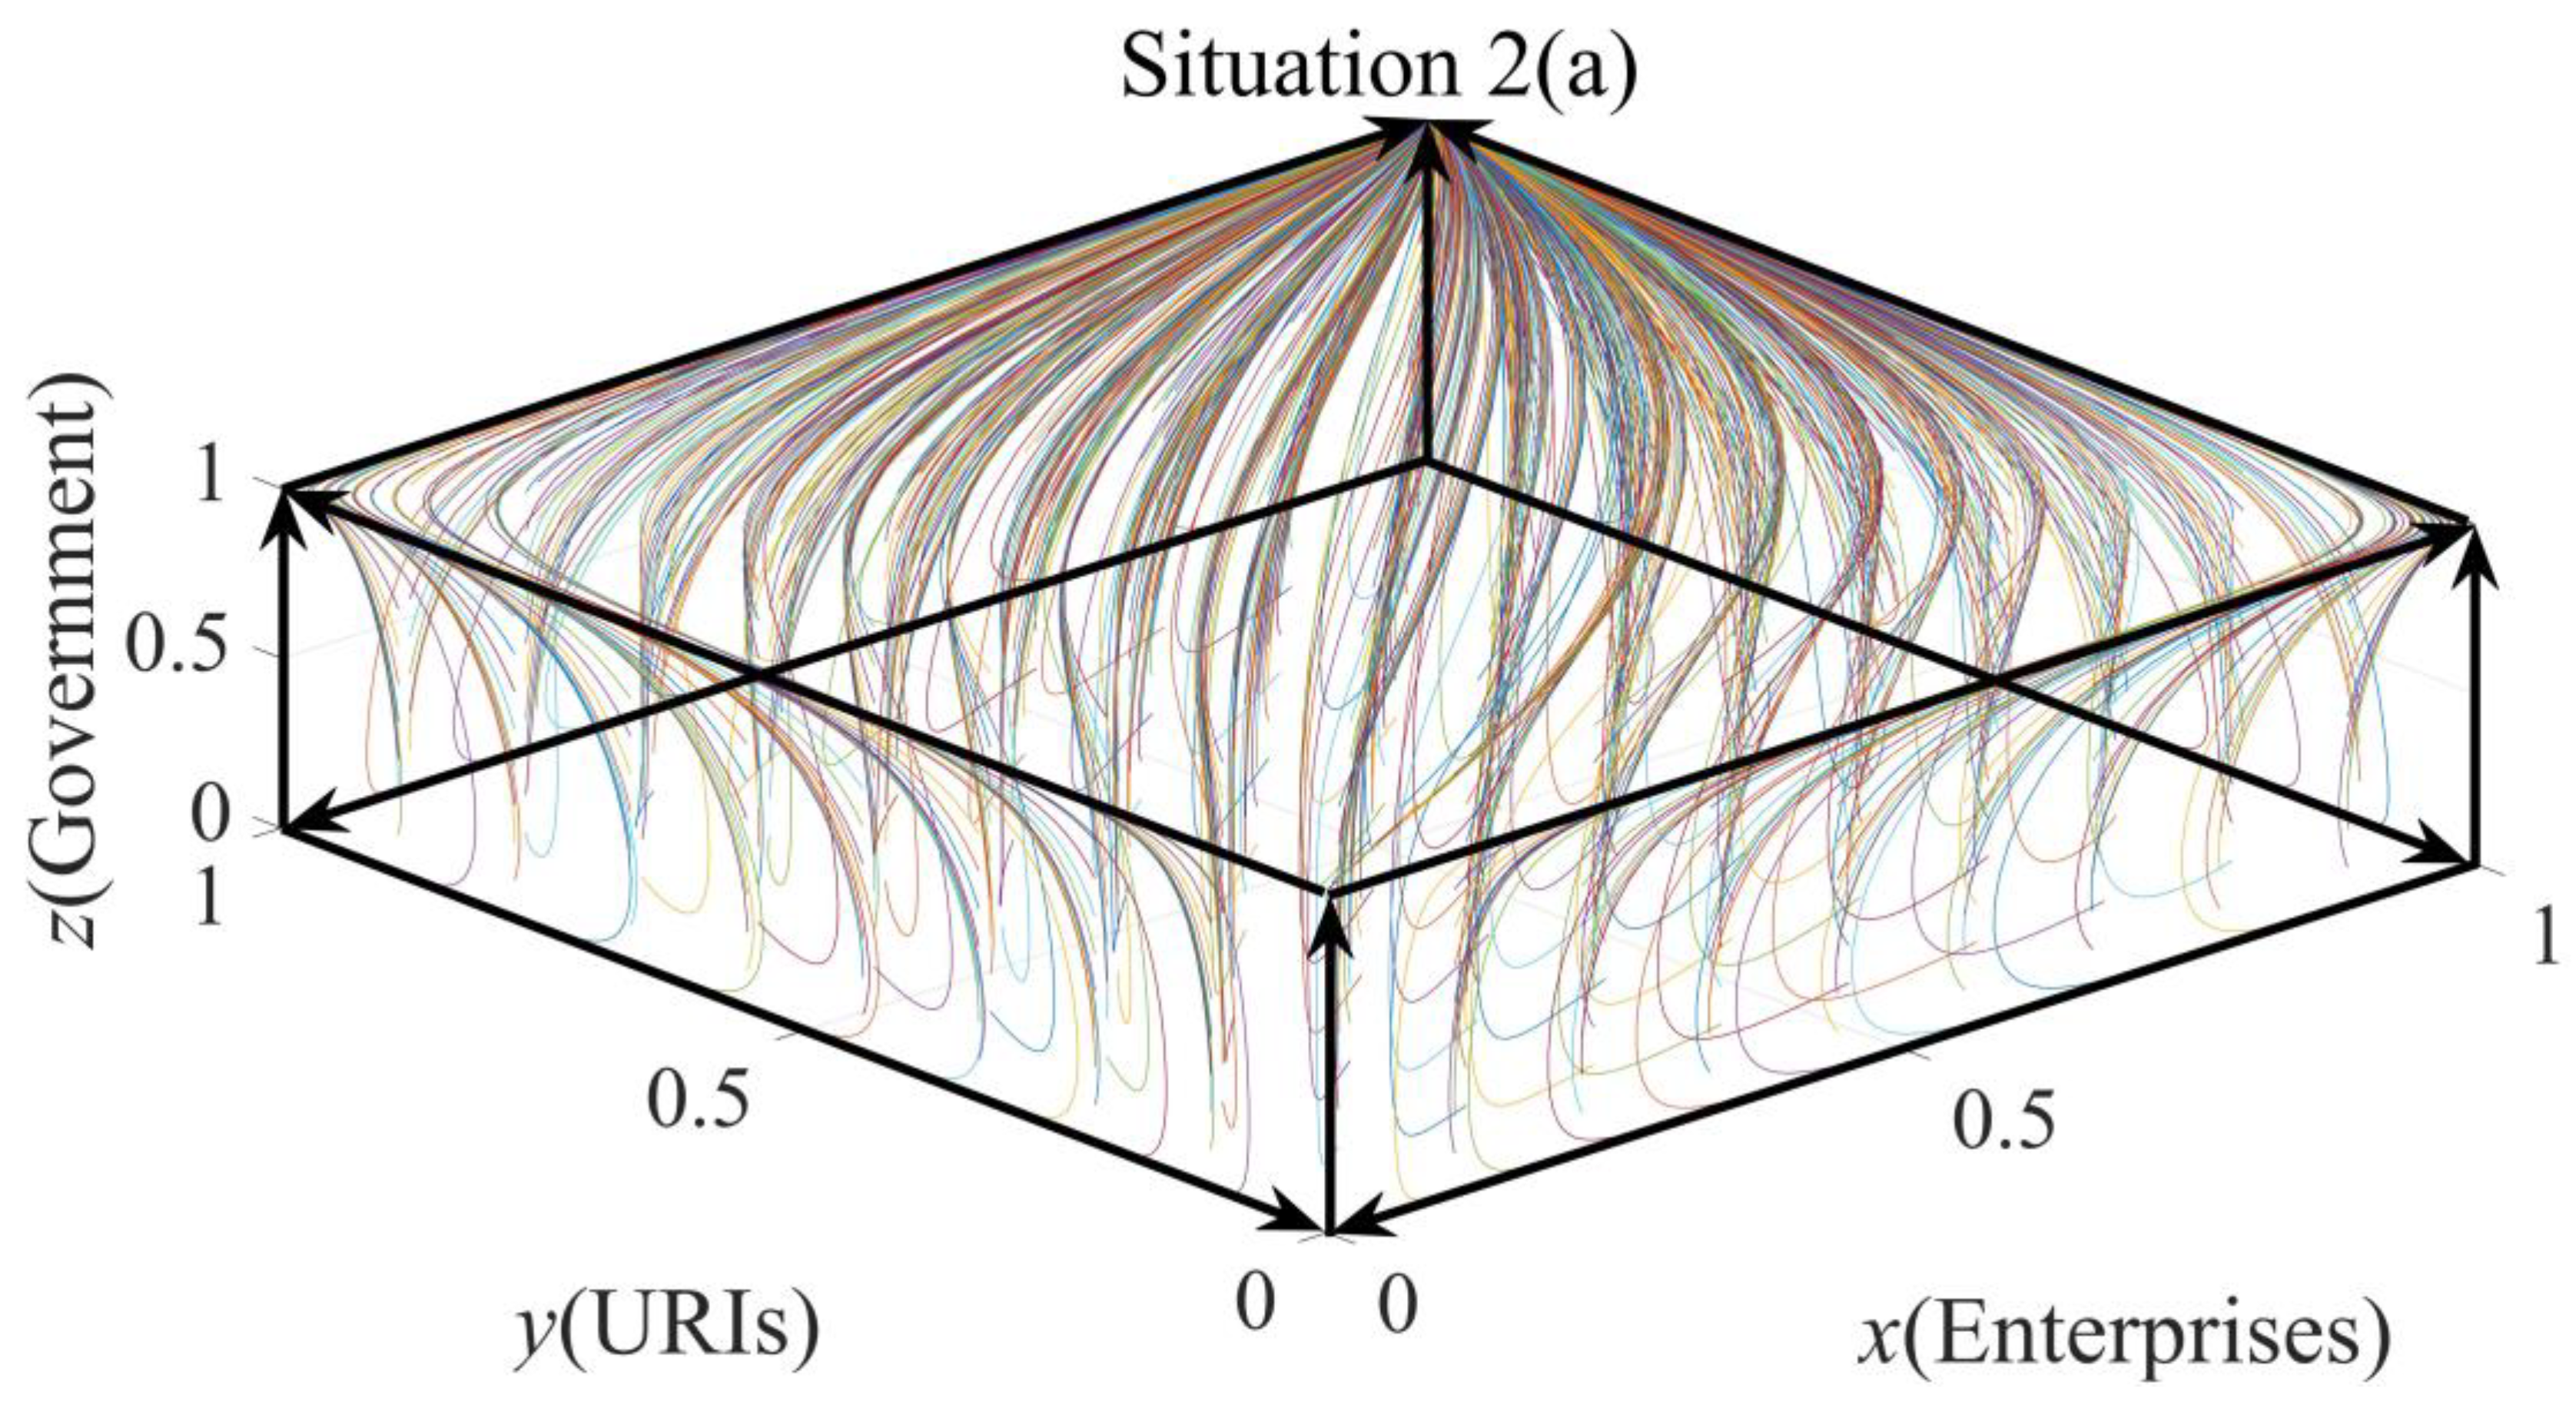
Scenario 2 constructs such a scene where enterprises and URIs tend to cooperate negatively due to technical issues that make collaborative innovation cost too high or take a long time to be profitable. At this time, the government can guarantee its own profit after formulating incentives and punishments, but the amount for incentives and punishment is too small to stimulate positive cooperation between enterprises and URIs. Then, the numerical values of , , and are increased in Situation 2(a).
Substitute the assignments of initial conditions in
Table 5 into dynamic replication equation of three populations’ game, then simulation diagrams can be obtained as shown in
Figure 6 and
Figure 7.
Figure 6 and
Figure 7 directly show the evolution path of all rest points in Situation 2 and 2(a). In Situation 2 the equilibrium point (0,0,1) is ESS, while in Situation 2(a) the equilibrium point (1,1,1) is ESS. Then it can be found that under government’s financial intervention, the amount of incentives for positive cooperation and punishments for negative cooperation can significantly influence final choice of cooperation stabilization strategy. Although when the values of
z are small,
x and
y have the tendency of negative cooperation, but
y and
z eventually will evolve to the point (1,1,1) under the government’s sufficient incentive and punishment over time, as shown in
Figure 7.
However, excessive incentives and penalties are ineffective. If government’s intervention and free riding behavior are not taken into consideration, when enterprises’ or URIs’ benefits from positive cooperation are less than those from negative cooperation, enterprises’ or URIs’ benefit differentials between positive cooperation and negative cooperation can be denoted as follows.
Enterprises’ benefit differentials: .
URIs’ benefit differentials: .
To simplify the presentation, let
If (j =A or B), positive population needs to pay extra costs .
Comparing evolution path diagrams of Situation 2(a) to Situation 2, as long as the total amount of government’s incentives and punishments for enterprises is greater than additional costs that enterprises have to pay for positive cooperation or greater than extra costs that enterprises should pay for URIs’ free riding, it will make some enterprises to change from negative cooperation to positive cooperation. Similarly, as long as the total amount of government’s incentives and punishments for URIs is greater than or , it will make some URIs to change from negative cooperation to positive cooperation. If the total amount of government’s incentives and punishments is large enough, and larger than the sum of and , that is, when ensuring that both enterprises and URIs can obtain more benefits from positive cooperation, both of them will choose to positively cooperate. For convenience, this paper defines the sum of and as total additional cost (TAC).
(3)
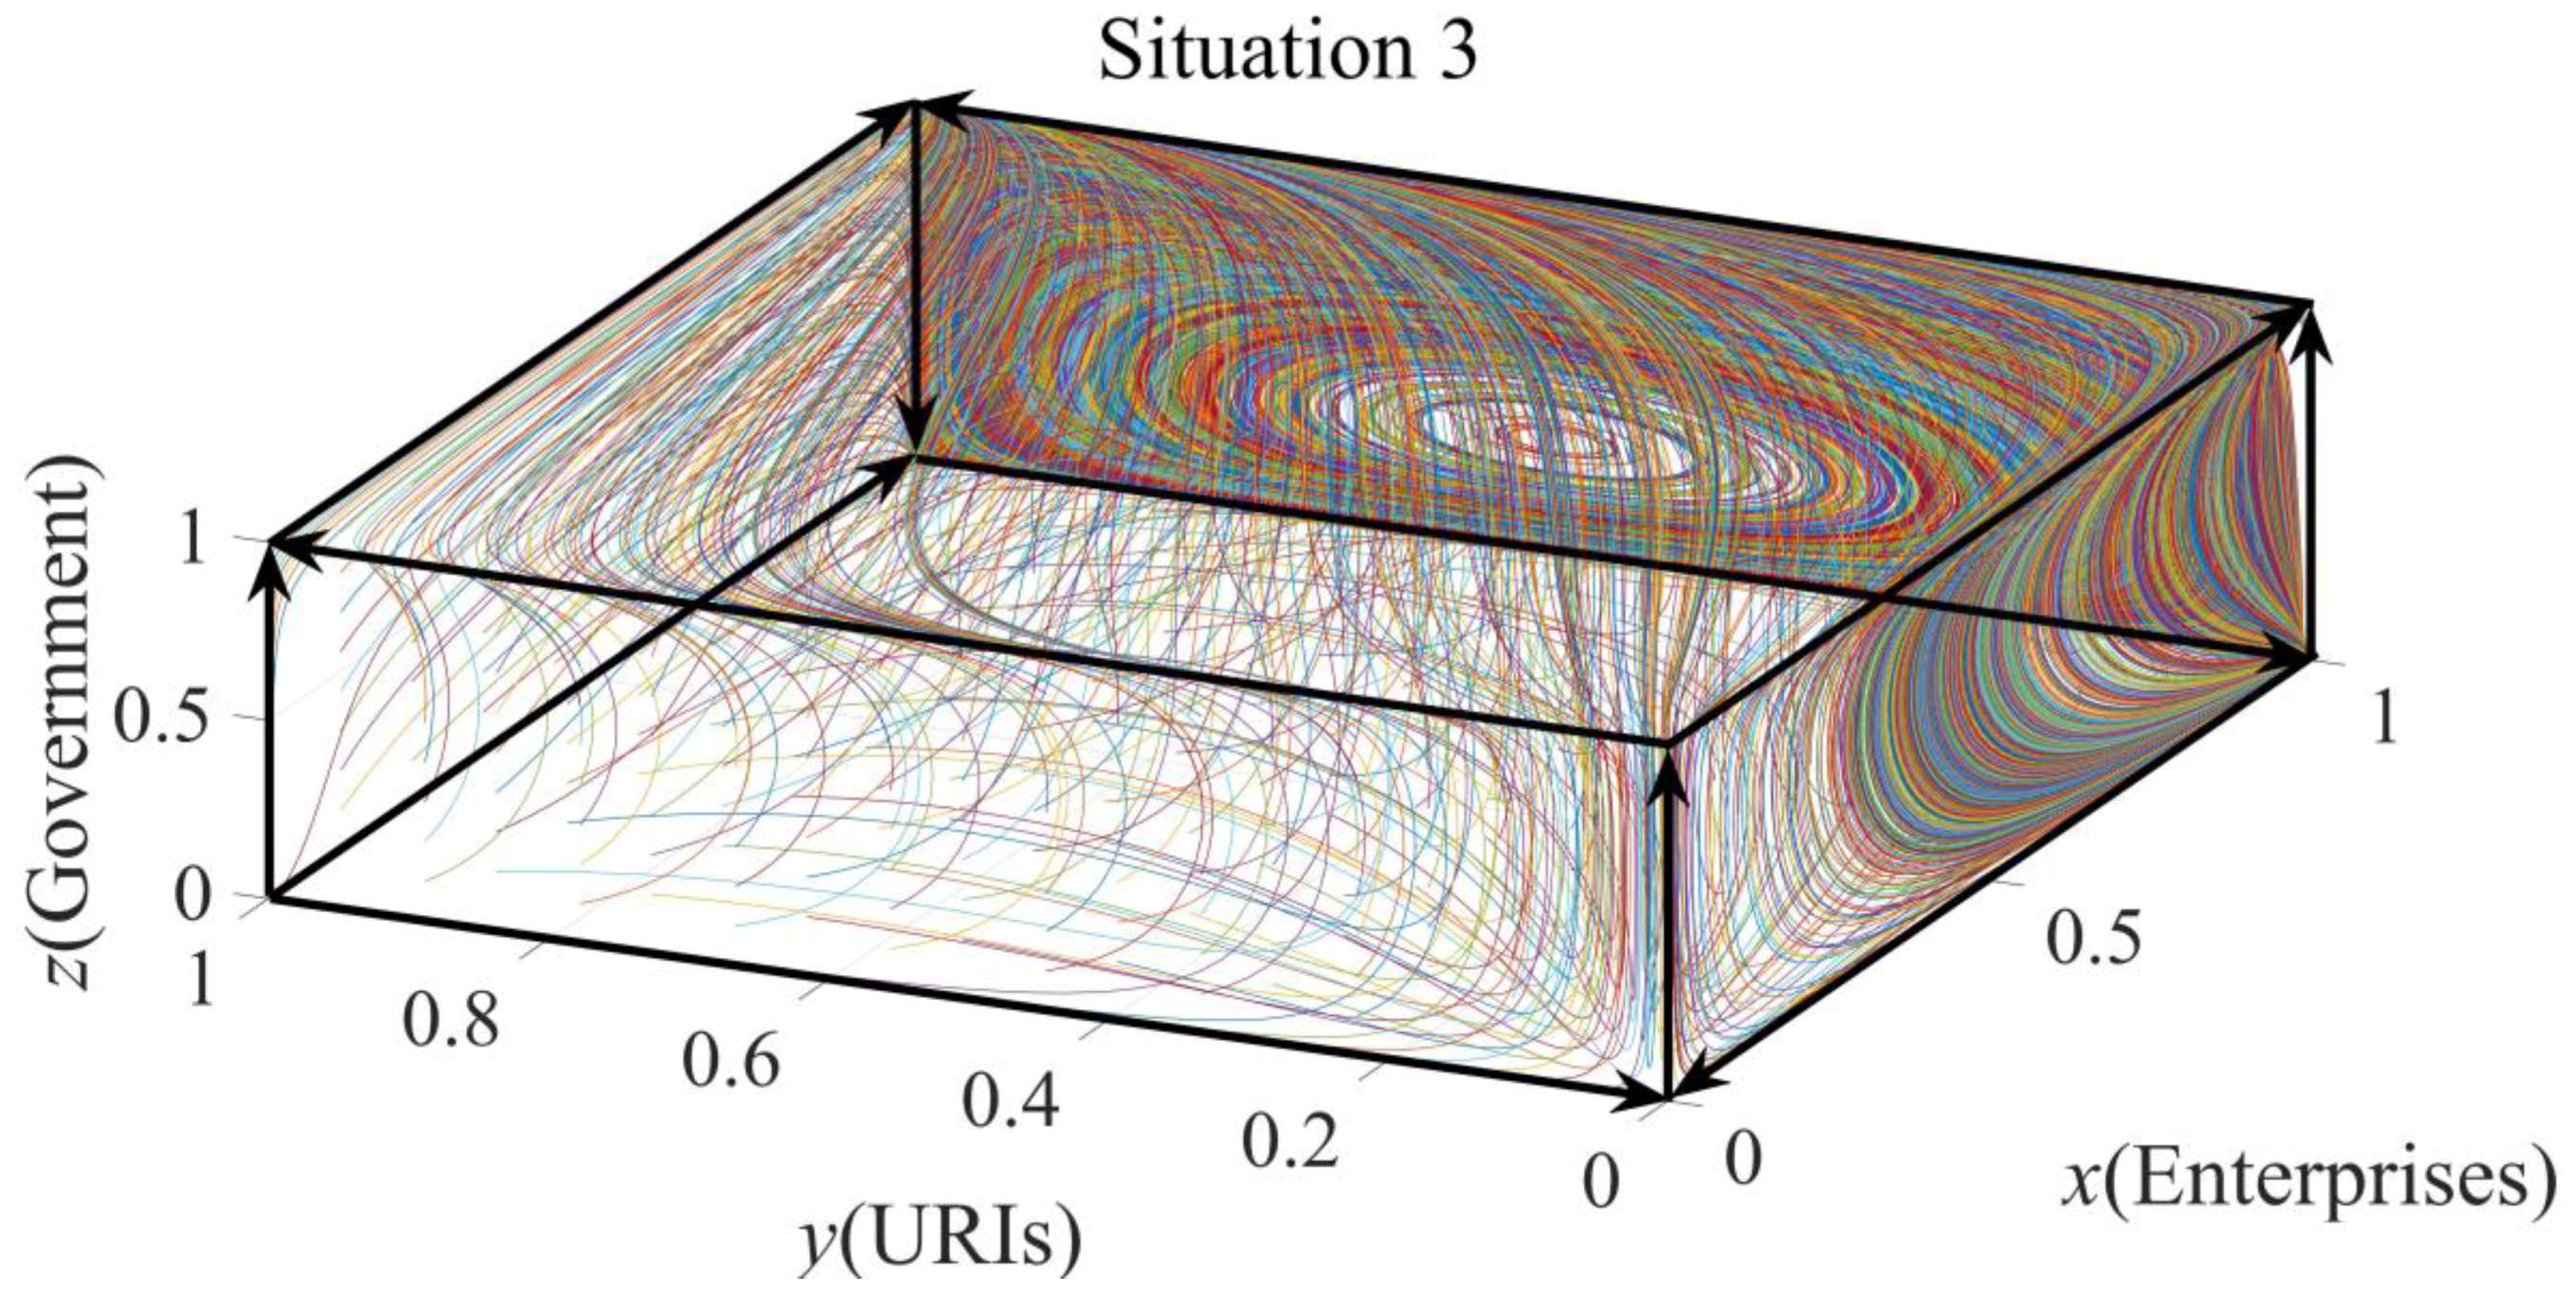
Scenario 3: When
, namely government needs to adopt punishment policies to ensure its benefits. The amount of incentives can influence the choice of government intervention strategies. When there is no negative cooperation, the government does not intervene. The choice of government intervention strategies is judged by the positive and negative of
and
, here (0,0,1), (1,1,0) , (1,0,1) , (0,1,1) may be stable points of the system, and assignments are shown in
Table 6.
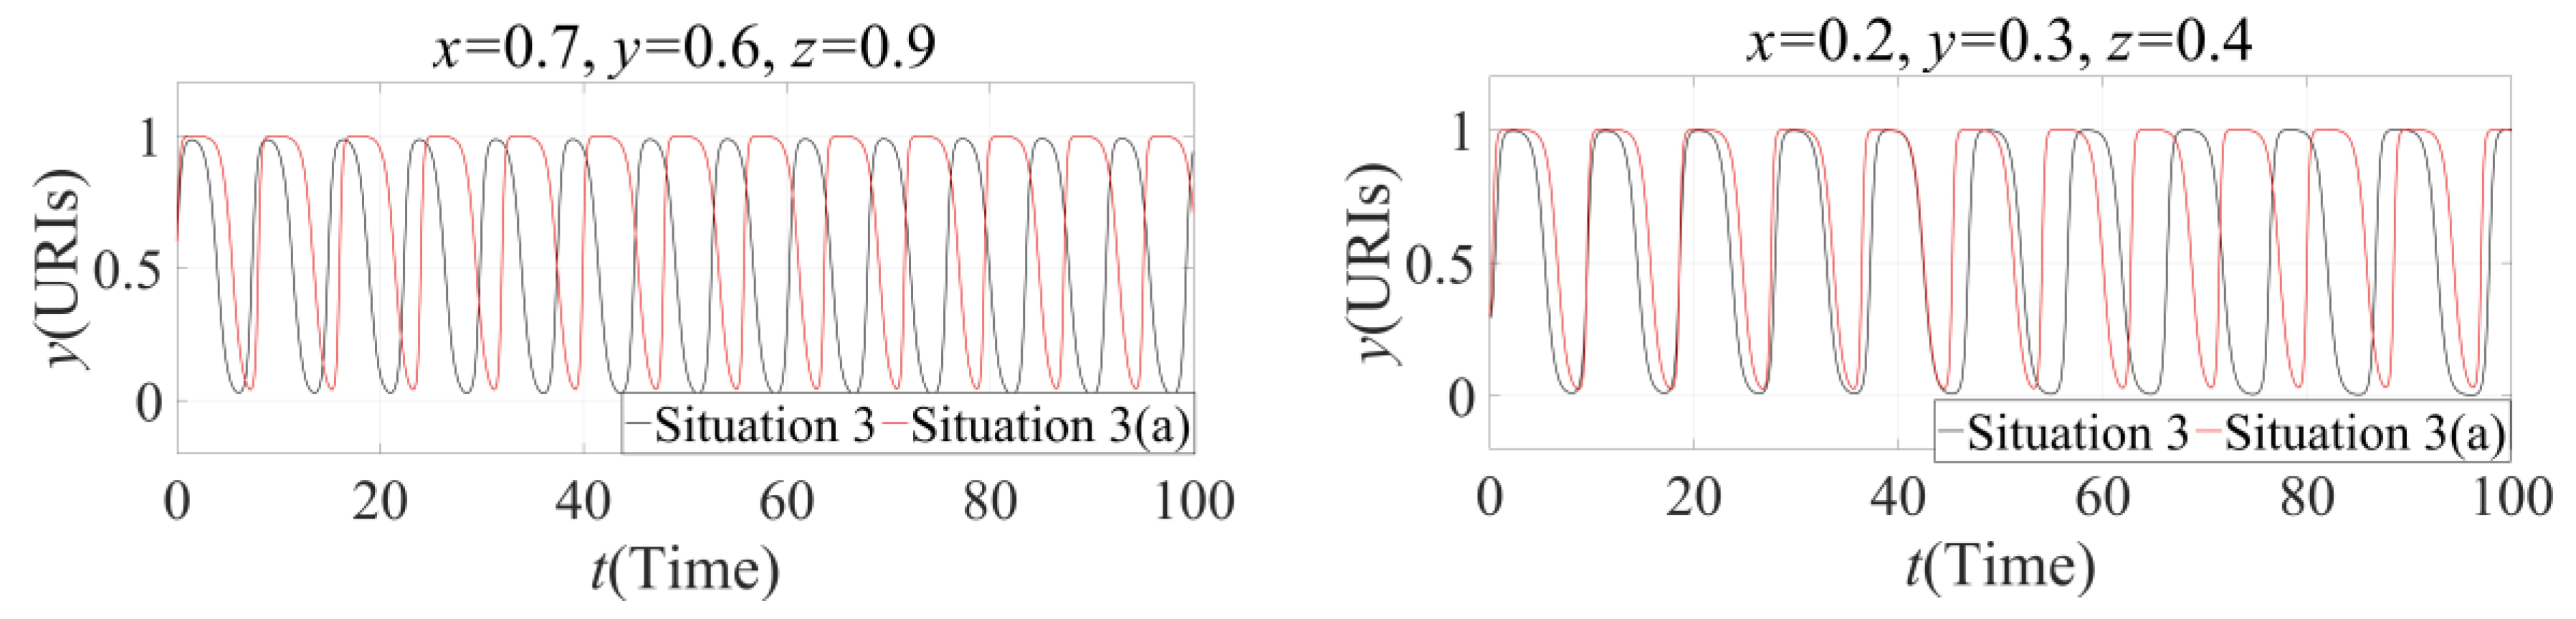
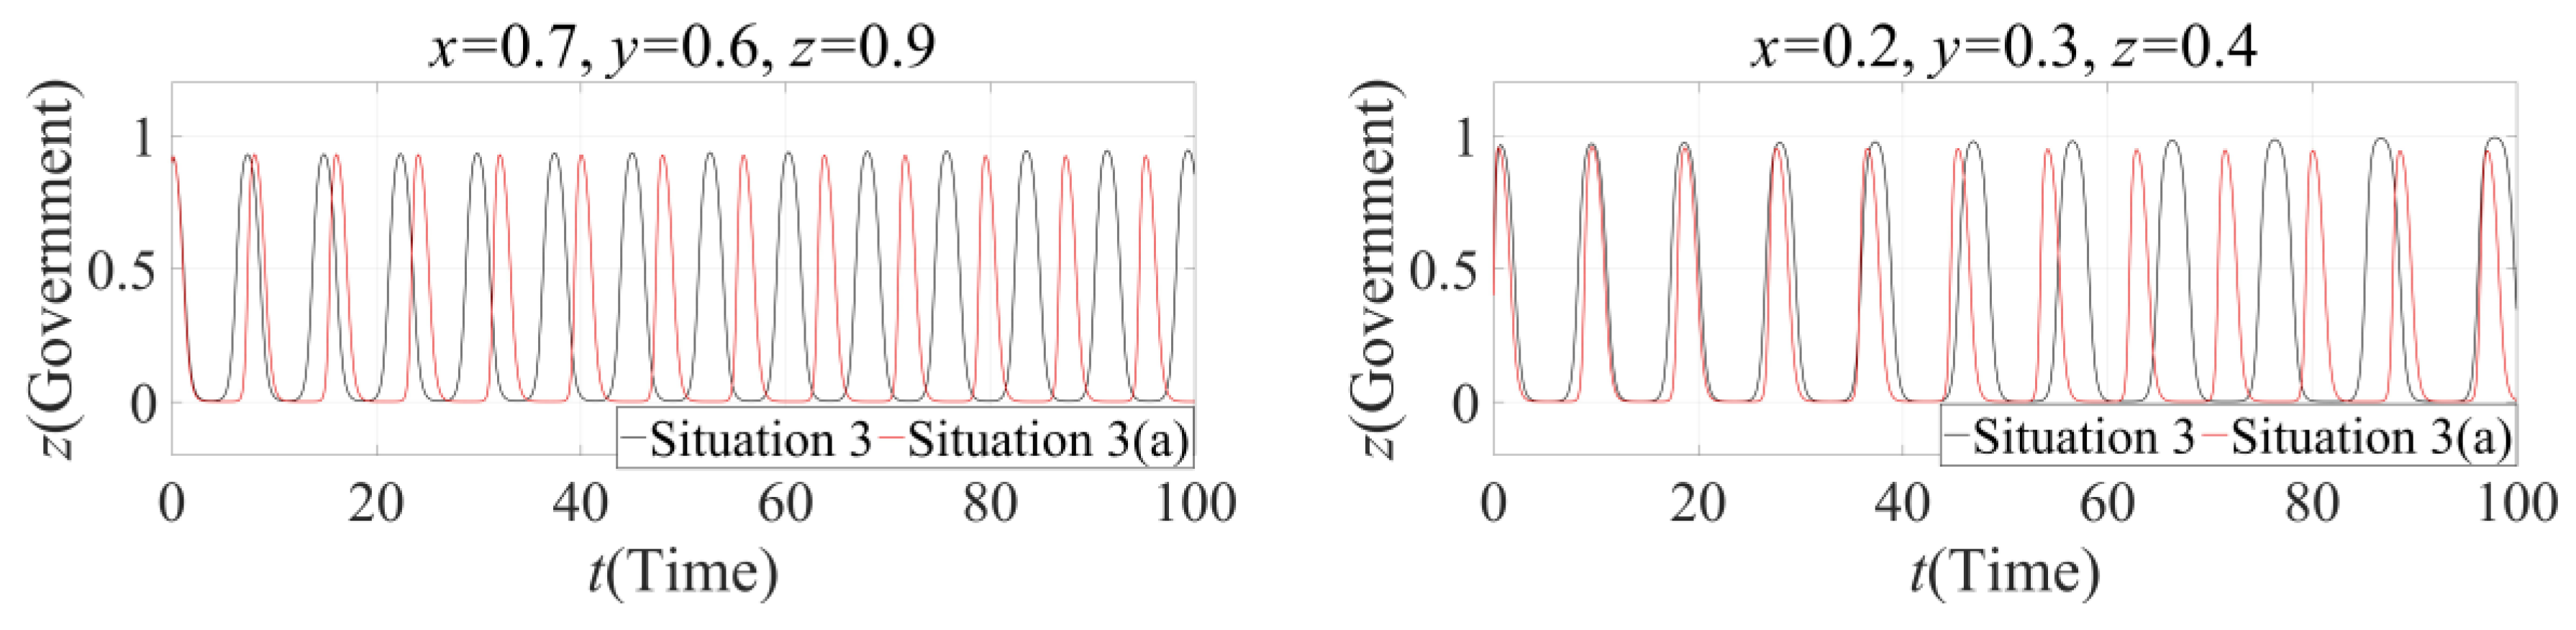
Substitute the assignments of initial conditions in Situation 3 into dynamic replication equation of three populations’ game, simulation diagrams can be obtained as shown in
Figure 8.
In
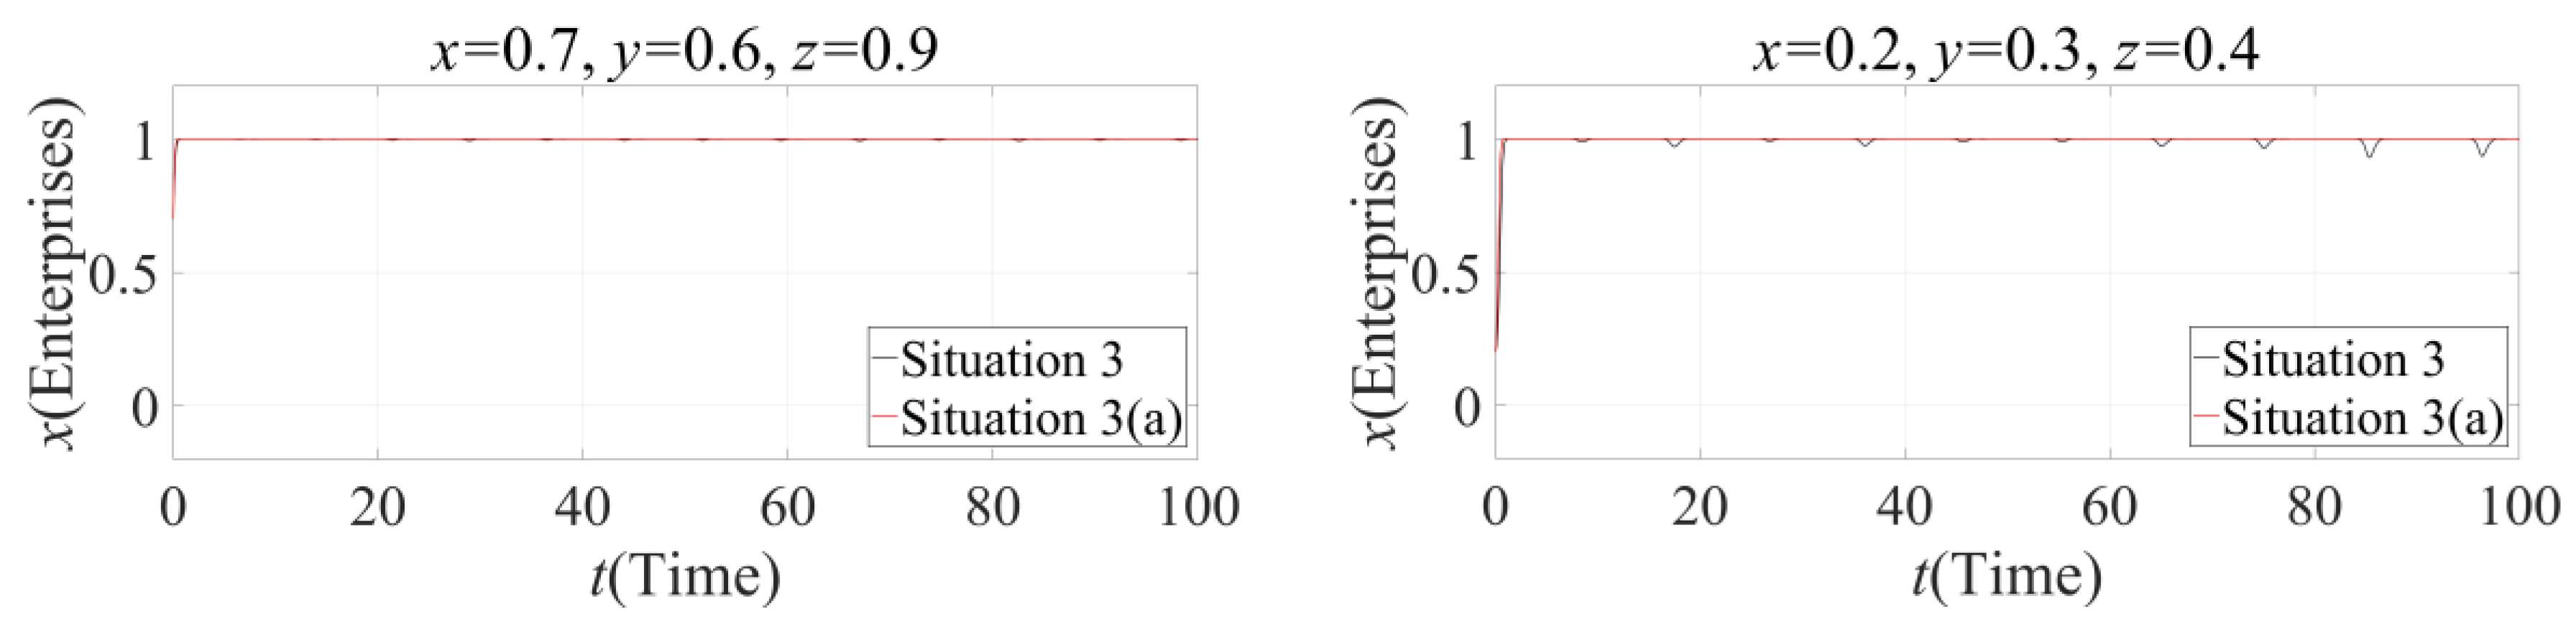
Figure 8, there is no ESS in this situation. The stability of this system is unstable. Then
Figure 8 shows that to increase the numerical value of
can make
x more stable, but
Figure 9,
Figure 10 and
Figure 11 show that to increase the
cannot be as effective as increasing
. The trends of
y’s and
z’s evolutionary trajectories in both of situations are cyclical. That is to say, in this scenario, when the amount of incentives is limited, if government increases the amount of punishment for the population that obtains more benefits from negative cooperation, the cooperation relationship between enterprises and URIs cannot be improved.
5. Conclusions and Suggestions
Based on evolutionary game theory and modern control theory, from the perspective of stakeholder, this paper investigates the cooperative relationship between enterprises and URIs in SEIs’ collaborative innovation network and builds a three-population evolutionary game model between government, enterprise and URIs. Then through data simulation, the stability strategies of enterprises and URIs under different conditions are analyzed. Based on the simulation results, this paper discusses how government could adopt incentives and punishments to promote the cooperation between enterprises and URIs more effectively, and draws the following conclusions:
- (1)
Under government’s financial intervention, government’s incentives and punishments can significantly influence the cooperation relationship between enterprises and URIs.
- (2)
When the total sum of incentives and punishments is greater than TAC, the enterprises or URIs should pay for collaborative innovation, and government’s financial intervention can effectively promote the cooperation between companies, universities, and research institutions.
According to the key findings of this paper, some policy implications are proposed as references for decision-making by governments, policymakers, enterprises, universities and research institutes, and so on.
- (1)
Because it is difficult for government to accurately predict the profits obtained from enterprises and URIs that newly join in collaborative innovation network, the amount of incentives and punishments can only be estimated by analyzing the existing industry data. The government should formulate scientific and effective incentive and punishment policies based on actual situations for the enterprises and URIs in different emerging industries. In accordance with environmental changes, the amount of incentives and punishments should be appropriately adjusted to avoid wasting resources and disrupting the relationship in collaborative innovation networks. In addition, when the government conducts supervision, it should strengthen regulatory force, improve the efficiency of related departments, reduce supervision costs, and ensure the quality of supervision work.
- (2)
Enterprises and URIs in SEIs’ collaborative innovation network should use more appropriate and effective cooperation methods for collaborative innovation, and gradually increase cooperation efficiency. Through mutual communication and mutual trust, enterprises and URIs could sign reasonable cooperation agreements and clarify the issues of interest distribution and property ownership, in order to reduce free riding behavior in cooperation, improve the net income of collaborative innovation strategies between enterprises and URIs, and reduce cooperation risks. Governments, enterprises, and URIs should actively communicate with each other in the long term to ensure that enterprises and URIs can understand and comprehend preferential policies and related regimes formulated by the government in time, and make full use of the collaborative innovation resources provided by the government, so that they can quickly respond to changes in the external environment.
This study explores the cooperation relationship between enterprises and URIs in SEIs’ collaborative innovation network under government intervention. There are some limitations in the present study. First, there are myriad of resources devoted to clustering, however, the effects of these resources on collaborative innovation network were not included in the scope of this research. In the future, we will investigate optimizing allocation of resources for collaborative innovation network. Second, the present study only investigates the cooperation relationship among innovation members under government intervention. Future studies can consider including the sustainable cooperation relationship among innovation members under the dominant of leading enterprises. Despite these limitations, this study serves as a good analysis model to find the implications of collaborative innovation network.


