Characteristics and Trends of Ambient Ozone and Nitrogen Oxides at Urban, Suburban, and Rural Sites from 2011 to 2017 in Shenzhen, China

 ,
, 

Abstract
1. Introduction
2. Data and Methods
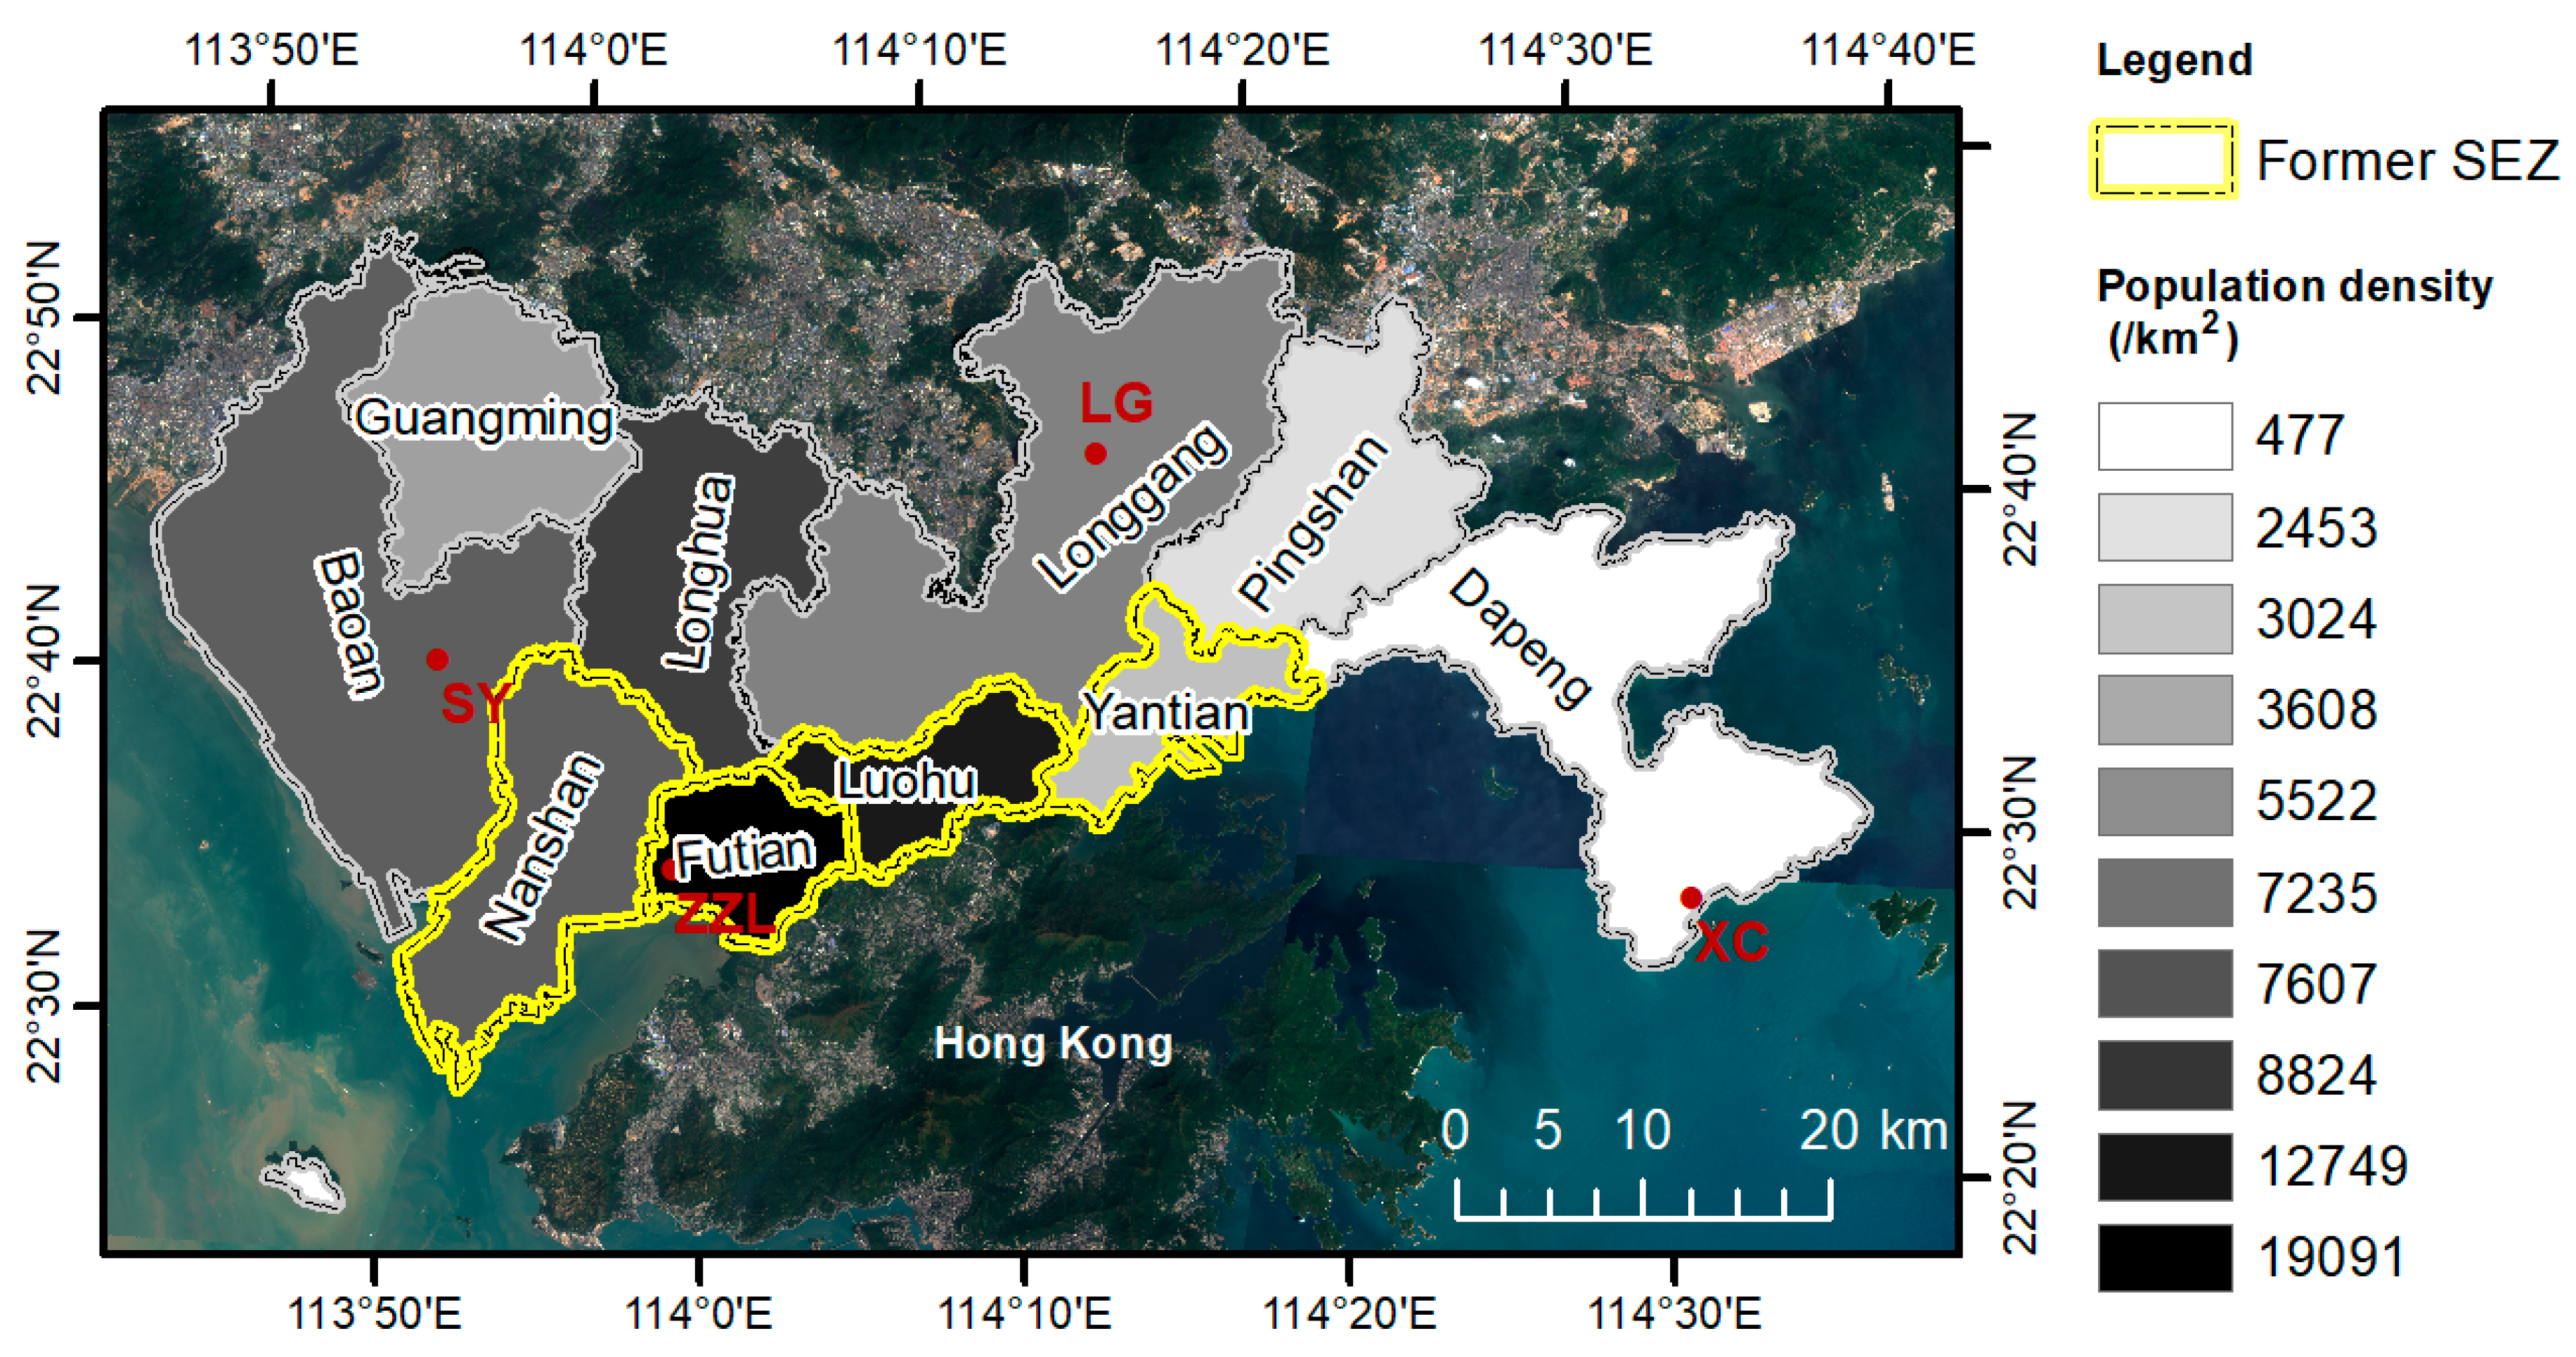
2.1 Sites
2.2 Measurement of Air Pollutants
2.3 Methods
3. Results
3.1 Comparison of O3 and NOx at Urban, Suburban and Rural Sites
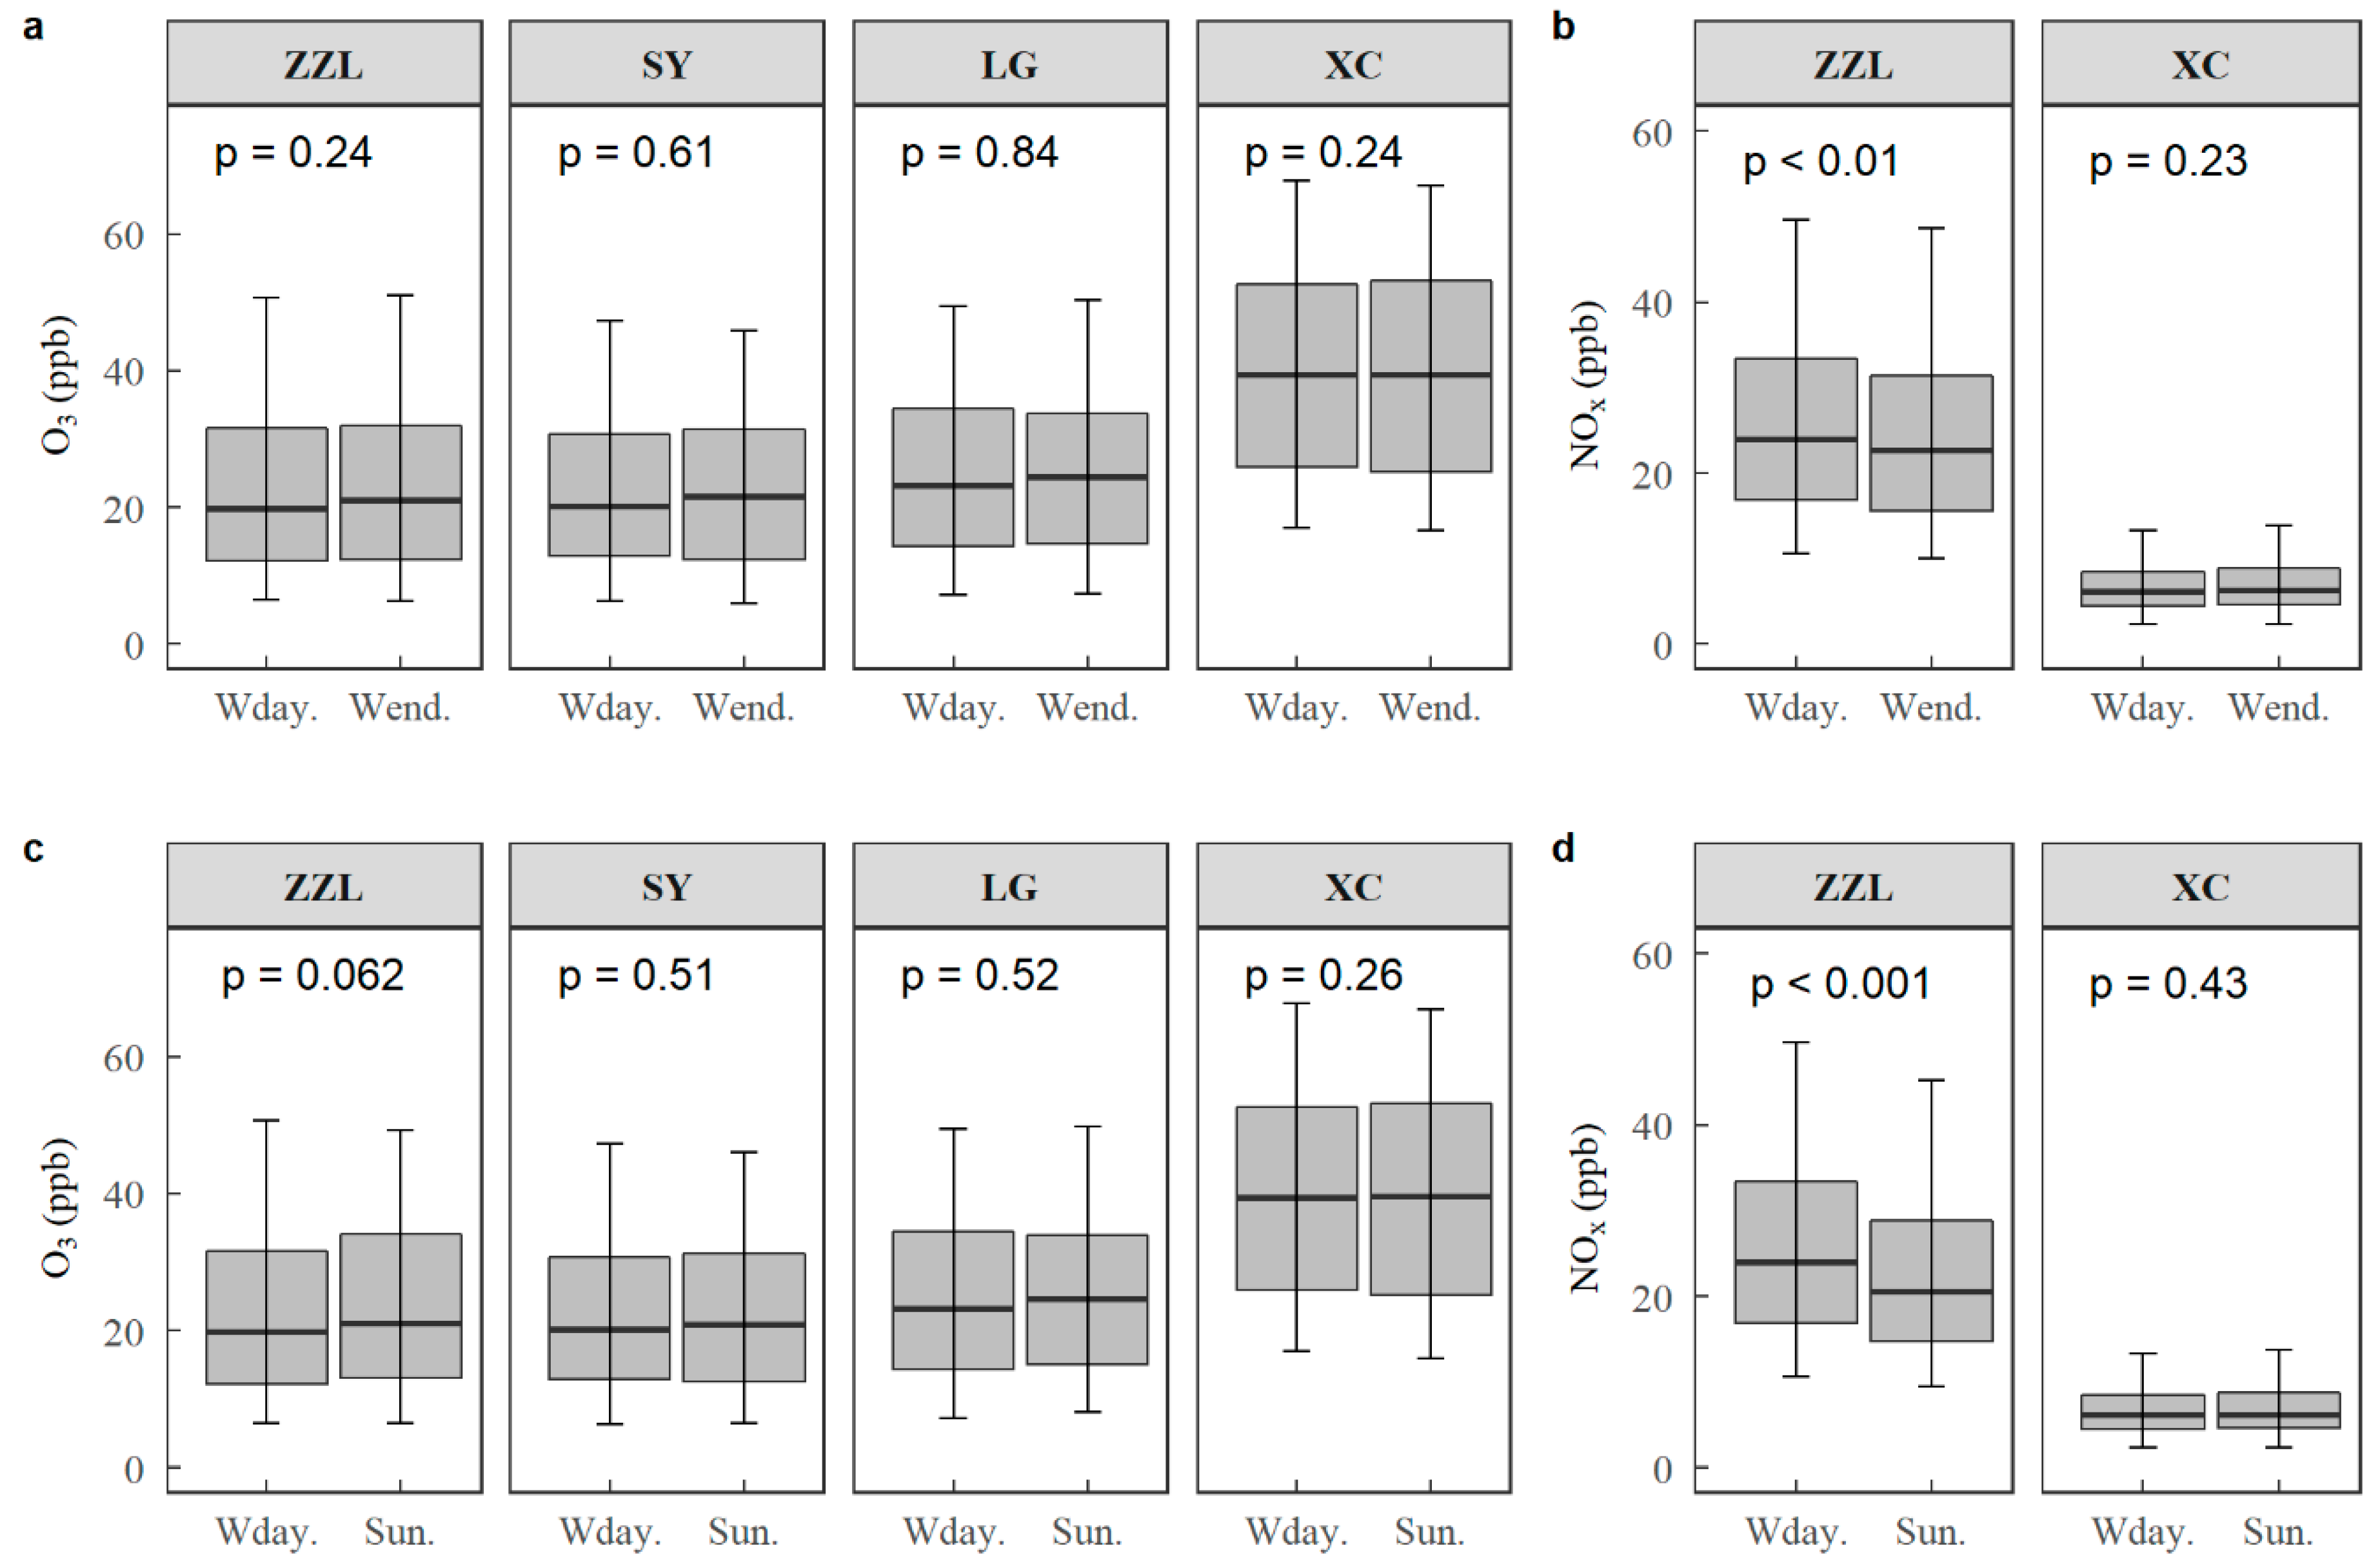
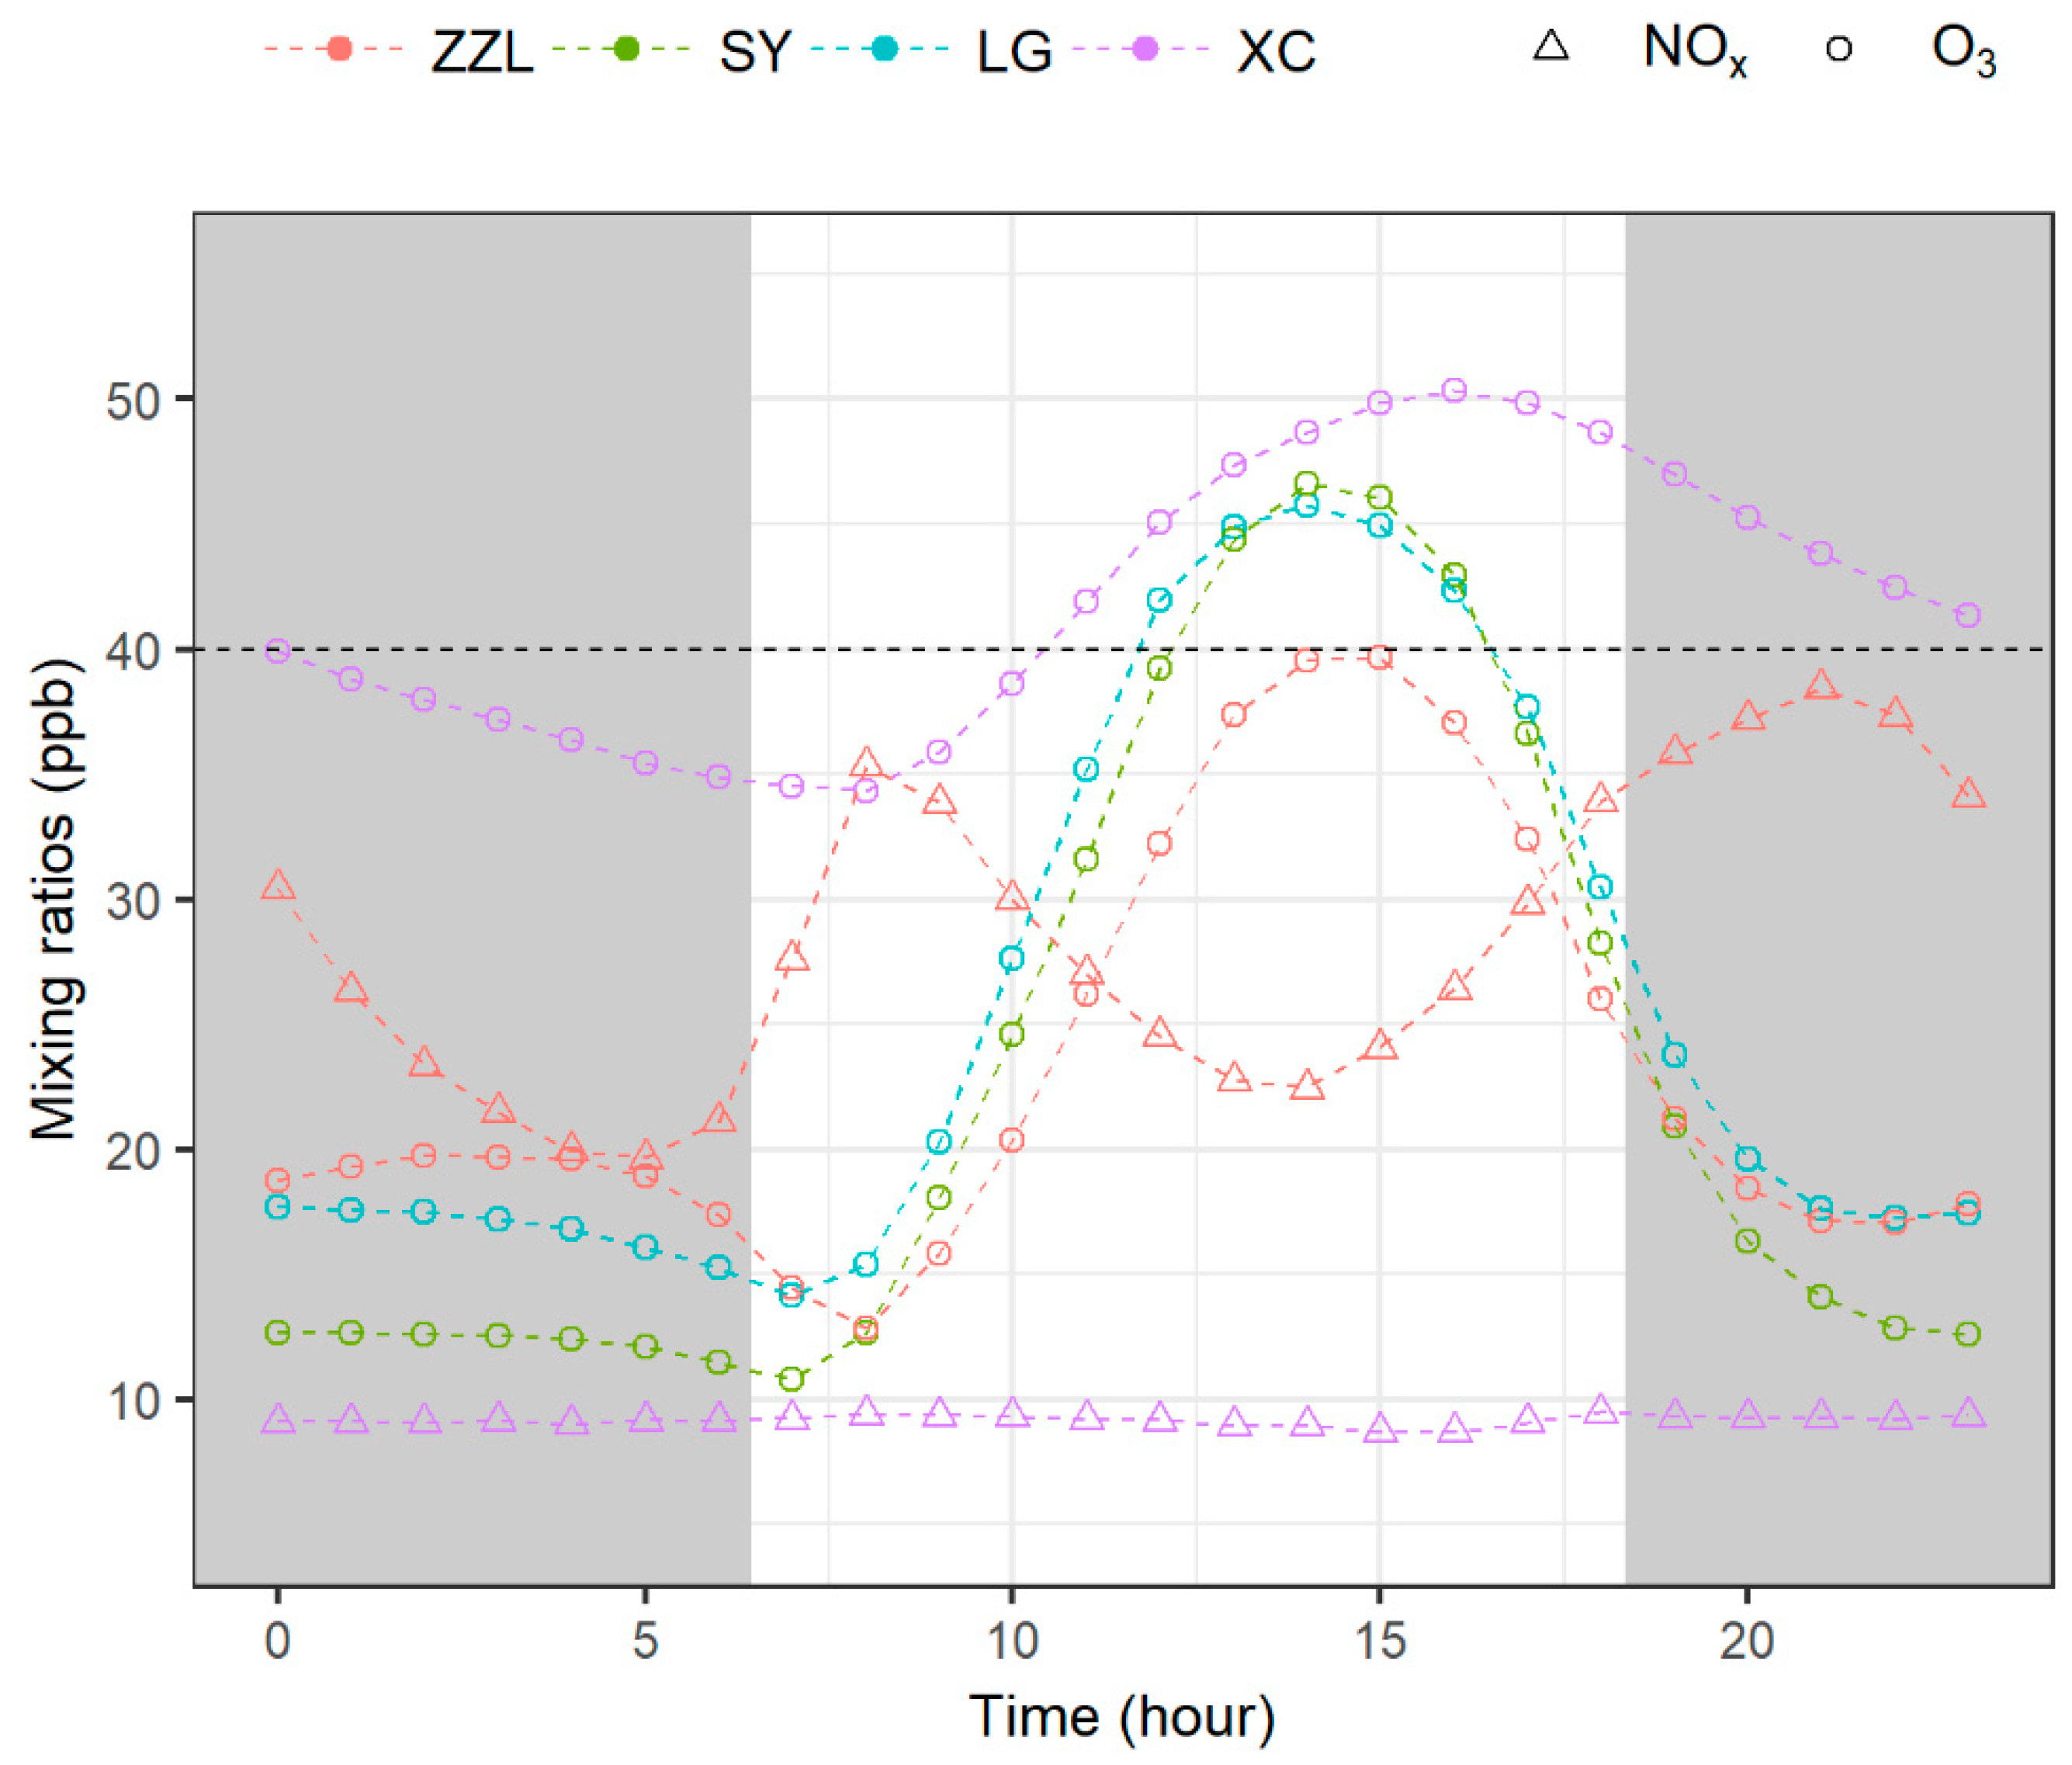
3.2 Weekly and Diurnal Variations of O3 and NOx
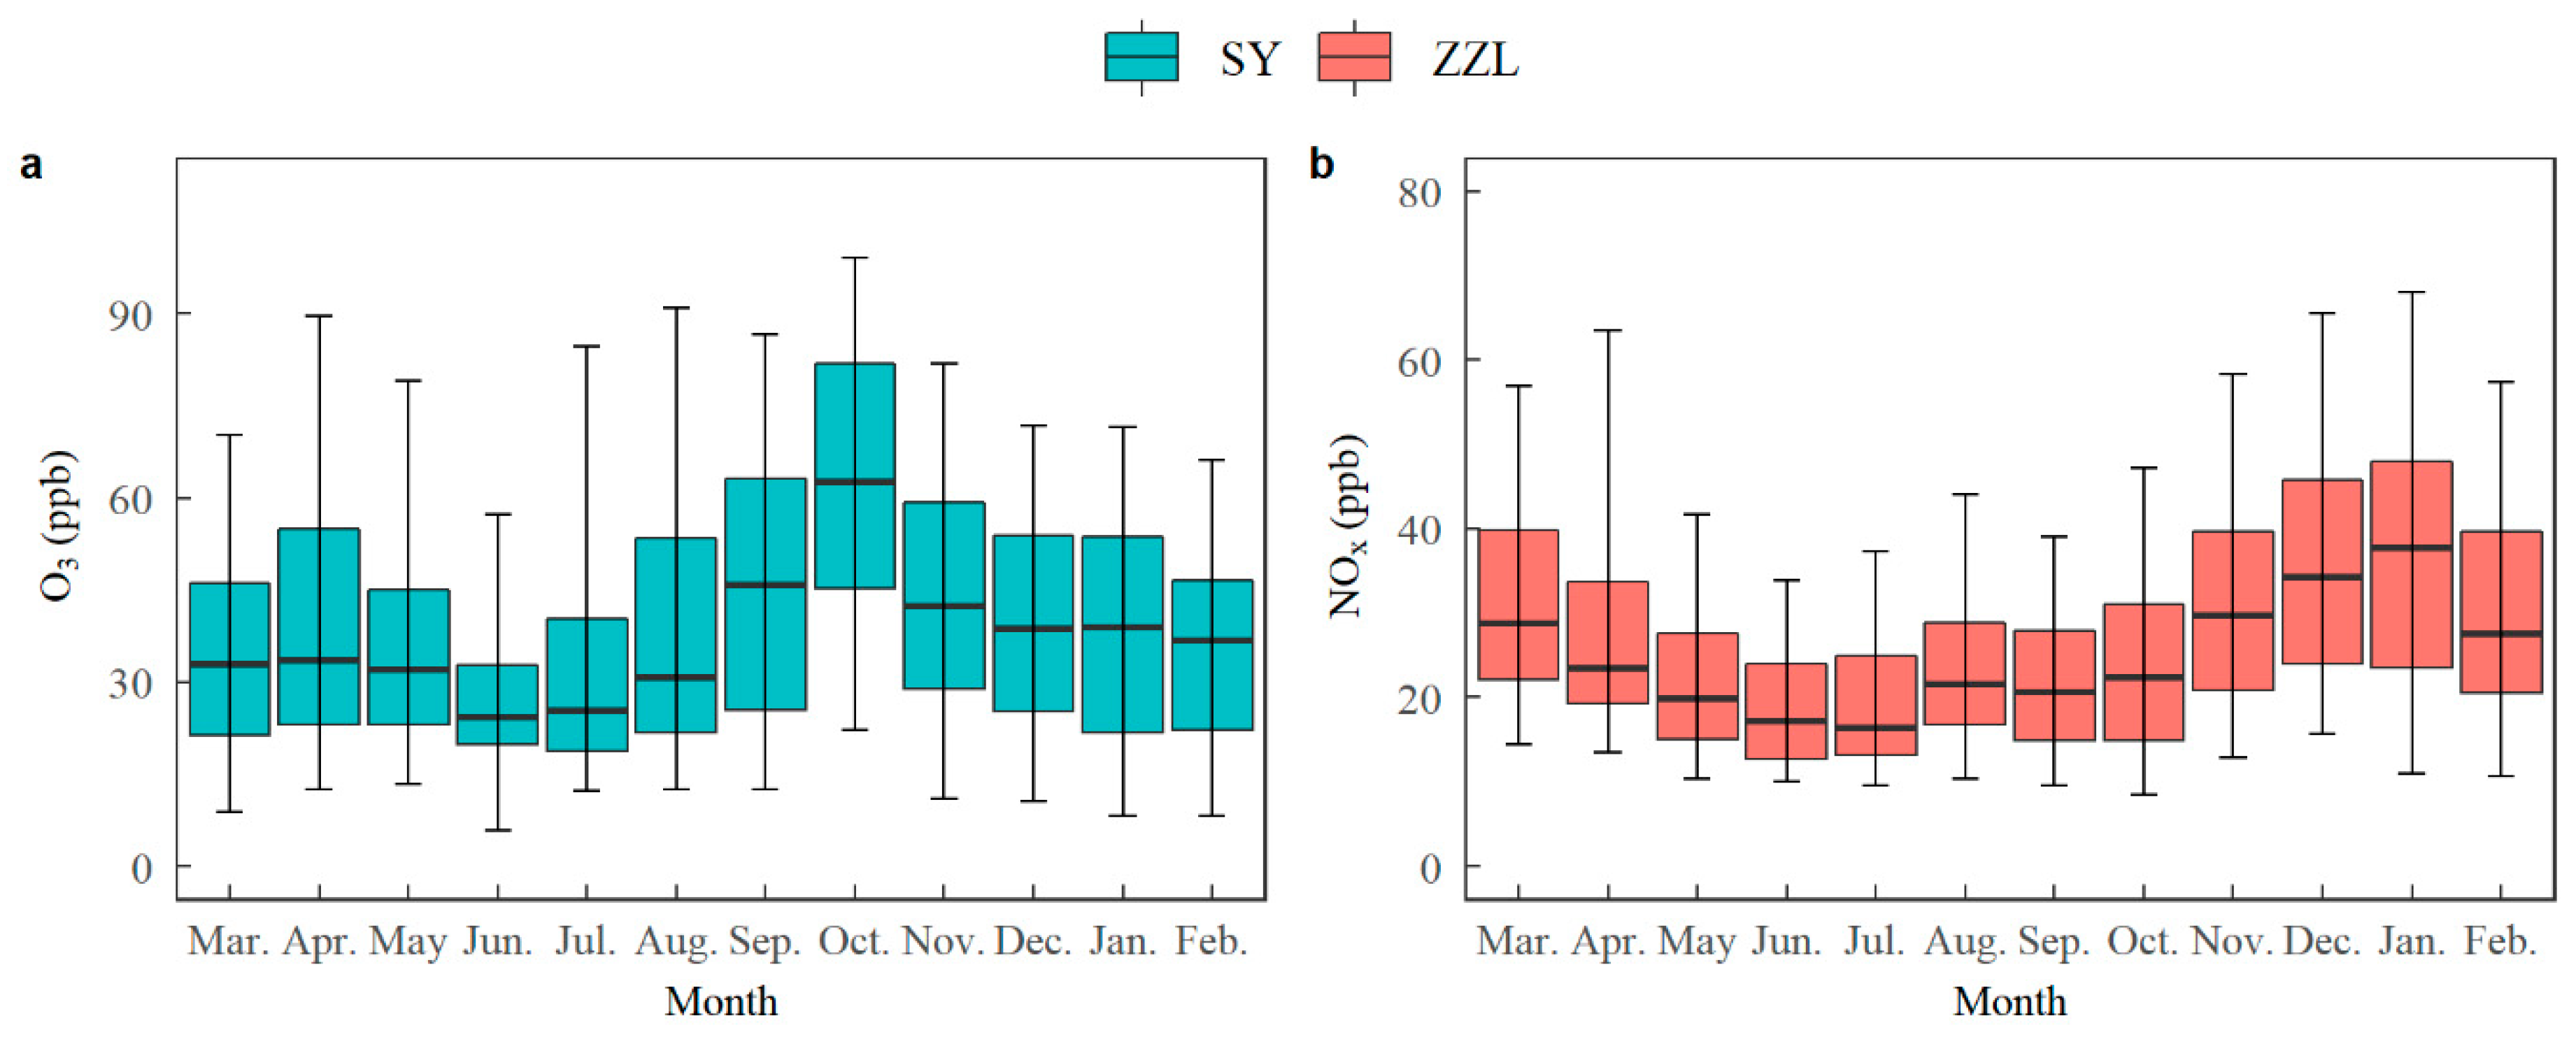
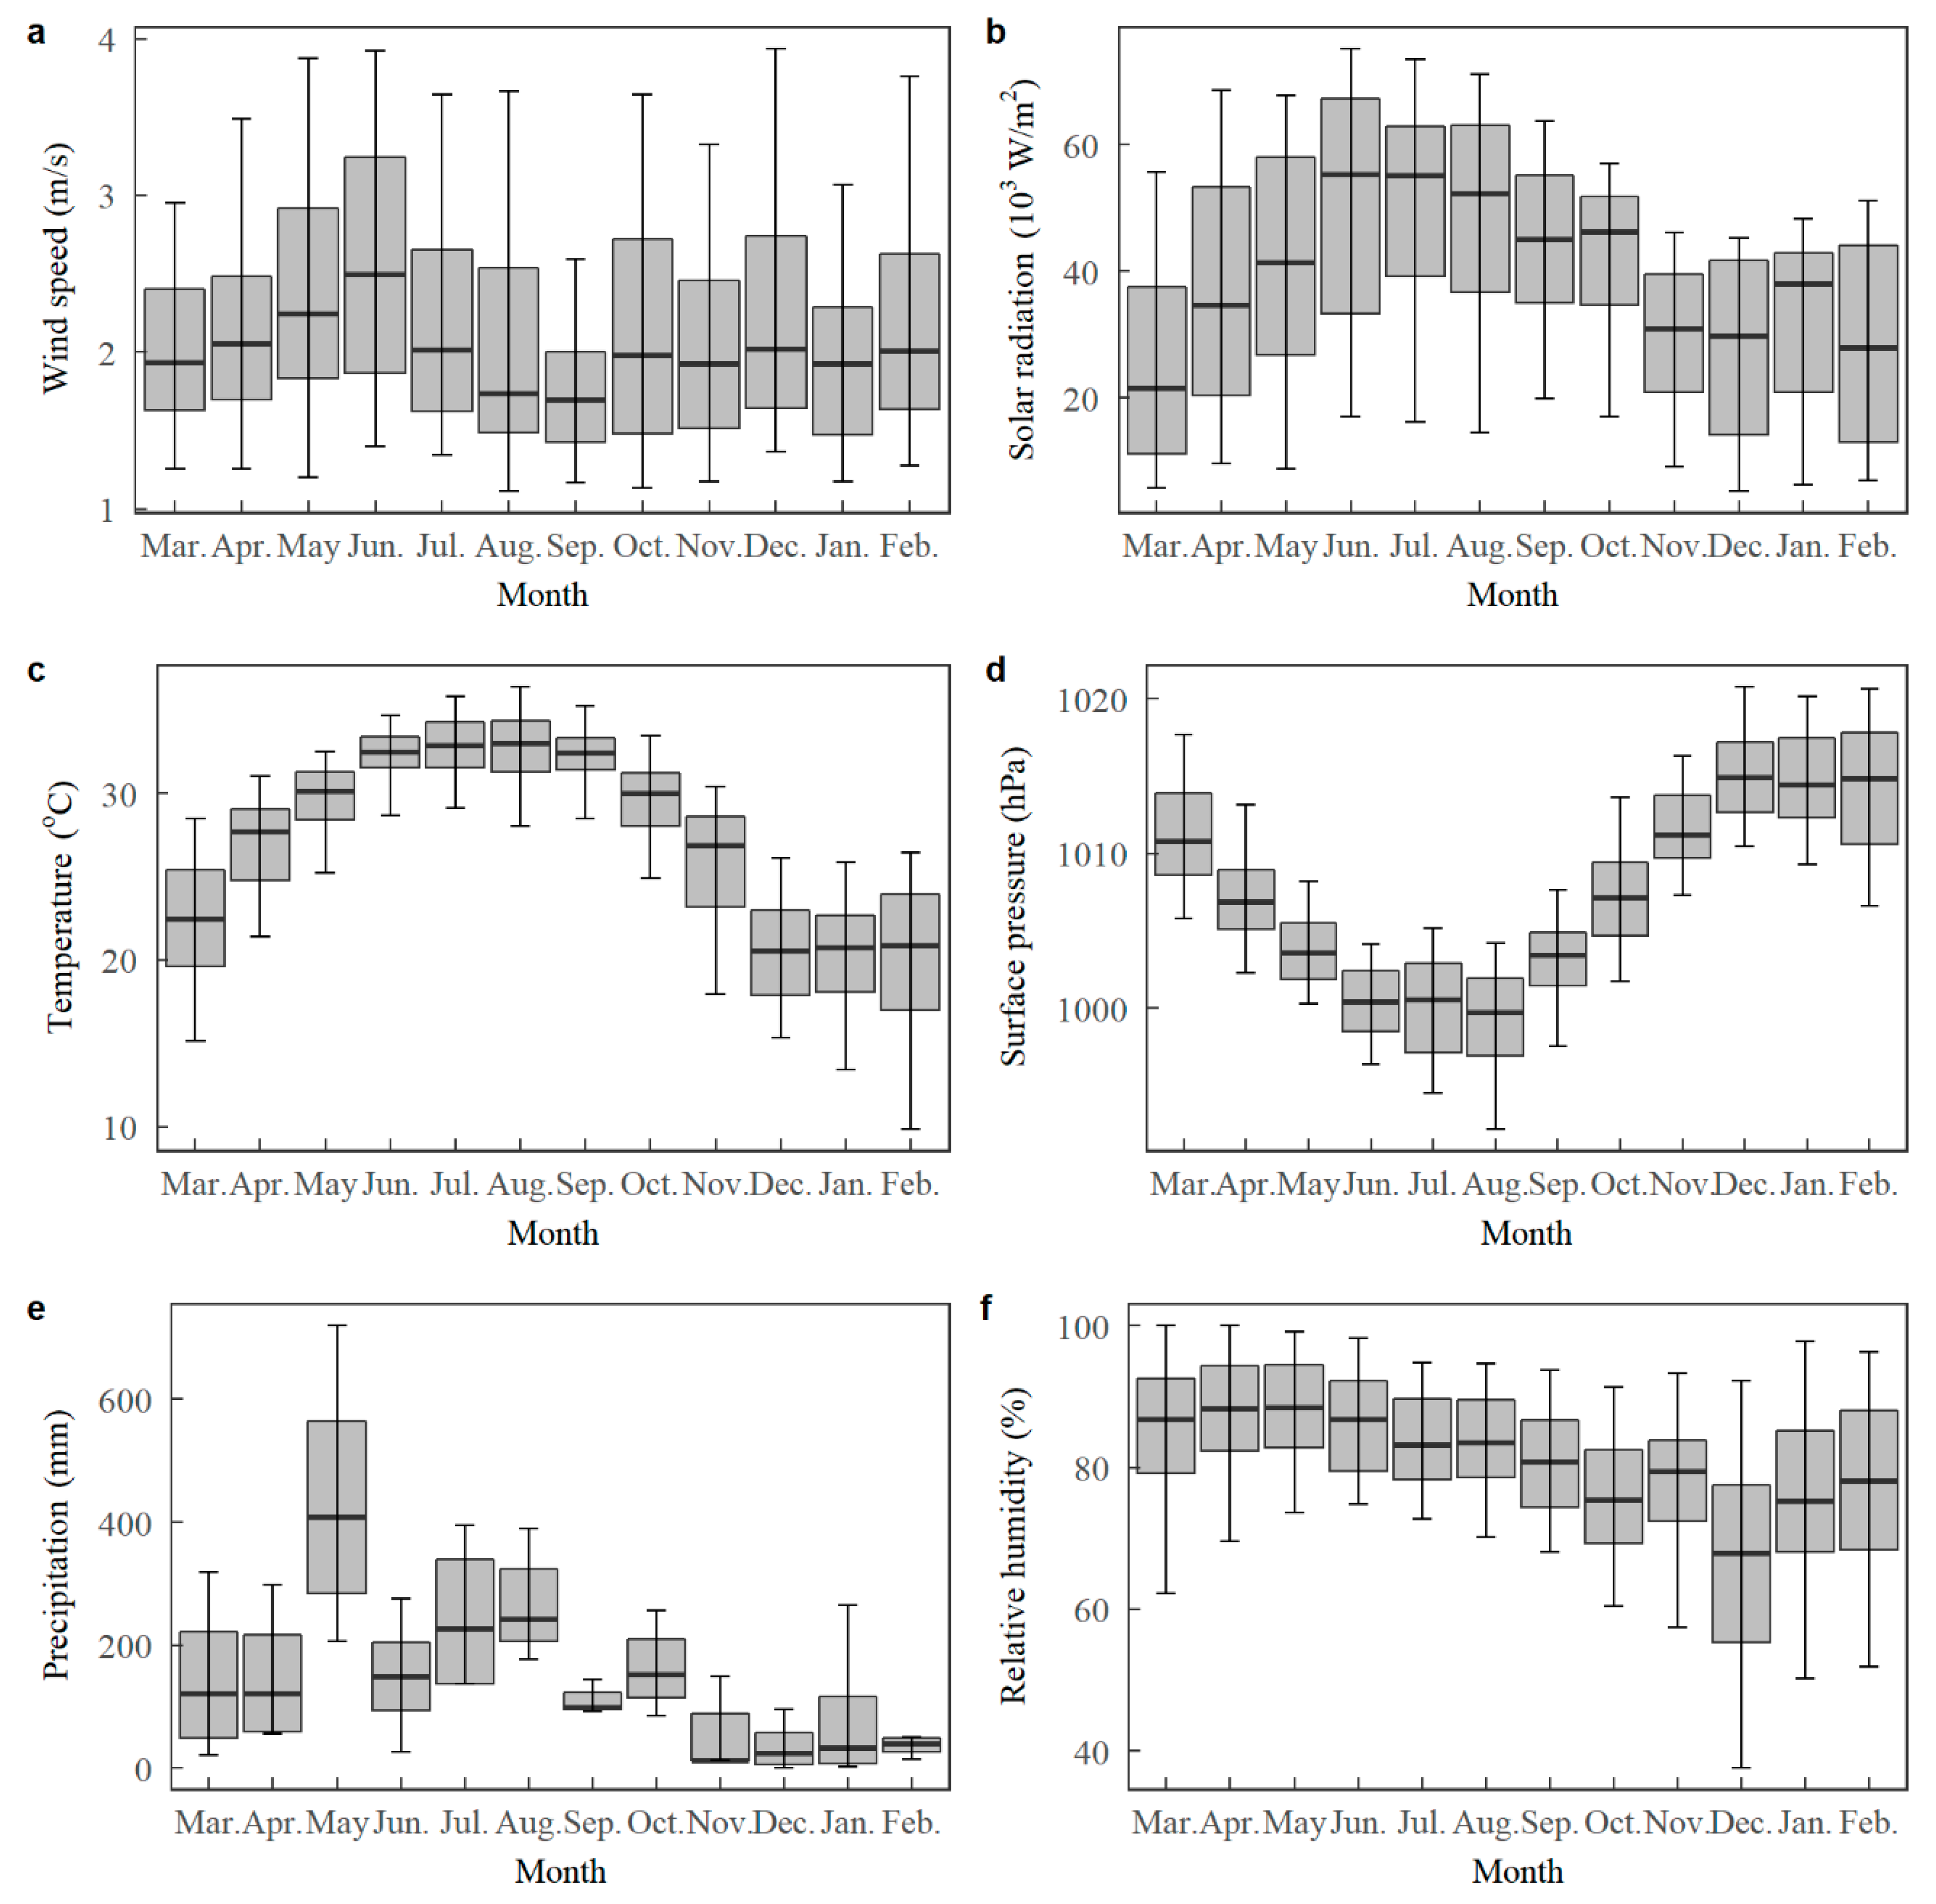
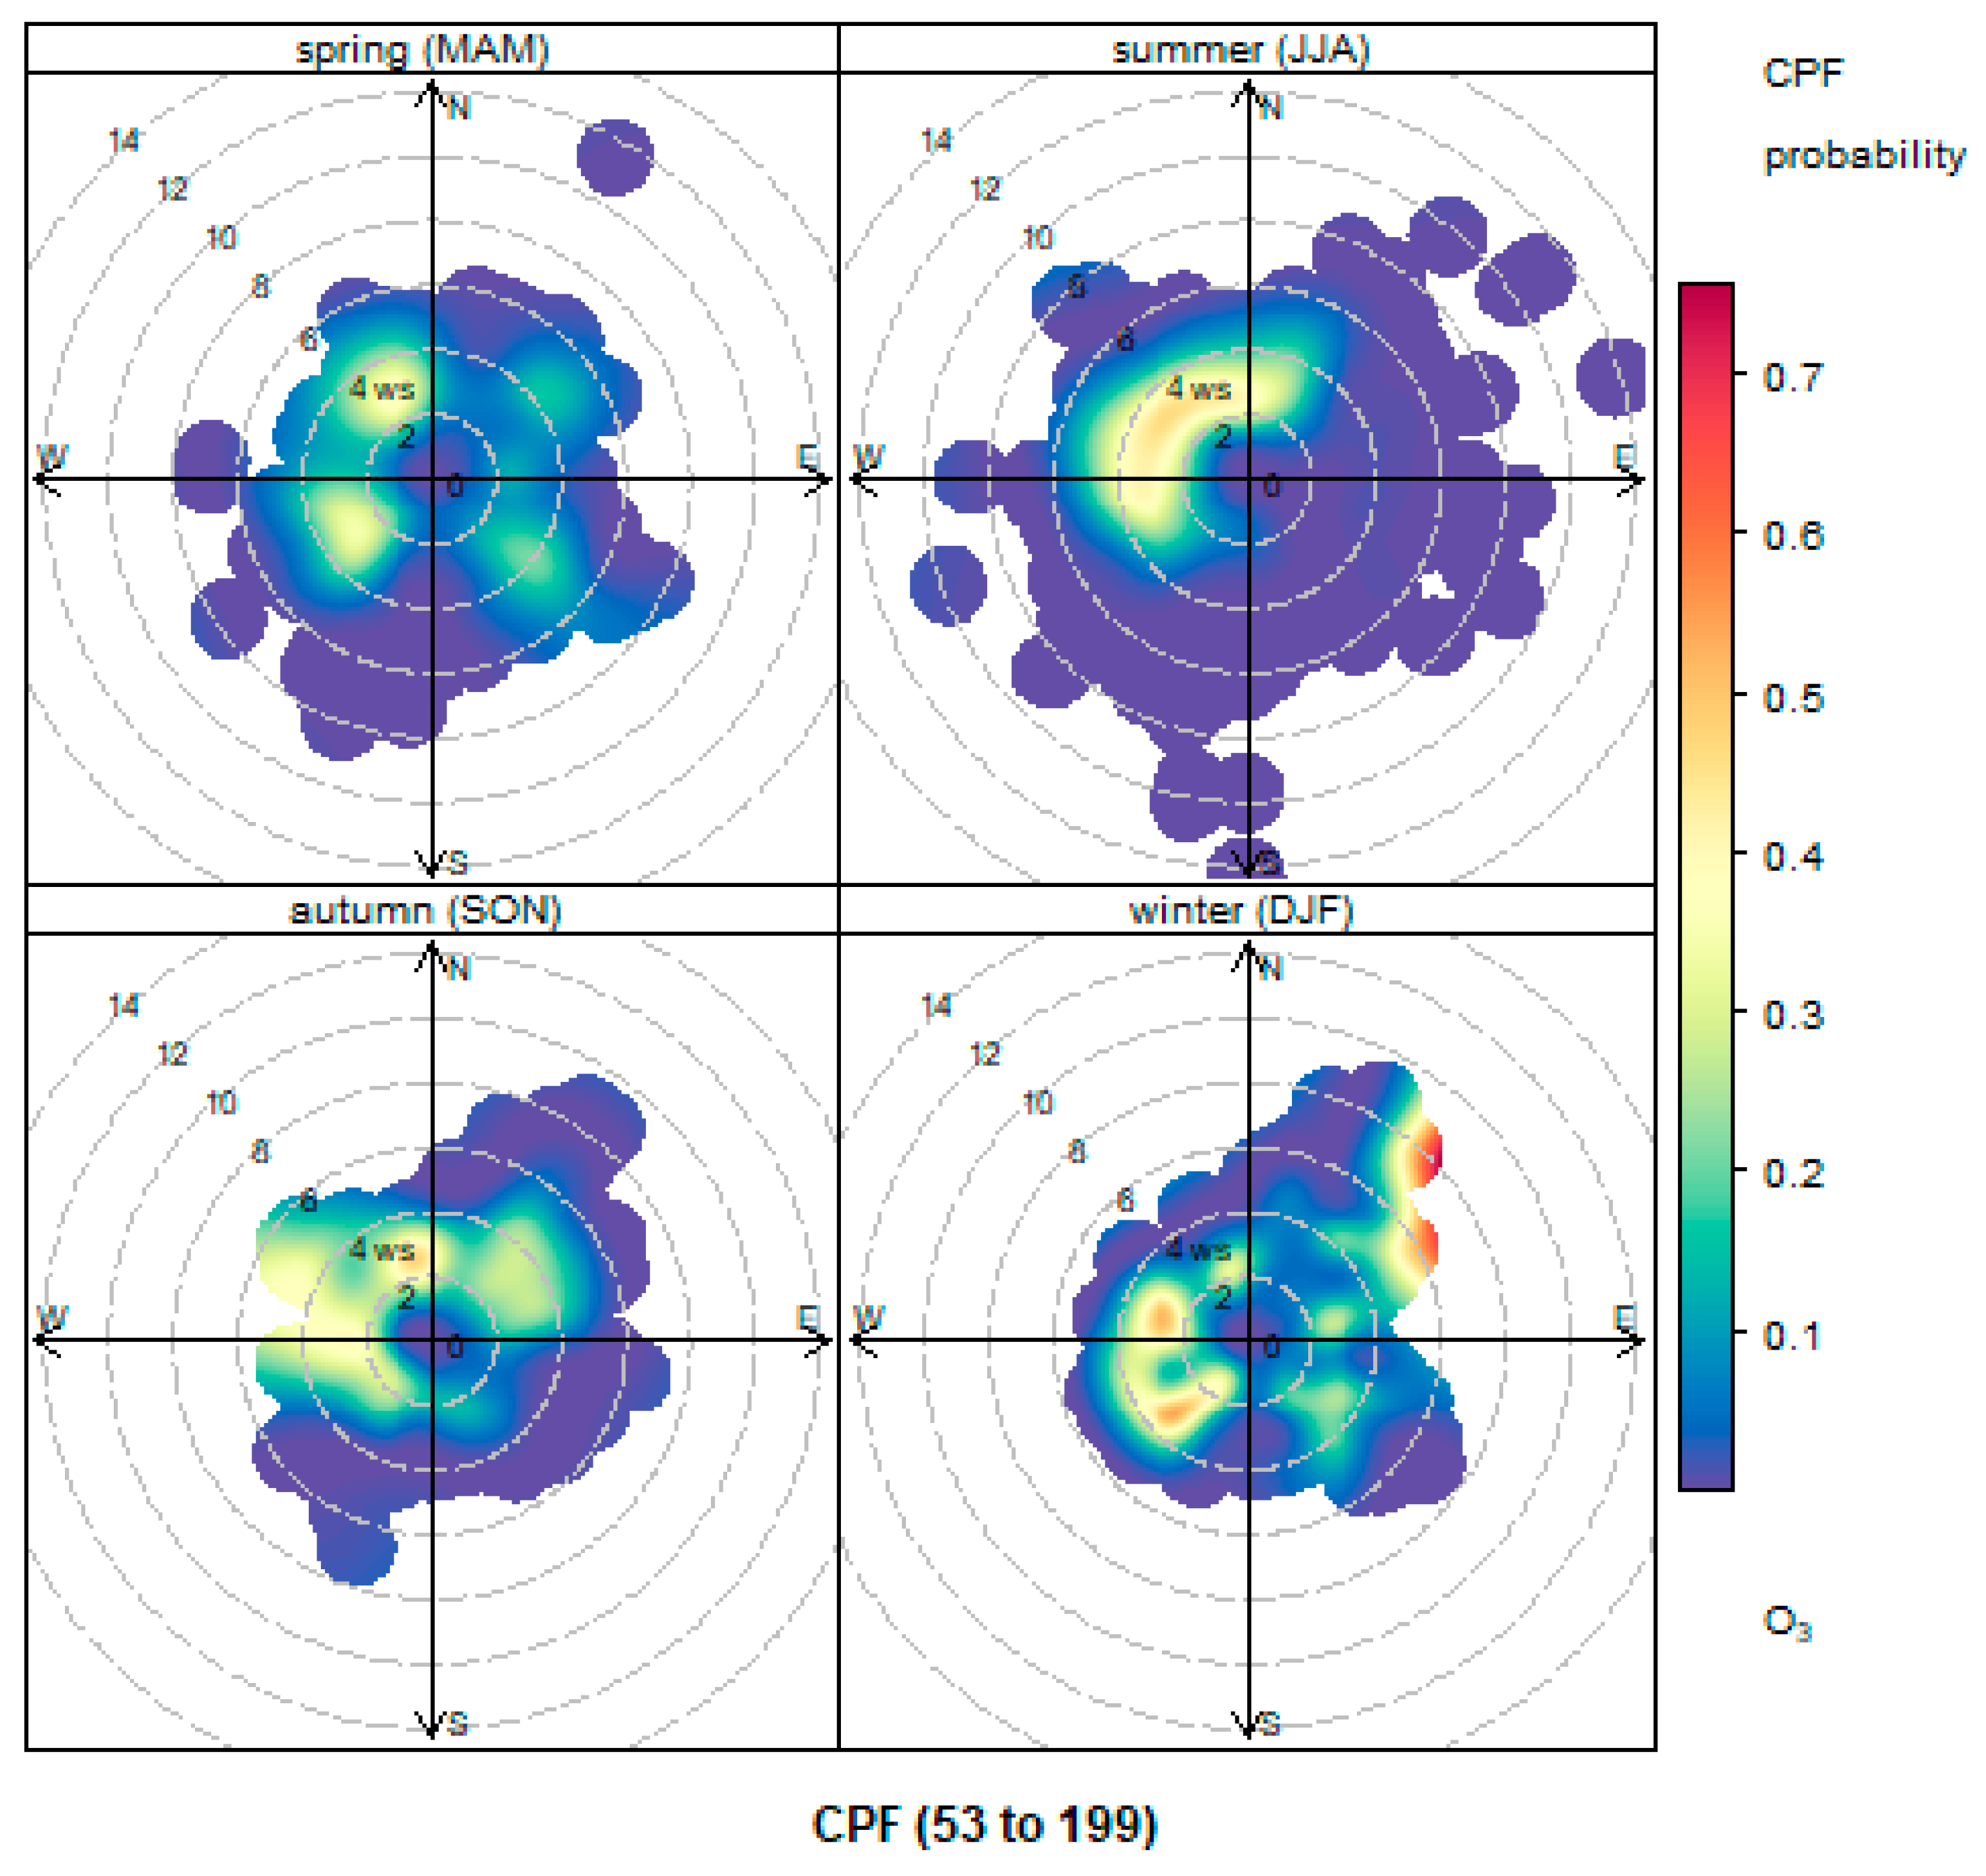
3.3 Monthly Variations and the Impacts of Meteorological factors
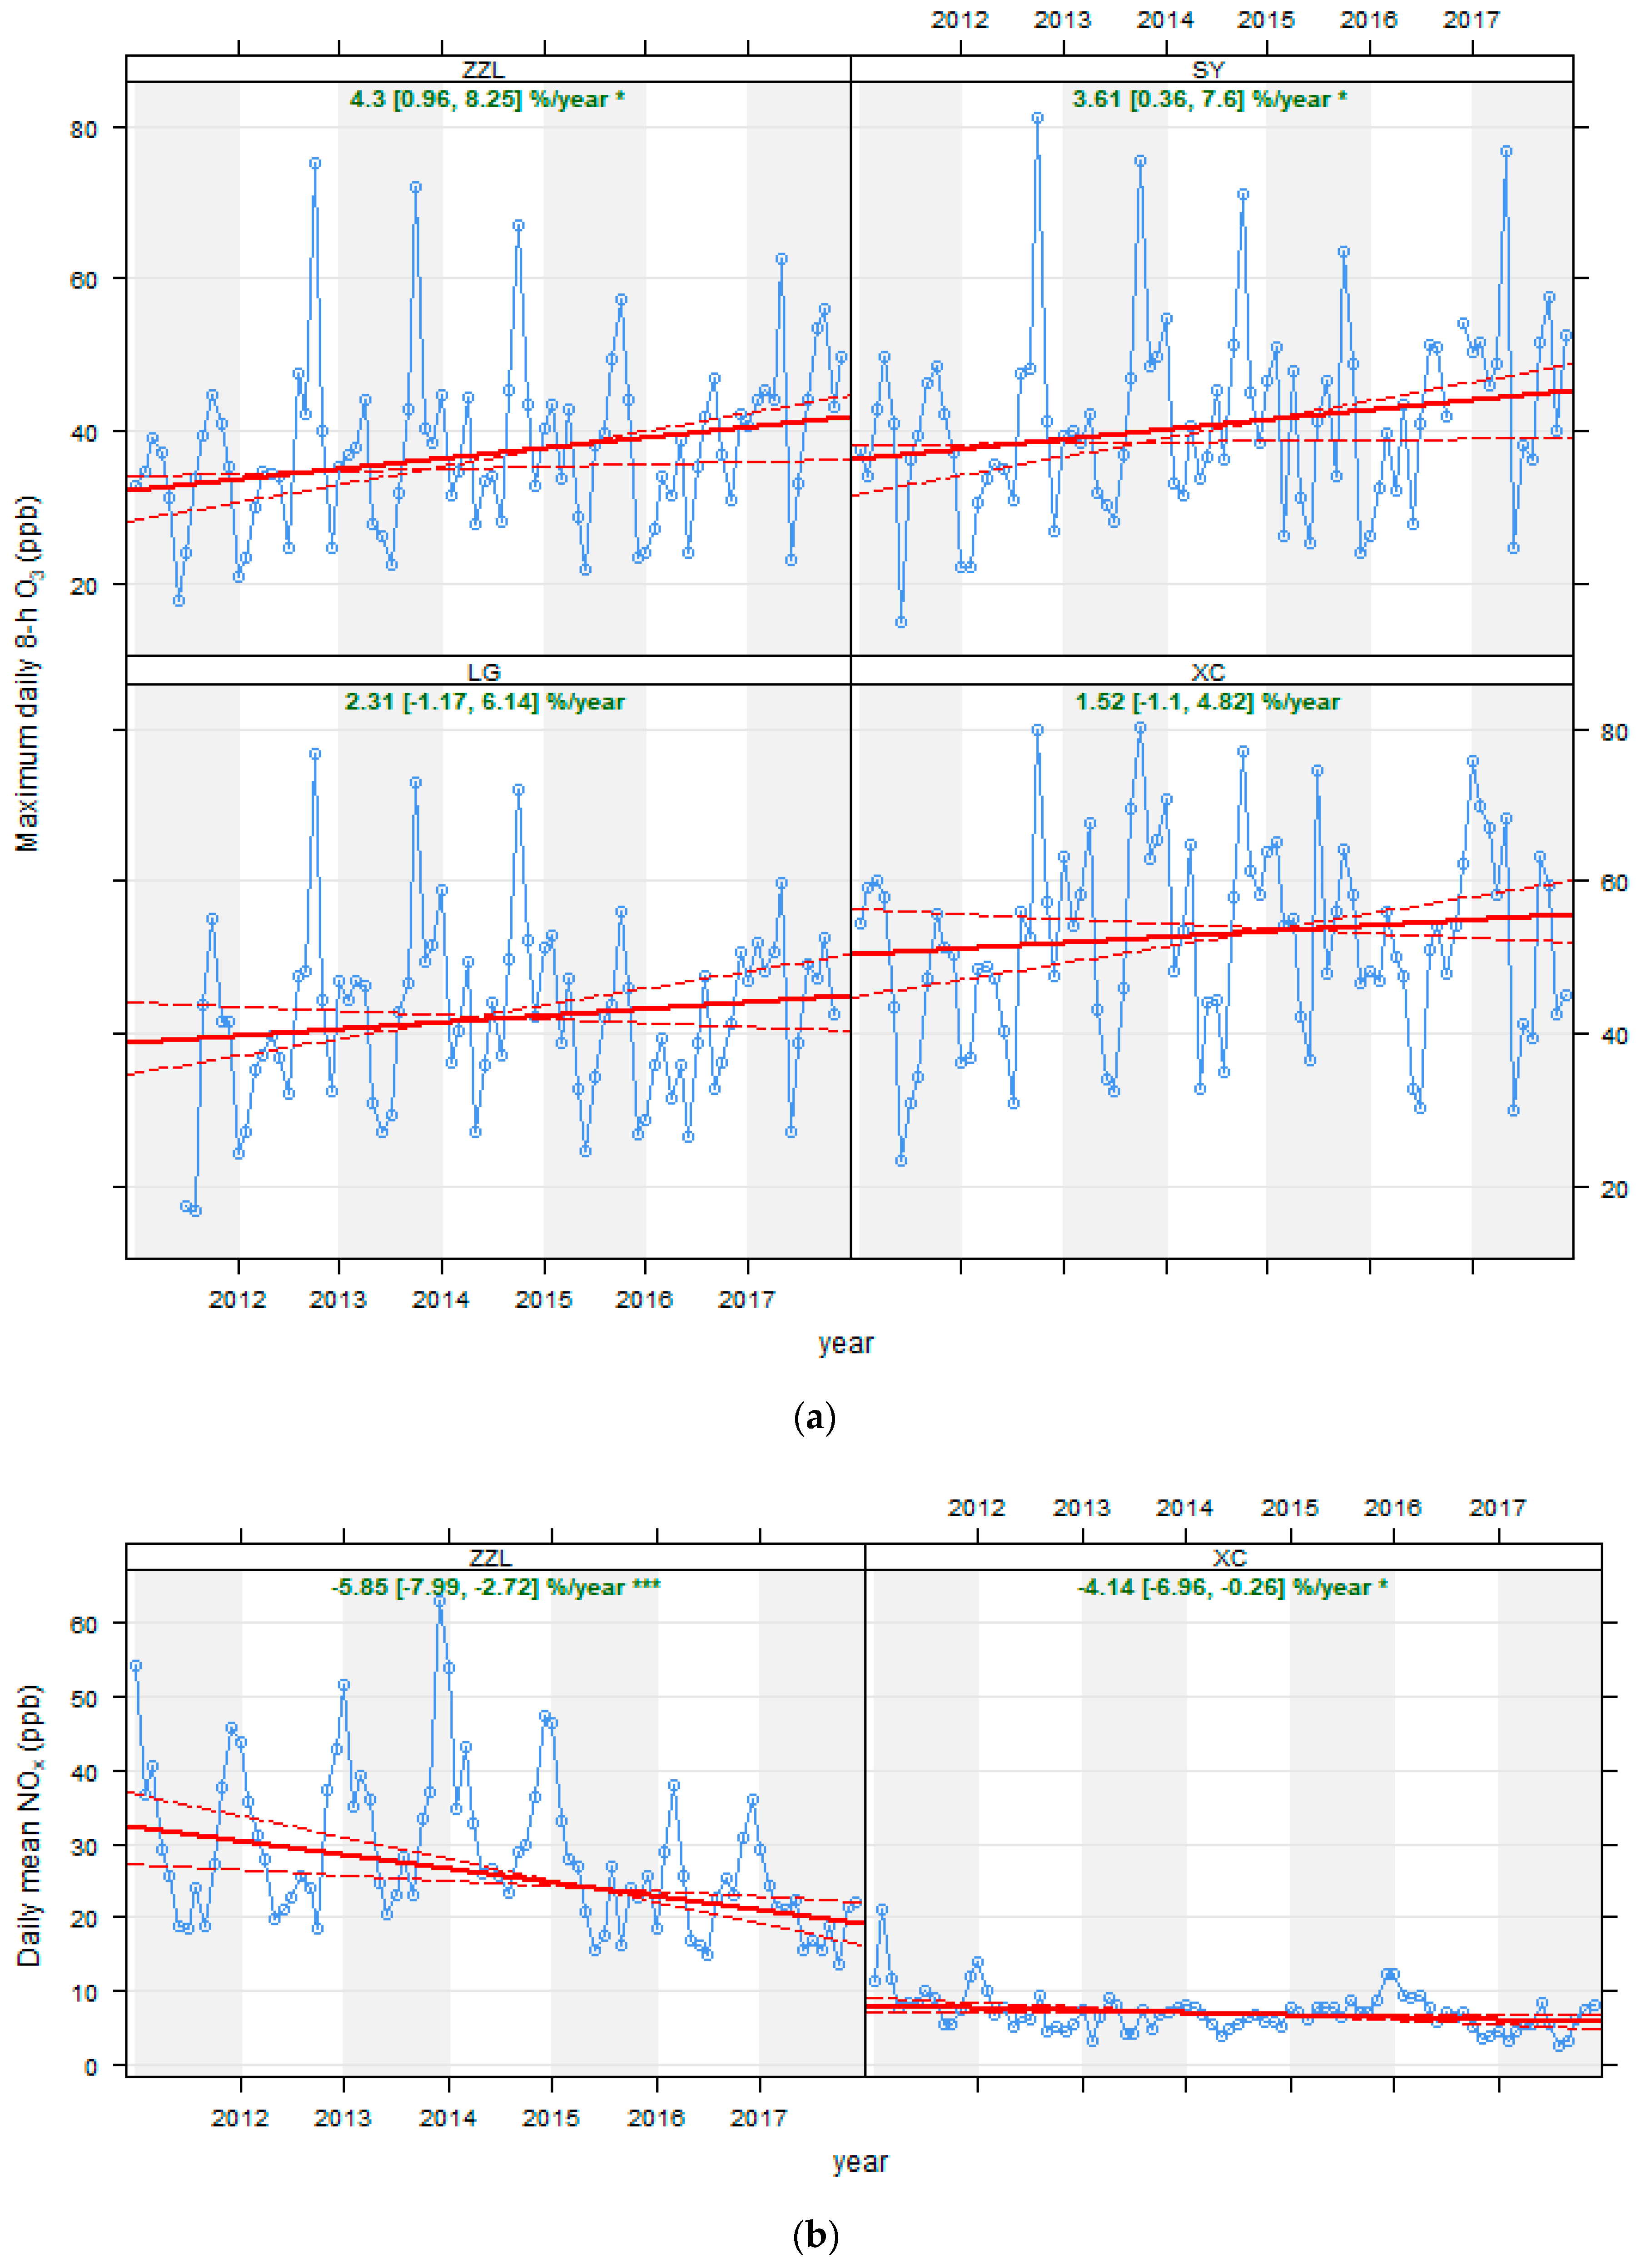
3.4 Trends of O3 and NOx from 2011 to 2017
4. Discussion
5. Conclusions
Author Contributions
Funding
Conflicts of Interest
References
- Chan, C.K.; Yao, X. Air pollution in mega cities in China. Atmos. Environ. 2008, 42, 1–42. [Google Scholar] [CrossRef]
- Cannistraro, G.; Cannistraro, M.; Cannistraro, A.; Galvagno, A. Analysis of the Air Pollution in the Urban Center of Four Sicilian Cities. Int. J. Heat Technol. 2016, 34, 219–225. [Google Scholar] [CrossRef]
- Cannistraro, M.; Ponterio, L.; Cao, J. Experimental study of air pollution in the urban centre of the city of Messina. MMC 2018, 79, 133–139. [Google Scholar] [CrossRef]
- Matus, K.; Nam, K.M.; Selin, N.E.; Lamsal, L.N.; Reilly, J.M.; Paltsev, S. Health damages from air pollution in China. Glob. Environ. Chang. 2012, 22, 55–66. [Google Scholar] [CrossRef]
- Wang, T.; Xue, L.; Brimblecombe, P.; Lam, Y.F.; Li, L.; Zhang, L. Ozone pollution in China: A review of concentrations, meteorological influences, chemical precursors, and effects. Sci. Total Environ. 2017, 575, 1582–1596. [Google Scholar] [CrossRef] [PubMed]
- Paoletti, E. Impact of ozone on Mediterranean forests: A review. Environ. Pollut. 2006, 144, 463–474. [Google Scholar] [CrossRef] [PubMed]
- Feng, Z.; Hu, E.; Wang, X.; Jiang, L.; Liu, X. Ground-level O3 pollution and its impacts on food crops in China: A review. Environ. Pollut. 2015, 199, 42–48. [Google Scholar] [CrossRef] [PubMed]
- Sillman, S. The relation between ozone, NOx and hydrocarbons in urban and polluted rural environments. Atmos. Environ. 1999, 33, 1821–1845. [Google Scholar] [CrossRef]
- Monks, P.S.; Archibald, A.T.; Colette, A.; Cooper, O.; Coyle, M.; Derwent, R.; Fowler, D.; Granier, C.; Law, K.S.; Mills, G.E.; et al. Tropospheric ozone and its precursors from the urban to the global scale from air quality to short-lived climate forcer. Atmos. Chem. Phys. 2015, 15, 8889–8973. [Google Scholar] [CrossRef]
- The State Council of the People’s Republic of China. The 12th Five-Year Plan for National Economic and Social Development of the People’s Republic of China. Available online: http://www.gov.cn/zhengce/content/2016-12/05/content_5143290.htm (accessed on 9 November 2018). (In Chinese)
- Gu, D.; Wang, Y.; Smeltzer, C.; Liu, Z. Reduction in NOx emission trends over China: Regional and seasonal variations. Environ. Sci. Technol. 2013, 47, 12912–12919. [Google Scholar] [CrossRef] [PubMed]
- de Foy, B.; Lu, Z.; Streets, D.G. Satellite NO2 retrievals suggest China has exceeded its NOx reduction goals from the twelfth Five-Year Plan. Sci. Rep. 2016, 6, 35912. [Google Scholar] [CrossRef] [PubMed]
- Liu, F.; Zhang, Q.; Zheng, B.; Tong, D.; Yan, L.; Zheng, Y.; He, K. Recent reduction in NOx emissions over China: Synthesis of satellite observations and emission inventories. Environ. Res. Lett. 2016, 11, 114002. [Google Scholar] [CrossRef]
- Qu, Z.; Henze, D.K.; Capps, S.L.; Wang, Y.; Xu, X.; Wang, J.; Keller, M. Monthly top-down NOx emissions for China (2005–2012): A hybrid inversion method and trend analysis. J. Geophys. Res. Atmos. 2017, 122, 4600–4625. [Google Scholar] [CrossRef]
- Wang, S.; Xing, J.; Zhao, B.; Jang, C.; Hao, J. Effectiveness of national air pollution control policies on the air quality in metropolitan areas of China. J. Environ. Sci. 2014, 26, 13–22. [Google Scholar] [CrossRef]
- Liu, X.; Heilig, G.K.; Chen, J.; Heino, M. Interactions between economic growth and environmental quality in Shenzhen, China’s first special economic zone. Ecol. Econ. 2007, 62, 559–570. [Google Scholar] [CrossRef]
- Wang, L.; Bai, Y.; Zhang, F.; Wang, W.; Liu, X.; Krafft, T. Spatiotemporal Patterns of Ozone and Cardiovascular and Respiratory Disease Mortalities Due to Ozone in Shenzhen. Sustainability 2017, 9, 559. [Google Scholar] [CrossRef]
- Liu, Y.; Chen, S.; Xu, J.; Liu, X.; Wu, Y.; Zhou, L.; Cheng, J.; Ma, H.; Zheng, J.; Lin, D.; et al. The association between air pollution and outpatient and inpatient visits in Shenzhen, China. Int. J. Environ. Res. Public Health 2018, 15, 178. [Google Scholar] [CrossRef] [PubMed]
- Wang, N.; Lyu, X.P.; Deng, X.J.; Guo, H.; Deng, T.; Li, Y.; Wang, S.Q. Assessment of regional air quality resulting from emission control in the Pearl River Delta region, southern China. Sci. Total Environ. 2016, 573, 1554–1565. [Google Scholar] [CrossRef] [PubMed]
- Yang, F.; Goldmann, M.; Lagercrantz, J. Sustainable Mobility the Chinese Way—Opportunities for European Cooperation and Inspiration; Exakta Print: Malmö, Sweden, 2018; pp. 1–107. ISBN 978-91-87379-45-1. [Google Scholar]
- Paoletti, E.; de Marco, A.; Beddows, D.C.S.; Harrison, R.M.; Manning, W.J. Ozone levels in European and USA cities are increasing more than at rural sites, while peak values are decreasing. Environ. Pollut. 2014, 192, 295–299. [Google Scholar] [CrossRef] [PubMed]
- Simon, H.; Reff, A.; Wells, B.; Xing, J.; Frank, N. Ozone trends across the United States over a period of decreasing NOx and VOC emissions. Environ. Sci. Technol. 2015, 49, 186–195. [Google Scholar] [CrossRef] [PubMed]
- Sicard, P.; Serra, R.; Rossello, P. Spatiotemporal trends in ground-level ozone concentrations and metrics in France over the time period 1999–2012. Environ. Res. 2016, 149, 122–144. [Google Scholar] [CrossRef] [PubMed]
- Li, J.; Lu, K.; Lv, W.; Li, J.; Zhong, L.; Ou, Y.; Chen, D.; Huang, X.; Zhang, Y. Fast increasing of surface ozone concentrations in Pearl River Delta characterized by a regional air quality monitoring network during 2006–2011. J. Environ. Sci. 2014, 26, 23–36. [Google Scholar] [CrossRef]
- Li, Y.; Lau, A.K.H.; Fung, J.C.H.; Zheng, J.; Liu, S. Importance of NOx control for peak ozone reduction in the Pearl River Delta region. J. Geophys. Res. Atmos. 2013, 118, 9428–9443. [Google Scholar] [CrossRef]
- Xie, M.; Zhu, K.; Wang, T.; Chen, P.; Han, Y.; Li, S.; Zhuang, B.; Shu, L. Temporal characterization and regional contribution to O3 and NOx at an urban and a suburban site in Nanjing, China. Sci. Total Environ. 2016, 551, 533–545. [Google Scholar] [CrossRef] [PubMed]
- Tong, L.; Zhang, H.; Yu, J.; He, M.; Xu, N.; Zhang, J.; Qian, F.; Feng, J.; Xiao, H. Characteristics of surface ozone and nitrogen oxides at urban, suburban and rural sites in Ningbo, China. Atmos. Res. 2017, 187, 57–68. [Google Scholar] [CrossRef]
- Wang, T.; Wu, Y.Y.; Cheung, T.F.; Lam, K.S. A study of surface ozone and the relation to complex wind flow in Hong Kong. Atmos. Environ. 2001, 35, 3203–3215. [Google Scholar] [CrossRef]
- Zhang, H.; Wang, Y.; Hu, J.; Ying, Q.; Hu, X.-M. Relationships between meteorological parameters and criteria air pollutants in three megacities in China. Environ. Res. 2015, 140, 242–254. [Google Scholar] [CrossRef] [PubMed]
- Chameides, W.L.; Lindsay, R.W.; Richardson, J.; Kiang, C.S. The role of biogenic hydrocarbons in urban photochemical smog: Atlanta as a case study. Science 1988, 241, 1473–1475. [Google Scholar] [CrossRef] [PubMed]
- Kleinman, L.I.; Daum, P.H.; Imre, D.; Lee, Y.N.; Nunnermacker, L.J.; Springston, S.R.; Weinstein-Lloyd, J.; Rudolph, J. Ozone production rate and hydrocarbon reactivity in 5 urban areas: A cause of high ozone concentration in Houston. Geophys. Res. Lett. 2002, 29. [Google Scholar] [CrossRef]
- Jin, X.; Holloway, T. Spatial and temporal variability of ozone sensitivity over China observed from the Ozone Monitoring Instrument. J. Geophys. Res. Atmos. 2015, 120, 7229–7246. [Google Scholar] [CrossRef]
- Shenzhen Statistics Bureau, NBS Survey Office in Shenzhen. Shenzhen Statistical Yearbook—2017. Available online: http://www.sztj.gov.cn/xxgk/zfxxgkml/tjsj/tjnj/ (accessed on 1 November 2018). (In Chinese)
- China Meteorological Administration. China Atmospheric Composition Monitoring Service Specification; China Meteorological Press: Beijing, China, 2012; pp. 1–112. (In Chinese) [Google Scholar]
- Song, Y.; Linderholm, H.; Chen, D.; Walther, A. Trends of the thermal growing season in China, 1951–2007. Int. J. Climatol. 2010, 30, 33–43. [Google Scholar] [CrossRef]
- Spearman, C. The proof and measurement of association between two things. Am. J. Psychol. 1904, 15, 72–101. [Google Scholar] [CrossRef]
- Wilcoxon, F. Individual comparisons by ranking methods. Biom. Bull. 1945, 1, 80–83. [Google Scholar] [CrossRef]
- Carslaw, D.C.; Ropkins, K. Openair—An R package for air quality data analysis. Environ. Model. Softw. 2012, 27–28, 52–61. [Google Scholar] [CrossRef]
- Sen, P.K. Estimates of the regression coefficient based on Kendall’s tau. J. Am. Stat. Assoc. 1968, 63, 1379–1389. [Google Scholar] [CrossRef]
- R Core Team. R: A Language and Environment for Statistical Computing; R Foundation for statistical computing: Vienna, Austria, 2018; Available online: https://www.R-project.org/ (accessed on 29 November 2018).
- Wickham, H. ggplot2: Elegant Graphics for Data Analysis; Springer: New York, NY, USA, 2016. [Google Scholar]
- World Health Organization. Air Quality Guidelines for Particulate Matter, Ozone, Nitrogen Oxide and Sulfur Dioxide—Global Update. 2005. Available online: http://www.who.int/phe/health_topics/outdoorair/outdoorair_aqg/en/ (accessed on 9 November 2018).
- Lal, S.; Naja, M.; Subbaraya, B.H. Seasonal variations in surface ozone and its precursors over an urban site in India. Atmos. Environ. 2000, 34, 2713–2724. [Google Scholar] [CrossRef]
- Lin, C.Y.; Wang, Z.; Chou, C.C.K.; Chang, C.C.; Liu, S.C. A numerical study of an autumn high ozone episode over southwestern Taiwan. Atmos. Environ. 2007, 41, 3684–3701. [Google Scholar] [CrossRef]
- Tsai, D.H.; Wang, J.L.; Wang, C.H.; Chan, C.C. A study of ground-level ozone pollution, ozone precursors and subtropical meteorological conditions in central Taiwan. J. Environ. Monit. 2008, 10, 109–118. [Google Scholar] [CrossRef] [PubMed]
- Zheng, J.; Zhong, L.; Wang, T.; Louie, P.K.K.; Li, Z. Ground-level ozone in the Pearl River Delta region: Analysis of data from a recently established regional air quality monitoring network. Atmos. Environ. 2010, 44, 814–823. [Google Scholar] [CrossRef]
- Wang, T.; Guo, H.; Blake, D.R.; Kwok, Y.H.; Simpson, I.J.; Li, Y.S. Measurements of trace gases in the inflow of South China Sea background air and outflow of regional pollution at Tai O, southern China. J. Atmos. Chem. 2005, 52, 295–317. [Google Scholar] [CrossRef]
- Shan, W.; Yin, Y.; Zhang, J.; Ji, X.; Deng, X. Surface ozone and meteorological condition in a single year at an urban site in central–eastern China. Environ. Monit. Assess. 2009, 151, 127–141. [Google Scholar] [CrossRef] [PubMed]
- Tao, J.; Shen, Z.; Zhu, C.; Yue, J.; Cao, J.; Liu, S.; Zhu, L.; Zhang, R. Seasonal variations and chemical characteristics of sub-micrometer particles (PM1) in Guangzhou, China. Sci. Total Environ. 2012, 118, 222–231. [Google Scholar] [CrossRef]
- Blanchard, C.L.; Tanenbaum, S.J. Differences between weekday and weekend air pollutant levels in southern California. J. Air Waste Manag. Assoc. 2003, 53, 816–828. [Google Scholar] [CrossRef] [PubMed]
- Liu, L.; Hou, A.; Biderman, A.; Ratti, C.; Chen, J. Understanding individual and collective mobility patterns from smart card records: A case study in Shenzhen. In Proceedings of the 12th International IEEE Conference on Intelligent Transportation Systems, St Louis, MO, USA, 4–7 October 2009. [Google Scholar]
- Yu, X.; Yuan, Z.; Fung, J.C.H.; Xue, J.; Li, Y.; Zheng, J.; Lau, A.K.H. Ozone changes in response to the heavy-duty diesel truck control in the Pearl River Delta. Atmos. Environ. 2014, 88, 269–274. [Google Scholar] [CrossRef]
- Zhang, R.Y.; Lei, W.F.; Tie, X.X.; Hess, P. Industrial emissions cause extreme urban ozone diurnal variability. Proc. Natl. Acad. Sci. USA 2004, 101, 6346–6350. [Google Scholar] [CrossRef] [PubMed]
- Zacharias, J.; Ma, B. Industrial zone development policy related to real estate and transport outcomes in Shenzhen, China. Land Use Policy 2015, 47, 382–393. [Google Scholar] [CrossRef]
- Huang, D.; Li, Q.; Li, G.; Wang, X.; Sun, L. Tougher Targets for China’s Clean Air Cities? Implications from Air Quality Assessment in Shenzhen. Preprints 2018, 2018100101. [Google Scholar] [CrossRef]
- Wang, H.; Lyu, X.; Guo, H.; Wang, Y.; Zou, S.; Ling, Z.; Wang, X.; Jiang, F.; Zeren, Y.; Pan, W.; et al. Ozone pollution around a coastal region of South China Sea: Interaction between marine and continental air. Atmos. Chem. Phys. 2018, 18, 4277–4295. [Google Scholar] [CrossRef]
- Wang, X.; Zhang, Y.; Hu, Y.; Zhou, W.; Zeng, L.; Hu, M.; Cohan, D.; Russell, A. Decoupled direct sensitivity analysis of regional ozone pollution over the Pearl River Delta during the PRIDE-PRD2004 campaign. Atmos. Environ. 2011, 45, 4941–4949. [Google Scholar] [CrossRef]
- The State Council of the People’s Republic of China. The 13th Five-Year Plan for National Economic and Social Development of the People’s Republic of China. Available online: http://www.gov.cn/xinwen/2016-03/17/content_5054992.htm (accessed on 9 November 2018). (In Chinese)


| Year | ZZL/O3 | SY/O3 | LG/O3 | XC/O3 | ZZL/NOx | XC/NOx |
|---|---|---|---|---|---|---|
| 2011 | 94 | 89 | 29 | 90 | 95 | 86 |
| 2012 | 100 | 98 | 97 | 99 | 100 | 99 |
| 2013 | 98 | 96 | 96 | 96 | 98 | 96 |
| 2014 | 99 | 98 | 98 | 97 | 99 | 97 |
| 2015 | 99 | 82 | 89 | 89 | 98 | 89 |
| 2016 | 87 | 70 | 89 | 90 | 87 | 90 |
| 2017 | 94 | 92 | 82 | 88 | 94 | 89 |
| Index | U (ZZL) | S (SY) | S (LG) | R (XC) |
|---|---|---|---|---|
| Annual mean O3 (ppb) | 23.3 a | 22.8 a | 26.4 b | 43.8 c |
| Daily maximum 8-h average O3 (ppb) | 33.2 a | 35.7 b | 39.2 c | 51.0 d |
| Daily maximum 1-h O3 (ppb) | 42.9 a | 47.3 b | 49.1 b | 56.7 c |
| AOT40 (ppm∙h) | 11.6 a | 15.5 b | 13.7 a | 19.4 b |
| Annual mean NOx (ppb) | 29.1 a | - | - | 7.1 b |
| Grade | Type | Limit (μg/m3) | U (ZZL) | S (SY) | S (LG) | R (XC) |
|---|---|---|---|---|---|---|
| Class 1 | 1-h | 160 | 16% | 23% | 20% | 24% |
| 8-h | 100 # | 28% | 34% | 38% | 59% | |
| Class 2 | 1-h | 200 | 9% | 13% | 8% | 8% |
| 8-h | 160 | 7% | 10% | 9% | 16% |
| Season | SR | WS | T | Prep | RH | SP |
|---|---|---|---|---|---|---|
| Spring | 0.35 *** | −0.04 | 0.11 * | −0.25 *** | −0.51 *** | 0.13 * |
| Summer | 0.32 *** | −0.10 | 0.59 *** | −0.42 *** | −0.48 *** | −0.42 *** |
| Autumn | 0.50 *** | −0.12 | 0.20 ** | −0.38 *** | −0.55 *** | 0.13 * |
| Winter | 0.70 *** | −0.28 *** | 0.46 *** | −0.58 *** | −0.59 *** | 0.18 ** |
| Overall | 0.34 *** | −0.17*** | 0.10 *** | −0.42 *** | −0.57 *** | 0.12 *** |
| Sites/Variable | ZZL/O3 | SY/O3 | LG/O3 | XC/O3 | ZZL/NOx | XC/NOx |
|---|---|---|---|---|---|---|
| Spring | 3.55 | 2.66 | 4.9 | 2.42 | −5.36 * | −3.51 |
| Summer | 6.09 | 1.77 | 6.43 | 4.32 | −3.15 | −4.77 |
| Autumn | 1.36 | 0.14 | −1.94 | −1.13 | −3.89 | 2.45 |
| Winter | 6.02 + | 8.89 + | 6.03 | 3.98 | −7.87 *** | −9.45 + |
| Season | ZZL | SY | LG | XC |
|---|---|---|---|---|
| Spring | 1.47 (−2.13, 8.57) | 0.93 (−3.91, 11.68) | 1.65 (−3.18, 9.33) | 0.52 (−2.49, 5.11) |
| Summer | 3.22 (−4.69, 14.23) | 0.99 (−4.37, 13.9) | 5.86 (−3.79, 24.35) | 3.73 (−4.05, 11.49) |
| Autumn | 0.59 (−5.76, 4.66) | −0.75 (−6.44, 2.49) | −1.8 (−6.65, 1.47) | −1.46 (−7.54, 2.87) |
| Winter | 3.65 (−4.27, 11.1) | 4.95 (−3.22, 15.65) | −0.47 (−8.58, 10.29) | 2.75 (−2.52, 10.19) |
| Total | 2.5 (−0.46, 6.12) | 1.49 (−1.18, 4.62) | 0.05 (−3.17, 3.45) | 0.95 (−1.24, 3.91) |
© 2018 by the authors. Licensee MDPI, Basel, Switzerland. This article is an open access article distributed under the terms and conditions of the Creative Commons Attribution (CC BY) license (http://creativecommons.org/licenses/by/4.0/).
Share and Cite
Huang, D.; Li, Q.; Wang, X.; Li, G.; Sun, L.; He, B.; Zhang, L.; Zhang, C. Characteristics and Trends of Ambient Ozone and Nitrogen Oxides at Urban, Suburban, and Rural Sites from 2011 to 2017 in Shenzhen, China. Sustainability 2018, 10, 4530. https://doi.org/10.3390/su10124530
Huang D, Li Q, Wang X, Li G, Sun L, He B, Zhang L, Zhang C. Characteristics and Trends of Ambient Ozone and Nitrogen Oxides at Urban, Suburban, and Rural Sites from 2011 to 2017 in Shenzhen, China. Sustainability. 2018; 10(12):4530. https://doi.org/10.3390/su10124530
Chicago/Turabian StyleHuang, Dian, Qinglan Li, Xiaoxue Wang, Guangxin Li, Liqun Sun, Bing He, Li Zhang, and Chunsheng Zhang. 2018. "Characteristics and Trends of Ambient Ozone and Nitrogen Oxides at Urban, Suburban, and Rural Sites from 2011 to 2017 in Shenzhen, China" Sustainability 10, no. 12: 4530. https://doi.org/10.3390/su10124530
APA StyleHuang, D., Li, Q., Wang, X., Li, G., Sun, L., He, B., Zhang, L., & Zhang, C. (2018). Characteristics and Trends of Ambient Ozone and Nitrogen Oxides at Urban, Suburban, and Rural Sites from 2011 to 2017 in Shenzhen, China. Sustainability, 10(12), 4530. https://doi.org/10.3390/su10124530