Article

Redesigning In-Flight Service with Service Blueprint Based on Text Analysis

1
School of Business, Korea Aerospace University, Hwajeon-dong, Goyang-si 10540, Korea
2
Department of Industrial Engineering, Hongik University, 94 Wausan-ro, Seoul 04066, Korea
*
Author to whom correspondence should be addressed.
Sustainability 2018, 10(12), 4492; https://doi.org/10.3390/su10124492
Submission received: 30 October 2018 / Revised: 25 November 2018 / Accepted: 26 November 2018 / Published: 29 November 2018

Abstract

:
Airline services should be passenger-focused to be sustainable. In this study, we redesign an in-flight service process using a service blueprint while incorporating direct customer perceptions of service experiences. To incorporate these, we apply topic modeling to 64,706 passenger-written online reviews of airline services. Passenger experiences of in-flight services are the sum of experiences from service encounters in all the subsequent steps and we assume that their direct perceptions of their experiences are faithfully contained in the online reviews. Topics extracted from the reviews can be regarded as service encounters based strongly on passenger experiences. Then, the service encounters are reorganized within the framework of a service blueprint. The results show that the complexity, a number of service steps, decreases by 38% compared to the benchmark service blueprint. However, the divergence, a latitude of service steps, should increase for a couple of service encounters. Moreover, we quantitatively analyze the divergence using the probability of word frequency statistically distributed across topics. The in-flight service using the proposed design could be sustainable with respect to customer-focused service while considering direct customer experiences in real-time.

1. Introduction

Through the liberalization of air transport service agreements, the airline industry has grown with the arrival of new entries, which comprise various types of air transport service providers, including low-cost carriers [1]. Industry growth and increased competition have expedited the diversification of customers’ needs by expanding multiple layers of air traffic demands, and service customization, which makes it possible to address each customer’s needs, is a common strategy for achieving competitive advantages [2,3,4]. It has been repeatedly emphasized that airlines could deliver customized service processes which optimize diversified demands for customers in the airline industry [5,6,7,8].
The airplane cabin is a space where a service is simultaneously created and consumed [9]. Since passengers must remain in the space for most of the flight, while being exposed to the service, the cabin is very important for service experience perception [10]. However, it is not easy to hone service customization among airlines for the following reasons. Duopoly manufacturers mostly provide aircrafts to airlines, and there is no significant difference in terms of technological performance and characteristics [11]. Customization in relation to intangible factors is also not flexible as airlines must follow national and international air transport regulations, the chief aim of which is safety. Customization is only permitted when the safe operations and conditions of an aircraft are guaranteed. Therefore, airlines try to focus on in-flight service for customization as much as possible. Customer satisfaction through customized service could be the minimum requirement for providing a sustainable service [12].
This study proposes a redesign method for the in-flight service blueprint (SB) based on customer perceptions. In order to identify exact customer perceptions of in-flight service experiences, we use online reviews for airline services as a dataset [13]. The data is self-generated by passengers and this is regarded as one of the most direct and immediate forms of customer service experience response [14,15,16]. As various types of mobile web platforms appear rapidly, studies using online reviews that contain real-time perceptions of customer experiences are quite frequent in business and management research [17,18,19,20,21,22,23,24]. The data is described as naturally unrefined and voluntary rather than designed or intended, the characteristics of survey data [14]. We make full use of the characteristics of online reviews while redesigning service processes from the customer’s perspective.
Specifically, we apply latent Dirichlet allocation (LDA) topic modeling [25,26], a text analysis technique, to a vast amount of passenger-written online reviews. LDA modeling has been extensively used and is one of the Bayesian probabilistic clustering approaches for text data. Based on the co-occurrence probabilities of observed words in documents, the LDA approach can derive latent topics of documents, which are characterized by a distribution of words. LDA modeling produces topics, which are groups of words with similar characteristics. Through the application of LDA to the online reviews, we represent topics as interpretable service encounters, critical components of the SB based on passenger experiences, and redesign in-flight service in accordance with passenger perceptions by reorganizing service encounters. When redesigning the SB, we employ (re)design principles of complexity (a quantitative variable of SB) and divergence (a qualitative variable of SB) proposed by Shostack [27]. The variables are widely used in service (re)design with the SB to produce services efficiently (e.g., [28,29,30,31]), as discussed in detail in Section 2.2.
The primary contributions and findings of this study are as follows. First, we optimize the proper degree of divergence and complexity of the in-flight service process based on the passenger-focused standard. As a result, the number of service steps decreases by 38% compared to the benchmark service, but the divergence degree should increase for a couple of service steps. Second, we determine the direction and size of changes in the customization level for service encounters since we analyze the divergence by investigating the probability of word frequency, a quantitative measure. This also exposes the possibility of the quantification of divergence in contrast to previous studies. Lastly, the proposed redesign method could update a service process periodically while communicating with real-time online reviews. Since a sustainable service requires continuous improvement during a whole service lifecycle, this method helps providers achieve that goal by applying immediate feedback [32,33].
This paper is organized as follows. Section 2 reviews the previous literature on SB applications in various service fields and related research, as well as introducing the benchmark model. Section 3 explains in detail the research model and the dataset used in this study. The LDA model and its modeling procedures are briefly discussed. Section 4 presents the modeling results of the LDA topic analysis and topic naming. Through the redesign principles of complexity and divergence, this section provides the final form of the proposed SB. The related analysis processes and findings are also discussed. Finally, Section 5 summarizes the implications of this study and draws conclusions.

2. Related Review and Knowledge

2.1. Service Blueprint Based Redesign

The improvement of a service starts with an accurate, specific understanding of service processes and components [34]. The SB has become one of the most useful tools for visualizing and conceptualizing the whole service process in service design and innovation [30,35,36]. The SB has been extensively applied to the analysis of service processes, customer and employee behaviors in a broad range of tourism and hospitality fields, including shoe washing services [36,37], hotel services [38], banking services [27,39], and restaurant services [40].
It is necessary to modify an SB to incorporate field-specific characteristics so that the service process performs efficiently while meeting the exact needs of customers at the actual field where the service is provided [41]. There are two main approaches for modifying the SB. One class of method is an attempt to improve existing processes by applying advanced models and concepts to the SB. Lee, Wang, and Trappey [42] redesigned parking service processes using the theory of inventive problem solving (TIPS) principles. They identified problems and found solutions for the service based on the TIPS. Ru Chen, and Cheng [43] improved the blueprint with respect to total quality management (TQM) using ISO 9001. Botschen, Bstieler, and Woodside [44] redesigned the SB to determine critical points such as service encounters and points where service fails from the service provider’s perspective. A few redesign methods used text analyses. Ordenes et al. [13] analyzed customer perspectives from online reviews using text mining and explained possible applications including an SB improvement to combine customer perceptions. Ryu, Lim, and Kim [45] identified the definition, characteristics, and keywords of online-to-offline service by using a text analysis and modified the SB by adding new components of channel, and smart devices and technology. There are also a few published research results on service design issues using content analyses, which can apply to visual as well as textual data. Cristobal-fransi et al. [46] analyzed the service design of ski-resorts for climate change by applying content analysis to the website information. Hartman et al. [47] proposed a public-sector service design through the application of content analysis to blogs and YouTube.
The other class of methods varies the SB components. This type of modification can be commonly observed when an industry or an innovative new technology, which has never been introduced before in service blueprinting, is applied. Patrício, Fisk, and Cunha [48] suggested a service experience blueprint (SEB) adding a component called an interface to correspond to information technologies introduced in internet banking financial services. In addition, Patrício et al. [49] extended the scope of SB to retail industries combined with financial services. In order to represent the service delivery process clearly, Lim and Kim [50] modified the SEB by adding an information delivery system in the information-intensive service industry. Pöppel, Finsterwalder, and Laycock [51] reflected changes in the service process resulting from the introduction of digitization in the film industry by modifying the SB component. Barbieri et al. [52] considered a sociogram as a human factor dimension to visualize the reception service process of luxury hotels. The proposed SB of this study is rather close to the latter class of redesign approaches as it reorganizes the service encounters based on customer perceptions of the service while employing LDA text analysis in service blueprinting.

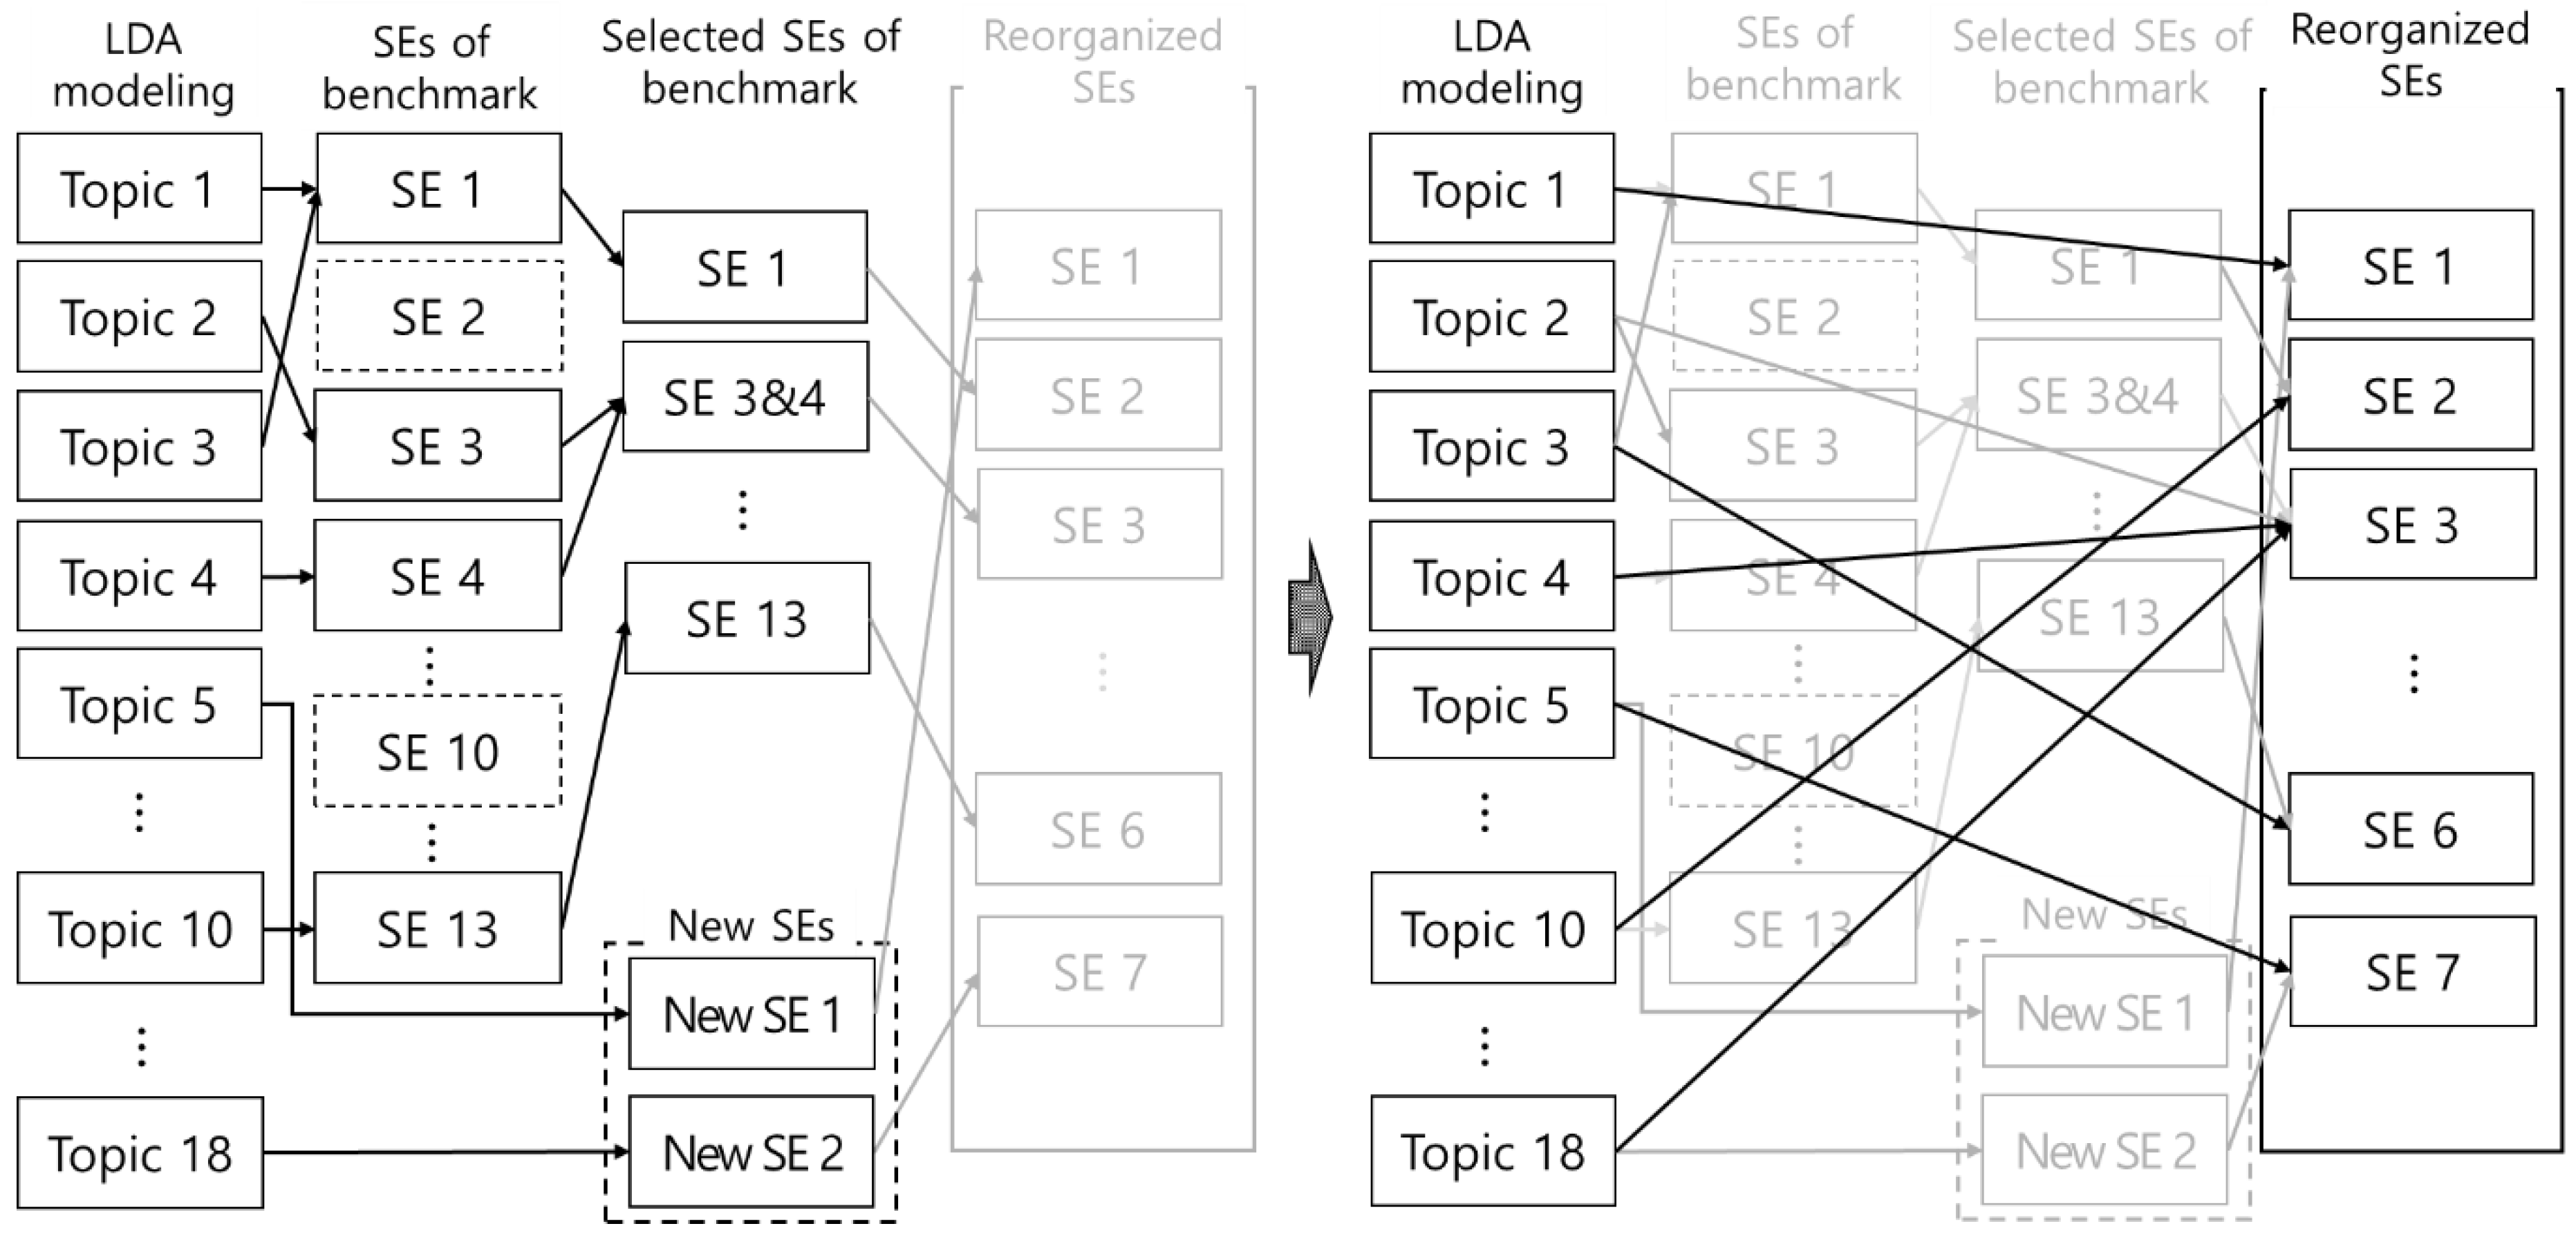
2.2. Reorganizing Service Encounters in Service Blueprint

One of the key components in the SB is the service encounter. Throughout the paper, we assume there is a one-to-one relationship between the service encounter and the service step as described in Reference [34]. The SB consists of customer actions, actions in front-stage encounters, actions in back-stage encounters, support processes, visible lines that distinguish between the front and back-stage, and physical evidence that a customer can see or experience [35,36,53]. The service encounter, the core of service delivery, is the moment when and/or the place where direct interactions between a customer and a service provider with proper physical components occur [30,54]. The service performance during service encounters affects service quality [55,56] and service quality has a positive influence on customer loyalty and satisfaction [57,58,59]. Customer perception of service experiences is the sum of experience perceptions from every service encounter in the subsequent process steps [55]. Therefore, it is very crucial to give an accurate configuration of service encounters when redesigning the service process and providing customized services. Scandinavian Airlines, for example, achieved positive corporate performances by adequately altering service encounters [53,60].
Since a customer prefers a flexible and personalized service, changes in the service encounters are unavoidable to accommodate customer needs [61,62]. Shostack [27] noted the redesign principles of SB as depicting various changes in the actual service delivery examples. These are complexity, the number and intricacy of the service delivery steps expressed in the blueprint, and divergence, the level of uniqueness permitted in a service step. Hence, a divergent service can be greatly affected by the service provider’s capabilities which includes proficiency, specific response behaviors to situations, response skills for predictable and unpredictable changes, self-control, adaptability to situations, and so on. In particular, the cabin crew’s capabilities should be emphasized in the airline service because the industry truly relies on services related to human resources against other service industries [63]. Thus, the complexity shows a quantitative variation in the SB whereas the divergence is closely related to the degree of employee competence and represents a qualitative variation in the SB. For example, decreasing divergence results in a standardized service, whereas increasing divergence means a customized service [27].
By adjusting the complexity, Paquet et al. [64] redesigned the SB to be an effective distributing process for meal services in a medical hospital. Kim and Kim [65] proposed an efficient service delivery by rationalizing the design of the customer service process. The simplification of service steps led to a decrease in complexity. Geum and Park [66] suggested a redesign method for the medical service process in terms of complexity by integrating the product-service system. Hossain, Enam and Farhana [67] investigated the limitations of the existing restaurant service process using interviews, and presented a new SB with greater complexity that split the behavior of customers and employees. Although relevant results with respect to research conducted on the complexity are relatively plentiful, there are few study results for modifying the divergence, especially working with quantitative methods, for the SB redesign. In terms of the improved design of in-flight service, we balance the complexity of in-flight service steps and the proper divergence of customization by investigating the probability of word frequency statistically distributed across topics and related service encounters [27].

2.3. Prior Works and Benchmark of the In-Flight Service Process
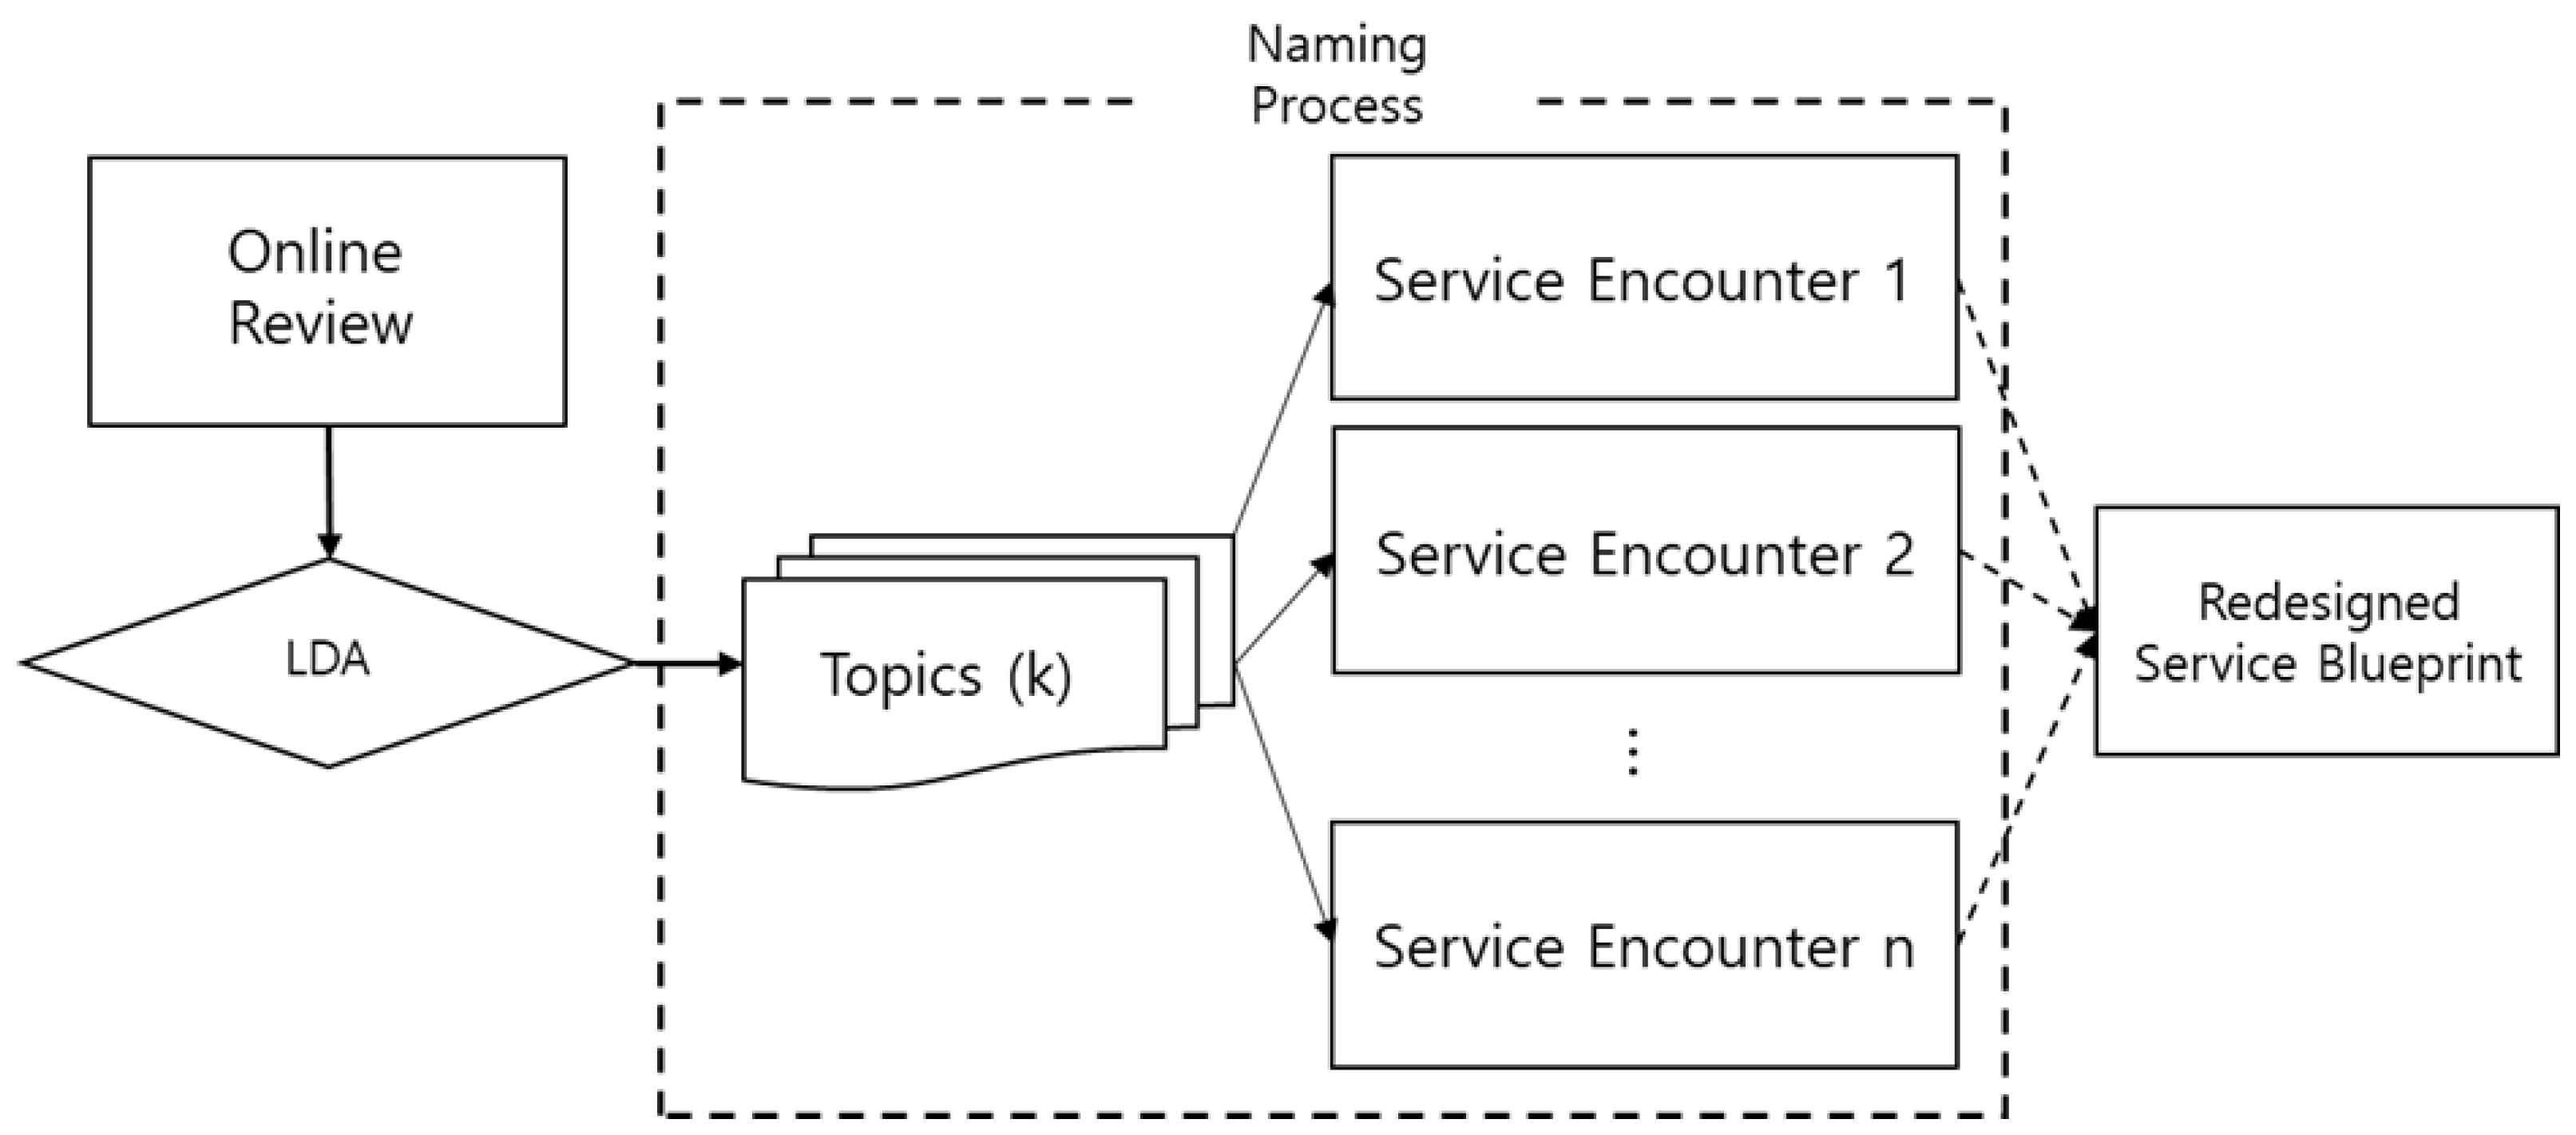
Research into air transport services has mainly focused on service quality and the investigation of factors that have major effects on and correlations with quality (See e.g., References [68,69,70,71,72]). There are not many published research results regarding the design and upgrade of the airline service process. Bamford and Xystouri [73] analyzed airline service points where the service fails and Kim, Bong, and Cho [74] modified the airline service process for specialized infant services. Lee, Kim, and Lee [75] and Go and Kim [76] applied the negative customer-to-customer interaction (NCCI) and Kano models to the SB for redesigning purposes, respectively, in order to estimate fail points and bottleneck processes in the airline service.
We choose the in-flight SB of a Korean airline as a benchmark and propose a modified version of the benchmark using the redesign principles described previously. The benchmark blueprint consists of 13 service steps with the equivalent number of service encounters when a passenger boards an aircraft [74,75,76]. Some service steps are only applicable to long-haul and international routes. This benchmark is the only publicized in-flight service in the form of an SB, to the best of our knowledge, and the service received an excellence award for ten years in a row until 2017 in the area of in-flight services [77]. Appendix A summarizes the descriptions of every service step and corresponding physical evidence.

3. Methodology

3.1. Research Model

To obtain a sustainable service as close to customer needs as possible, we used 64,706 passenger-written online reviews, which are naturally unrefined and voluntary. Online reviews contain more straightforward customer tastes and perceptions than standard survey data [78,79]. Customer perceptions are derived from customer experiences and customer experiences are defined as the sum of experiences at every service encounter [55]. We assumed that direct perceptions of customer experiences at every service encounter were contained in the online reviews [13,80]. The customer perceptions preserved were analyzed by employing LDA topic modeling [25,26]. As a result of LDA modeling, a topic, one of the k-dimensional space, becomes a probability distribution of word frequency from online reviews containing customer perceptions of the in-flight service. Here, k denotes the number of topics and is determined by the perplexity function, one of the measures for goodness of fit of statistical models. In this modeling, k is chosen to be 18 since the derivative of the perplexity function does not change significantly from the value. Therefore, the topic was weighed by the size of probability based on word frequencies. This suggests that the more frequently mentioned words by customers, the more important they are, and the more those words are included in the specific topic, the more important the topic is.
The extracted topics were named interpretable service encounters by conducting a two-step survey of researchers in the aviation management field. The group of researchers was composed of 3 professors and 12 graduate students of various majors in the aviation management field. Their specific majors included airline marketing, airport operations, airline service, revenue management, human resource management, finance, MIS and aviation policy and strategy. The professor group, including the authors, selected proper service encounters as compared to the benchmark and provided temporary topic names in the first step. New service encounters can be created if there are no suitable ones in the benchmark. On the contrary, existing service encounters can be deleted from the benchmark if they do not properly correspond to current topics. In the second step, every participant of the graduate student group independently provided final topic names as matching service encounters. The authors were excluded from this step. Then, we reorganized the service encounters using the redesign principles.
In the research frame, there were two main assumptions for the redesign of in-flight services. First, we assumed that all the actual service steps delivered should be defined in the in-flight SB without any omissions. This assumption gave us a legitimate opportunity to exclude passenger perceptions of service encounters undefined in the SB. In fact, the standard operating procedure (SOP) in the employee manual of cabin crews specifies all the service steps in the SB. Since crews should follow the SOP as per their training, the first assumption can be justified. Second, we assumed that there was no significant variation in the level of service quality among the top 10 ranked airlines that we chose [81]. Further details can be found in Section 3.2. Thus, the assumption enabled us to treat the whole dataset of 10 airlines as a similar level of data without having to distinguish between the chosen airlines. Since the survey evaluated around 330 airlines in the world at the same time, 3%, the top 10 airlines’ portion, suggests very exclusive and high-quality airline services. It is reasonable to treat the difference among them as insignificant. Figure 1 briefly depicts the whole modeling process of the study and Figure 2 dissects only the naming process in the dashed box of Figure 1.
More specifically, in the first step service encounters were selected while matching 18 topic modeling results to 13 service encounters in the benchmark model. We screened out one by one from the pool of topics and service encounters. If more than half of the participants regarded the specific pair of service encounter and topic as the right one, the pair was determined to be necessary for the redesign. For the non-matched topics and service encounters, an additional discussion within the professor group determined whether new service encounters should be created or whether existing service encounters should be removed. The results of the first step show seven service encounters that were highly recognized by passengers.
We performed a survey that matched 18 topics using the selected seven service encounters in the second step. The purpose of this survey was to confirm which service encounter among seven choices was the best fit for the specific topic. This survey used Appendix B, which summarized the LDA results composed of probabilistic distributions of words, although the appendix now contains the names. Specifically, we provided a questionnaire form with blanks in the second row of the table. Then 12 participants filled in the empty name of each topic from seven choices with the following naming directions. The first direction was that a word with a larger probability in a topic had a greater explanatory power than a word with a smaller probability. The second direction was to focus on dissimilar words that could represent differences among topics rather than similar words that existed in multiple topics at the same time. All participants were requested to mark words that were strongly associated with the specific service encounter during the survey, and these words were highlighted in the appendix. The final naming result was determined for the specific topic if more than half of the participants had given the identical answer.
In addition, all the participants were asked to highlight words for the divergence analysis. In order to analyze the capability of cabin attendants in terms of word frequency probability, all the participants were requested to mark two types of words strongly related to the capability in the questionnaire. One type of words expressed specific actions of cabin crews and the other type of words were evaluation expressions for the competence of cabin crews (see details in Section 4.3).

3.2. Data

We collected 64,706 online reviews from TripAdvisor for airline services from 1 February 2016 to 31 January 2017. To include a high level of quality in airline services in this analysis, we chose the top 10 ranked airlines assessed by Skytrax [81]. Table 1 presents the airlines selected in alphabetical order and the summary of the online reviews.

4. Results

4.1. Service Encounters Using LDA Modeling

As shown in Appendix B, 18 topics, the results of LDA modeling, were finally named as seven service encounters using the two-step survey. These were: reservation, pre-boarding service, boarding & ground service, take-off safety check, meal & beverage service, passenger relaxation, and deplaning & post-deplaning. The survey used the top 15 words based on the probability size in the naming of topics, and the words explained topics by the amount of 55.6% on average (refer to the last rows of tables in Appendix B). Table 2 arranges the LDA service encounters of in-flight service in the sequence of occurrence, together with the definition, matched topics, and the importance of service encounters. Among them, two new service encounters—reservation and pre-boarding service—were added and four of the existing service encounters were removed from the benchmark model. The rest of the service encounters were identical or renamed by integrating related service encounters from the benchmark.
For new service encounters generated by LDA modeling, reservation corresponds to T3, T12, and T16, and takes 17% of the importance. In particular, a word such as ‘social media’ (originally socialmedia in the modeling result) represents a recent change in customer trends as a new type of word-of-mouth [82]. Pre-boarding also takes 17% of the importance. The service process before boarding is related to sets of words such as carried baggage (e.g., bag, luggage), services provided by an airport (e.g., service, serve, efficient, eat, bar), flight information guides (e.g., travel, screen, delay, passenger), and physical evidence for boarding (e.g., ticket, passport).
For renamed service encounters from the typical ones, boarding includes T2 and T17 and takes 11% of the importance in the LDA results. This service encounter contains words related to the boarding process (e.g., check, available) and seating (e.g., economy, cabin, seat, short, forward, order). Take-off (T4, T15) takes 11% of the importance and shows words related to the take-off process (e.g., attendant, takeoff, departure, request, gate). Meal service corresponds to a single topic, T6, and covers 6% of the importance. The service encounter is represented by word sets, such as in-flight meal (e.g., meal, wine, snack), service quality evaluation (e.g., love, nice, awesome), and general impressions about the service (e.g., busy, available, service). Passenger relaxation is matched to the largest number of topics (T1, T8, T10, T11, T13, and T18) and has the highest importance. The service encounter includes several word sets such as seat experience (e.g., premium economy, sit, comfort, inconvenient), in-flight entertainment (IFE) (e.g., entertainment, book, online, movie, film), food (beverage, food), service providers (e.g., provide, hostess, staff, crew), and customer perceptions regarding the service (e.g., feel, happy, amaze, enjoy, pleasant, nice). Deplaning corresponds to T4 and covers 5% of the importance. This service encounter is supported by words (e.g., destination, transfer, hotel) and passenger perceptions of landing and deplaning (e.g., smile, welcome, miss).

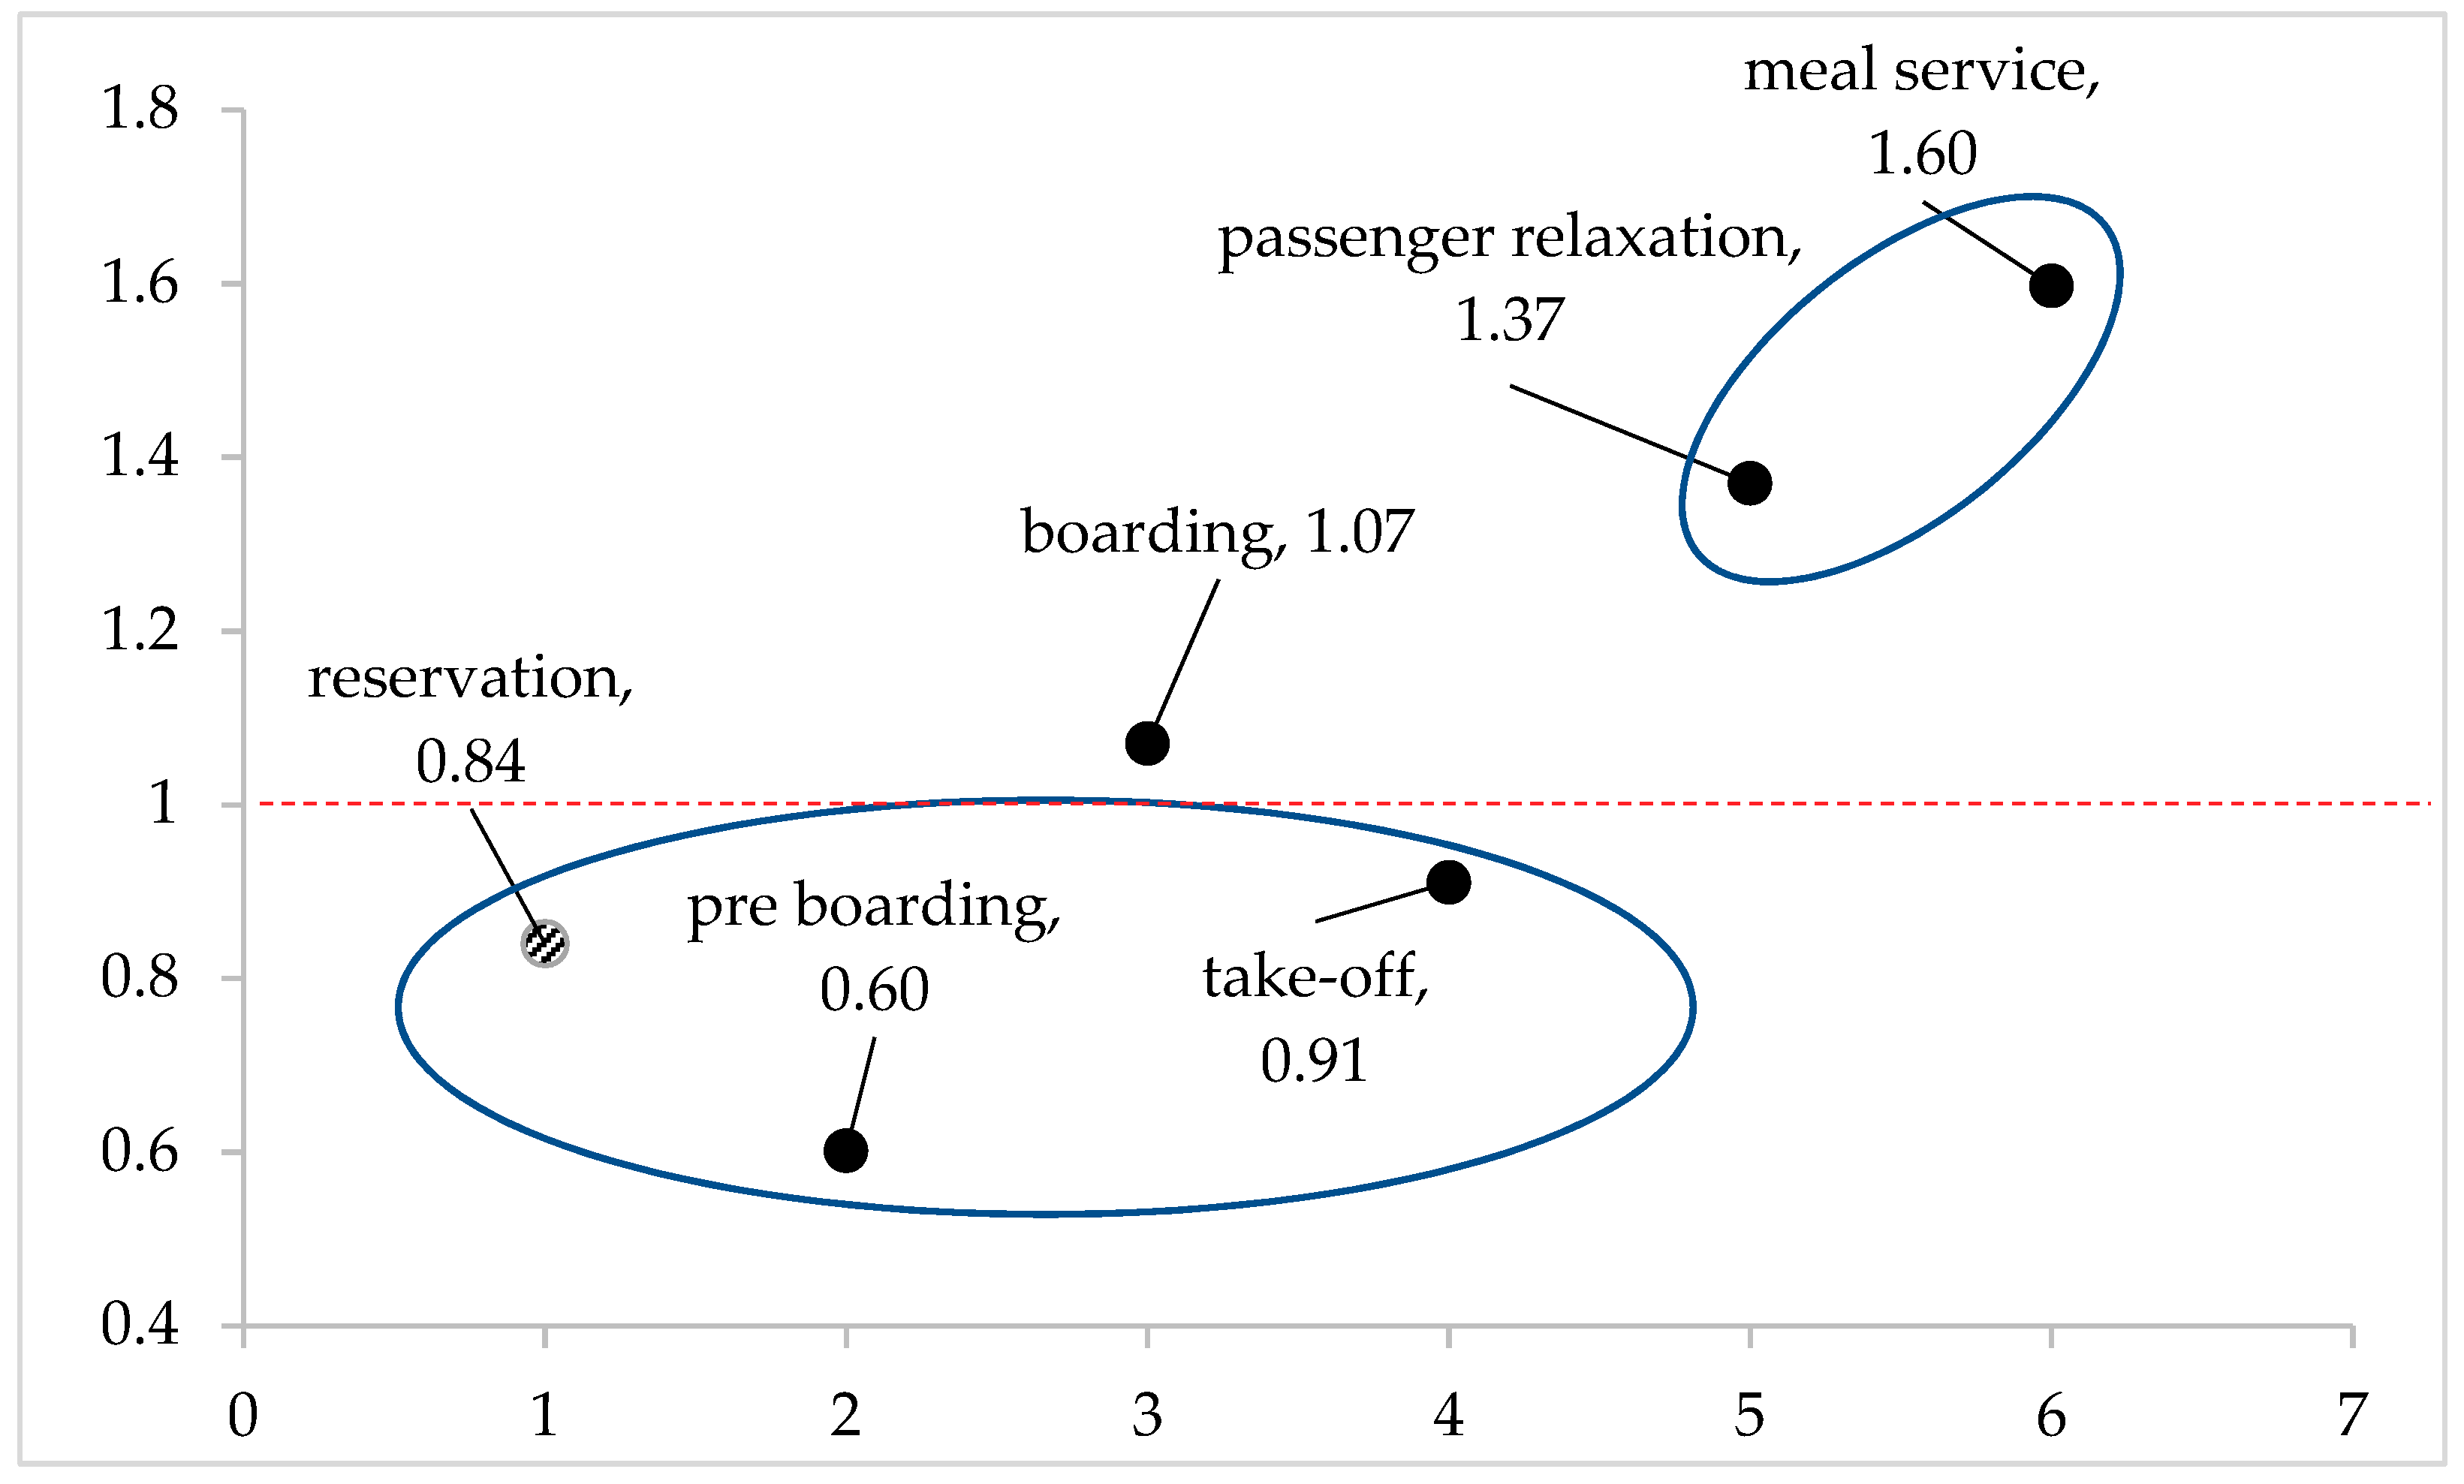
4.2. Service Blueprinting in Terms of Complexity

As shown in the previous section, reservation and pre-boarding service are the newly derived service encounters from the LDA topic modeling while reflecting passenger perceptions contained in online reviews. Reservation is excluded from the proposed SB since the actual in-flight service does not cover the service encounter. However, it is reasonable to assume that online reviews involve a great deal of expressions for the reservation because online booking systems are commonly utilized today. Although the reservation is not dealt with as an in-flight service encounter, service providers should be aware of its importance (17%)—not a small amount, in our analysis. This suggests that the reservation is one of the service processes that is highly recognized by passengers. We included this service encounter in the divergence analysis for this reason in Section 4.3.
Pre-boarding service asks for changes in the conventional process of in-flight services, since the service encounter is not the existing service encounter in the benchmark. The service encounter shows a few similarities with the existing service encounter of boarding a plane in the benchmark. However, it appears that topics of passenger experiences before the boarding stage (e.g., airport service, baggage handling, flight information, physical evidence of boarding) are relatively more frequent than cabin experience topics that can be characterized in the existing service encounter. This means that the importance of services provided before boarding should not be overlooked. If passengers seriously recognize the airline service from ticket issues, shopping, flight information acquisition, wandering and rests while waiting to board, air carriers need to be proactive in serving passengers by incorporating a wider range of new service encounters that have not been covered yet. As expected, some of the services mentioned cannot be easily reached by air carriers themselves and cooperation and coordination between related organizations are inevitable. Specified action plans for this service step are discussed in Section 4.4. The introduction of a new service encounter increases the complexity.
Boarding & ground service is a renamed service encounter as integrated in four existing service encounters (boarding a plane, finding seats, baggage service, ground service) in the benchmark. Since words associated with the 4 existing service encounters, such as boarding (e.g., check, cabin, available), finding a seat (e.g., economy, seat, short, forward), carried baggage service (e.g., put, high) and cabin service (e.g., drink, order) coexist in the related topics simultaneously, it is plausible to think that passengers would note little difference among the existing service encounters. These four service steps tend to be performed at the same time between boarding and take-off and passengers recognize the service encounters as almost the same one. This results in the integrated service encounter of boarding & ground service. The integration of the service encounters causes a decrease in complexity by reducing the service encounter numbers.
Take-off safety check and meal & beverage service remain the identical forms of the benchmark. Take-off is the service encounter that gives a start signal for actual flight after a few service steps have finished. Therefore, passengers independently recognize this service encounter from others and regard it as a separate service encounter. Although meal service, in terms of the characteristics of the service, can be seen as an extended one from passenger relaxation explained in the next paragraph, the service encounter is determined to be different since discernible meal-related words (e.g., meal, wine, snack) have appeared in the topic.
Two conventional service encounters, movie watching and personal relaxing, do not reveal a significant difference in customer perceptions and have been combined as a renamed service encounter: passenger relaxation. There are a great deal of word sets that are IFE-associated (e.g., entertainment, book, online, movie, film) and leisure-associated (e.g., book, sleep, sit) in the connected topics to support the service encounter. With the prevalent help of IFEs, watching a movie as part of personal relaxing has become a normal form of in-flight leisure. In particular, the order of movie watching is not critical to service providers in the whole service sequence because passengers experience the service with wide applications of IFEs regardless of the service sequence whenever the service is ready. That is, the service encounter of movie watching is inclusively recognized within the service encounter of passenger relaxation in a broader sense.
Deplaning means the termination of in-flight service and also leaves an independent and strong impression on customers likewise in take-off. As the same service encounter as the benchmark, there is no change in the complexity.
In terms of customer perceptions, four typical service encounters—in-flight sales, preparing immigration documents, preparing landing, and landing—are removed from the benchmark. In-flight sales is the service encounter of passengers’ convenience for shopping. Since in-flight sales is used as an additional income source for airlines, airlines treat this service as an important one [83]. In order to provide a diversified and customized shopping service, air carriers deploy a passenger-friendly marketing strategy based on products that consider the characteristics of passengers for individual routes and shopping counters that can achieve strong perceptions of the service. However, the current LDA modeling results do not disclose such efforts by airlines and neither do the results of the survey. This might be because the service encounter is not mandatory for every route and only applicable to part of long-haul or international routes. In preparing for landing, cabin crews provide destination information via announcements and take back used or reusable goods for the in-flight service. Passengers are usually static in the service encounter, being informed and returning goods according to the instructions. The degree of interaction between passengers and crews is lower than that in any other service encounter and the lower level of interaction has a restricted impact on customer perceptions of the experience [84].
Both preparing immigration documents and landing are the essential service encounters in air transport services although they did not emerge in the LDA topic modeling results. Customer perceptions of the service encounters are not strong enough to be revealed in the modeling since the presence of service encounters is naturally accepted in the in-flight service process. The service encounters remain in the same form in the proposed SB. Table 3 presents the results of the reorganized in-flight SBs in terms of complexity.
In summary, among the newly derived service encounters, reservation is excluded and pre-boarding service is added in the redesigned SB as increasing the complexity. However, the overall number of service encounters decreases when aggregating the four consecutive service encounters from boarding a plane to ground service in the benchmark as boarding & ground service, and combining the service encounters from movie watching to personal relaxing as passenger relaxation. Although passenger perceptions of the traditional service encounters of in-flight sales, preparing immigration documents, preparing for landing and landing are not strong enough to be regarded as important, we included two fundamental service encounters (preparing immigration documents, landing) in the redesigned SB. Finally, the SB is composed of the eight service encounters and is less complex than the benchmark SB by 38%.

4.3. Service Blueprinting in Terms of Divergence

The divergence represents the level of uniqueness and customization of the service and is closely related to the capabilities of service providers. In terms of the text analysis, the divergence can be revealed by word frequencies related to the capabilities of service providers. These can be expressions for specific actions relating to service delivery and customer evaluations of service competence. The current LDA results show that word sets associated with specific behaviors for service delivery (e.g., entertainment, check, service, crew, arrive, select, staff, offer, connect, steward) and word sets associated with customer assessments of service competence (e.g., good, great, comfort, busy, plenty, disappoint, quality, nice, friendly, happy) appear together within the relevant topics. Since the correlation among words is analyzed by using their frequency of simultaneous appearances in a set of documents in the LDA, the words that appear in the same topic are closely related to each other [25,26,85]. As explained previously, the word sets are collected from the survey of participants and the probabilities of two types of word sets can be utilized for quantitative evidence with respect to the divergence analysis in this redesign.
We defined the former word sets that belong to specific actions for service delivery as category 1, and the latter word sets belonging to customer evaluations of service competence as category 2. Figure 3 displays the word probabilities of categories in every topic and Appendix C summarizes the corresponding words for each topic. Three topics (T1, T4, and T5) are excluded from the analysis because they have only one of the two categories. Therefore, deplaning, which is only matched to T4, cannot be discussed here. As shown in Figure 3, the sum of probabilities of two categories varies from 11% to 47% and the proportion of words included in two categories is around 24%, which is sufficient to express the divergence, in total word frequency counts.
For the quantitative analysis, we divided the sum of probabilities of category 1 by that of category 2 for each service encounter after reuniting the topics that belong to the specific service encounter as displayed in Table 2. For example, boarding consisted of T2 and T17, and the ratio was 1.07 (=21.4/20.0) when we divided the sum of probabilities of category 1 (5.09 + 16.31 = 21.4) by that of category 2 (6.69 + 13.31 = 20.0). The ratio measures the word frequency of specific service actions per the word frequency of customer evaluations of the service capability. If the ratio was close to 1, we approximated that service actions were equally performed for service assessments in the service encounter. If the ratio was greater than 1, more service actions were provided for a service capability evaluation. This indicates that the crew actions for the service were relatively diverse and frequent to obtain one assessment. The service enables passengers to recognize a relatively high level of customization in the service encounter. If the ratio was smaller than 1, we deemed that the exact opposite was true.
As shown in Figure 4, the service encounters are grouped according to the ratio size. The first group, passenger relaxation and meal service, has ratio values of 1.37 and 1.60, respectively. We concluded that this was the group in which service encounters present a high level of divergence perceived by passengers. The second group, boarding, has a value of almost 1 and was concluded as the mid-level service encounter in terms of divergence. Likewise, the last group, reservation, pre-boarding and take-off, can be concluded as low-level service encounters in terms of divergence as the ratio is less than 1.
The existence of various forms of service evaluations on the same service performance indicates that the level of service expectation could also be diversified. This can generate gaps between the service expectation formed by prior experiences and the performance actually perceived [86]. The gap causes passenger dissatisfaction with the service. Therefore, it is essential for airlines to meet different passenger needs by interpreting them as accurately as possible and perform the service based on their understandings. Although service providers fail to properly respond to the diverse level of customer expectations, it is still possible to improve customer loyalty when the service recovery succeeds [87,88,89].
When compared to other service businesses, the airline service is quite dependent on services related to the competence level of cabin attendants [63]. Therefore, airlines should be equipped with cabin attendants’ capabilities of service delivery processes to promptly respond to diversified needs. As investigated using the divergence analysis, the service encounters of meal service and passenger relaxation should keep up the current high level of divergence. The service encounter of take-off can also maintain the current level of divergence when it has been regarded as an almost standardized service process. However, the service encounters of pre-boarding and boarding should strengthen the capabilities of cabin attendants and make efforts to develop further customized services with respect to the characteristics of the service encounters. The meaningful level of divergence should be increased in the service encounters.

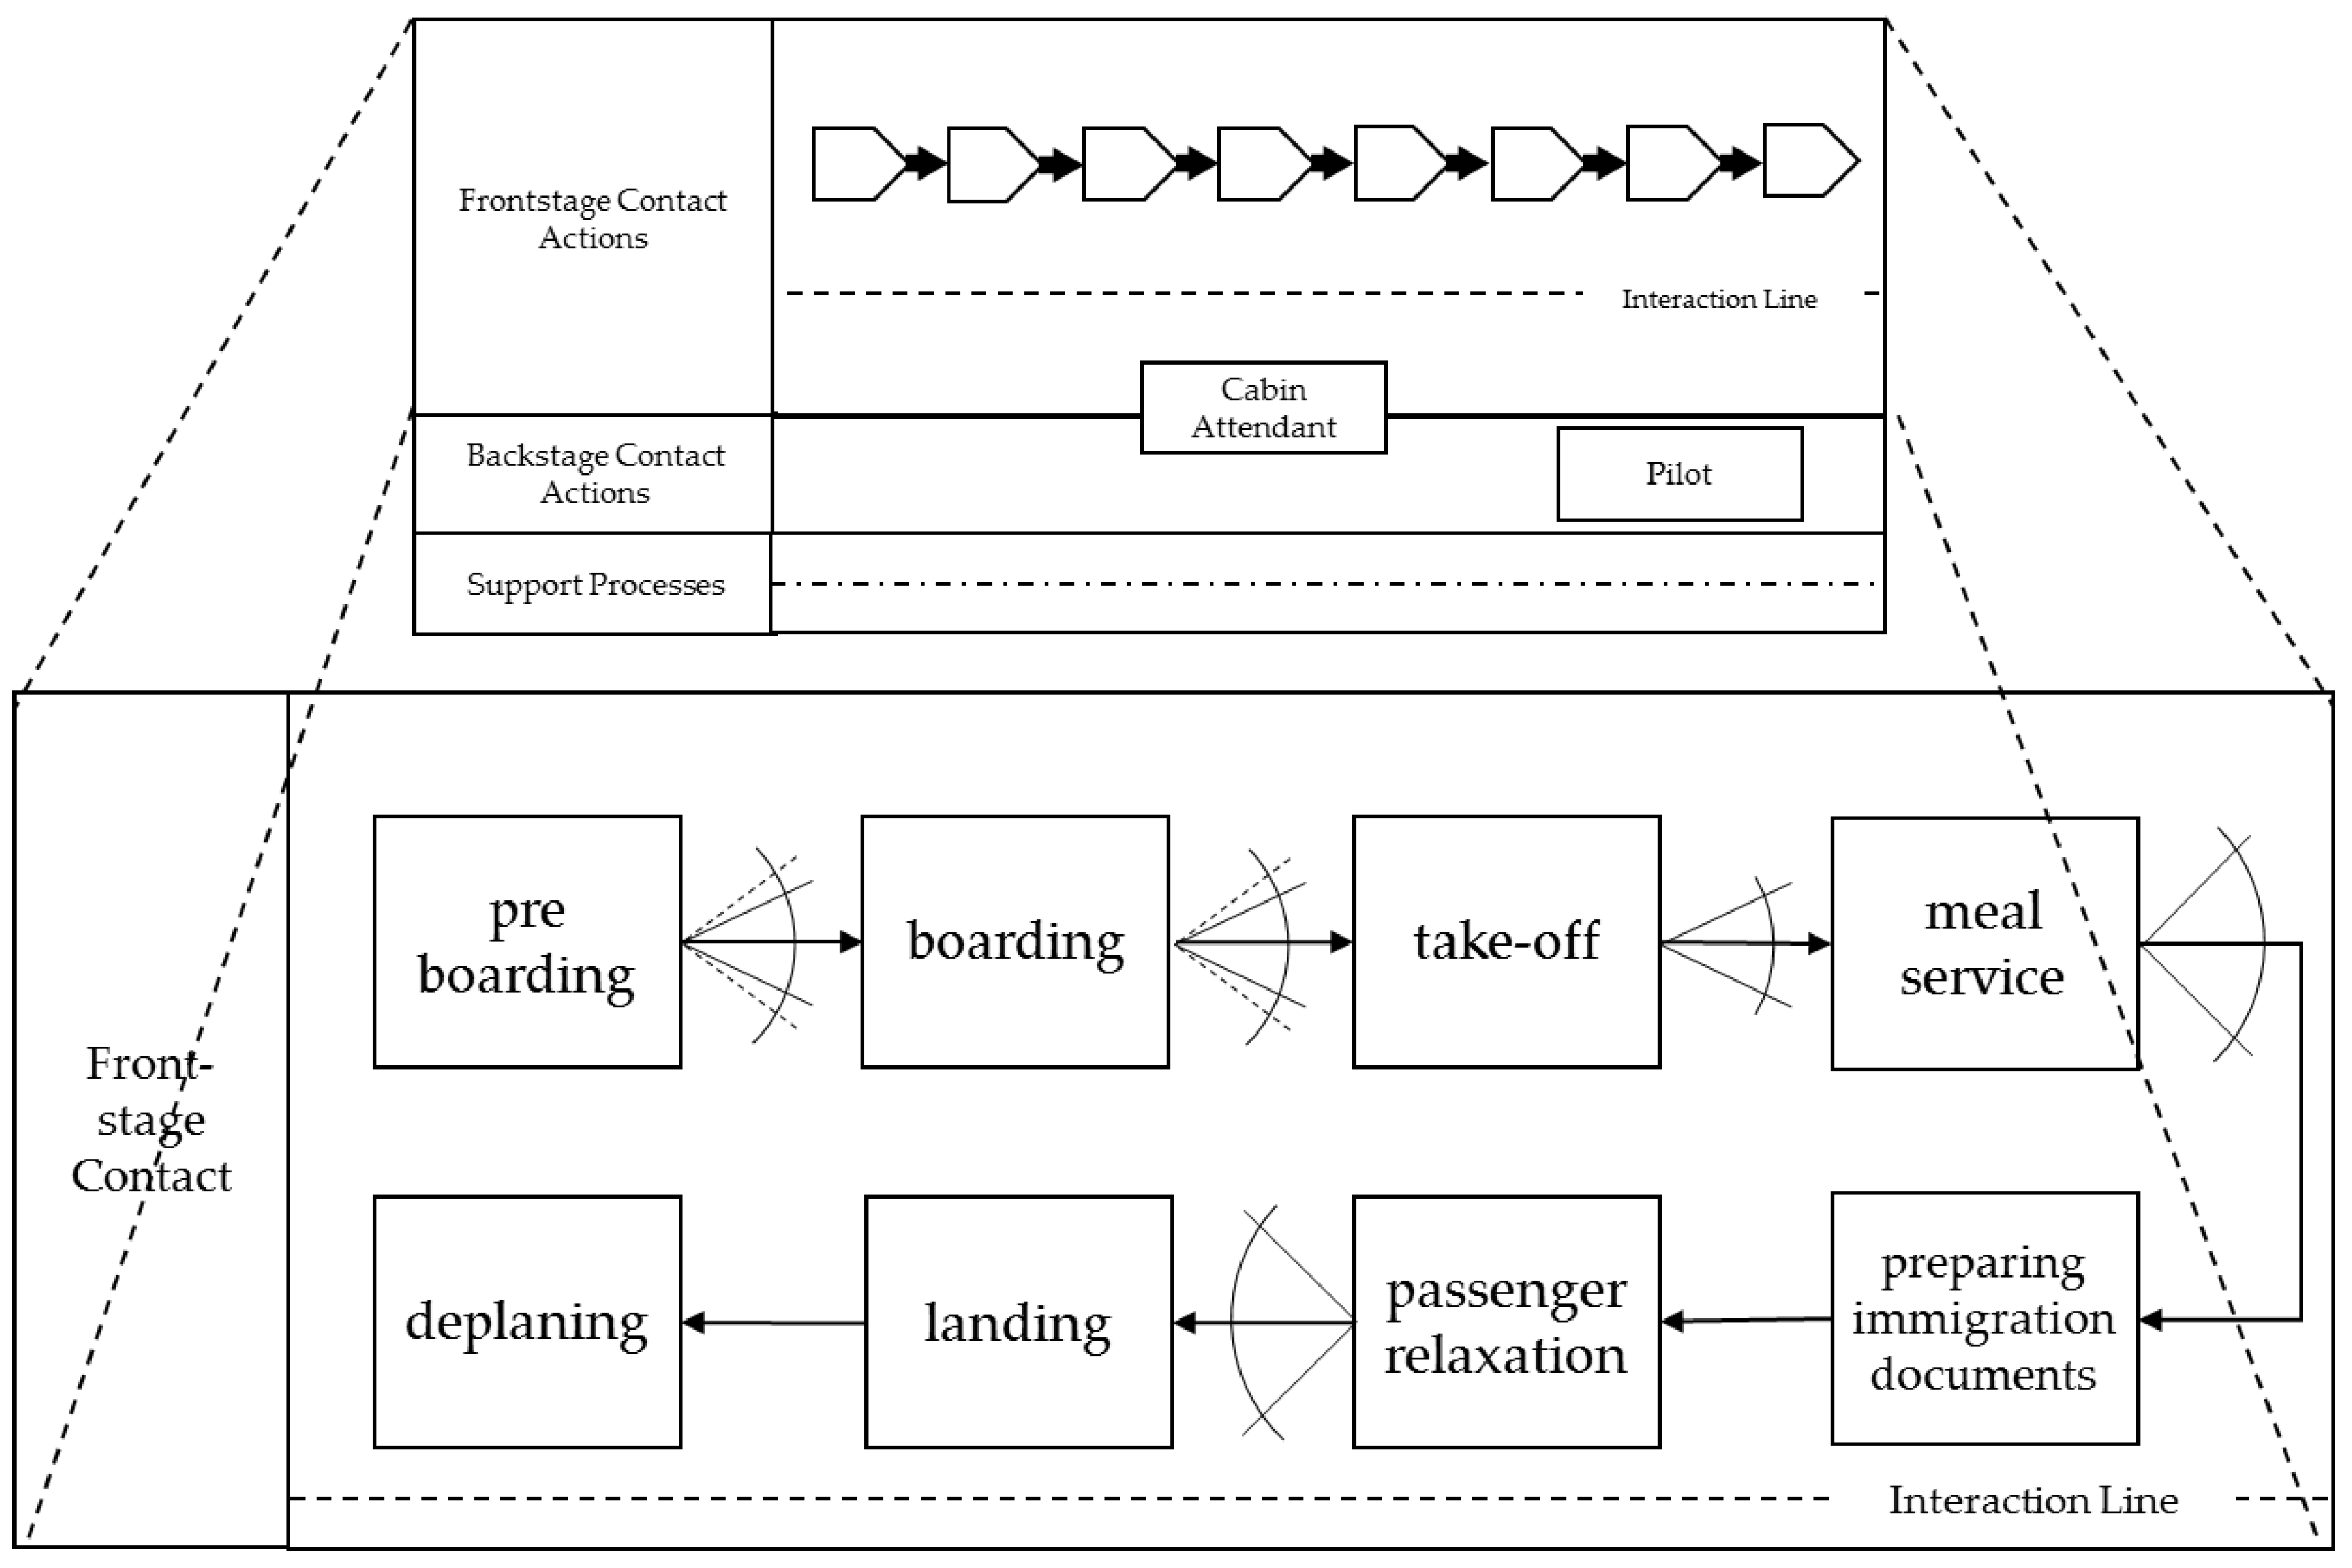
4.4. Redesigned In-Flight Service Blueprint

For every service encounter, the correlation between complexity and divergence is drawn in the complexity-divergence matrix in Figure 5. The level of divergence is determined by the base value of 1 in the ratio analysis and that of complexity is defined by the number of integrated service encounters from the benchmark. We noted that the complexity in this matrix should be interpreted with caution. If a service encounter is integrated with old service encounters, the complexity of the service encounter itself increases but the complexity decreases with respect to the SB level with a reduction in the service steps. With respect to service encounter level, the integration increases the intricacy of the service encounter as the single service encounter gathers service delivery procedures and elements of service encounters integrated [27]. The matrix covers only five service encounters that have been investigated by both dimensions (preparing immigration documents and landing not covered by the complexity and deplaning not covered by the divergence). For example, boarding is located in the middle part of the divergence axis and on the right side of the complexity axis since the service encounter has a value close to 1 and is integrated with four existing service encounters from the benchmark. Passenger relaxation is placed in the upper side of the divergence axis and in the middle part of the complexity axis because the ratio is 1.37 and two old service encounters are merged at the service encounter. In a similar vein, the positions of take-off and meal service are determined in the matrix. In particular, the newly derived pre-boarding is located in the high complexity region based on its typical features.
Pre-boarding is perceived to be complicated but not very customized by passengers. However, the amount of time and experiences consumed in this service encounter are not trivial with respect to the characteristics of the air transport service. As suggested in Figure 5, air carriers need to make their passengers aware of more customized services by increasing the degree of divergence. For example, they can strengthen the service capabilities of special care for passengers, such as pregnant women, elderly people, infants, and wounded veterans until flight departure. They can also sharpen lounge service differentiation before boarding for unique service experiences. Especially close cooperation between airlines and relevant authorities, such as an airport and customs service, is essential. Examples of service collaboration include shopping at duty free shops, notices and updates of flight information, services in amusement facilities such as restaurants, play zones and shopping malls, and so forth. Because the related topics cover 17% of the importance, there is a sufficient reason to improve the service capabilities of providers for this new service encounter.
Boarding is recognized as the service encounter with high complexity and medium divergence. Positive and strong passenger perceptions of this service encounter are important because the service encounter is the moment of truth when customers actually encounter the in-flight service. Thus, customized service is vital in the service encounter, intensifying the level of divergence. Take-off is the service encounter with low complexity and low divergence as perceived as a standardized service that involves simple safety checks. Meal service is perceived to be not very complicated but highly customized by customers. To deal with each customer’s needs, including menu variety and special demands, diversified scenarios of meal service delivery can be used as a viable strategy to achieve competitive advantages in the airline industry. Passenger relaxation is recognized as the service encounter with medium complexity and high divergence by passengers and needs to be highly divergent for maintaining the current level of customization. This is primarily because customers tend to experience the service encounter from the closest distance and spend most of the time at the service encounter; 33% topic importance supports this reasoning. To effectively respond to diversified customer needs and gain a competitive advantage, airlines should provide sophisticated, highly customized, and more service encounter-specific characterized services [27]. Figure 6 shows the final form of the redesigned in-flight SB based on customer perceptions of the service.

5. Summary and Conclusions

The main conclusions of the proposed in-flight SB are shared with respect to service design perspectives. First, we redesigned a customer-focused in-flight SB while understanding customer perceptions of the service through the application of topic modeling based on 64,706 passenger-authored online reviews for airline services. To do so, we derived the service encounters of in-flight service processes while extracting passenger perceptions of the service encounter experiences using LDA text analysis. We finally depicted the redesigned service using the SB frame with the redesign principles of complexity and divergence. To make sustainable in-flight service, we balanced the complexity and the proper divergence degree of in-flight service by investigating the probability of word frequency statistically distributed to topics and related service encounters. Second, in terms of complexity, in-flight-service is reorganized by eight service encounters via integration (boarding, passenger relaxation), new appearance (pre-boarding), and removal (in-flight sales, preparing landing). This leads to a 38% reduction in the number of service encounters compared to the benchmark SB. The newly emerged service encounter, pre-boarding, is not negligible for the entire service because it covers 17% of the total importance. This suggests that airlines need to expand the actual scope of services in a more proactive way to provide better in-flight services. Feasible action plans were discussed with specific examples in the previous section. Airlines may sustain the service capability for people who need special care and sharpen service differentiation for customers who are waiting, i.e., lounge services, before boarding. They should be aware of the importance of this, as it would help them better differentiate themselves. Lastly, airlines need to provide more customized services than the currently perceived level at a couple of service encounters (pre-boarding and boarding). This conclusion was reached by Shostack [27]; a service should be designed by considering the unique features of service encounters as carefully as possible. In particular, the results of the divergence analysis are established using a quantitative method with the probability of word occurrence.
The divergence analysis could be improved by considering the polarity of online reviews (positive or negative) in further studies, since we only use word frequency to quantify the significance of the topic. If a sentiment analysis were employed to capture the polarity of the degree of evaluation of words related to the service evaluation (category 2), the results could add more accurate and wider interpretations regarding service design. For the same aim of better interpretations, we need to utilize multiple trusted sources of online reviews simultaneously. Moreover, the characteristics of online reviews can sometimes cause problems. Since one of the main characteristics of online reviews is voluntariness, there is a chance of excluding the data of customers who are reluctant to, or for other reasons do not, express their opinions and thoughts.
We finalize this study by explaining the usability of the proposed design method. Under the circumstances wherein companies must promptly respond to customer needs and business environments change, the proposed design method could offer the ability to capture customer needs on the fly and incorporate them into service improvement. Furthermore, the application of the proposed design approach could be expanded to other industries with the proper acquisition of relevant datasets although we focus on the airline service in this study. Finally, the proposed design could play a crucial role in the further improvement of a service process as a new standard. It is possible to evaluate the status of service delivery efficiency based on the new standard design. The appropriate evaluation can be another trigger for continuous improvements in a sustainable service.

Author Contributions

Conceptualization, S.N. and H.C.L.; methodology, S.N., C.H. and H.C.L.; software, S.N. and C.H.; validation, S.N., C.H. and H.C.L.; formal analysis, S.N. and H.C.L.; investigation, S.N., C.H. and H.C.L.; resources, S.N. and H.C.L.; data curation, S.N.; writing—original draft preparation, S.N. and H.C.L.; writing—review and editing, S.N., C.H. and H.C.L.; visualization, S.N. and H.C.L.; project administration, H.C.L.; supervision, H.C.L.

Funding

This research received no external funding.

Acknowledgments

The authors would like to thank the professors (Woon-Kyung Song, Chul-woo Kim) and the graduate students for their participation in the surveys and interviews, as well as for their helpful comments and suggestions.

Conflicts of Interest

The authors declare no conflict of interest.

Appendix A

Table A1. Benchmark Model of In-Flight Service Encounters.
Service EncounterDefinitionPhysical EvidenceRemarks
Boarding a planeThe moment when a meeting with passengers takes place for the first timeCrew uniform, boarding area facilities, aircraft outlook
Finding seatsChecking in boarding passes managing congested aislesBoarding pass, seat, interior
Baggage serviceManaging luggage storagesOverhead compartment (bin), coat room
Ground serviceProviding background music, reading materials and beveragesScreen, book, audio
Taking offChecking up take-off demonstrating safety simulationIndividual reading light, seat belt, in-flight light
In-flight food serviceProviding meal and beverage serviceMenu, meal, beverage, waiting, service evidence, clearance, attendants’ appearanceLong-haul & international routes
In-flight salesProviding convenience of shopping for passengersIn-flight sales counter, goodsLong-haul & international routes
Prepare immigration documentsSupport with filling out passenger immigration documentsImmigration documentsInternational routes
Movie watchingProviding movies and musicPassenger service unit (PSU), movie, screenLong-haul & international routes
Personal relaxingTouring the cabin, responding to service callsIn-flight environment, thermostat setting, toilet, blanket, cushion
Prepare landingProviding destination information, collecting service itemsEarphone, pillowLong-haul & international routes
LandingChecking safety of landingIndividual reading light, in-flight light, seat
DeplaningGiving a farewell and taking back goodsAttendant appearance, cabin interior
The table presents in-flight service encounters of the benchmark blueprint in order of time of occurrence. The definition, physical evidence of every 13 service encounters are explained, and some of the service encounters are only applicable for long-haul and/or international routes.

Appendix B

Table A2. LDA Topic Naming Results.
T1T2T3T4T5T6
Passenger relaxationBoardingReservationDeplaningPre-boardingMeal Service
5.53%5.54%5.53%5.46%5.56%5.55%
food8.94%economy8.69%comfort9.20%excel14.81%travel11.38%service17.67%
change7.09%cabin6.75%staff7.09%leg5.74%food10.28%meal7.14%
hope5.22%seat5.71%little5.85%try4.17%delay7.73%busy6.16%
upgrade4.69%disappoint5.48%choose4.89%class3.96%serve7.08%love2.11%
board4.37%high2.31%steward4.88%bad3.30%quit5.97%return1.32%
easy2.99%forward2.18%special4.50%friendly3.11%haul5.04%legroom1.19%
appreciate2.37%issue2.01%left4.42%smile2.66%find4.92%wine1.18%
bed2.35%several1.89%free4.40%welcome2.62%long3.17%snack1.00%
premiumeconomy2.32%order1.74%poor3.65%destination2.07%toilet2.34%nice0.93%
sleep1.52%level1.62%trip2.72%improve1.94%passport2.31%awesome0.93%
direct1.48%menu1.25%superb2.70%start1.94%bar2.30%number0.83%
future1.30%glad1.21%show2.18%transfer1.68%route2.21%schedule0.63%
leg1.13%put1.17%awesome1.99%miss1.19%staff1.98%case0.61%
bag0.58%gate1.10%start1.62%regret1.16%screen1.50%prefect0.52%
apology0.55%leave0.92%front1.57%hotel1.16%carrier1.20%available0.41%
46.95%44.07%61.71%51.56%69.47%42.69%
T7T8T9T10T11T12
Pre-boardingPassenger relaxationPre-boardingPassenger relaxationPassenger relaxationReservation
5.64%5.52%5.53%5.61%5.59%5.54%
great13.10%entertainment21.84%service12.27%13.61%10.13%make9.46%seat13.61%
service8.42%book7.71%experience8.32%8.92%8.66%good6.33%clean8.92%
nice5.05%enjoy4.67%passenger7.44%6.59%6.85%staff6.16%offer6.59%
kind4.70%give3.79%price6.04%4.71%4.49%feel5.54%expect4.71%
ticket4.67%pay3.25%efficient4.99%4.30%3.32%happy5.01%share4.30%
ground4.63%pleasant2.36%bag4.99%4.14%3.23%comfort4.60%option4.14%
average2.32%problem2.36%sorry3.19%4.14%2.77%reason4.43%luggage4.14%
fantastic2.19%perfect2.15%frequent3.10%3.68%2.23%top4.23%polite3.68%
return1.57%quick2.03%ticket3.10%3.21%2.22%home4.07%travel3.21%
eat1.21%nice1.97%fault2.54%3.14%2.08%impress3.99%socialmedia3.14%
system1.19%end1.57%screen2.35%3.06%1.96%entertainment3.32%route3.06%
big1.07%meal1.47%recliner2.35%2.66%1.85%pleasant2.75%detail2.66%
onboard0.93%facility1.21%luggage2.08%2.63%1.79%amaze2.43%book2.63%
water0.82%manage1.20%write1.44%2.34%1.64%breakfast2.20%decent2.34%
late0.81%happen1.20%serve1.31%2.34%1.45%part2.05%pleasure2.34%
52.76%58.84%65.58%54.74%66.62%69.52%69.52%
T13T14T15T16T17T18
Passenger relaxationTake-offTake-offReservationBoardingPassenger relaxation
5.54%5.57%5.55%5.59%5.54%5.54%
good17.21%food12.39%airplane10.61%board9.45%check14.046crew11.65%
experience5.24%friendly5.05%service5.49%room6.86%airport11.275arrive11.22%
attend4.19%choice3.52%drink4.84%connect5.04%lounge8.31%select10.77%
feedback4.07%review2.51%work4.00%full4.71%quality5.09%space8.72%
amaze3.86%attendant2.33%compare2.47%found3.64%drink4.78%plenty5.74%
different3.05%journey2.33%free2.34%professional3.08%available4.68%wait4.18%
sleep2.34%takeoff2.27%spacious2.30%care2.73%include2.70%start2.35%
row2.30%departure1.84%point2.13%stopover2.35%legroom2.53%big2.26%
online2.18%baggage1.33%smooth1.92%smooth1.82%economy2.32%premiumeconomy2.21%
treat1.90%television1.21%prefect1.48%surprise1.31%short2.32%small1.98%
huge1.26%request1.17%contact1.33%staff1.23%investigate2.26%room1.95%
cause1.24%airplane1.09%takeoff1.27%line1.21%please2.25%front1.55%
terminal1.23%attentive0.90%pretty1.21%flat1.20%fine1.28%film1.37%
send1.21%good0.89%gate1.04%call1.08%recent1.22%large1.23%
media1.21%attend0.75%courteous0.71%value0.97%message1.14%pleasant1.21%
52.56%39.64%43.21%46.74%66.26%68.45%
The table in this appendix represents topics derived using LDA modeling. It contains the topic number (first row), the name (second row)−the result of the naming process using a two-step survey, and the importance (third row) of 18 LDA topics. As the top 15 words are arranged according to the probability size, the values in the third and last rows denote the importance of the topic and amount of explanation (sum of probabilities) of the 15 words for the topic, respectively. The words in bold are strongly related to each topic and are the basis for naming the topic.

Appendix C

Table A3. Words List for Divergence Analysis.
Related Words%
Category 1Category 2
T1--appreciate2.37%2.4%
T2forward order put5.09%disappoint glad6.69%11.8%
T3staff steward show14.15%comfort special poor superb awesome22.04%36.2%
T4--excel bad friendly21.22%21.2%
T5serve staff9.06%--9.1%
T6service17.67%busy love nice awesome perfect11.06%22.2%
T7service8.42%great nice kind fantastic late25.85%34.3%
T8entertainment give manage26.83%enjoy pleasant perfect nice11.15%38.0%
T9service serve13.58%efficient sorry fault10.72%24.3%
T10provide recommend send hostess mention11.30%good worth inconvenient14.32%25.6%
T11make staff entertainment18.94%good happy comfort impress pleasant amaze25.11%44.1%
T12offer6.59%polite decent pleasure8.36%15.0%
T13attend feedback treat send10.16%good amaze21.07%31.2%
T14attendant attend4.25%friendly attentive good6.84%11.1%
T15service contact6.82%smooth perfect pretty courteous5.32%12.1%
T16connect care staff call10.08%professional smooth surprise6.21%16.3%
T17check investigate16.31%quality available please fine13.31%29.6%
T18crew arrive select wait start40.17%plenty pleasant6.95%47.1%
This table summarizes the words related to the capability of cabin crews in the online reviews. Category 1 contains word sets associated with specific actions for service delivery and category 2 contains word sets associated with customer assessments on service competence.

References

  1. InterVISTAS-ga2 Consulting. The Economic Impact of Air Service Liberization. 2006. Available online: http://www.iata.org/whatwedo/Documents/economics/liberalization_air_transport_study_30may06.pdf (accessed on 30 October 2018).
  2. Cognizant. How Airlines Can Deliver a Personalized Customer Experience during Operational Disruptions. 2015. Available online: https://www.cognizant.com/whitepapers/How-Airlines-Can-Deliver-a-Personalized-Customer-Experience-During-Operational-Disruptions-codex1603.pdf (accessed on 30 October 2018).
  3. Bhaskara, V. Airlines Are Giving Customers Exactly What They Want. Forbes. 14 January 2015. Available online: https://www.forbes.com/sites/airchive/2015/01/14/actually-airlines-are-giving-customers-exactly-what-they-want/#3364aaef29bb (accessed on 30 October 2018).
  4. Treacy, M.; Wiersema, F. Customer Intimacy and Other Value Disciplines Customer Intimacy and Other Value Disciplines. Harv. Bus. Rev. 1993, 71, 84–93. [Google Scholar] [CrossRef]
  5. Punel, A.; Ermagun, A. Using Twitter network to detect market segments in the airline industry. J. Air Transp. Manag. 2018, 73, 67–76. [Google Scholar] [CrossRef]
  6. Li, W.; Yu, S.; Pei, H.; Zhao, C.; Tian, B. A hybrid approach based on fuzzy AHP and 2-tuple fuzzy linguistic method for evaluation in-flight service quality. J. Air Transp. Manag. 2017, 60, 49–64. [Google Scholar] [CrossRef]
  7. Liou, J.J.H.; Yen, L.; Tzeng, G. Using decision rules to achieve mass customization of airline services. Eur. J. Oper. Res. 2010, 205, 680–686. [Google Scholar] [CrossRef]
  8. Gilbert, D.; Wong, R.K.C. Passenger expectations and airline services: A Hong Kong based study. Tour. Manag. 2003, 24, 519–532. [Google Scholar] [CrossRef]
  9. Doganis, R. Flying Off Course: Airline Economics and Marketing, 4th ed.; Routledge: London, UK, 2010; ISBN 9780203863992. [Google Scholar]
  10. Nameghi, E.N.M.; Azmi, A.; Arif, M. The measurement scale for airline hospitality: Cabin crew’s performance perspective. J. Air Transp. Manag. 2013, 30, 1–9. [Google Scholar] [CrossRef]
  11. Pearlstein, S. Boeing and Airbus, the New ‘Super Duopoly’. The Washington Post. 2018. Available online: https://www.washingtonpost.com/news/wonk/wp/2018/04/25/boeing-and-airbus-the-new-super-duopoly/?noredirect=on&utm_term=.14b4df53ee16 (accessed on 30 October 2018).
  12. Jones, P.; Clarke-Hill, C.; Comfort, D.; Hillier, D. Marketing and sustainability. Mark. Intell. Plan. 2008, 26, 123–130. [Google Scholar] [CrossRef]
  13. Ordenes, F.V.; Theodoulidis, B.; Burton, J.; Gruber, T.; Zaki, M. Analyzing Customer Experience Feedback Using Text Mining. J. Serv. Res. 2014, 17, 278–295. [Google Scholar] [CrossRef] [Green Version]
  14. Mudambi, S.M.; Schuff, D. Research Note: What Makes a Helpful Online Review? A Study of Customer Reviews on Amazon.com. MIS Q. 2010, 34, 185–200. [Google Scholar] [CrossRef]
  15. Duan, W.; Gu, B.; Whinston, A.B. Do online reviews matter?—An empirical investigation of panel data. Decis. Support Syst. 2008, 45, 1007–1016. [Google Scholar] [CrossRef]
  16. Dellarocas, C.; Zhang, X.; Awad, N.F. Exploring the value of online product reviews in forecasting sales: The case of motion pictures. J. Interact. Mark. 2007, 21, 23–46. [Google Scholar] [CrossRef]
  17. Berezina, K.; Bilgihan, A.; Cobanoglu, C.; Okumus, F. Understanding Satisfied and Dissatisfied Hotel Customers: Text Mining of Online Hotel Reviews. J. Hosp. Mark. Manag. 2016, 25, 1–24. [Google Scholar] [CrossRef]
  18. Mankad, S.; Han, H.; Goh, J.; Gavirneni, S. Understanding Online Hotel Reviews through Automated Text Analysis. Serv. Sci. 2016, 8, 124–138. [Google Scholar] [CrossRef]
  19. Archak, N.; Ghose, A.; Ipeirotis, P.G. Deriving the Pricing Power of Product Features by Mining Consumer Reviews. Manag. Sci. 2011, 57, 1485–1509. [Google Scholar] [CrossRef] [Green Version]
  20. Lee, M.J.; Singh, N.; Chan, E.S.W. Service failures and recovery actions in the hotel industry: A text-mining approach. J. Vacat. Mark. 2011, 17, 197–207. [Google Scholar] [CrossRef]
  21. O’Connor, P. Managing a hotel’s image on Tripadvisor. J. Hosp. Mark. Manag. 2010, 19, 754–772. [Google Scholar] [CrossRef]
  22. Gretzel, U.; Yoo, K.H. Use and impact of online travel reviews. In Information and Communication Technologies in Tourism 2008; Springer: Berlin, Germany, 2008. [Google Scholar] [CrossRef]
  23. Pekar, V.; Ou, S. Discovery of subjective evaluations of product features in hotel reviews. J. Vacat. Mark. 2008, 14, 145–155. [Google Scholar] [CrossRef] [Green Version]
  24. Hu, M.; Liu, B. Mining opinion features in customer reviews. Am. Assoc. Artif. Intell. 2004, 4, 755–760. [Google Scholar] [CrossRef]
  25. Blei, D.M.; Lafferty, J.D. A correlated topic model of science. Ann. Appl. Stat. 2007, 1, 17–35. [Google Scholar] [CrossRef]
  26. Blei, D.M.; Ng, A.Y.; Jordan, M.I. Latent Dirichlet Allocation. J. Mach. Learn. Res. 2003, 3, 993–1022. [Google Scholar] [CrossRef]
  27. Shostack, G.L. Service Positioning through Structural Change. J. Mark. 1987, 51, 34–43. [Google Scholar] [CrossRef]
  28. Kuang, P.H.; Chou, W.H. Research on Service Blueprint of Food Banks. Des. J. 2017, 20, S3425–S3435. [Google Scholar] [CrossRef] [Green Version]
  29. Song, W.; Wu, Z.; Li, X.; Xu, Z. Modularizing product extension services: An approach based on modified service blueprint and fuzzy graph. Comput. Ind. Eng. 2015, 85, 186–195. [Google Scholar] [CrossRef]
  30. Bitner, M.J.; Ostrom, A.L.; Morgan, F.N. Service Blueprinting: A Practical Technique for Service Innovation. Calif. Manag. Rev. 2008, 50, 66–94. [Google Scholar] [CrossRef]
  31. Tseng, M.M.; Qinhai, M.; Su, C.J. Mapping customers’ service experience for operations improvement. Bus. Process Manag. J. 1999, 5, 50–64. [Google Scholar] [CrossRef] [Green Version]
  32. Peattie, K.; Belz, F.-M. Sustainability marketing—An innovative conception of marketing. Mark. Rev. St. Gallen 2010, 27, 8–15. [Google Scholar] [CrossRef]
  33. Polese, F.; Carrubbo, L.; Caputo, F.; Sarno, D. Managing Healthcare Service Ecosystems: Abstracting a Sustainability-Based View from Hospitalization at Home (HaH) Practices. Sustainability 2018, 10, 3951. [Google Scholar] [CrossRef]
  34. Zeithaml, V.A.; Bitner, M.J.; Gremler, D.D. Services Marketing: Integrating Customer Focus across the Firm, 6th ed.; McGraw-Hill: New York, NY, USA, 2013; ISBN 9780078112058. [Google Scholar]
  35. Fließ, S.; Kleinaltenkamp, M. Blueprinting the service company—Managing service processes efficiently. J. Bus. Res. 2004, 57, 392–404. [Google Scholar] [CrossRef]
  36. Shostack, G.L. Designing services that deliver. Harv. Bus. Rev. 1984, 62, 133–139. [Google Scholar] [CrossRef]
  37. Berkley, B.J. Analyzing service blueprints using phase distributions. Eur. J. Oper. Res. 1996, 88, 152–164. [Google Scholar] [CrossRef]
  38. Scheuing, E.E.; Christopher, W.F. The Service Quality Handbook; Amacom: New York, NY, USA, 1993; ISBN 9780814401194. [Google Scholar]
  39. Michel, S. Analyzing service failures and recoveries: A process approach. Int. J. Serv. Ind. Manag. 2001, 12, 20–33. [Google Scholar] [CrossRef]
  40. Hummel, E.; Murphy, K.S. Using service blueprinting to analyze restaurant service efficiency. Cornell Hosp. Q. 2011, 52, 265–272. [Google Scholar] [CrossRef]
  41. Buhalis, D.; Law, R. Progress in information technology and tourism management: 20 years on and 10 years after the Internet-The state of eTourism research. Tour. Manag. 2008, 29, 609–623. [Google Scholar] [CrossRef] [Green Version]
  42. Lee, C.H.; Wang, Y.H.; Trappey, A.J.C. Service design for intelligent parking based on theory of inventive problem solving and service blueprint. Adv. Eng. Inform. 2015, 29, 295–306. [Google Scholar] [CrossRef]
  43. Ru Chen, H.; Cheng, B. Applying the ISO 9001 process approach and service blueprint to hospital management systems. TQM J. 2012, 24, 418–432. [Google Scholar] [CrossRef]
  44. Botschen, G.; Bstieler, L.; Woodside, A.G. Sequence-oriented Problem Identification within Service Encounters. J. Euromark. 1996, 5, 19–52. [Google Scholar] [CrossRef]
  45. Ryu, D.-H.; Lim, C.-H.; Kim, K.-J. Development of online-to-offline service blueprint. In Proceedings of the 2016 Informs Annual Meeting, Nashville, TN, USA, 13–16 November 2016. [Google Scholar]
  46. Cristobal-Fransi, E.; Daries, N.; Serra-Cantallops, A.; Ramón-Cardona, J.; Zorzano, M. Ski Tourism and Web Marketing Strategies: The Case of Ski Resorts in France and Spain. Sustainability 2018, 10, 2920. [Google Scholar] [CrossRef]
  47. Hartman, A.; Jain, A.N.; Ramanathan, J.; Ramfos, A. Participatory Design of Public Sector Services. In Proceedings of the 2010 Electronic Government and the Information Systems Perspective (EGOVIS 2010), Bilbao, Spain, 31 August–2 September 2010. [Google Scholar] [CrossRef]
  48. Patrício, L.; Fisk, R.P.; Falcão e Cunha, J.; Cunha, J. Designing multi-interface service experiences: The service experience blueprint. J. Serv. Res. 2008, 10, 318–334. [Google Scholar] [CrossRef]
  49. Patrício, L.; Fisk, R.P.; Falcão e Cunha, J.; Constantine, L. Multilevel service design: From customer value constellation to service experience blueprinting. J. Serv. Res. 2011, 14, 180–200. [Google Scholar] [CrossRef]
  50. Lim, C.-H.; Kim, K.-J. Information Service Blueprint: A Service Blueprinting Framework for Information-Intensive Services. Serv. Sci. 2014, 6, 296–312. [Google Scholar] [CrossRef]
  51. Pöppel, J.; Finsterwalder, J.; Laycock, R.A. Developing a film-based service experience blueprinting technique. J. Bus. Res. 2018, 85, 459–466. [Google Scholar] [CrossRef]
  52. Barbieri, S.; Fragniere, E.; de Grandbois, Y.; Moreira, M.P. Measuring Human Risks in Service: A New Model. J. Serv. Sci. Manag. 2017, 10, 518–536. [Google Scholar] [CrossRef]
  53. Fitzsimmons, J.A.; Fitzsimmons, M.J.; Bordoloi, S. Service Management: Operations, Strategy, and Information Technology, 8th ed.; McGraw-Hill: New York, NY, USA, 2014; ISBN 9780077841201. [Google Scholar]
  54. Surprenant, C.F.; Solomon, M.R. Predictability and Personalization in the Service Encounter. J. Mark. 1987, 86–96. [Google Scholar] [CrossRef]
  55. Voorhees, C.M.; Fombelle, P.W.; Gregoire, Y.; Bone, S.; Gustafsson, A.; Sousa, R.; Walkowiak, T. Service encounters, experiences and the customer journey: Defining the field and a call to expand our lens. J. Bus. Res. 2017, 79, 269–280. [Google Scholar] [CrossRef]
  56. Parasuraman, A.; Zeithaml, V.; Berry, L. Reassessment of expectations as a comparison standard in measuring service quality: Implications for further research. J. Mark. 1994, 111–124. [Google Scholar] [CrossRef]
  57. Lynn, M.L.; Lytle, R.S.; Bobek, S. Service Orientation in Transitional Markets: Does it matter? Eur. J. Mark. 2000, 34, 279–298. [Google Scholar] [CrossRef]
  58. Gremler, D.D.; Brown, S.W. The loyalty ripple effect. Int. J. Serv. Ind. Manag. 1999, 10, 271–293. [Google Scholar] [CrossRef]
  59. Solomon, M.R.; Surprenant, C.; Czepiel, J.A.; Gutman, E.G. Role Theory Perspective on Dyadic Relations: The service encounter. J. Mark. 1985, 49, 99–111. [Google Scholar] [CrossRef]
  60. Carlzon, J. Moments of Truth; Harper & Row: New York, NY, USA, 1987; ISBN 9780060915803. [Google Scholar]
  61. Mittal, B.; Lassar, W.M. The role of personalization in service encounters. J. Retail. 1996, 72, 95–109. [Google Scholar] [CrossRef]
  62. Bitner, M.J.; Booms, B.H.; Tetreault, M.S. The Service Encounter: Diagnosing Favorable and Unfavorable Incidents. J. Mark. 1990, 71–84. [Google Scholar] [CrossRef]
  63. Wirtz, J.; Heracleous, L. Managing human resources for service excellence and cost effectiveness at Singapore Airlines. Manag. Serv. Qual. 2008, 18, 4–19. [Google Scholar] [CrossRef]
  64. Paquet, C.; St-Arnaud-McKenzie, D.; Ferland, G.; Dubé, L. A blueprint-based case study analysis of nutrition services provided in a midterm care facility for the elderly. J. Am. Diet. Assoc. 2003, 103, 363–368. [Google Scholar] [CrossRef] [PubMed]
  65. Kim, H.-W.; Kim, Y.-G. Rationalizing the customer service process. Bus. Process Manag. J. 2001, 7, 139–156. [Google Scholar] [CrossRef]
  66. Geum, Y.; Park, Y. Designing the sustainable product-service integration: A product-service blueprint approach. J. Clean. Prod. 2011, 19, 1601–1614. [Google Scholar] [CrossRef]
  67. Hossain, M.Z.; Enam, F.; Farhana, S. Service Blueprint a Tool for Enhancing Service Quality in Restaurant Business. Am. J. Ind. Bus. Manag. 2017, 7, 919–926. [Google Scholar] [CrossRef]
  68. Gupta, H. Evaluating service quality of airline industry using hybrid best worst method and VIKOR. J. Air Transp. Manag. 2018, 68, 35–47. [Google Scholar] [CrossRef]
  69. Tsafarakis, S.; Kokotas, T.; Pantouvakis, A. A multiple criteria approach for airline passenger satisfaction measurement and service quality improvement. J. Air Transp. Manag. 2018, 68, 61–75. [Google Scholar] [CrossRef]
  70. Gursoy, D.; Chen, M.H.; Kim, H.J. The US airlines relative positioning based on attributes of service quality. Tour. Manag. 2005, 26, 57–67. [Google Scholar] [CrossRef]
  71. Park, J.W.; Robertson, R.; Wu, C.L. The effect of airline service quality on passengers’ behavioural intentions: A Korean case study. J. Air Transp. Manag. 2004, 10, 435–439. [Google Scholar] [CrossRef]
  72. Tsaura, S.H.; Chang, T.Y.; Yen, C.H. The evaluation of airline service quality by fuzzy MCDM. Tour. Manag. 2002, 23, 107–115. [Google Scholar] [CrossRef] [Green Version]
  73. Bamford, D.; Xystouri, T. A case study of service failure and recovery within an international airline. Manag. Serv. Qual. 2005, 15, 306–322. [Google Scholar] [CrossRef]
  74. Kim, I.; Bong, Y.; Cho, M. Service Blueprint of the Young Kids Customers’ Specialized In-flight Service Utilizing Kano Model Analysis. J. Tour. Sci. 2015, 39, 71–90. [Google Scholar]
  75. Lee, J.-M.; Kim, Y.-S.; Lee, D.-W. Analyzing the Service Blueprint for Aircraft Cabin Service. J. Korean Soc. Qual. Manag. 2010, 38, 593–600. [Google Scholar]
  76. Go, M.; Kim, I. In-flight NCCI management by combining the Kano model with the service blueprint: A comparison of frequent and infrequent flyers. Tour. Manag. 2018, 69, 471–486. [Google Scholar] [CrossRef]
  77. Skytrax. Available online: https://skytraxratings.com/ (accessed on 26 October 2018).
  78. Witell, L.; Kristensson, P.; Gustafsson, A.; Löfgren, M. Idea generation: Customer co-creation versis traditional market research techniques. J. Serv. Manag. 2011, 22, 140–159. [Google Scholar] [CrossRef]
  79. Wirtz, J.; Kuan Tambyah, S.; Mattila, A.S. Organizational learning from customer feedback received by service employees. J. Serv. Manag. 2010, 21, 363–387. [Google Scholar] [CrossRef]
  80. Gao, B.; Li, X.; Liu, S.; Fang, D. How power distance affects online hotel ratings: The positive moderating roles of hotel chain and reviewers’ travel experience. Tour. Manag. 2018, 65, 176–186. [Google Scholar] [CrossRef]
  81. Skytrax. Available online: https://www.worldairlineawards.com/the-worlds-top-100-airlines-2017/ (accessed on 26 October 2018).
  82. Xiang, Z.; Schwartz, Z.; Gerdes, J.H.; Uysal, M. What can big data and text analytics tell us about hotel guest experience and satisfaction? Int. J. Hosp. Manag. 2015, 44, 120–130. [Google Scholar] [CrossRef]
  83. Inmarsat Aviation. The Future of Inflight Retail. 2016. Available online: https://www.inmarsataviation.com/en/benefits/revenue-opportunities/the-future-of-inflight-retail.html (accessed on 30 October 2018).
  84. McMillan, S.; Hwang, J. Measures of Perceived Interactivity: An Exploration of the Role of Direction of Communication, User Control, and Time in Shaping Perceptions of Interactivity. J. Advert. 2002, 31, 29–42. [Google Scholar] [CrossRef]
  85. Zhong, N.; Li, Y.; Wu, S.T. Effective pattern discovery for text mining. IEEE Trans. Knowl. Data Eng. 2012, 24, 30–44. [Google Scholar] [CrossRef] [Green Version]
  86. Hoffman, K.D.; Bateson, J.E.G. Services Marketing, 4th ed.; South-Western Cengage Learning: Mason, OH, USA, 2010; ISBN 9781439039397. [Google Scholar]
  87. Ahrholdt, D.C.; Gudergan, S.P.; Ringle, C.M. Enhancing Service Loyalty: The Roles of Delight, Satisfaction, and Service Quality. J. Travel Res. 2017, 56, 436–450. [Google Scholar] [CrossRef]
  88. Umashankar, N.; Ward, M.K.; Dahl, D.W. The Benefit of Becoming Friends: Complaining After Service Failures Leads Customers with Strong Ties to increase loyalty. J. Mark. 2017, 81, 79–98. [Google Scholar] [CrossRef]
  89. Keaveney, S.M. Customer Switching Behavior in Service Industries: An exploratory study. J. Mark. 1995, 59, 71–82. [Google Scholar] [CrossRef]
Figure 1. The proposed research model.
Sustainability 10 04492 g001
Figure 2. Naming process. The left and right panels depict the first and second steps in naming topics, respectively. The first step is the selection process of service encounters while comparing the benchmark and LDA results with the help of the professor group, including the authors. In the left panel, the first and second columns represent the selection process during the comparison and the third column shows the selected results after the comparison. The dashed boxes denote removed or created encounters. The second step is the final naming process of topics as matching topics to the selected service encounters in the first step with the help of a graduate student group, excluding the authors.
Sustainability 10 04492 g002
Figure 3. Word probability distribution of divergence.
Sustainability 10 04492 g003
Figure 4. Groups by divergence ratio. On the basis value of 1, the service encounters are divided into three groups: high (>1, meal service and passenger relaxation), medium (≈1, boarding), low (<1, reservation, pre-boarding and take-off). Reservation, dashed point, is not included in the actual SB.
Sustainability 10 04492 g004
Figure 5. Complexity-divergence matrix of service encounters. A solid oval means the current perceived status of a service encounter in the complexity and divergence matrix. A dotted oval denotes the proposed (ideal) status of a service encounter in the matrix and demands changes in the current level. Pre-boarding and boarding should increase the level of divergence and take-off; meal service and passenger relaxation may maintain the current position.
Sustainability 10 04492 g005
Figure 6. Redesigned service blueprint. The top panel shows the part of the SB form in Shostack [27], Bitner et al. [30], and Go and Kim [76], and the bottom panel zooms in on the row of front-stage actions where the proposed service encounters exist. The redesigned SB consists of eight service encounters in terms of complexity. The divergence of a service encounter is represented by a circular sector and the level of divergence is determined by the size of the angle in the sector. A solid line denotes the perceived level and a dotted line denotes the proposed (ideal) level of divergence. Pre-boarding and boarding need to increase the level and take-off; meal service and relaxation can maintain the current level of divergence.
Sustainability 10 04492 g006
Table 1. Online review data.
BRCAEKEYGAHULHNHSQQR
Review #s1506537716,20010,78962963507080135879607790
Rank65481097321
Table 2. LDA naming results. The importance is the sum of the importance of related topics. The form of service encounters in the parenthesis denotes the shortened form of the service encounters.
Service EncounterDefinitionTopicsImportance
ReservationRelated to reservationsT3, T12, T1617%
Pre-boarding service
(pre-boarding)
Related actions from airport check-in to boarding gate arrivalT5, T7, T917%
Boarding & ground service (boarding)Related actions from boarding to taking a seatT2, T1711%
Take-off safety check
(take-off)
Actions related to take-off and safety checkT14, T1511%
Meal & beverage service
(meal service)
Actions related to meal serviceT66%
Passenger relaxationActions related to personal resting and entertaining within a flightT1, T8, T10, T11, T13, T1833%
Deplaning & post-deplaning (deplaning)Actions related to landing and deplaningT45%
Table 3. Reorganized in-flight service encounters.
Benchmark Service EncountersTopic Modeling ResultsReorganized Service Encounters
-Reservation-
-Pre-boarding servicePre-boarding service
Boarding a planeBoarding & ground serviceBoarding & ground service
Finding seats
Baggage service
Ground service
Take-off safety checkTake-off safety checkTake-off safety check
In-flight food serviceMeal & beverage serviceMeal & beverage service
In-flight sales--
Preparing immigration documents-Preparing immigration documents
Movie watchingPassenger relaxationPassenger relaxation
Personal relaxing
Preparing landing--
LandingLanding
DeplaningDeplaningDeplaning & post-deplaning

