Article

Spatio-Temporal Variation in Dryland Wheat Yield in Northern Chinese Areas: Relationship with Precipitation, Temperature and Evapotranspiration

1
College of Agronomy, Northwest A&F University, No. 3 Taicheng Road, Yangling 712100, Shaanxi, China
2
Key Laboratory of Crop Physi-ecology and Tillage Science in Northwestern Loess Plateau, Ministry of Agriculture, Northwest A&F University, Yangling 712100, Shaanxi, China
*
Authors to whom correspondence should be addressed.
Sustainability 2018, 10(12), 4470; https://doi.org/10.3390/su10124470
Submission received: 20 October 2018 / Revised: 26 November 2018 / Accepted: 26 November 2018 / Published: 28 November 2018

Abstract

:
Water supply constraints are recognized as major factors affecting regional dryland wheat production, but the details of these constraints have yet to be fully explored. We performed an analysis of field experiments conducted in northern Chinese areas during 1950–2017. Dryland wheat yields increased from the 1950s through to the 2010s at a rate of 110 kg ha–1 year–1. Yields increased most in regions with relatively high precipitation during wheat growth stage. Mean yields were 128% higher in regions with >300 mm precipitation than in regions with <100 mm. Yields were the highest when mean temperatures during wheat growth stage were in the range 4–8 °C. Mean yields were 1756 kg ha–1 in regions with <200 mm evapotranspiration (ET), and 5544 kg ha–1 in regions with >600 mm ET. Water limitation on yields decreased from the 1950s to the 2010s as precipitation during wheat growth stage increased through the regions. Yield increased significantly and linearly over time during the study period, with increasing precipitation during wheat growth stage, and with increasing ET. Overall, yield loss resulting from water deficit decreased from the 1950s through to the 2010s as precipitation during wheat growth stage increased through the drylands of northern Chinese areas.

Graphical Abstract

1. Introduction

Dryland makes an important contribution to global food security; 60% of food is from dryland without irrigation [1]. In the twenty-first century, agricultural irrigation water has reached its limit on the earth, and half of global wheat production occurs in irrigated cropping regions that face increasing water shortages [2]. In addition, irrigated agriculture is not sustainable in the future, and the overdraft of groundwater has resulted in a rapid decline in the groundwater table by approximately 1 m annually over the last 20 years in the North China Plain [3]. Elliott et al. (2014) reported that freshwater limitations in certain irrigated regions could necessitate the reversion of cropland from irrigated to reduced irrigation or rainfed management by the end of the century [4]. Meanwhile, China’s reliance on grain production from dryland is becoming greater, with the transferring from cereal crop to cash crop under irrigation resulting from the decrease in economic benefits of grain production. The percentage of dryland grain production of the total grain production of China increased from 41% in the 1980s to 56% in the 2010s [5].
The arid areas in North China are prone to drought and associated shortages of water for agriculture. The wheat yields are low and unstable in the region due to (i) limited water resources that are heterogeneously distributed in space and time, (ii) simple agricultural management practices, (iii) poor basic soil fertility, and (iv) relatively low farming inputs [6]. In this context, the following questions are of considerable relevance: (i) how variable was the wheat yield in northern Chinese areas through historical time, (ii) how variable were yields on geographical spatial scales, and (iii) which factors account for temporal and spatial variability? Many studies have used statistical data, modeling simulations, and remote sensing technology to analyze the spatio-temporal variation in cereal yield in China; they have analyzed the effects of climate change, human population growth, changes in land use patterns, and technical progress [7,8,9,10,11,12]. However, there are limited data for recent decades on the effects of temperature, precipitation and evapotranspiration (ET) during the crop growth phase.
We analyzed the characteristics and main driving factors of the spatial-temporal variation in dryland wheat yield. Our analysis used data from the many dryland field experiments conducted in northern Chinese areas during the period 1950–2017. Our specific objectives were (i) to describe the variation in dryland wheat yield in northern Chinese areas during this period, (ii) to investigate variability in wheat yield among geographical regions in northern Chinese areas with differing precipitation during the growth stage, (iii) to explore the effects of mean temperature and ET during the growth stage on spatio-temporal variation in wheat yield in northern Chinese areas, and (iv) to determine the effects of water deficit on spatio-temporal variation in yield loss.

2. Materials and Methods

2.1. Study Area

We studied the dryland agricultural regions of northern Chinese areas, including the provinces of Xinjiang, Gansu, Ningxia, Inner Mongolia, Shanxi, Shaanxi, Heilongjiang, Jilin, Liaoning, Hebei, Henan, Shandong, Beijing, and Tianjin (Figure 1).

2.2. Data Collection

On June 16, 2018, we searched the China National Knowledge Infrastructure and Web of Science databases for documents on dryland wheat yield in China during the period 1950–2018. We entered the following keywords in the search engines: wheat, dryland, rainfed, yield, and field.
The documents included in our database were all on monocultured winter wheat and spring wheat (i.e., bread wheat; Triticum aestivum L.) sown under dryland conditions (plot studies and greenhouse experiments were excluded) in northern Chinese areas.
The Web of Science and China National Knowledge Infrastructure databases yielded 7166 references, but no additional records were identified through other sources. We screened 2869 references by article title, and excluded 2182 references because they did not fit the study criteria. Then, we obtained 2115 references. We excluded 1846 full-text articles because they did not fit the study criteria. In total, we included 269 references (Supplementary Information S1) in our study. The sites at which experimental data were collected were mapped using ArcGIS software (ver. 10.2; ESRI, Redlands, CA, USA).

2.3. Building the Datasets

Data included year, site, precipitation during wheat growth stage, mean temperature during wheat growth stage, evapotranspiration (ET, total water consumption) during wheat growth stage and yields of dryland wheat obtained from the text, tables, and figures of the published papers. When original data were presented in graphical form only, we extracted numerical values using DataThief III software [13].
The years in the study period were grouped into seven categories: 1950s, 1960s, 1970s, 1980s, 1990s, 2000s, and 2010s. The geographic regions were grouped into four precipitation during wheat growth stage categories (<100, 100–200, 200–300, and >300 mm precipitation during wheat growth stage). Mean temperatures during wheat growth stage were divided into three categories: <4, 4–8, and >8 °C. ET variation was grouped into six categories (<200, 200–300, 300–400, 400–500, 500–600, and >600 mm).

2.4. Data Analyses

We identified factors affecting dryland wheat yield in different decades, and divided the actual yield (Y was from the published papers used in the study) into the trend yield (Yt), the meteorological yield (Ym), and the random yield (e). Y was calculated as follows [14]:
Y = Y t + Y m + e
where Yt is determined by agricultural production technologies, including wheat variety improvement, cultivation techniques, and agricultural policies. Ym is determined by meteorological factors and e is determined by stochastic factors; we did not include e in our calculations. Thus, Y was calculated as follows:
Y = Y t + Y m .
Yt was calculated as a 5-year sliding linear average:
Y t ( i ) = i 2 i + 2 Y i 5 .
Ym was calculated as:
Y m = Y Y t .
Water limitation on the yield (WLY, %) was calculated as:
W L Y = Y w Y d Y w × 100 %
where Yw (actual yield under irrigation) is yield with adequate irrigation, and Yd is the yield under the dryland condition.
The statistical analysis was performed with the SAS 2013 software package [15]. Analysis of variance was performed with the GLM procedure. Pairwise significant differences between means were identified by Duncan’s multiple range test. Correlation analysis was performed using the PROC CORR procedure in SAS software. All figures other than Figure 1 were created with SigmaPlot software (ver. 12.5; Systat Software Inc., San Jose, CA, USA).

3. Results

3.1. Temporal Variation in Yield

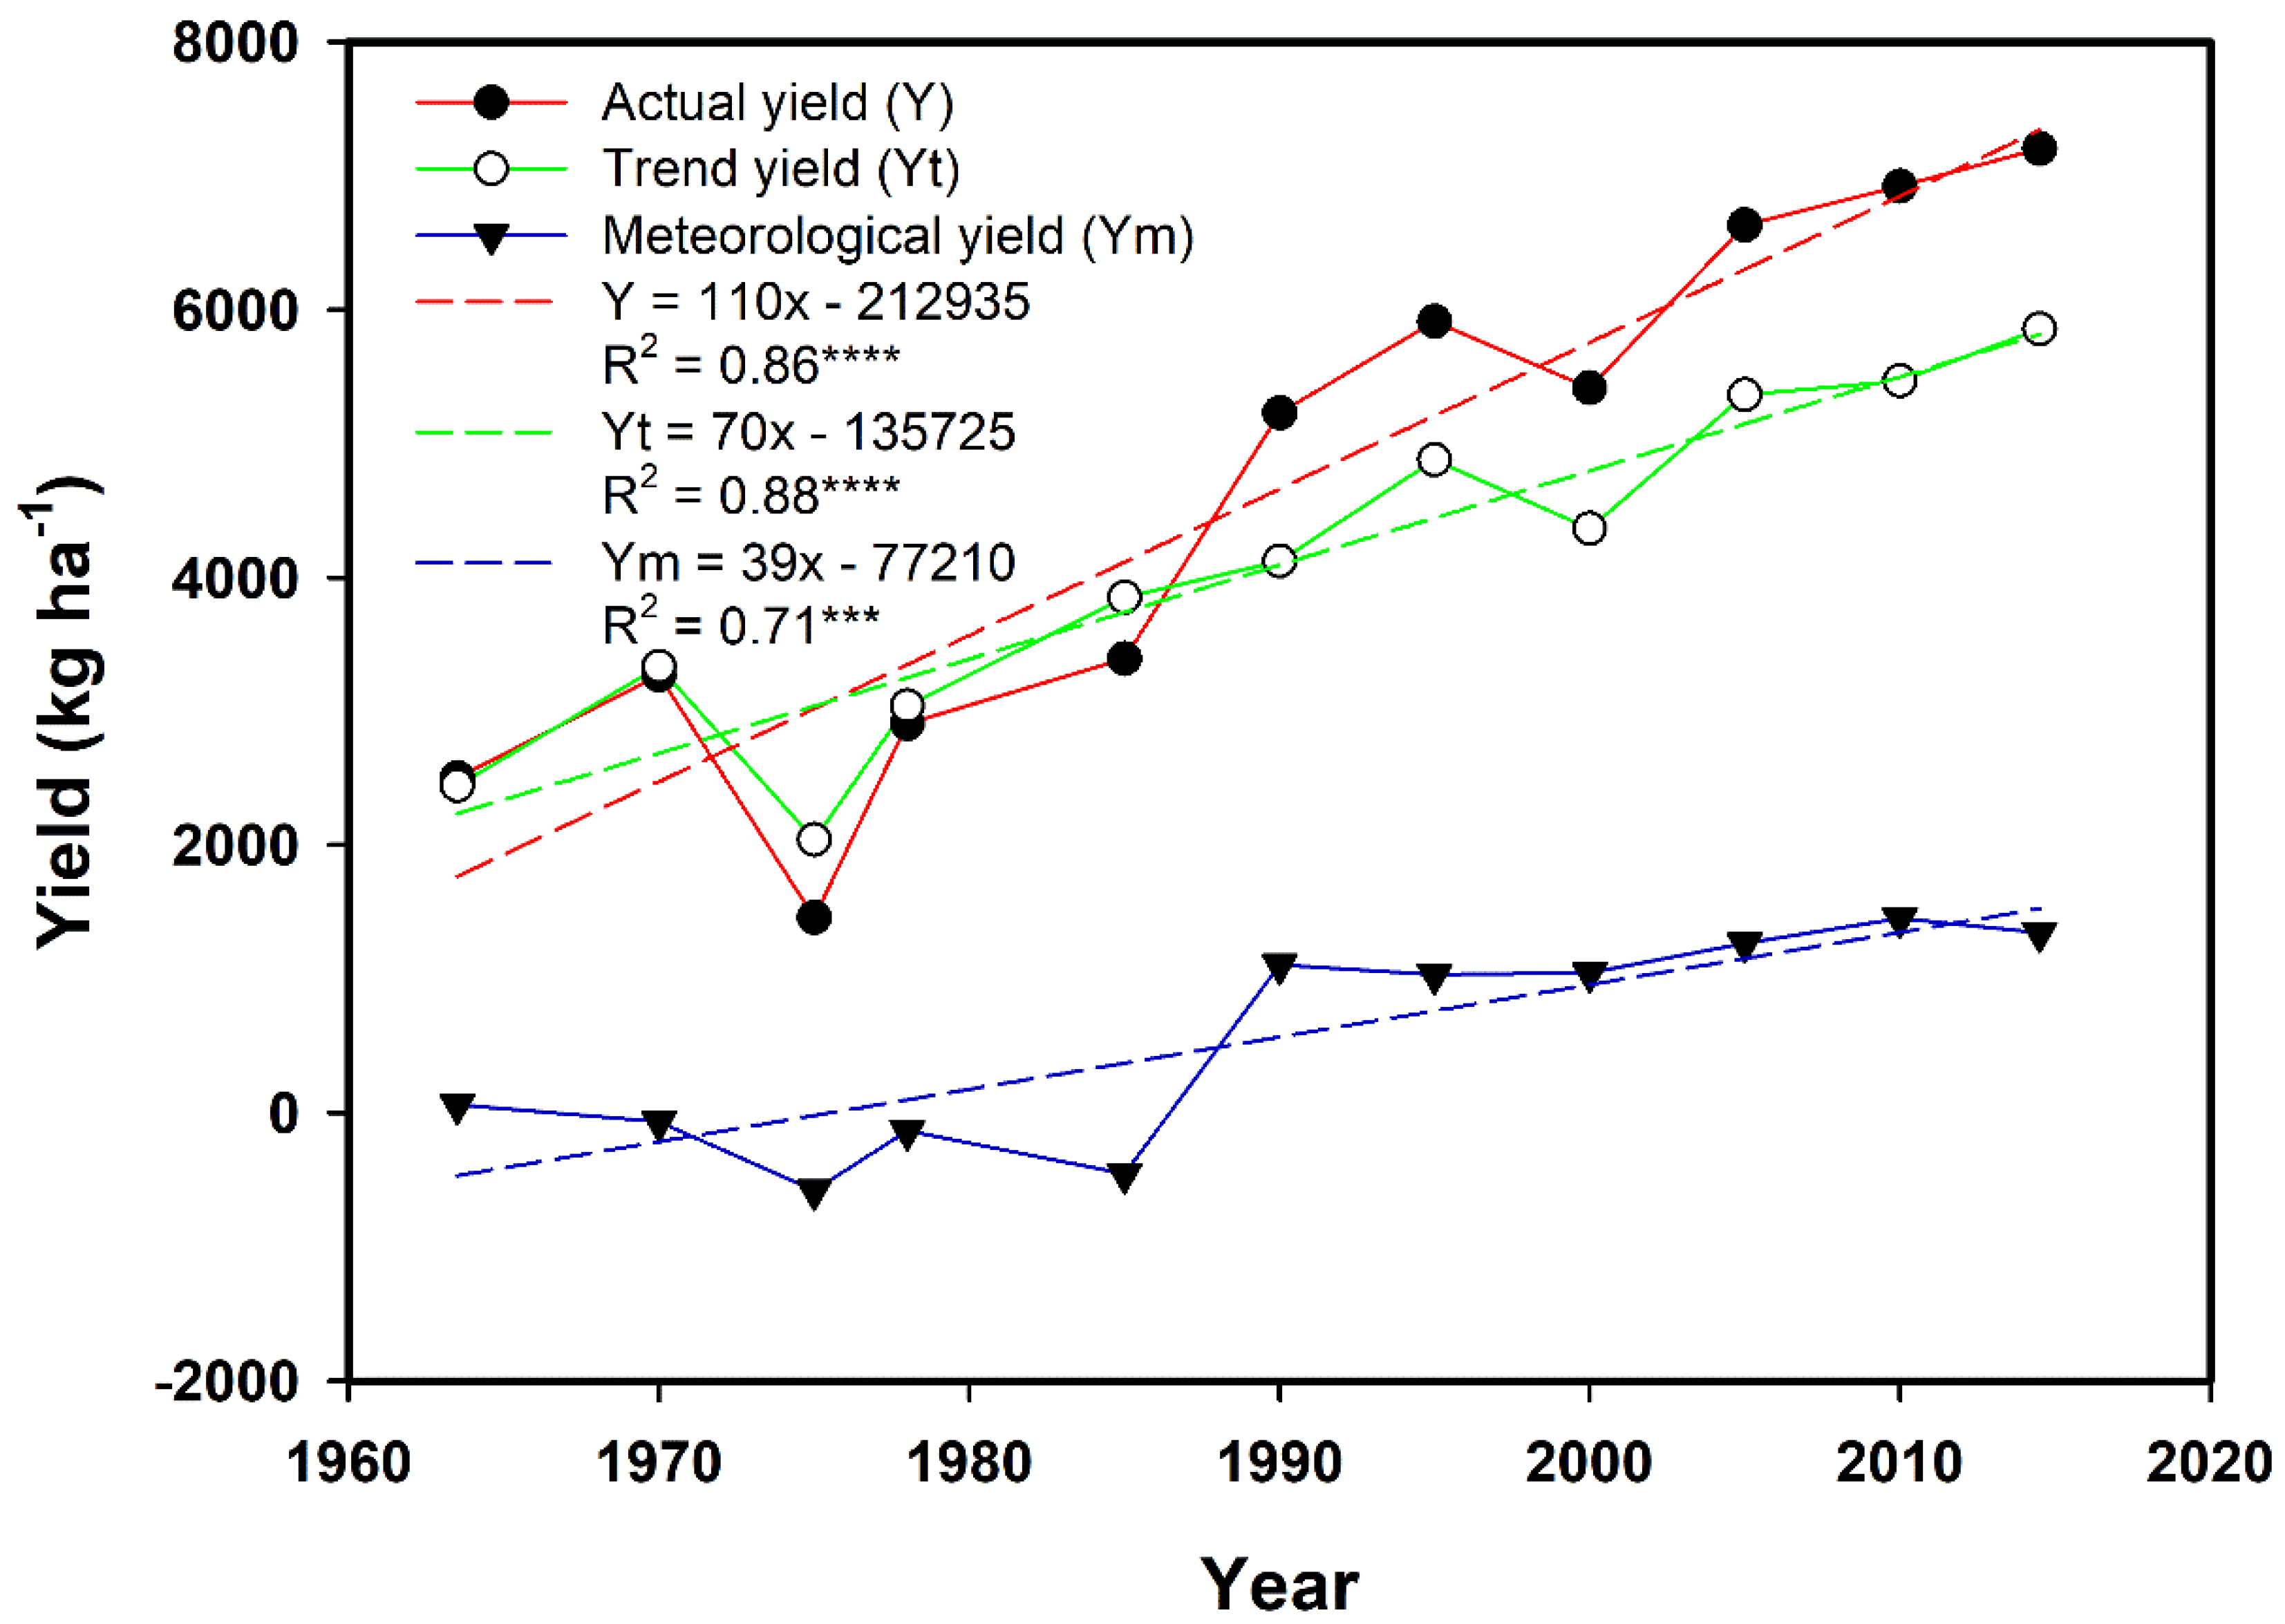
Y increased from the 1960s (2505 kg ha–1) to the 2010s (7204 kg ha–1) at a rate of 110 kg ha–1 year1 (Figure 2). Yt increased from 2444 kg ha–1 in 1960s to 5856 kg ha–1 in 2010s (Figure 2). Ym showed a decreasing trend during 1960s–1990s, and an increasing trend during 1990s–2010s (Figure 2).
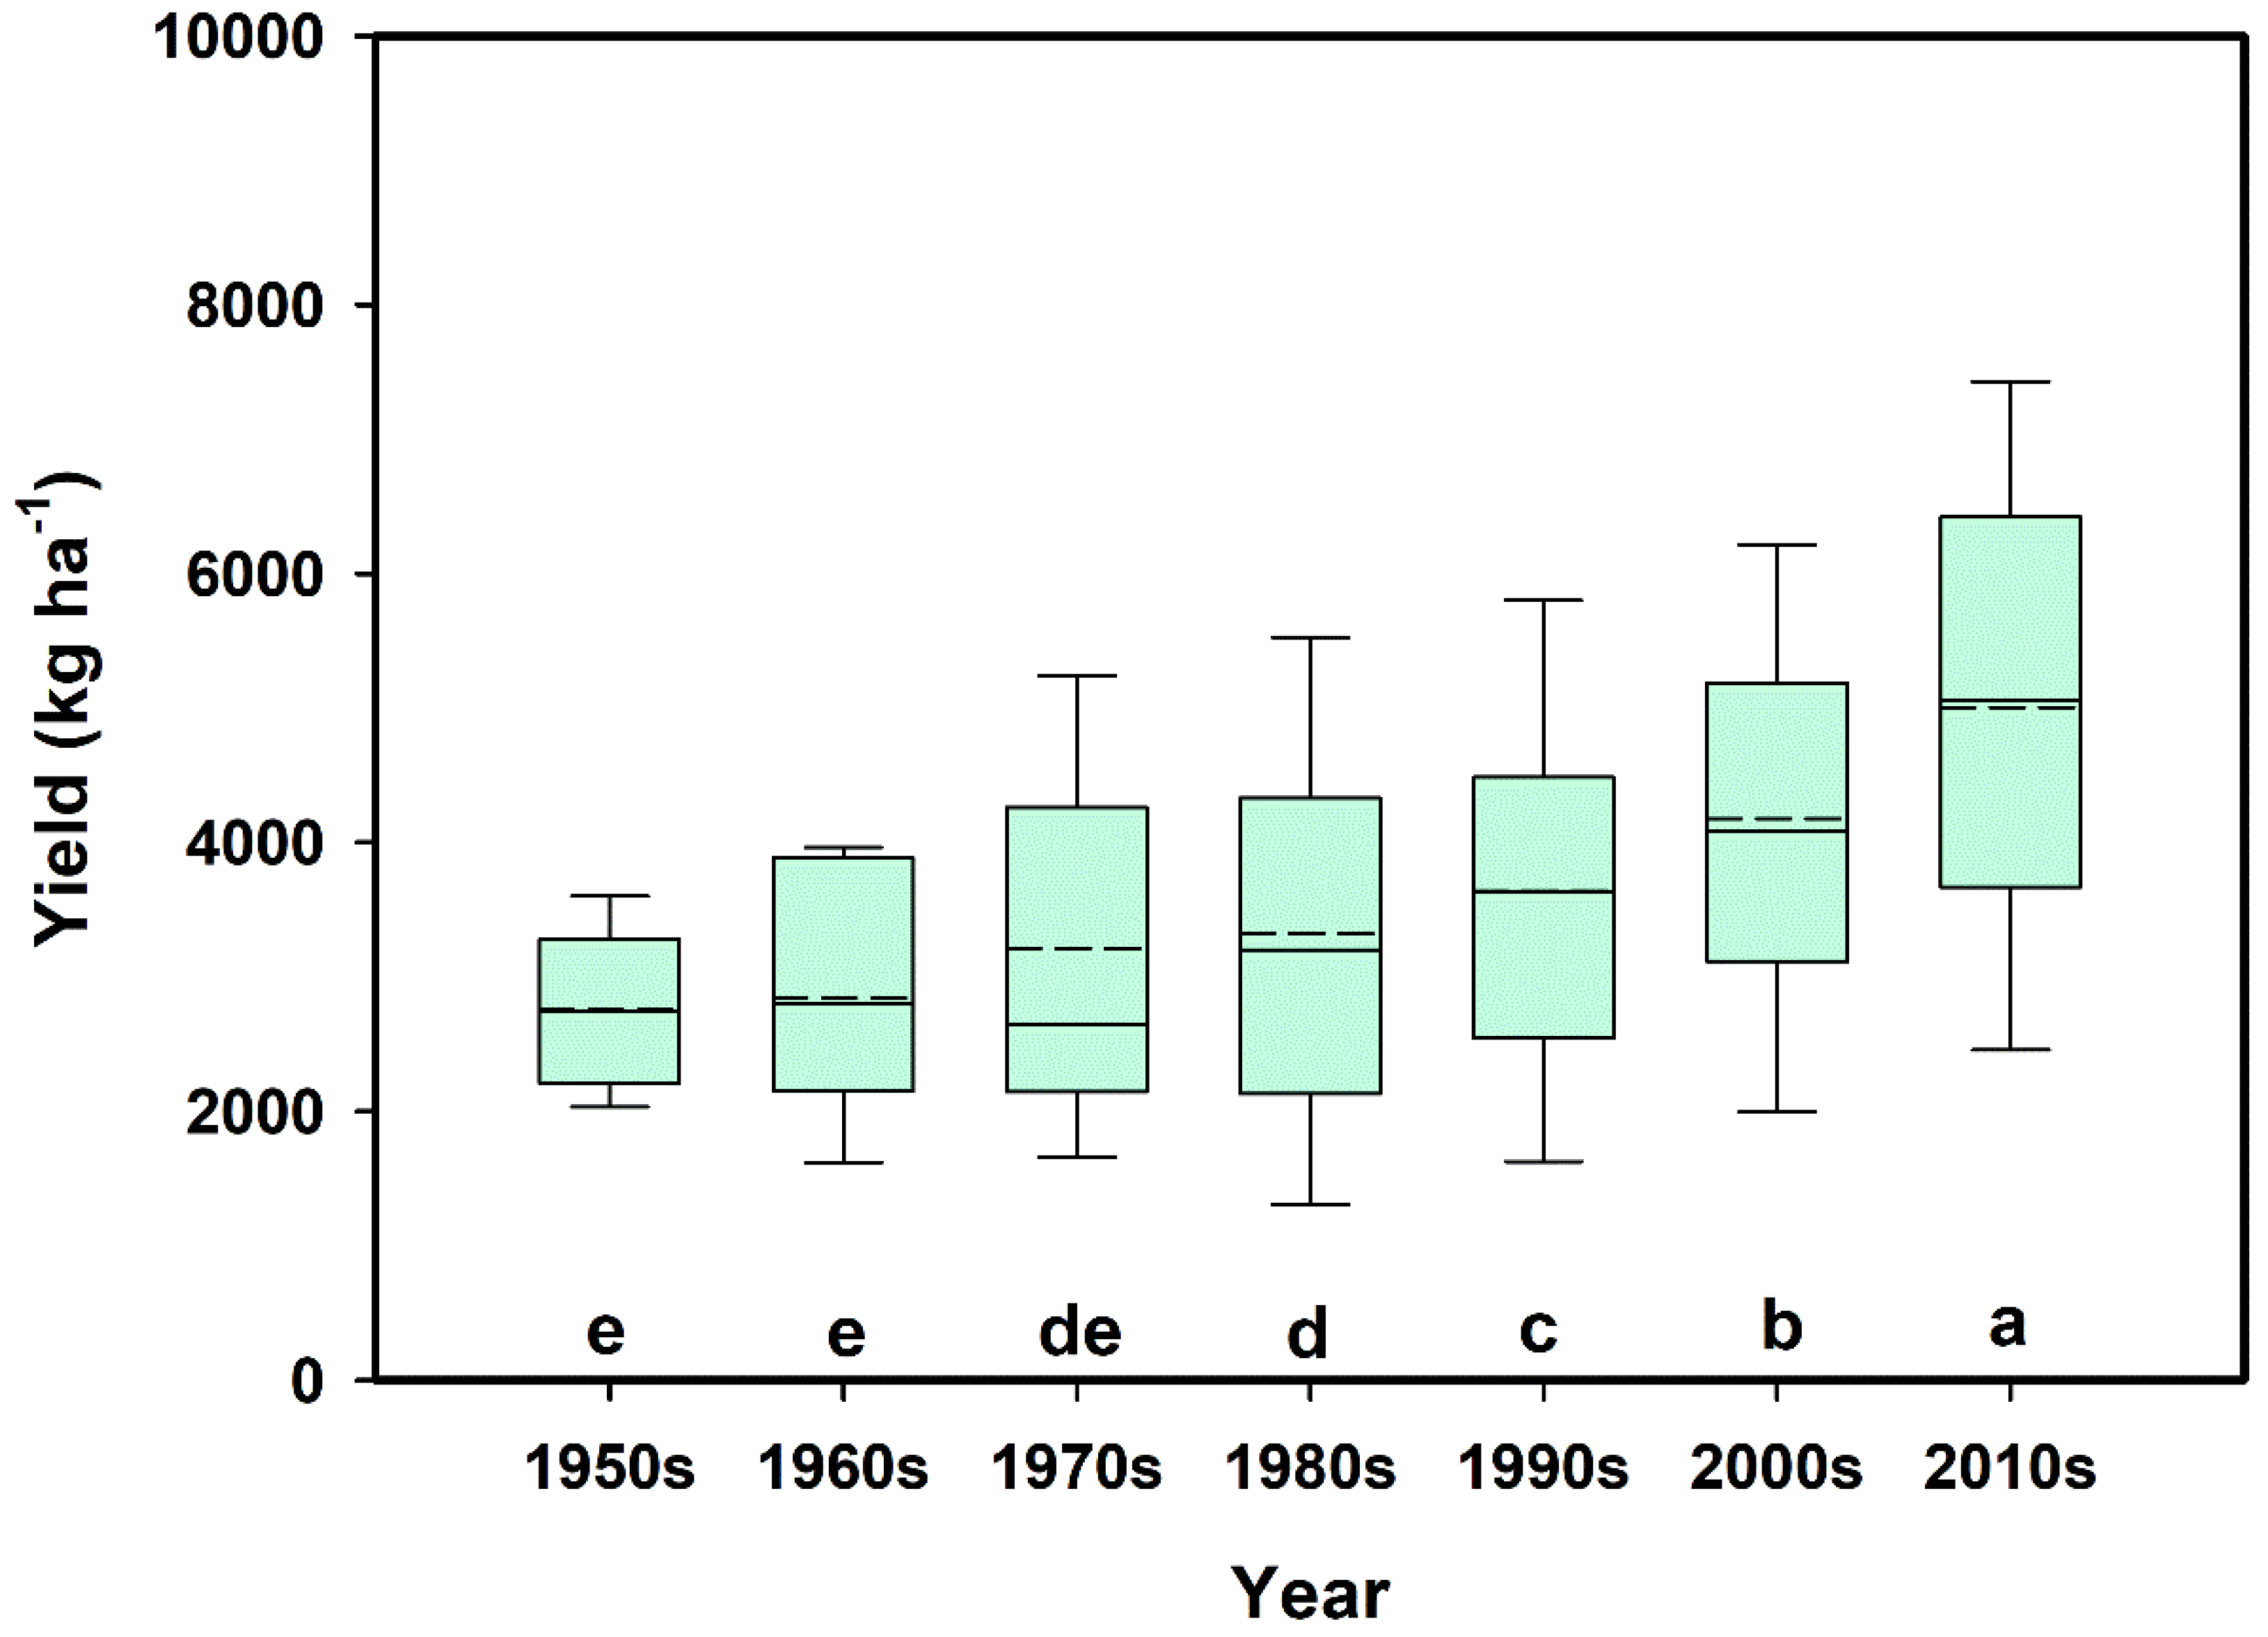
Yields followed an increasing trend after the 1950s (Figure 3). The yields in the 1970s were 311 kg ha–1 higher than in the 1950s (Figure 3). The yields in the 2000s were 28% higher than in the 1980s, and reached 4994 kg ha–1 within a decade (Figure 3).

3.2. Spatio Variation in Dryland Wheat Yield

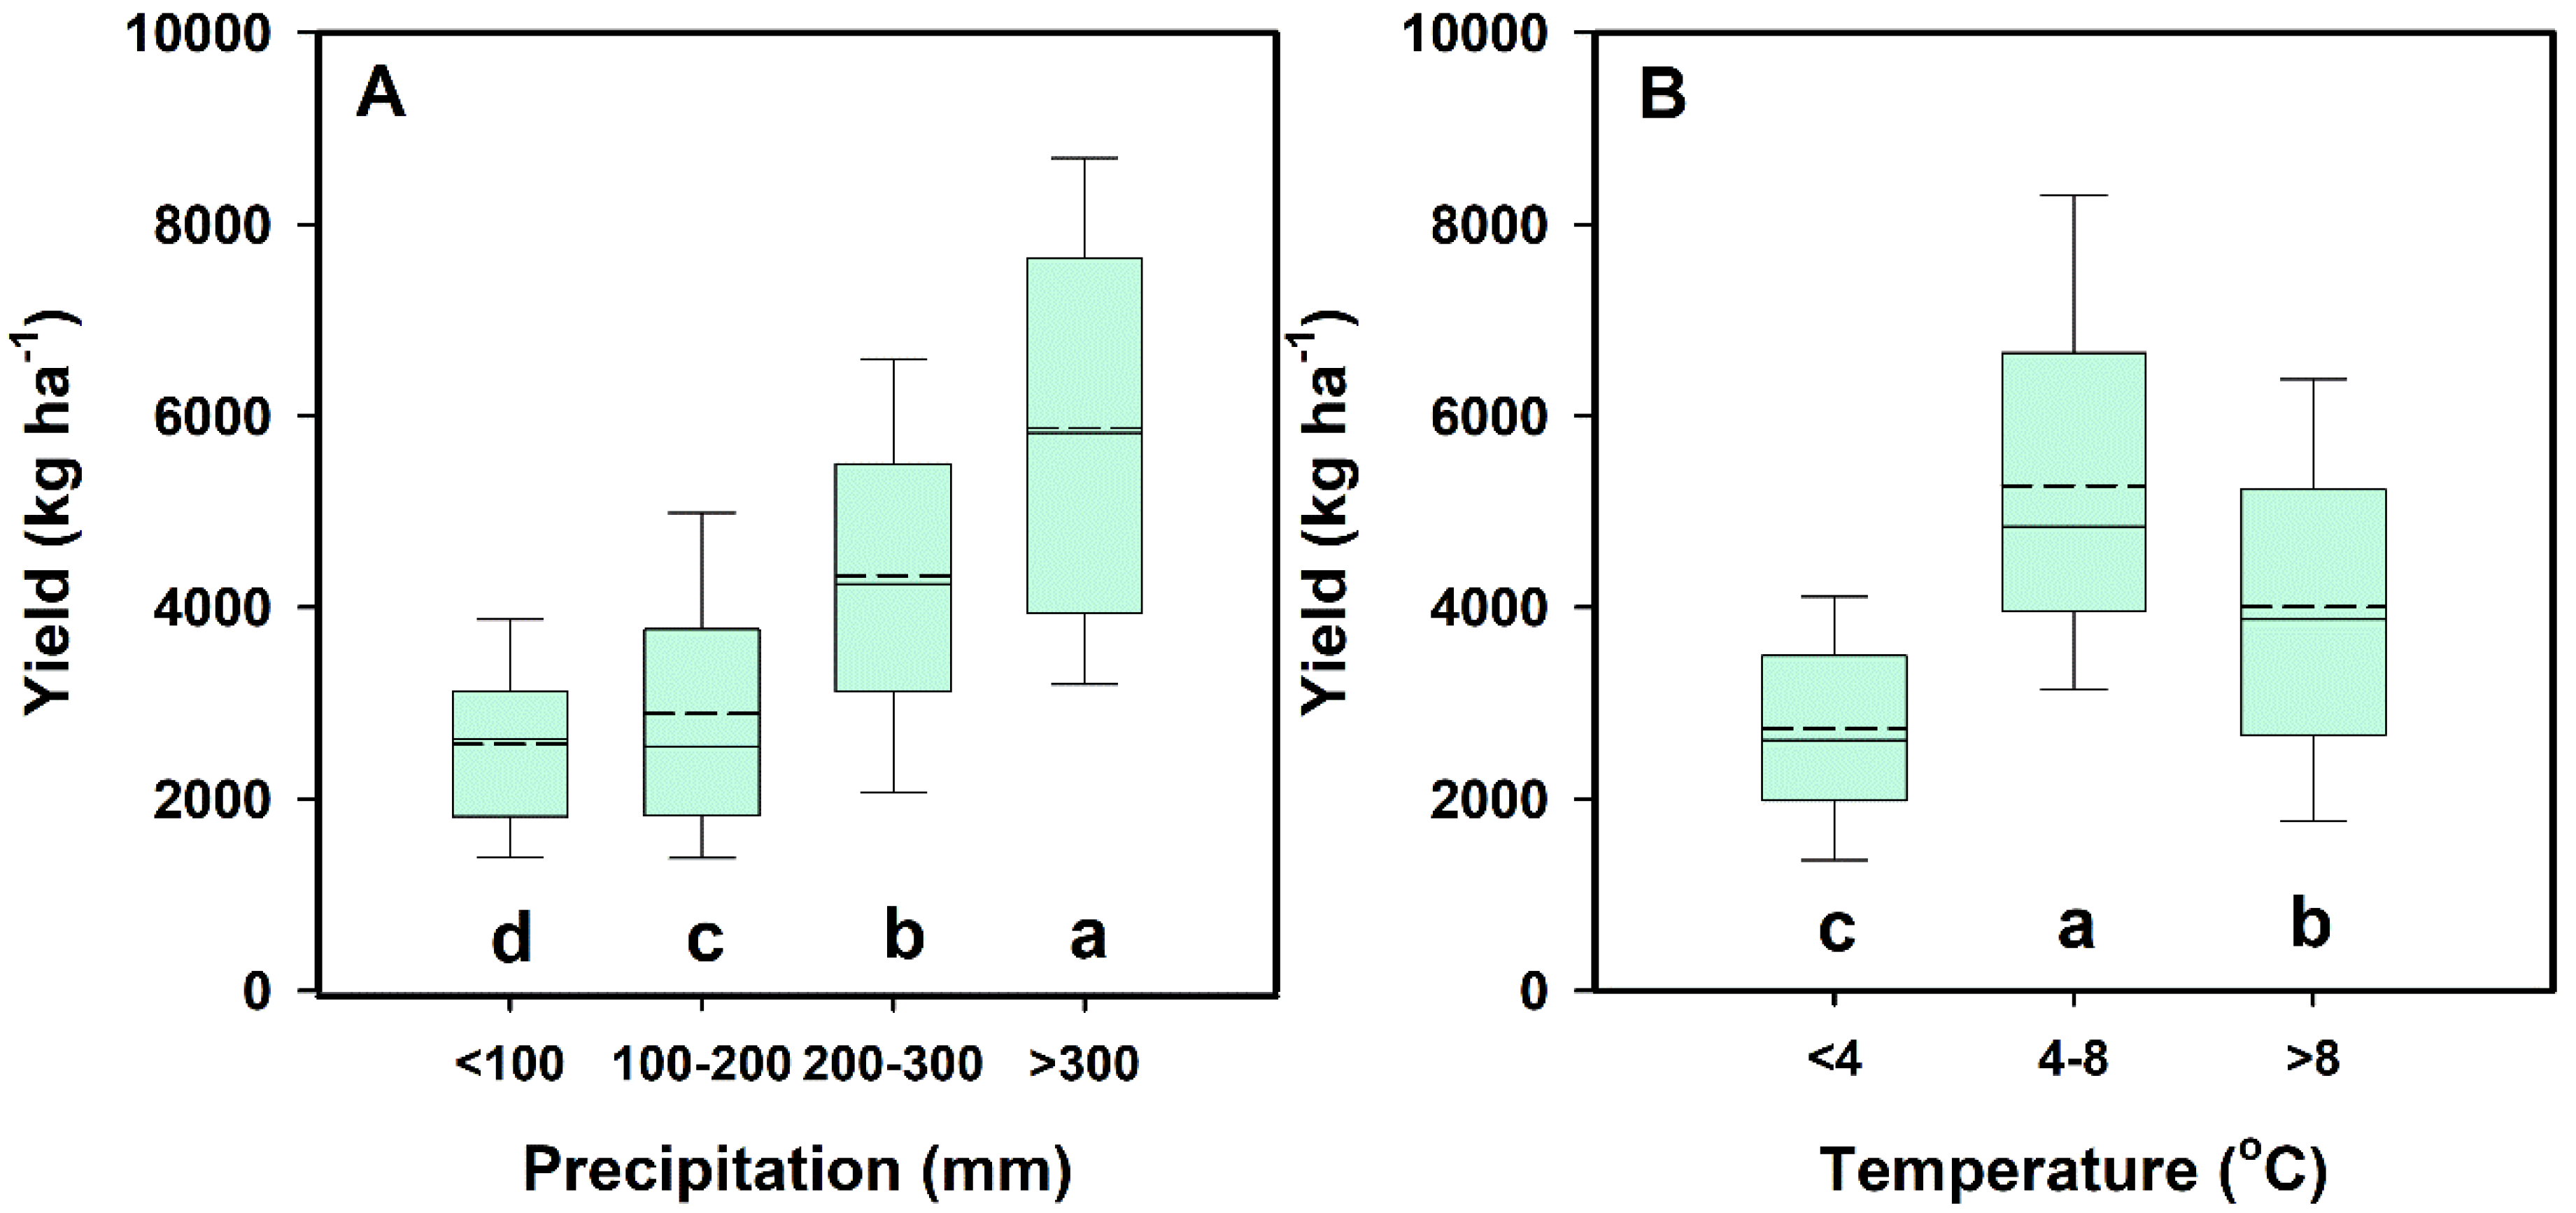
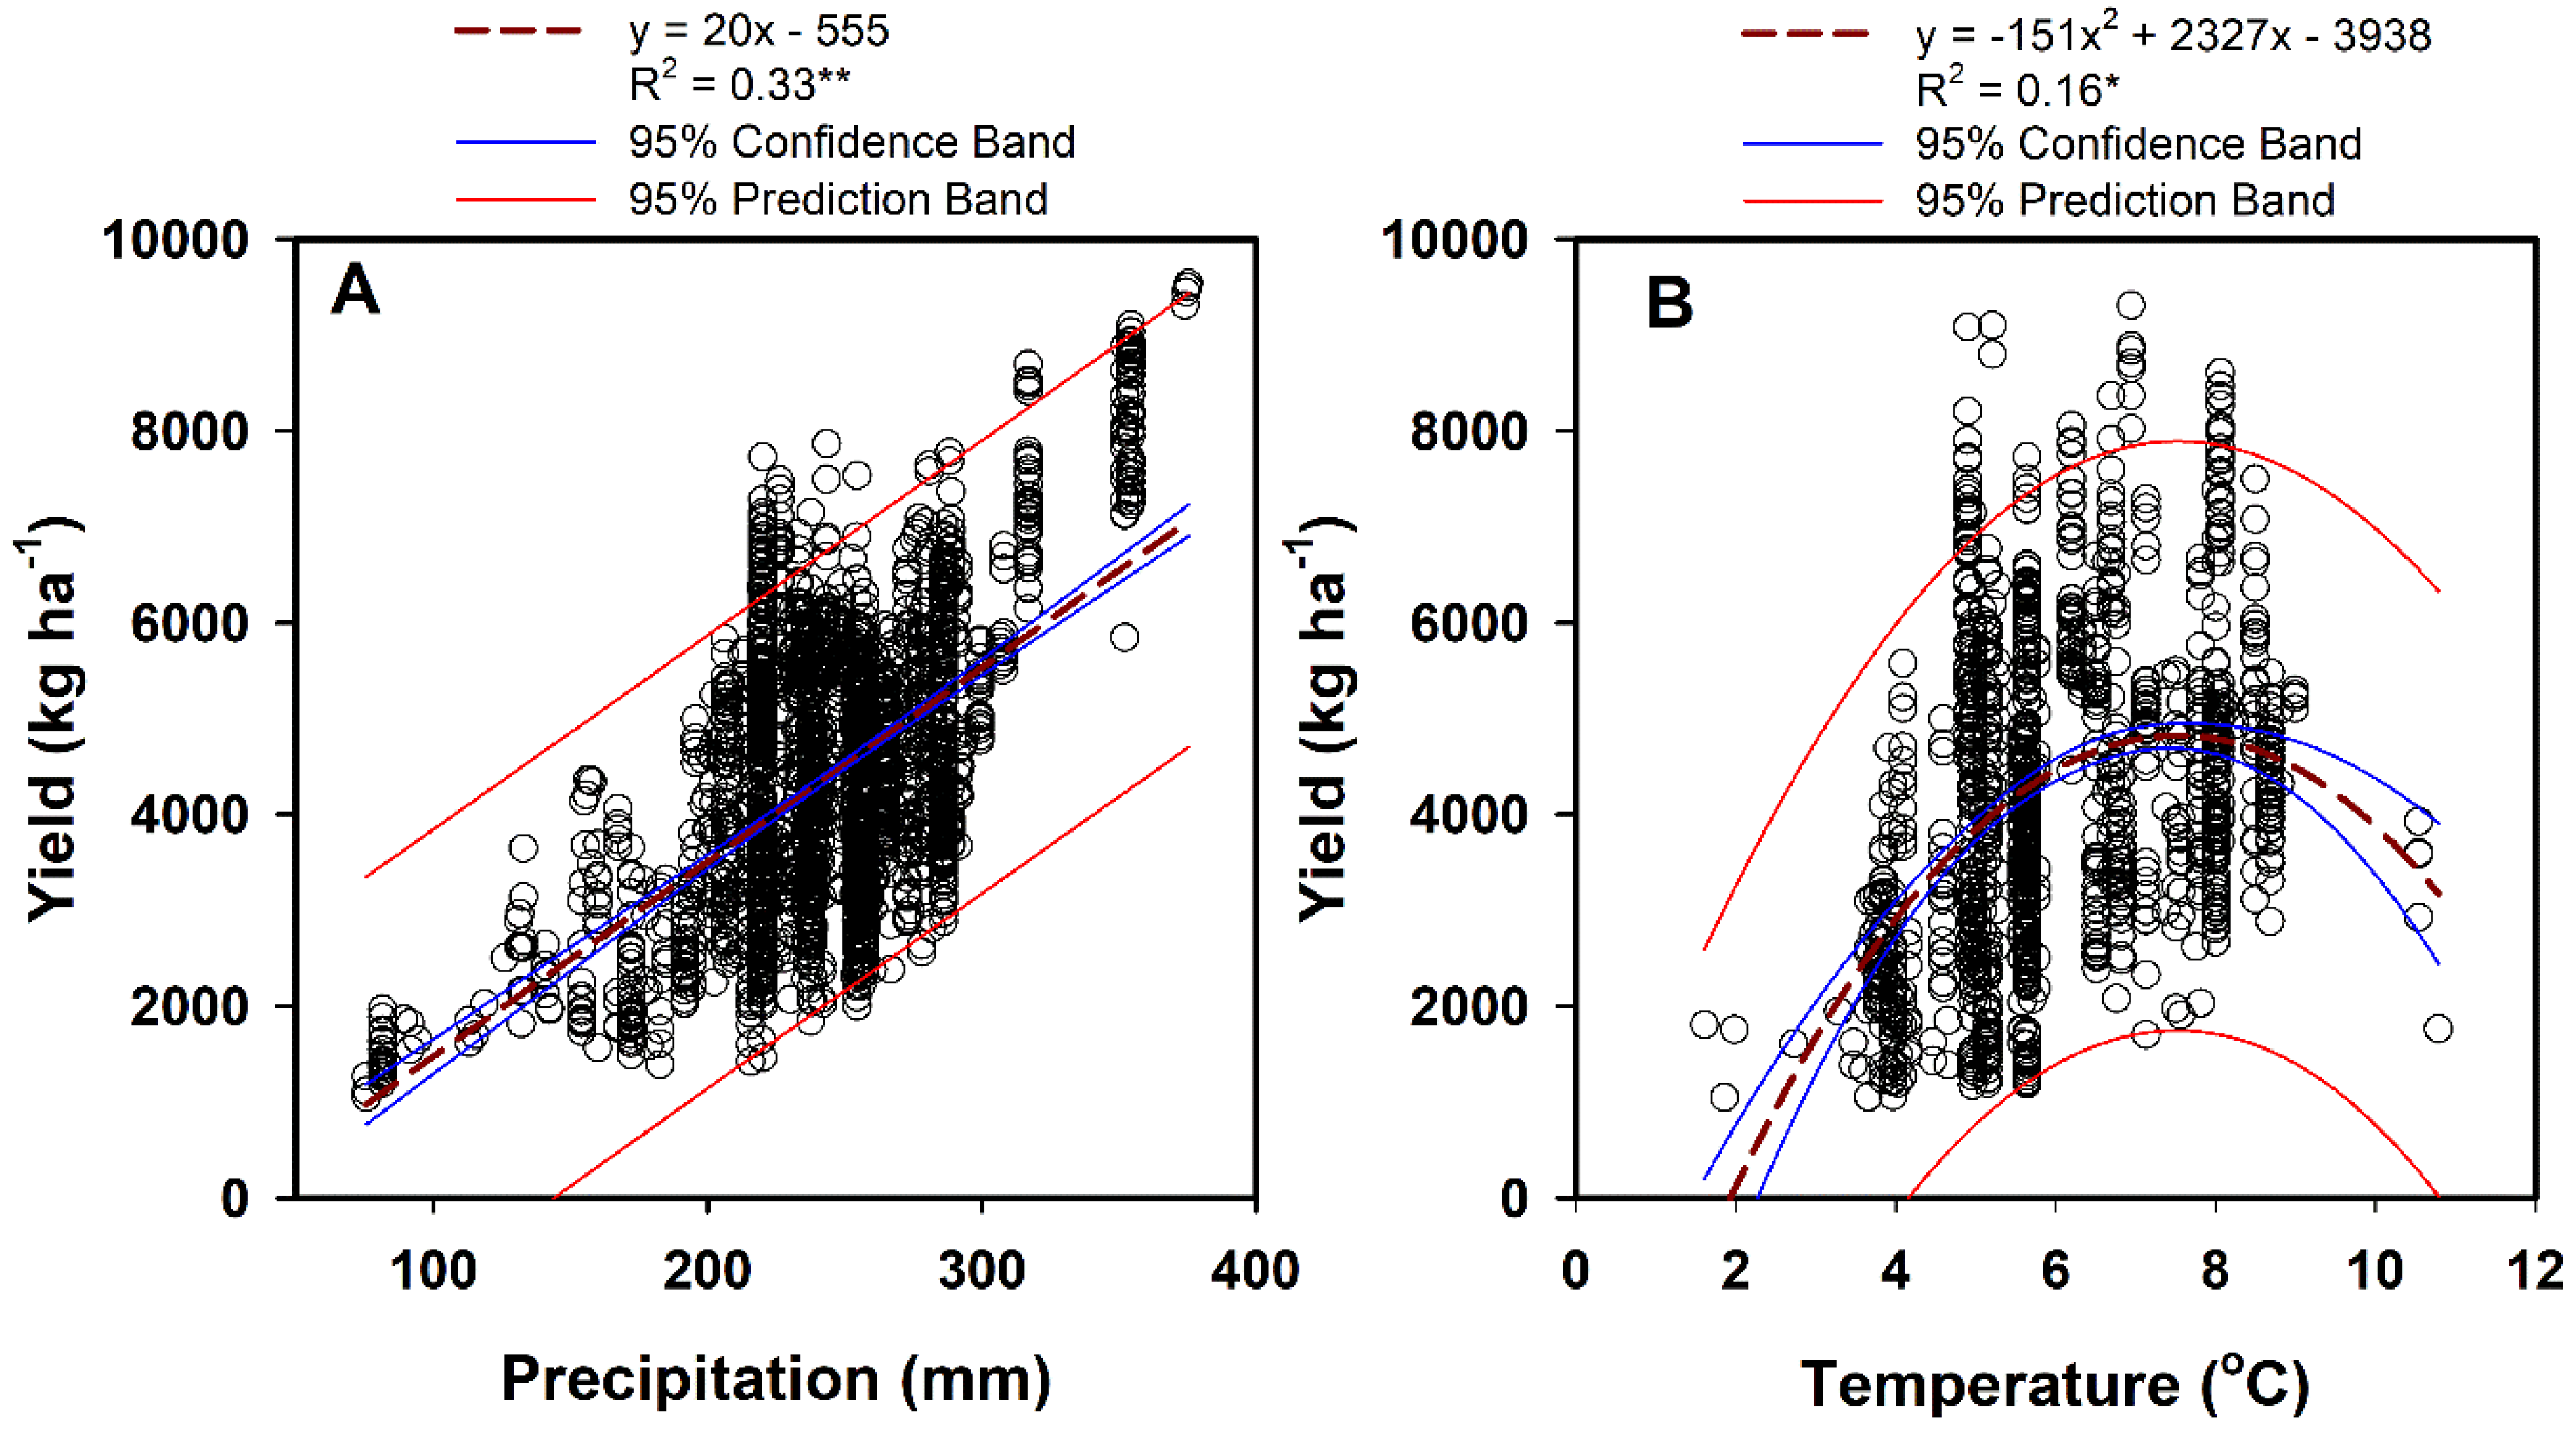
Yields varied greatly among precipitation during wheat growth stage regions (Figure 4A). The mean yield was 2574 kg ha–1 in regions with <100 mm precipitation, and 2894 kg ha–1 in regions with 100–200 mm precipitation (Figure 4A). The mean yield in the regions with 200–300 mm precipitation was 4332 kg ha–1, and there was 5878 kg ha–1 mean yield in regions with >300 mm precipitation (Figure 4A). The wheat yields were positively and significantly (p < 0.01) correlated with precipitation during wheat growth stage (Figure 5A). Thus, precipitation level was a major factor affecting wheat yields in agricultural regions that depended on rainfall during wheat growth stage.
Yields varied greatly among regions with different mean temperature during wheat growth stage (Figure 4B). The mean yield in regions with temperatures in the range <4 °C was 48% lower than in regions with temperatures 4–8 °C (Figure 4B). The mean yield in regions with temperatures in the range 4–8 °C was 32% higher than in regions with temperatures >8 °C (Figure 4B). There was a negative and significant (p < 0.05) parabolic relation between yield with mean temperature during wheat growth stage (Figure 5B). Thus, temperature level was a major factor affecting wheat yields in agricultural regions that depended on mean temperature during wheat growth stage.

3.3. Effects of Evapotranspiration (ET) on Spatio-Temporal Variation in Dryland Wheat Yield

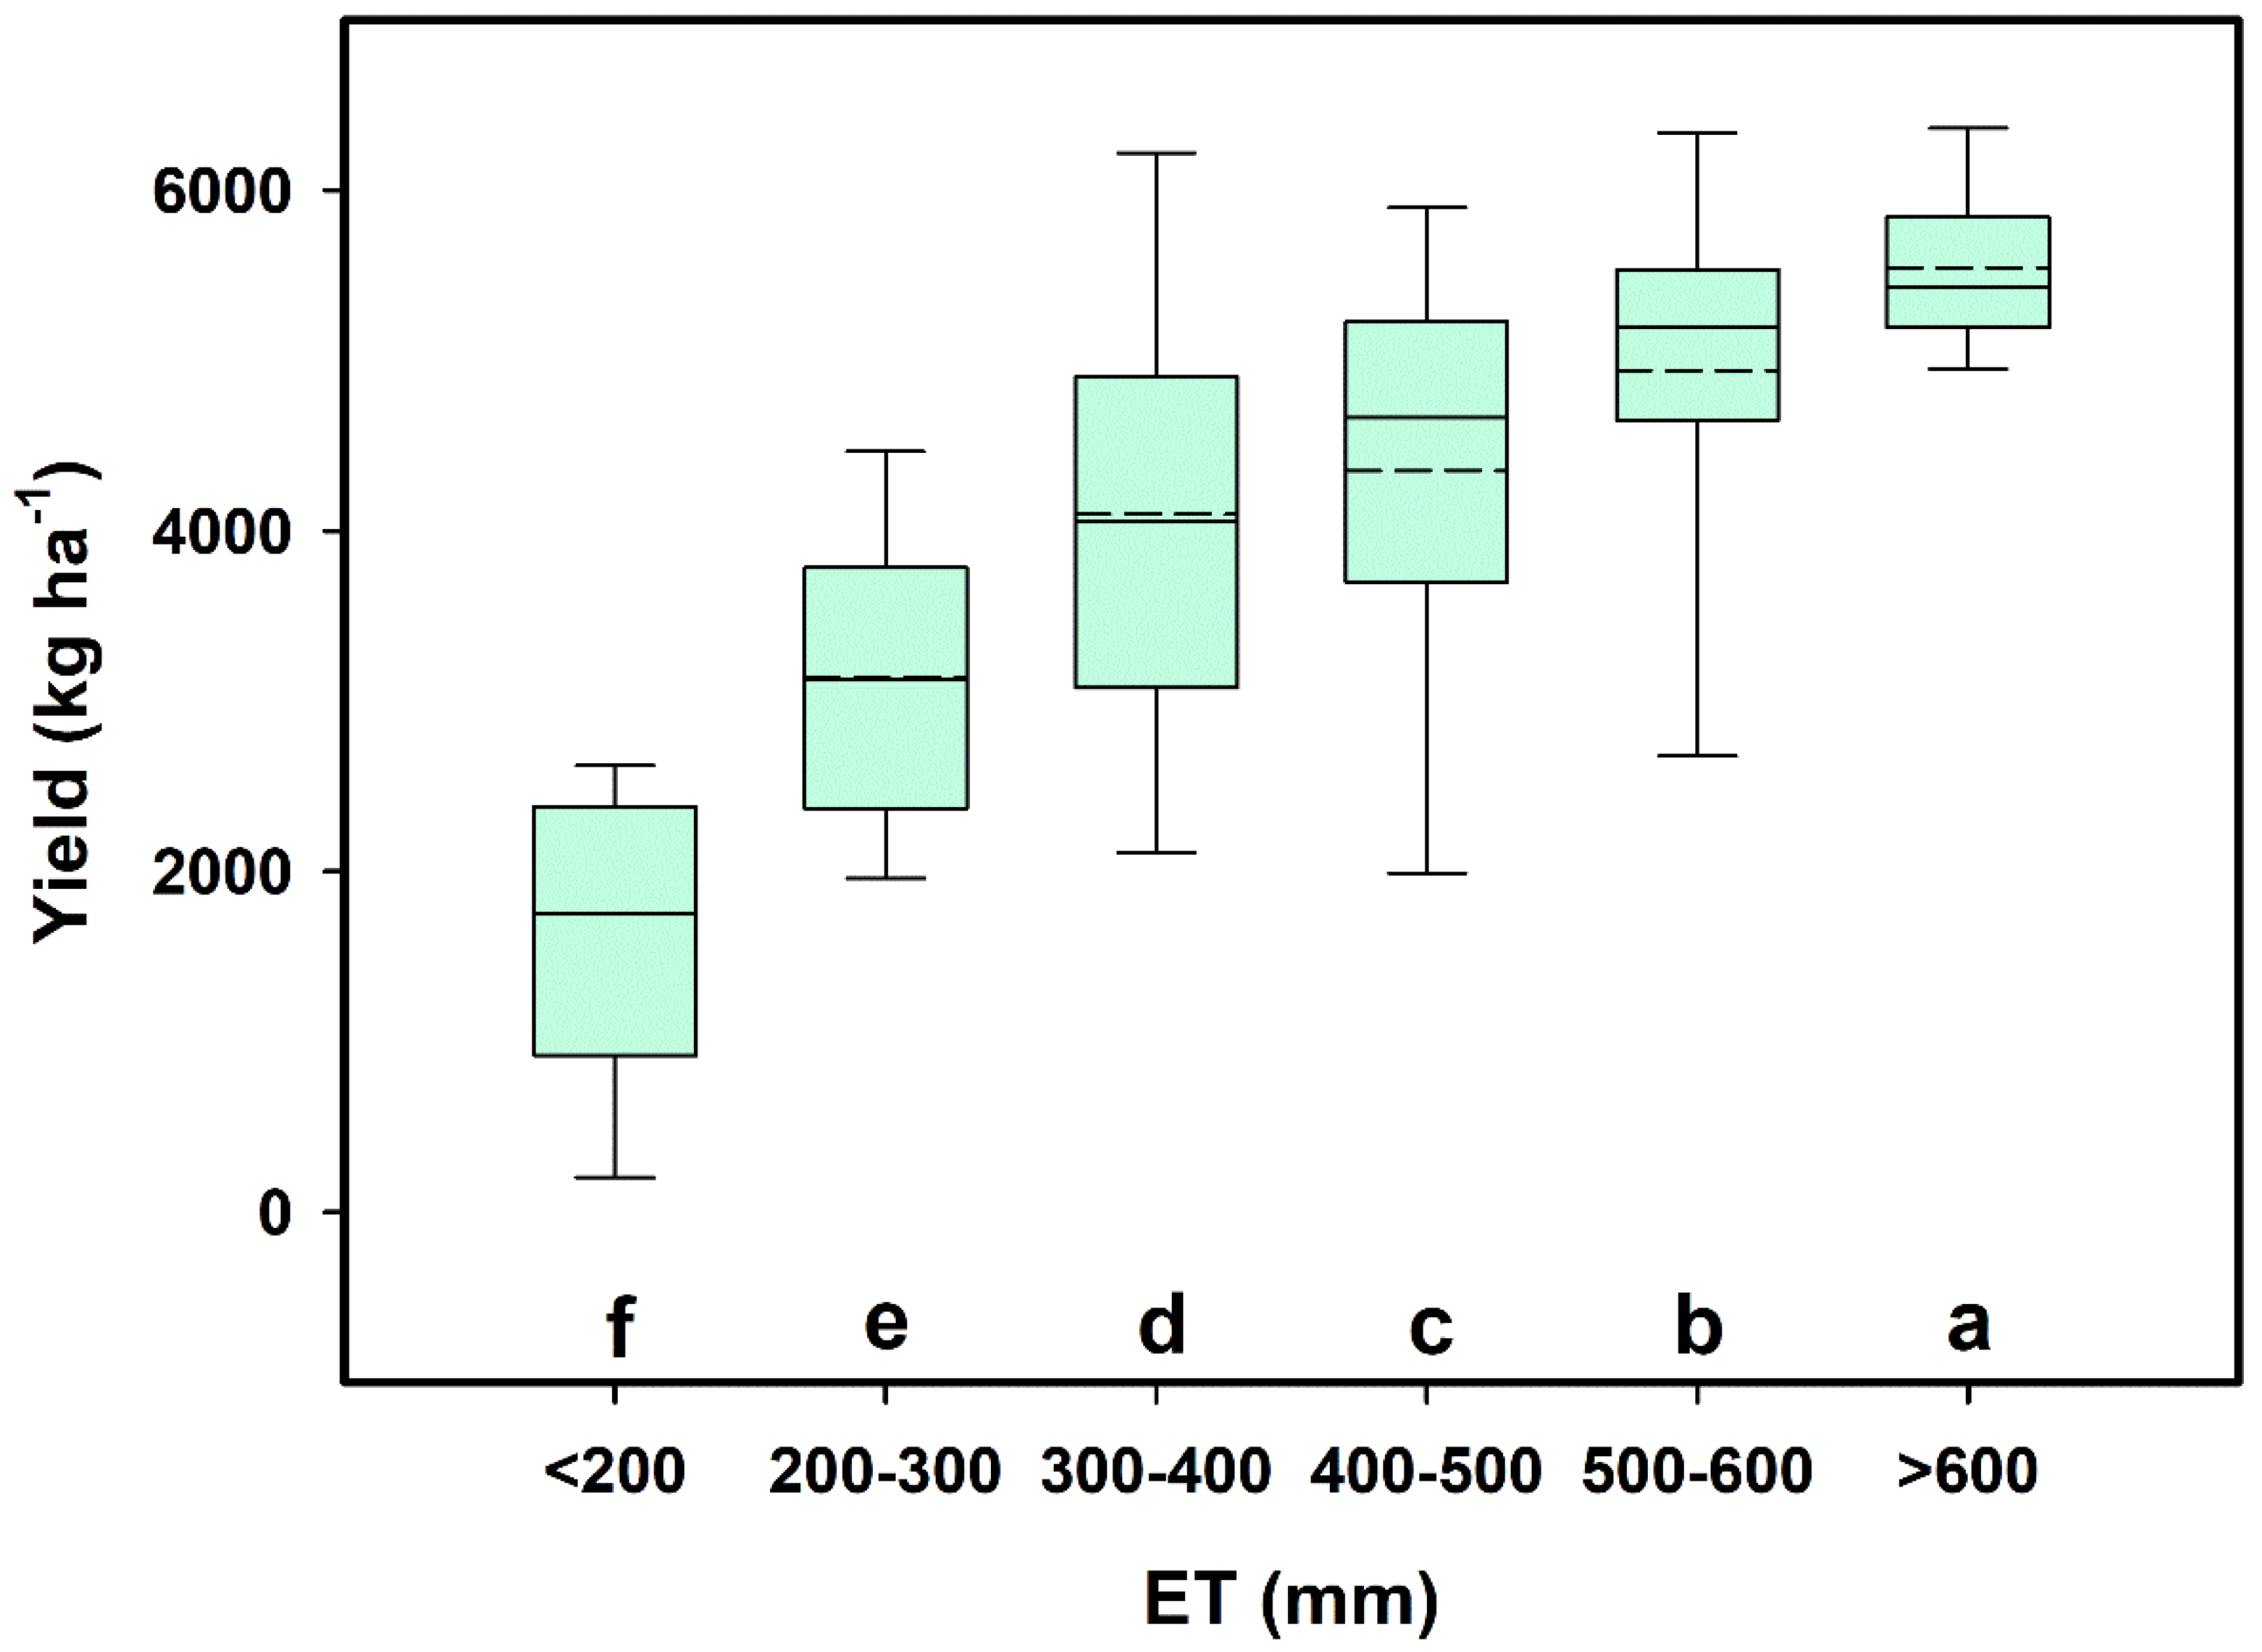
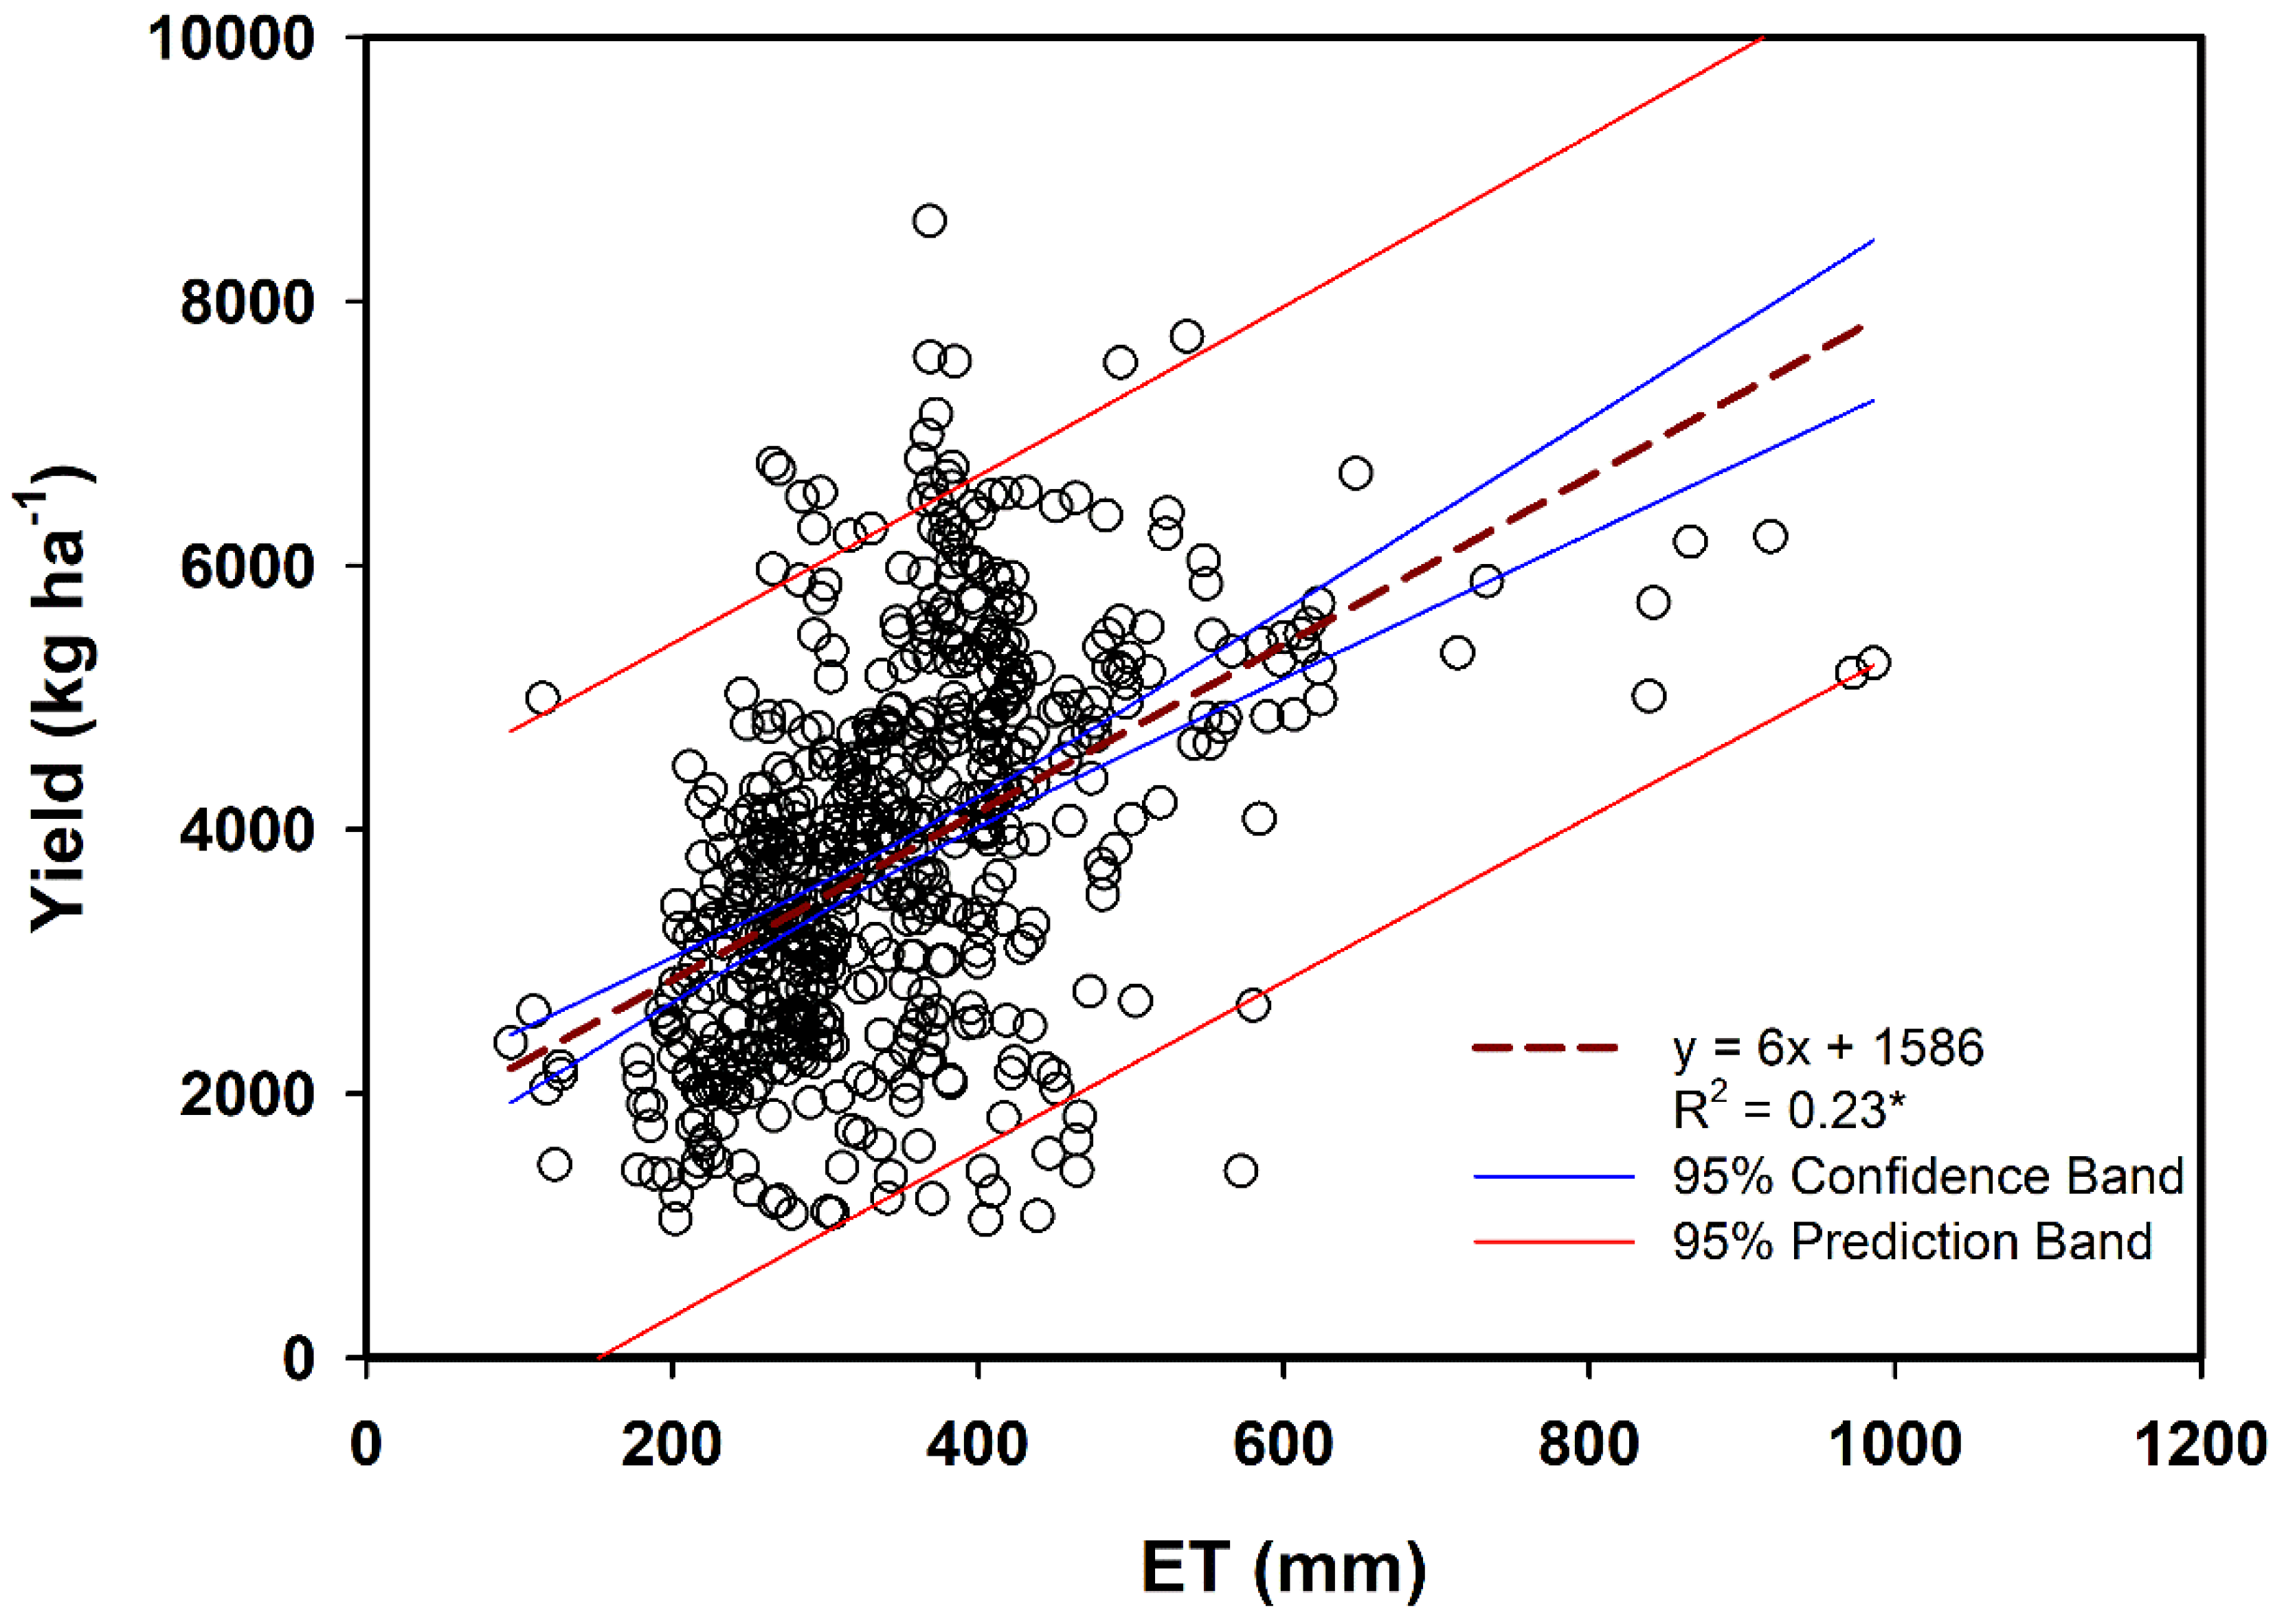
Mean yields varied greatly with levels of ET, with an increasing trend from <200 mm ET to >600 mm ET (Figure 6). Mean yield in regions with ET values < 200 mm was 79% lower than in regions with ET values in the range 200–300 mm (Figure 6). When the ET was >600 mm, mean yield was 35%, 27%, and 12% higher than in regions with ET values of 300–400, 400–500, and 500–600 mm, respectively (Figure 6). Wheat yield was closely, positively, and significantly (p < 0.05) correlated with ET (Figure 7). Thus, ET strongly influenced wheat yield in rainfall-dependent regions.

3.4. Spatio-Temporal Variation in Water Limitation of Wheat Yield

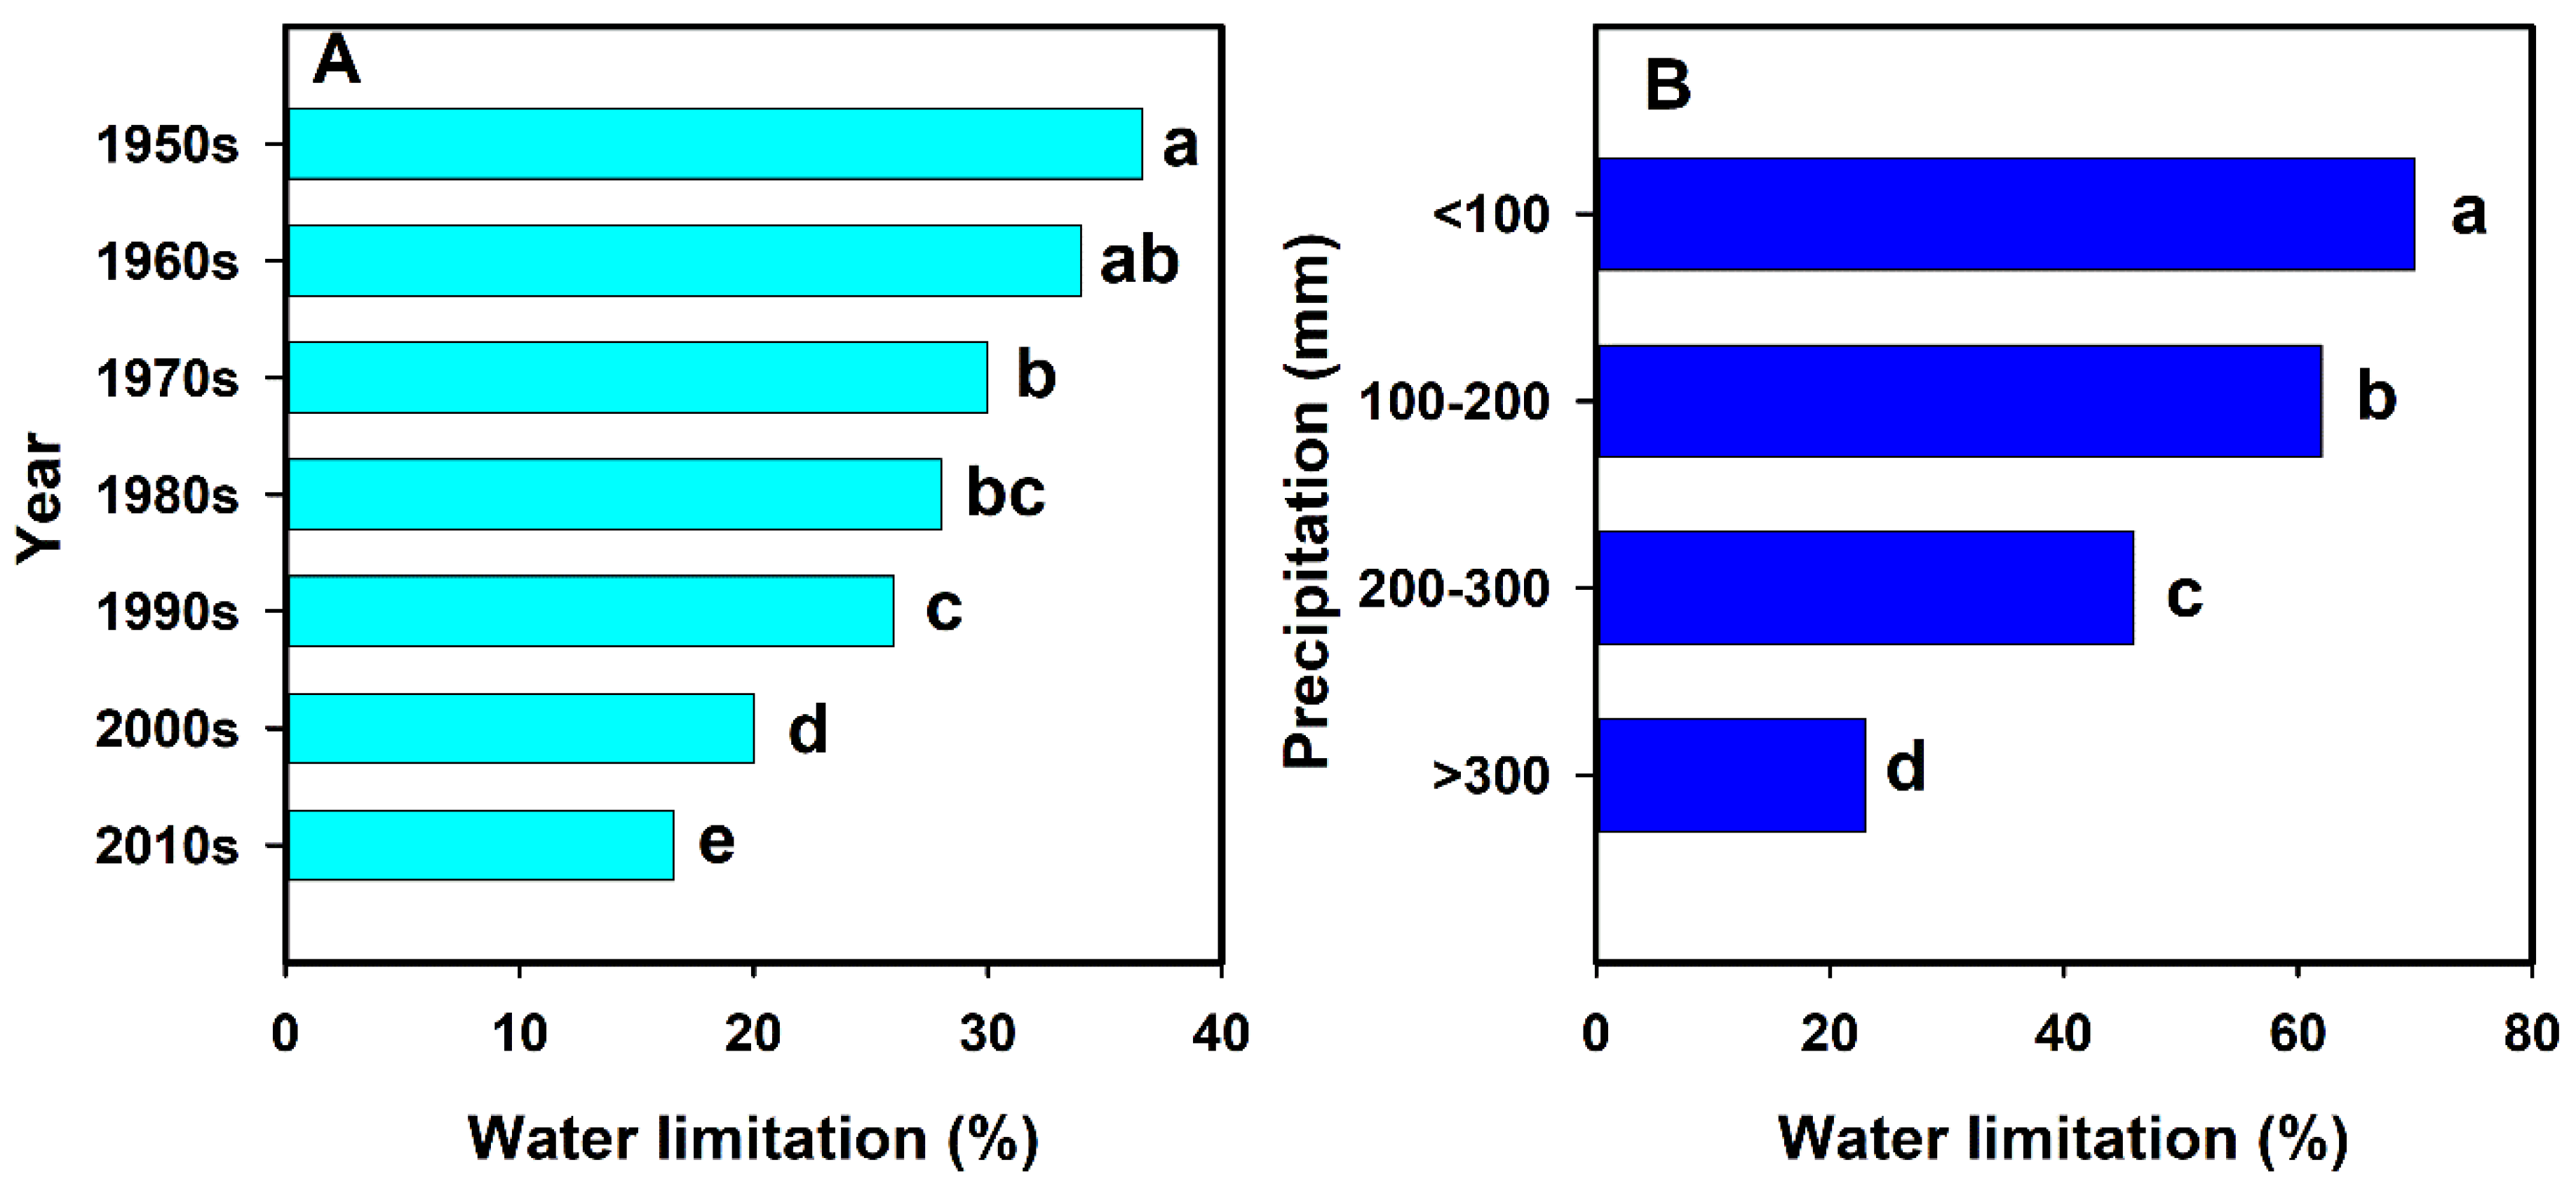
Water limitation on wheat yield decreased from the 1950s to the 2010s (Figure 8A). Water limitation reduced wheat yields by 37%, 34%, and 30% in the 1950s, 1960s, and 1970s, respectively (Figure 8A). Water limitation on wheat yield decreased from 28% in the 1980s to 17% in the 2010s (Figure 8A).
Water limitation on yield decreased with increasing precipitation during wheat growth stage (Figure 8B). Water limitation reduced yields by 70%, 62%, 46% and 23% in regions with <100 mm, 100–200 mm, 200–300 mm and >300 mm precipitation during wheat growth stage, respectively (Figure 8B). Thus, yield losses resulting from water limitation decreased from the 1950s through the 2010s as precipitation during wheat growth stage increased.

4. Discussion

During the study period, dryland wheat yield increased at a rate of 110 kg ha–1 year–1, reaching 7208 kg ha–1 in 2015 (Figure 2). Dryland wheat yield was relatively low compared to worldwide production from irrigated croplands [16,17,18,19]. In northern Chinese areas, particularly in the northwestern arid and semi-arid zones, crop growth is dependent on rainfall or irrigation; growth is severely limited in regions without irrigation [20]. Limited rainfall during the growth stage may not meet the demands of wheat growth and development. Hence, rainfall during the growth stage is the major factor influencing the spatial distribution of production in the northern Chinese drylands. Yields improved with increasing precipitation during the growth stage (Figure 4A): yield was positively correlated with precipitation during the growth stage (Figure 5A), as reported by Ali et al. (2018) [21]. The differences in dryland wheat yield among the provinces of Gansu [22], Shanxi [23], and Shaanxi [24] resulted from differences in precipitation.
Compared to the main wheat-producing countries, dryland wheat production in China was low throughout the 1980s. Chinese yields significantly improved after the 1990s, and became higher than those in South Asia, Latin America, Africa, and Australia [25]. The increase in yields in China resulted from large fertilizer inputs and improved cultivation practices that were put in place in the 1980s. In Latin America and Africa, soil inputs are lower, and soil factors limit yield more so than in China [26]. In Australia, the level of management was higher than China, but it paid more attention to crop rotation and soil quality protection, and its dryland wheat yield was lower than China [27]. Yields in China have been historically lower than those in Europe, but since 1998 European dryland yields have fallen, while those in China have increased; the yield gap between the two regions has narrowed [25]. Yield declines in Europe are a result of reductions in fertilizer inputs [28], and a decrease in fertilizer inputs was due to the Common Agricultural Policy [29,30,31] or other environmental policies. Before the “household responsibility system” was implemented in China in 1978, farmers relied mostly on organic fertilizers for wheat production, which accounts for the low productivity levels at that time (typically < 1.5 t ha–1). By 1982, farmers had begun to use more synthetic fertilizers than organic fertilizers (105 and 97 kg ha–1 for synthetics and organics, respectively) [32], which sharply increased crop yields. Thus, increased synthetic fertilizer inputs account for the increases in dryland wheat yields in northern Chinese areas during the period from the 1950s through to the 2010s.
The dryland yield loss in China resulting from water deficit has decreased over time as water-saving technologies have been developed and applied, resulting in an increase in trend yield during 1950–2017. The water limitation on yield decreased from 37% in the 1950s to 17% in the 2010s (Figure 8A). Many different water-saving technologies have been developed, e.g., ridge furrow cropping, no-till, subsoiling, and mulching. Ali et al. (2018) reported that the ridge furrow cropping technique indirectly improved both endogenous hormonal changes during seed-filling and winter wheat production under simulated rainfall conditions [33]. With appropriate dispersal techniques, field mulching can be an effective method for improving water retention in arid and semi-arid agro-ecosystems of China [34]. This was also the case when field mulching was used in potato production in China [35]. Chen et al. (2015) proposed the use of plastic film combined with straw mulch for water management on the Loess Plateau, China [36]. In addition, mulching facilitates for more retention of soil moisture and helps in the control of temperature fluctuations, and improves the physical, chemical and biological properties of soil, as it adds nutrients to the soil and ultimately enhances the growth and yield of crops [37]. In the semi-arid southeastern sector of this plateau, water use efficiency and precipitation use efficiency were significantly improved by deep plowing and subsoiling; wheat yield significantly increased with the application of these two tillage practices [23]. Zhou et al. (2018) found that overall crop yields were 18% higher in straw-mulched plots than in plots with no tillage, and 5% higher in plots with no tillage and straw mulching treatment than in plots with conventional tillage [38]. Except for the effects on bulk density, no tillage combined with subsoiling with cover vastly improved water use efficiency (+11%) and yield (+13%) in comparison with traditional tillage practices in northern Chinese areas [39]. Overall, these water-saving technologies have decreased the effects of water limitation on wheat yield in the period from the 1950s through to the 2010s.
Fan et al. (2005) suggested that long-term addition of organic materials to soil should increase soil water-holding capacity, which in turn improves water availability to plants, arrests yield declines, decreases CO2 emission from agricultural soils, and sustains arable productivity [22]. Zhang et al. (2017) found that amending soil with straw–derived biochar can lower greenhouse gas emissions while increasing the productivity of wheat and maize cropping systems on the Loess Plateau [40]. We must stress that fertilizer use, variety improvement, and agricultural mechanization played a more important role in increasing crop production as compared with these water-saving technologies. In addition, the improvement in agricultural infrastructure (e.g., irrigation conditions), the government support (e.g., agricultural subsidy), and the extension of dry farming technology also greatly contributed to the improvement in the productivity of dryland wheat in China in the past 60 years.
The water limitation on yield has varied greatly over time due to differences in precipitation during the growth stage among regions (Figure 8B). Water limitations on yield declined with increases in rainfall during the growth stage across the regions. Thus, the water limitation on yield reached 46–70% in regions with <300 mm precipitation during the growth stage (Figure 8B). Hence, water deficit is still the main limiting factor that should be considered in management plans for increasing crop production on the drylands of northern Chinese areas.

5. Conclusions

We evaluated the trends in and main driving factors of spatio-temporal variation in dryland wheat yield in northern Chinese areas. Yields increased in the period from the 1950s through to the 2010s across regions with precipitation levels during wheat growth stage ranging from <100 mm to >300 mm. Mean yields were the highest when mean temperatures during wheat growth stage were in the range 4–8 °C. Mean yields increased with increasing ET. Proportional water limitation on wheat yield fell by 55% from the 1950s through to the 2010s. Water limitation on yield was 70% in regions with <100 mm precipitation during wheat growth stage, and 23% in regions with >300 mm precipitation during wheat growth stage. Yield was positively and significantly correlated with precipitation and ET during wheat growth stage. Thus, limitations on dryland wheat yield caused by water deficit fell from the 1950s through to the 2010s as precipitation during wheat growth stage increased throughout northern Chinese areas.

Supplementary Materials

The following are available online at https://www.mdpi.com/2071-1050/10/12/4470/s1. Supplementary Information S1: References for publications used in the study.

Author Contributions

Conceptualization by Y.W., R.Z., and Z.J.; Y.W., F.G., J.Y., J.Z., X.W., and G.G. collected the analysis source data; Y.W. analyzed the data; Y.W. wrote the paper.

Funding

This research was funded by the Doctoral Scientific Research Foundation of Northwest A&F University, grant number Z109021711.

Acknowledgments

We were grateful for the constructive comments on this manuscript from the anonymous reviewers and editors.

Conflicts of Interest

The authors declare no conflicts of interest.

References

  1. Biradar, C.M.; Thenkabail, P.S.; Noojipady, P.; Li, Y.J.; Dheeravath, V.; Turral, H. A global map of rainfed cropland areas (GMRCA) at the end of last millennium using remote sensing. Int. J. Appl. Earth Obs. Geoinf. 2009, 11, 114–129. [Google Scholar] [CrossRef]
  2. Ramírez-Rodrigues, M.A.; Alderman, P.D.; Stefanova, L.; Cossani, C.M.; Flores, D.; Asseng, S. The value of seasonal forecasts for irrigated, supplementary irrigated, and rainfed wheat cropping systems in northwest Mexico. Agr. Syst. 2016, 147, 76–86. [Google Scholar] [CrossRef]
  3. IGSNRR (Institute of Geographic Sciences and Natural Resources). Thematic Database for Human-Earth System. 2016. Available online: http://www.data.ac.cn/index.asp (accessed on 20 August 2018).
  4. Elliott, J.; Deryng, D.; Müller, C.; Frieler, K.; Konzmann, M.; Gerten, D.; Glotter, M.; Flörke, M.; Wada, Y.; Best, N. Constraints and potentials of future irrigation water availability on agricultural production under climate change. Proc. Natl. Acad. Sci. USA 2014, 111, 3239–3244. [Google Scholar] [CrossRef] [PubMed] [Green Version]
  5. NBS. China’s National Bureau of Statistics. 2017. Available online: http://www.stats.gov.cn/tjsj/ndsj/2017/indexch.htm (accessed on 19 April 2018).
  6. Zhang, F.; Ma, W. The relationship between fertilizer input level and nutrient use efficiency. Soil Environ. Sci. 2000, 9, 154–157. (In Chinese) [Google Scholar]
  7. Tong, C.; Hall, C.A.S.; Wang, H. Land use change in rice, wheat and maize production in China (1961–1998). Agric. Ecosyst. Environ. 2003, 95, 523–536. [Google Scholar] [CrossRef]
  8. Liu, S.; Zhai, R. Spatial-temporal pattern changes and optimal strategy of grain production in China since 1990s. Areal Res. Dev. 2009, 28, 1–5. (In Chinese) [Google Scholar]
  9. Mo, X.; Lin, Z.; Liu, S. Spatial-temporal evolution and driving forces of winter wheat productivity in the Huang-Huai-Hai Region. J. Nat. Resour. 2006, 21, 449–457. (In Chinese) [Google Scholar]
  10. Liu, Z.; Li, B. Spatial distribution of China grain output based on land use and population density. Trans. CSAE 2012, 28, 1–7. (In Chinese) [Google Scholar]
  11. Zhou, D.; An, P.; Pan, Z.; Zhang, F. Arable land use intensity changes in China from 1985 to 2005: Evidence from integrated cropping systems and agro-economic analysis. J. Agric. Sci. 2012, 150, 179–190. [Google Scholar] [CrossRef]
  12. Xie, H.; Zou, J.; Jiang, H.; Zhang, N.; Choi, Y. Spatiotemporal pattern and driving forces of arable land-use intensity in China: Toward sustainable land management using emerge analysis. Sustainability 2014, 6, 3504–3520. [Google Scholar] [CrossRef]
  13. Tummers, B. DataThief III. 2006. Available online: http://datathief.org/ (accessed on 20 August 2018).
  14. Wang, F. Progress in meteorological prediction of crop yield in China in recent years. Meteorol. Mon. 1986, 12, 46–47. (In Chinese) [Google Scholar]
  15. SAS Institute Inc. SAS/STAT® 13.1 User’s Guide; SAS Institute Inc.: Cary, NC, USA, 2013. [Google Scholar]
  16. Uddin, M.N.; Marshall, D.R. Effects of dwarfing genes on yield and yield components under irrigated and rainfed conditions in wheat (Triticum aestivum L.). Euphytica 1989, 42, 127–134. [Google Scholar] [CrossRef]
  17. Karimizadeh, R.; Mohammadi, M. Association of canopy temperature depression with yield of durum wheat genotypes under supplementary irrigated and rainfed conditions. Aust. J. Crop Sci. 2011, 5, 138–146. [Google Scholar]
  18. Wang, Y.; Xi, W.; Wang, Z.; Wang, B.; Xu, X.; Han, M.; Zhou, S.; Zhang, Y. Contribution of ear photosynthesis to grain yield under rainfed and irrigation conditions for winter wheat cultivars released in the past 30 years in North China Plain. J. Integr. Agric. 2016, 15, 2247–2256. [Google Scholar] [CrossRef]
  19. Wang, Y.; Zhang, Y.; Zhang, R.; Li, J.; Zhang, M.; Zhou, S.; Wang, Z. Reduced irrigation increases the water use efficiency and productivity of winter wheat-summer maize rotation on the North China Plain. Sci. Total Environ. 2018, 618, 112–120. [Google Scholar] [CrossRef] [PubMed]
  20. Liang, Z.S.; Yang, J.W.; Shao, H.B.; Han, R.L. Investigation on water consumption characteristics and water use efficiency of poplar under soil water deficits on the Loess Plateau. Colloid Surf. B 2006, 53, 23–28. [Google Scholar] [CrossRef] [PubMed]
  21. Ali, S.; Xu, Y.; Jia, Q.; Ahmad, I.; Ma, X.; Yan, Z.; Cai, T.; Ren, X.; Zhang, P.; Jia, Z. Interactive effects of planting models with limited irrigation on soil water, temperature, respiration and winter wheat production under simulated rainfall conditions. Agric. Water Manag. 2018, 208, 198–211. [Google Scholar] [CrossRef]
  22. Fan, T.; Stewart, B.A.; Wang, Y.; Luo, J.; Zhou, G. Long-term fertilization effects on grain yield, water-use efficiency and soil fertility in the dryland of Loess Plateau in China. Agric. Ecosyst. Environ. 2005, 106, 313–329. [Google Scholar] [CrossRef]
  23. Sun, M.; Ren, A.; Gao, Z.; Wang, P.; Mo, F.; Xue, L.; Lei, M. Long-term evaluation of tillage methods in fallow season for soil water storage, wheat yield and water use efficiency in semiarid southeast of the Loess Plateau. Field Crop Res. 2018, 218, 24–32. [Google Scholar] [CrossRef]
  24. Hu, C.; Ding, M.; Qu, C.; Sadras, V.; Yang, X.; Zhang, S. Yield and water use efficiency of wheat in the Loess Plateau: Responses to root pruning and defoliation. Field Crop Res. 2015, 179, 6–11. [Google Scholar] [CrossRef]
  25. FAO. FAOSTAT-Agriculture, Food and Agricultural Organizations of the United Nations. 2014. Available online: http://faostat3.fao.org/browse/Q/QC/E (accessed on 20 August 2018).
  26. Wani, S.P.; Rockström, J.; Oweis, T.; Wani, S.P.; Rockström, J.; Oweis, T. Rainfed Agriculture: Unlocking the Potential; Iwmi Books Reports; CABI: Wallingford, UK, 2008. [Google Scholar]
  27. Hochman, Z.; Gobbett, D.; Holzworth, D.; McClelland, T.; van Rees, H.; Marinoni, O.; Garcia, J.N.; Horan, H. Reprint of “quantifying yield gaps in rainfed cropping systems: A case study of wheat in Australia”. Field Crop Res. 2013, 143, 65–75. [Google Scholar] [CrossRef]
  28. Brisson, N.; Gate, P.; Gouache, D.; Charmet, G.; Oury, F.X.; Huard, F. Why are wheat yields stagnating in Europe? a comprehensive data analysis for France. Field Crop Res. 2010, 119, 201–212. [Google Scholar] [CrossRef]
  29. Finger, R. Impacts of agricultural policy reforms on crop yields. Eurochoices 2008, 7, 24–25. [Google Scholar] [CrossRef]
  30. Peltonen-Sainio, P.; Jauhiainen, L.; Laurila, I.P. Cereal trends in northern European conditions: Changes in yield potential and its realization. Field Crop Res. 2009, 110, 85–90. [Google Scholar] [CrossRef]
  31. Finger, R. Evidence of slowing yield growth—The example of Swiss cereal yields. Food Policy 2010, 35, 175–182. [Google Scholar] [CrossRef] [Green Version]
  32. Wang, Q.; Halbrendt, C.; Johnson, S.R. Grain production and environmental management in China’s fertilizer economy. J. Environ. Manag. 1995, 47, 283–296. [Google Scholar] [CrossRef]
  33. Ali, S.; Xu, Y.; Ahmad, I.; Jia, Q.; Fangyuan, H.; Daur, I.; Wei, T.; Cai, T.; Ren, X.; Zhang, P.; et al. The ridge furrow cropping technique indirectly improves seed filling endogenous hormonal changes and winter wheat production under simulated rainfall conditions. Agric. Water Manag. 2018, 204, 138–148. [Google Scholar] [CrossRef]
  34. Yang, J.; Mao, X.; Wang, K.; Yang, W. The coupled impact of plastic film mulching and deficit irrigation on soil water/heat transfer and water use efficiency of spring wheat in northwest China. Agric. Water Manag. 2018, 201, 232–245. [Google Scholar] [CrossRef]
  35. Li, Q.; Li, H.; Zhang, L.; Zhang, S.; Chen, Y. Mulching improves yield and water-use efficiency of potato cropping in China: A meta-analysis. Field Crop Res. 2018, 221, 50–60. [Google Scholar] [CrossRef]
  36. Chen, Y.; Liu, T.; Tian, X.; Wang, X.; Li, M.; Wang, S.; Wang, Z. Effects of plastic film combined with straw mulch on grain yield and water use efficiency of winter wheat in Loess Plateau. Field Crop Res. 2015, 172, 53–58. [Google Scholar] [CrossRef]
  37. Mehan, S.U.; Singh, K.G. Use of mulches in soil moisture conservation: A review. Best Manag. Pract. Drip Irrigated Crops 2015, 2, 283. [Google Scholar]
  38. Zhou, L.; Lai, X.; Yang, Q.; Yang, X.; Cui, S.; Shen, Y. In search of long-term sustainable tillage and straw mulching practices for a maize-winter wheat-soybean rotation system in the Loess Plateau of China. Field Crop Res. 2018, 217, 199–210. [Google Scholar]
  39. Jin, H.; Li, H.; Wang, X.; Mchugh, A.D.; Li, W.; Gao, H.; Kuhn, N.J. The adoption of annual subsoiling as conservation tillage in dryland maize and wheat cultivation in northern China. Soil Till. Res. 2007, 94, 493–502. [Google Scholar] [CrossRef]
  40. Zhang, A.; Cheng, G.; Hussain, Q.; Zhang, M.; Feng, H.; Dyck, M.; Sun, B.; Zhao, Y.; Chen, H.; Chen, J.; et al. Contrasting effects of straw and straw–derived biochar application on net global warming potential in the Loess Plateau of China. Field Crop Res. 2017, 205, 45–54. [Google Scholar] [CrossRef]
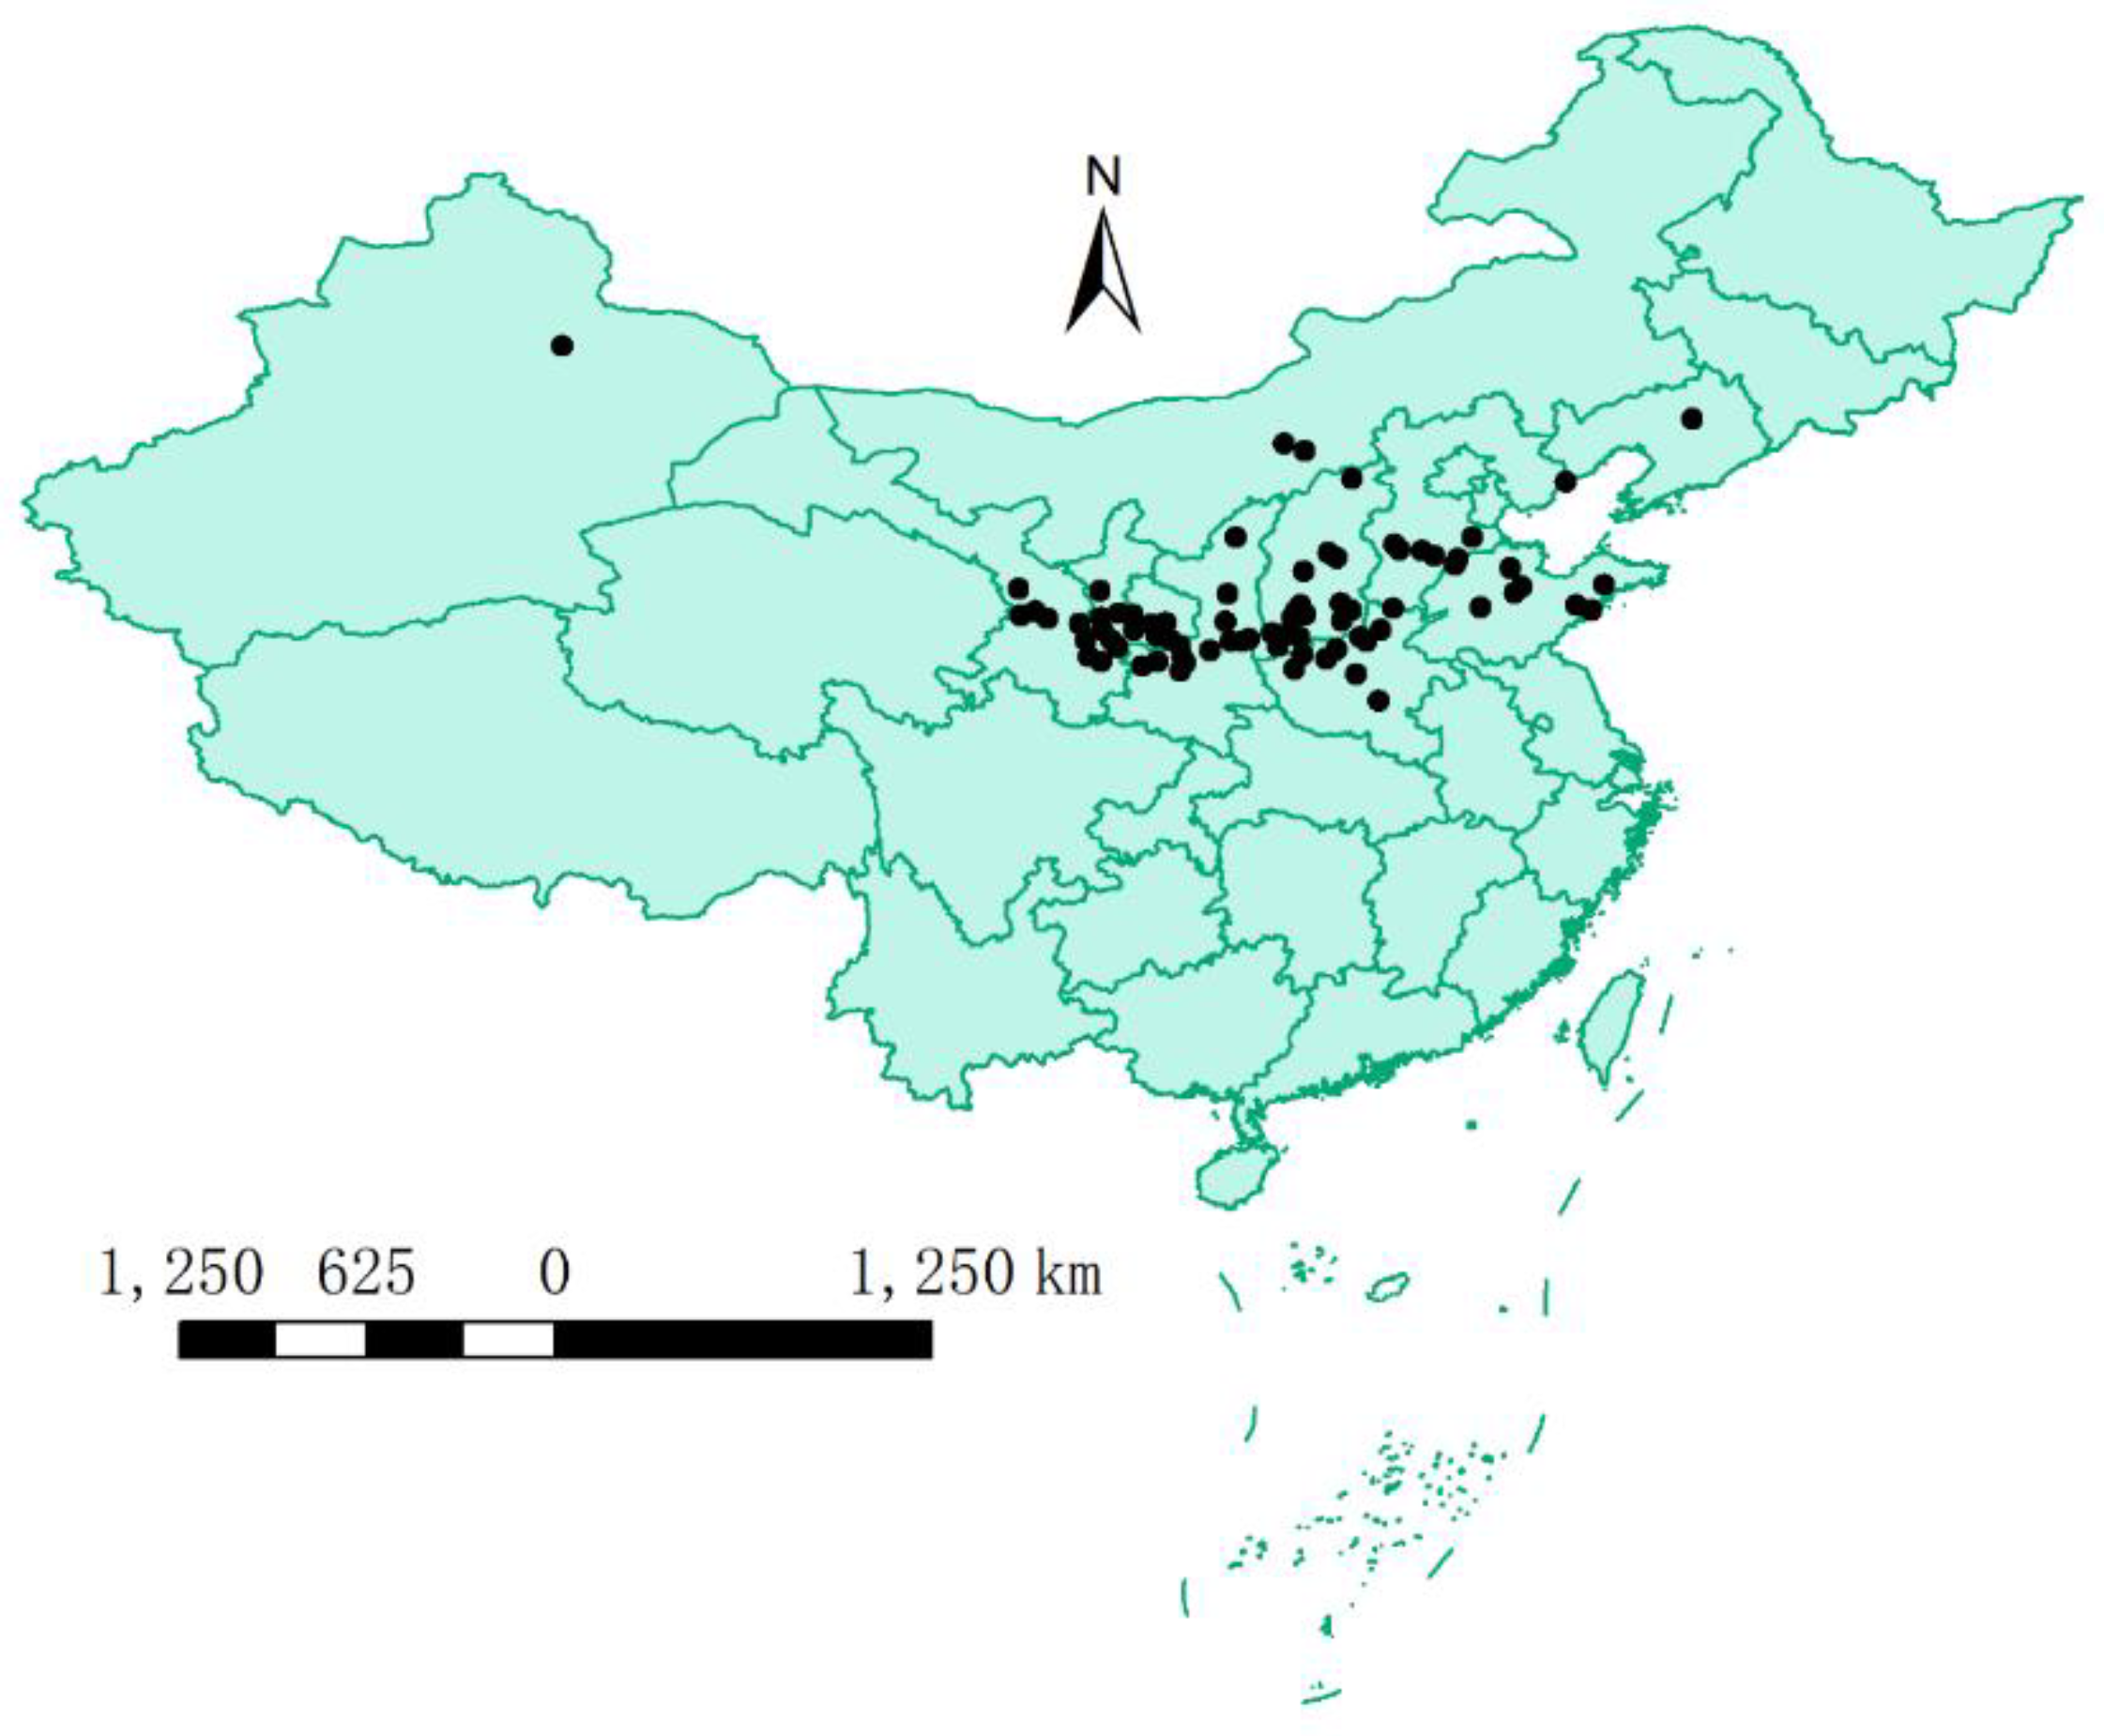
Figure 1. Geographic locations of the study sites. The map was generated with ArcGIS 10.2 software (ESRI, Redlands, CA, USA).
Sustainability 10 04470 g001
Figure 2. Temporal variation in actual yield (Y), trend yield (Yt) and meteorological yield (Ym) for dryland wheat production in northern Chinese areas. *** and **** indicate significance at p < 0.001 and p < 0.0001.
Sustainability 10 04470 g002
Figure 3. Dryland wheat yields in northern Chinese areas between the 1950s and 2010s. The black solid and dash lines, lower and upper edges, and bars in or outside the boxes represent median and mean values, 25th and 75th, 5th and 95th, and, <10th and >90th percentiles of all data, respectively. Different lower-case letters denote significantly different means (Duncan’s multiple range test; p < 0.05).
Sustainability 10 04470 g003
Figure 4. Variation in dryland wheat yield in different precipitation (A), mean temperatures (B) during wheat growth stage regions of northern Chinese areas. The black solid and dash lines, lower and upper edges, and bars in or outside the boxes represent median and mean values, 25th and 75th, 5th and 95th, and, <10th and >90th percentiles of all data, respectively. Different lower-case letters denote significantly different means (Duncan’s multiple range test; p < 0.05).
Sustainability 10 04470 g004
Figure 5. Relationship between dryland wheat yield and precipitation (A), mean temperature (B) during wheat growth stage in northern Chinese areas. *, ** indicate significance at p < 0.05, p < 0.01, respectively.
Sustainability 10 04470 g005
Figure 6. Variation in dryland wheat yield among regions in northern Chinese areas with different levels of evapotranspiration (ET). The black solid and dash lines, lower and upper edges, and bars in or outside the boxes represent median and mean values, 25th and 75th, 5th and 95th, and, <10th and >90th percentiles of all data, respectively. Different lower-case letters denote significantly different means (Duncan’s multiple range test; p < 0.05).
Sustainability 10 04470 g006
Figure 7. Relationship between dryland wheat yield in northern Chinese areas and ET. * indicates significance at p < 0.05.
Sustainability 10 04470 g007
Figure 8. Percentage reductions in dryland wheat yield due to water limitation in different decades (A) and in regions of northern Chinese areas with different precipitation levels during wheat growth stage (B). Different lower-case letters denote significantly different means (Duncan’s multiple range test; p < 0.05).
Sustainability 10 04470 g008