Greenhouse Gas Emissions from the Tibetan Alpine Grassland: Effects of Nitrogen and Phosphorus Addition


Abstract
1. Introduction
2. Materials and Methods
2.1. Site Description
2.2. Experimental Design
2.3. Sampling and Measurement
2.4. Environmental Conditions
2.5. Statistical Analysis
3. Results
3.1. Environmental Variables
3.2. CO2 Emission
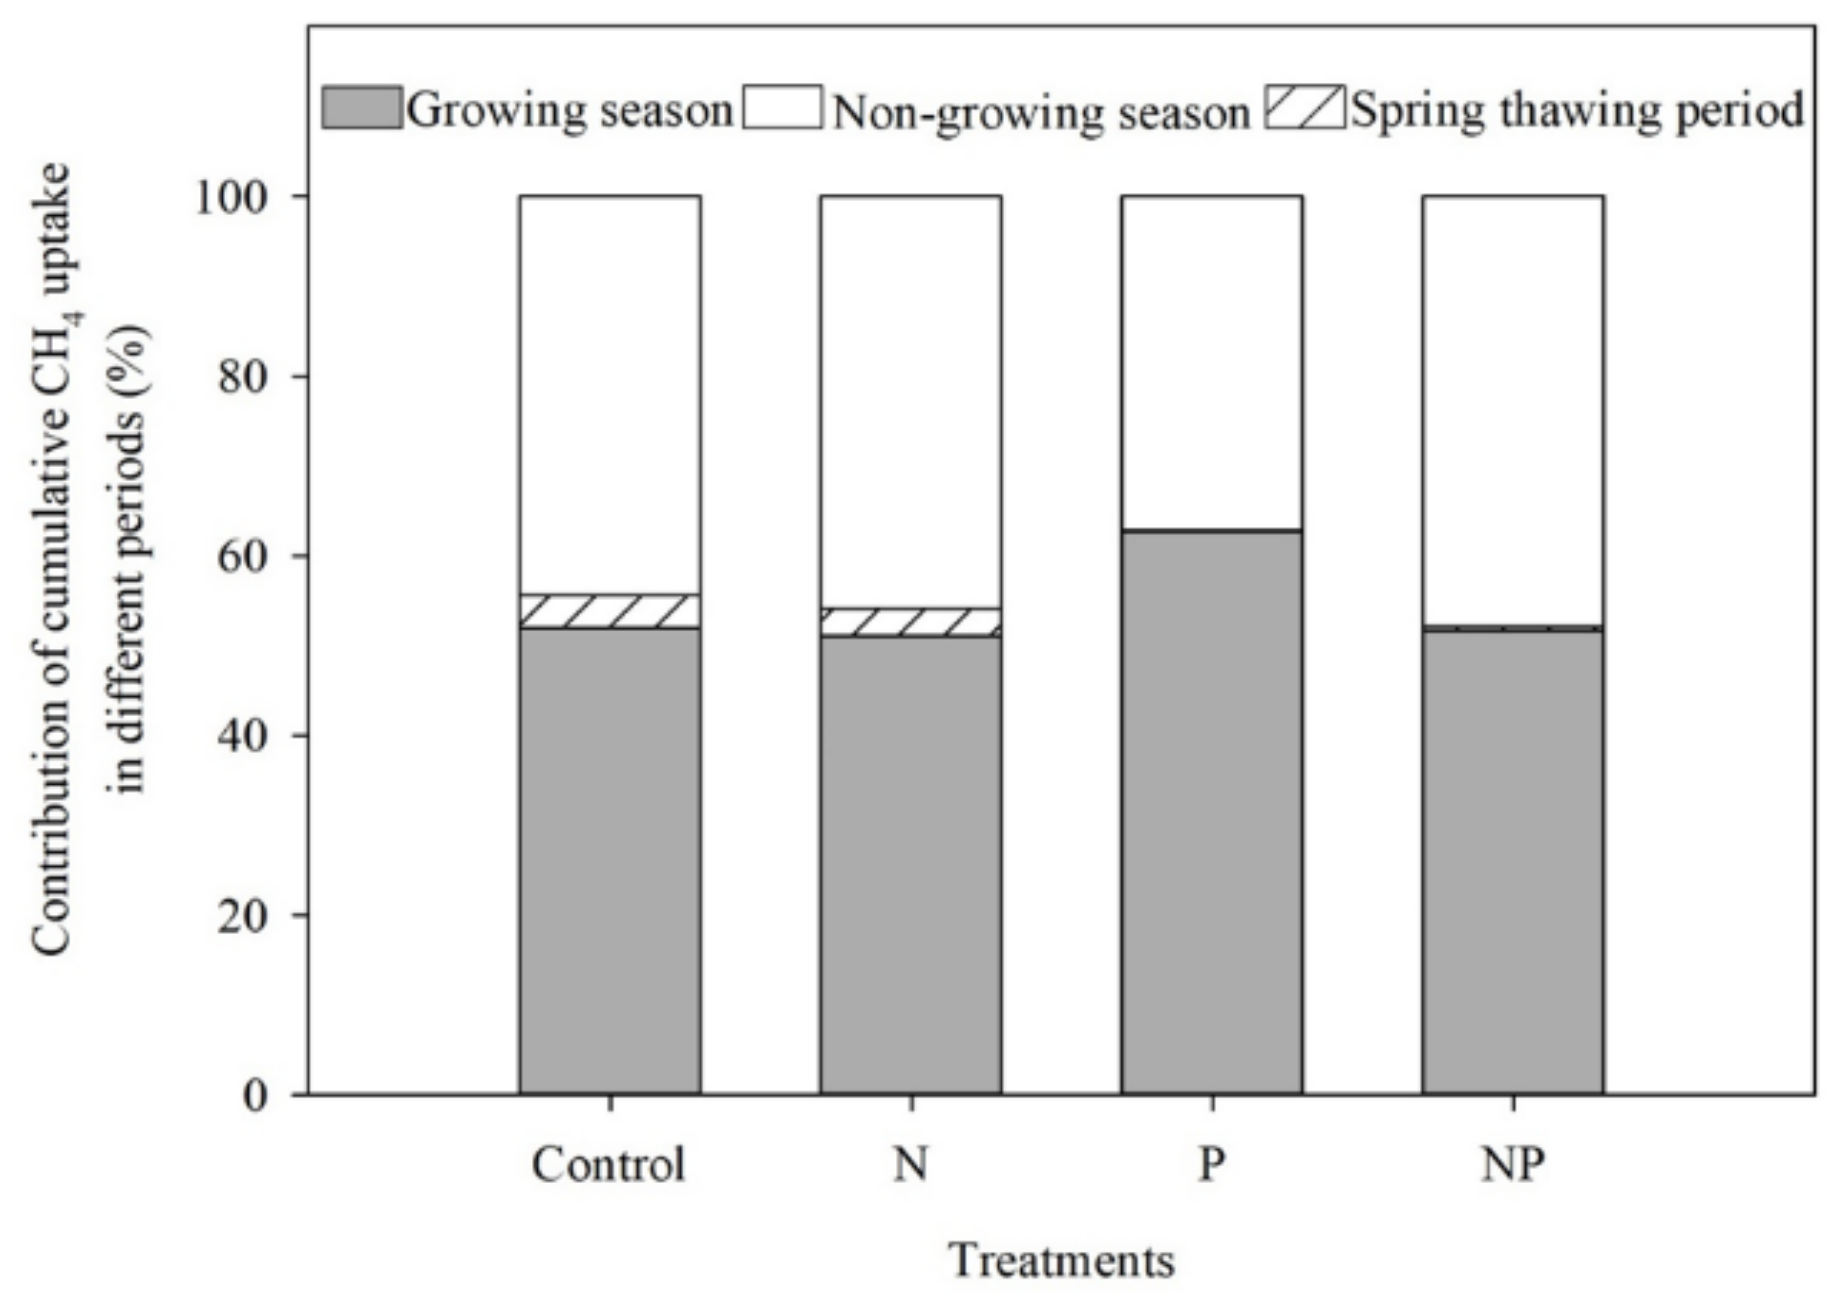
3.3. CH4 Uptake
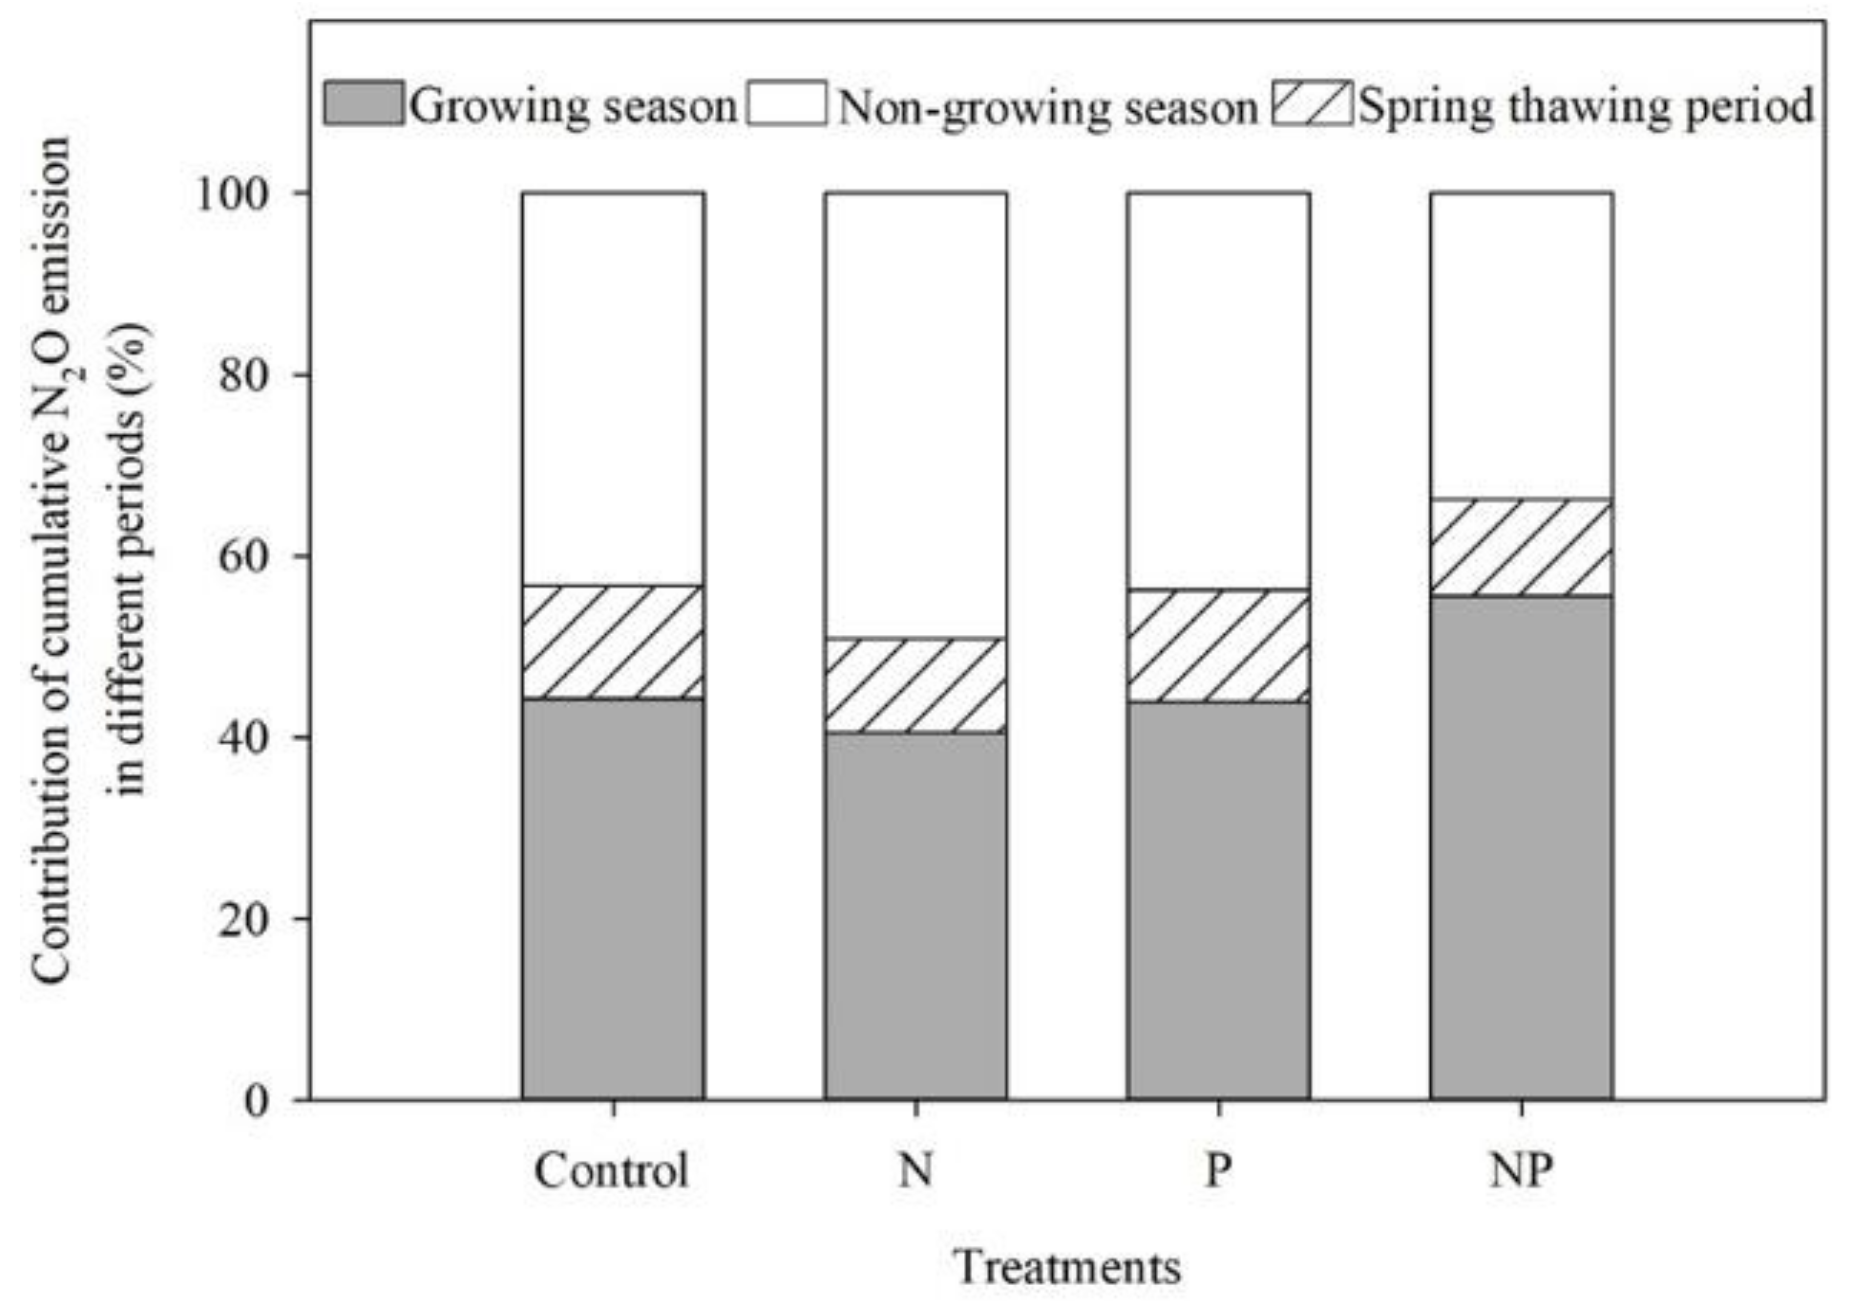
3.4. N2O Emission
4. Discussion
4.1. CO2 Emission
4.2. CH4 Uptake
4.3. N2O Emission
5. Conclusions
Author Contributions
Funding
Acknowledgments
Conflicts of Interest
References
- IPCC. Climate Change 2013: The Physical Science Basis. Contribution of Working Group I to the Fifth Assessment Report of the Intergovernmental Panel on Climate Change; Cambridge University Press: Cambridge, UK; New York, NY, USA, 2013. [Google Scholar]
- He, J.-S.; Wang, Z.; Wang, X.; Schmid, B.; Zuo, W.; Zhou, M.; Zheng, C.; Wang, M.; Fang, J. A test of the generality of leaf trait relationships on the Tibetan Plateau. New Phytol. 2006, 170, 835–848. [Google Scholar] [CrossRef] [PubMed]
- Geng, Y.; Wang, Y.; Yang, K.; Wang, S.; Zeng, H.; Baumann, F.; Kuehn, P.; Scholten, T.; He, J.S. Soil respiration in Tibetan alpine grasslands: Belowground biomass and soil moisture, but not soil temperature, best explain the large-scale patterns. PLoS ONE 2012, 7, e34968. [Google Scholar] [CrossRef] [PubMed]
- Zhang, Z.; Duan, J.; Wang, S.; Luo, C.; Zhu, X.; Xu, B.; Chang, X.; Cui, S. Effects of seeding ratios and nitrogen fertilizer on ecosystem respiration of common vetch and oat on the Tibetan plateau. Plant Soil 2012, 362, 287–299. [Google Scholar] [CrossRef]
- Elser, J.J.; Bracken, M.E.S.; Cleland, E.E.; Gruner, D.S.; Harpole, W.S.; Hillebrand, H.; Ngai, J.T.; Seabloom, E.W.; Shurin, J.B.; Smith, J.E. Global analysis of nitrogen and phosphorus limitation of primary producers in freshwater, marine and terrestrial ecosystems. Ecol. Lett. 2007, 10, 1135–1142. [Google Scholar] [CrossRef] [PubMed]
- LeBauer, D.S.; Treseder, K.K. Nitrogen limitation of net primary productivity in terrestrial ecosystems is globally distributed. Ecology 2008, 89, 371–379. [Google Scholar] [CrossRef] [PubMed]
- Xu, X.; Ouyang, H.; Kuzyakov, Y.; Richter, A.; Wanek, W. Significance of organic nitrogen acquisition for dominant plant species in an alpine meadow on the Tibet plateau, China. Plant Soil 2006, 285, 221–231. [Google Scholar] [CrossRef]
- Jiang, C.; Yu, G.; Fang, H.; Cao, G.; Li, Y. Short-term effect of increasing nitrogen deposition on CO2, CH4 and N2O fluxes in an alpine meadow on the Qinghai-Tibetan Plateau, China. Atmos. Environ. 2010, 44, 2920–2926. [Google Scholar] [CrossRef]
- Zhang, Z.; Zhu, X.; Wang, S.; Duan, J.; Chang, X.; Luo, C.; He, J.-S.; Wilkes, A. Nitrous oxide emissions from different land uses affected by managements on the Qinghai-Tibetan Plateau. Agric. For. Meteorol. 2017, 246, 133–141. [Google Scholar] [CrossRef]
- Luo, R.; Fan, J.; Wang, W.; Luo, J.; Kuzyakov, Y.; He, J.-S.; Chu, H.; Ding, W. Nitrogen and phosphorus enrichment accelerates soil organic carbon loss in alpine grassland on the Qinghai-Tibetan Plateau. Sci. Total Environ. 2019, 650, 303–312. [Google Scholar] [CrossRef] [PubMed]
- Ambus, P.; Skiba, U.; Butterbach-Bahl, K.; Sutton, MA. Reactive nitrogen and greenhouse gas flux interactions in terrestrial ecosystems. Plant Soil 2011, 343, 1–3. [Google Scholar] [CrossRef]
- Kim, Y.S.; Imori, M.; Watanabe, M.; Hatano, R.; Yi, M.J.; Koike, T. Simulated nitrogen inputs influence methane and nitrous oxide fluxes from a young larch plantation in northern Japan. Atmos. Environ. 2012, 46, 36–44. [Google Scholar] [CrossRef]
- Wang, F.; Li, J.; Wang, X.; Zhang, W.; Zou, B.; Neher, D.A.; Li, Z. Nitrogen and phosphorus addition impact soil N2O emission in a secondary tropical forest of South China. Sci. Rep. 2014, 4, 5615. [Google Scholar] [CrossRef] [PubMed]
- Zhu, X.; Luo, C.; Wang, S.; Zhang, Z.; Cui, S.; Bao, X.; Jiang, L.; Li, Y.; Li, X.; Wang, Q. Effects of warming, grazing/cutting and nitrogen fertilization on greenhouse gas fluxes during growing seasons in an alpine meadow on the Tibetan Plateau. Agric. For. Meteorol. 2015, 214, 506–514. [Google Scholar] [CrossRef]
- Davidson, E.A.; Reis de Carvalho, C.J.; Vieira, I.C.G.; Figueiredo, R.O.; Moutinho, P.; Yoko Ishida, F.; Primo dos Santos, M.T.; Benito Guerrero, J.; Kalif, K.; et al. Nitrogen and phosphorus limitation of biomass growth in a tropical secondary forest. Ecol. Appl. 2014, 14, 150–163. [Google Scholar] [CrossRef]
- Wang, Y.; Liu, H.; Chung, H.; Yu, L.; Mi, Z.; Geng, Y.; Jing, X.; Wang, S.; Zeng, H.; Cao, G.; et al. Non-growing-season soil respiration is controlled by freezing and thawing processes in the summer monsoon-dominated Tibetan alpine grassland. Glob. Biogeochem. Cycle 2014, 28, 1081–1095. [Google Scholar] [CrossRef]
- Song, W.; Wang, H.; Wang, G.; Chen, L.; Jin, Z.; Zhuang, Q.; He, J.-S. Methane emissions from an alpine wetland on the Tibetan Plateau: Neglected but vital contribution of the nongrowing season. Biogeosciences 2015, 120, 1475–1490. [Google Scholar] [CrossRef]
- Song, C.; Zhang, L.; Wang, Y.; Zhao, Z. Annual dynamics of CO2, CH4, N2O emissions from freshwater marshes and affected by nitrogen fertilization. Huanjing Kexue 2006, 27, 2369–2375. (In Chinese) [Google Scholar] [PubMed]
- Wolf, B.; Zheng, X.; Brüggemann, N.; Chen, W.; Dannenmann, M.; Han, X.; Sutton, M.A.; Wu, H.; Yao, Z.; Butterbach-Bahl, K. Grazing-induced reduction of natural nitrous oxide release from continental steppe. Nature 2010, 464, 881–884. [Google Scholar] [CrossRef] [PubMed]
- Zhao, X.; Zhou, X. Ecological basis of alpine meadow ecosystem management in Tibet: Haibei alpine meadow ecosystem research station. Ambio 1999, 28, 642–647. [Google Scholar]
- Lin, X.; Wang, S.; Ma, X.; Xu, G.; Luo, C.; Li, Y.; Jiang, G.; Xie, Z. Fluxes of CO2, CH4, and N2O in an alpine meadow affected by yak excreta on the Qinghai-Tibetan plateau during summer grazing periods. Soil Biol. Biochem. 2009, 41, 718–725. [Google Scholar] [CrossRef]
- Song, C.; Yan, B.; Wang, Y.; Lou, Y.; Zhao, Z. Fluxes of carbon dioxide and methane from swamp and impact factors in Sanjiang Plain, China. Chin. Sci. Bull. 2003, 48, 2749–2753. (In Chinese) [Google Scholar] [CrossRef]
- Cai, J.; Wang, X.; Ding, W.; Tian, L.; Zhao, H.; Lu, X. Potential short-term effects of yak and Tibetan sheep dung on greenhouse gas emissions in two alpine grassland soils under laboratory conditions. Biol. Fertil. Soils 2013, 49, 1215–1226. [Google Scholar] [CrossRef]
- Cao, G.; Tang, Y.; Mo, W.; Wang, Y.; Li, Y.; Zhao, X. Grazing intensity alters soil respiration in an alpine meadow on the Tibetan plateau. Soil Biol. Biochem. 2004, 36, 237–243. [Google Scholar] [CrossRef]
- Merbold, L.; Steinlin, C.; Hagedorn, F. Winter greenhouse gas fluxes (CO2, CH4 and N2O) from a subalpine grassland. Biogeosciences 2013, 10, 3185–3203. [Google Scholar] [CrossRef]
- Kato, T.; Tang, Y.H.; Gu, S.; Cui, X.Y.; Hirota, M.; Du, M.Y.; Li, Y.N.; Zhao, X.Q.; Oikawa, T. Carbon dioxide exchange between the atmosphere and an alpine meadow ecosystem on the Qinghai-Tibetan Plateau, China. Agric. For. Meteorol. 2004, 124, 121–134. [Google Scholar] [CrossRef]
- Burton, A.J.; Pregitzer, K.S.; Crawford, J.N.; Zogg, G.P.; Zak, D.R. Simulated chronic NO3− deposition reduces soil respiration in northern hardwood forests. Glob. Chang. Biol. 2004, 10, 1080–1091. [Google Scholar] [CrossRef]
- Li, K.; Gong, Y.; Song, W.; He, G.; Hu, Y.; Tian, C.; Liu, X. Responses of CH4, CO2 and N2O fluxes to increasing nitrogen deposition in alpine grassland of the Tianshan Mountains. Chemosphere 2012, 88, 140–143. [Google Scholar] [CrossRef] [PubMed]
- Ren, F.; Yang, X.; Zhou, H.; Zhu, W.; Zhang, Z.; Chen, L.; Cao, G.; He, J.-S. Contrasting effects of nitrogen and phosphorus addition on soil respiration in an alpine grassland on the Qinghai-Tibetan Plateau. Sci. Rep. 2016, 6, 34786. [Google Scholar] [CrossRef] [PubMed]
- Li, J.; Li, Z.; Wang, F.; Zou, B.; Chen, Y.; Zhao, J.; Mo, Q.; Li, Y.; Li, X.; Xia, H. Effects of nitrogen and phosphorus addition on soil microbial community in a secondary tropical forest of China. Biol. Fertil. Soils 2015, 51, 207–215. [Google Scholar] [CrossRef]
- Liptzin, D.; Williams, M.W.; Helmig, D.; Seok, B.; Filippa, G.; Chowanski, K.; Hueber, J. Process-level controls on CO2 fluxes from a seasonally snow-covered subalpine meadow soil, Niwot Ridge, Colorado. Biogeochemistry 2009, 95, 151–166. [Google Scholar] [CrossRef]
- Grogan, P.; Chapin Iii, F.S. Arctic soil respiration: Effects of climate and vegetation depend on season. Ecosystems 1999, 2, 451–459. [Google Scholar] [CrossRef]
- Elberling, B. Annual soil CO2 effluxes in the High Arctic: The role of snow thickness and vegetation type. Soil Biol. Biochem. 2007, 39, 646–654. [Google Scholar] [CrossRef]
- Morgner, E.; Elberling, B.; Strebel, D.; Cooper, E.J. The importance of winter in annual ecosystem respiration in the High Arctic: Effects of snow depth in two vegetation types. Polar Res. 2010, 29, 58–74. [Google Scholar] [CrossRef]
- Liao, G.; Jia, Y. Rangeland Resources of China; China Agricultural Science and Technology: Beijing, China, 1999; Volume 48, p. 346. [Google Scholar]
- Wang, S.; Yang, X.; Lin, X.; Hu, Y.; Luo, C.; Xu, G.; Zhang, Z.; Su, A.; Chang, X.; Chao, Z.; et al. Methane emission by plant communities in an alpine meadow on the Qinghai-Tibetan Plateau: A new experimental study of alpine meadows and oat pasture. Biol. Lett. 2009, 5, 535–538. [Google Scholar] [CrossRef] [PubMed]
- Wang, Y.; Xue, M.; Zheng, X.; Ji, B.; Du, R.; Wang, Y. Effects of environmental factors on N2O emission from and CH4 uptake by the typical grasslands in the Inner Mongolia. Chemosphere 2005, 58, 205–215. [Google Scholar] [CrossRef] [PubMed]
- Sommerfeld, R.A.; Massman, W.J.; Musselman, R.C. Diffusional flux of CO2 through snow: Spatial and temporal variability among alpine-subalpine sites. Glob. Biogeochem. Cycle 1996, 10, 473–482. [Google Scholar] [CrossRef]
- Saari, A.; Rinnan, R.; Martikainen, P.J. Methane oxidation in boreal forest soils: Kinetics and sensitivity to pH and ammonium. Soil Biol. Biochem. 2004, 36, 1037–1046. [Google Scholar] [CrossRef]
- Conrad, R.; Klose, M. Effect of potassium phosphate fertilization on production and emission of methane and its 13C-stable isotope composition in rice microcosms. Soil Biol. Biochem. 2005, 37, 2099–2108. [Google Scholar] [CrossRef]
- Conrad, R.; Klose, M.; Claus, P. Phosphate inhibits acetotrophic methanogenesis on rice roots. Appl. Environ. Microbiol. 2000, 66, 828–831. [Google Scholar] [CrossRef] [PubMed]
- Mastepanov, M.; Sigsgaard, C.; Dlugokencky, E.J.; Houweling, S.; Strom, L.; Tamstorf, M.P.; Christensen, T.R. Large tundra methane burst during onset of freezing. Nature 2008, 456, 628–630. [Google Scholar] [CrossRef] [PubMed]
- Du, R.; Wang, G.; Lü, D. Effect of grazing on microbiological processes of N2O production in grassland soils. J. Environ. Sci. 2001, 22, 11–15. [Google Scholar]
- Pei, Z.; Ouyang, H.; Zhou, C.; Xu, X. N2O Exchange Within a Soil and Atmosphere Profile in Alpine Grasslands on the Qinghai-Xizang Plateau. Acta Bot. Sin. 2004, 46, 20–28. [Google Scholar]
- Wang, G.; Liang, Y.; Zhang, Q.; Jha, S.K.; Gao, Y.; Shen, X.; Sun, J.; Duan, A. Mitigated CH4 and N2O emissions and improved irrigation water use efficiency in winter wheat field with surface drip irrigation in the North China Plain. Agric. Water Manag. 2016, 163, 403–407. [Google Scholar] [CrossRef]
- Baral, B.R.; Kuyper, T.W.; Van Groenigen, J.W. Liebig’s law of the minimum applied to a greenhouse gas: Alleviation of P-limitation reduces soil N2O emission. Plant Soil 2014, 374, 539–548. [Google Scholar] [CrossRef]
- Groffman, P.M.; Hardy, J.P.; Driscoll, C.T.; Fahey, T.J. Snow depth, soil freezing, and fluxes of carbon dioxide, nitrous oxide and methane in a northern hardwood forest. Glob. Chang. Biol. 2006, 12, 1748–1760. [Google Scholar] [CrossRef]
- Song, C.; Zhang, J.; Wang, Y.; Wang, Y.; Zhao, Z. Emission of CO2, CH4 and N2O from freshwater marsh in northeast of China. J. Environ. Manag. 2008, 88, 428–436. [Google Scholar] [CrossRef] [PubMed]
- Barton, L.; Butterbach-Bahl, K.; Kiese, R.; Murphy, D.V. Nitrous oxide fluxes from a grain-legume crop (narrow-leafed lupin) grown in a semiarid climate. Glob. Chang. Biol. 2011, 17, 1153–1166. [Google Scholar] [CrossRef]
- Tang, J.; Wang, J.; Li, Z.; Wang, S.; Qu, Y. Effects of Irrigation Regime and Nitrogen Fertilizer Management on CH4, N2O and CO2 Emissions from Saline–Alkaline Paddy Fields in Northeast China. Sustainability 2018, 10, 475. [Google Scholar] [CrossRef]
- Li, K.; Gong, Y.; Song, W.; Lv, J.; Chang, Y.; Hu, Y.; Tian, C.; Christie, P.; Liu, X. No significant nitrous oxide emissions during spring thaw under grazing and nitrogen addition in an alpine grassland. Glob. Chang. Biol. 2012, 18, 2546–2554. [Google Scholar] [CrossRef]
- Teepe, R.; Brumme, R.; Beese, F. Nitrous oxide emissions from soil during freezing and thawing periods. Soil Biol. Biochem. 2001, 33, 1269–1275. [Google Scholar] [CrossRef]
- Schindlbacher, A.; Zechmeister, A.; Butterbachr, A. Effects of soil moisture and temperature on NO, NO2, and N2O emissions from European forest soils. J. Geophys. Res. Atmos. 2004, 109. [Google Scholar] [CrossRef]
- Hoben, J.P.; Gehl, R.J.; Millar, N.; Grace, P.R.; Robertson, G.P. Nonlinear nitrous oxide (N2O) response to nitrogen fertilizer in relations crops of the US Midwest. Glob. Chang. Biol. 2011, 17, 1140–1152. [Google Scholar] [CrossRef]
- Du, Y.; Cui, Y.; Xu, X.; Liang, D.; Long, R.; Cao, G. Nitrous oxide emissions from two alpine meadows in the Qinghai-Tibetan Plateau. Plant Soil 2008, 311, 245–254. [Google Scholar] [CrossRef]
- Firestone, M.K.; Davidson, E.A. Microbiological basis of NO and N2O production and consumption in soil. Exch. Trace Gases Terr. Ecosyst. Atmos. 1989, 47, 7–21. [Google Scholar]


| Soil Layer (cm) | pH (H2O) | TC (g kg−1) | TOC (g kg−1) | TN (g kg−1) | TP (g kg−1) | TK (g kg−1) | AP (mg kg−1) | AK (mg kg−1) |
|---|---|---|---|---|---|---|---|---|
| 0–5 | 7.5 ± 0.04 | 89.0 ± 1.33 | 72.4 ± 0.16 | 8.7 ± 0.12 | 0.84 ± 0.006 | 15.2 ± 0.09 | 6.2 ± 0.009 | 244.1 ± 0.28 |
| 5–10 | 7.6 ± 0.03 | 66.9 ± 0.72 | 62.4 ± 0.25 | 6.9 ± 0.08 | 0.69 ± 0.006 | 13.8 ± 0.08 | 5.2 ± 0.008 | 225.2 ± 0.23 |
| 10–20 | 8.0 ± 0.02 | 54.8 ± 0.46 | 42.8 ± 0.16 | 5.9 ± 0.07 | 0.56 ± 0.018 | 9.6 ± 0.08 | 3.2 ± 0.008 | 100.7 ± 0.17 |
| 20–40 | 8.4 ± 0.01 | 40.4 ± 0.28 | 33.0 ± 0.19 | 3.7 ± 0.07 | 0.44 ± 0.006 | 7.4 ± 0.08 | 2.2 ± 0.011 | 84.7 ± 0.16 |
| 40–60 | 8.6 ± 0.02 | 30.6 ± 0.29 | 23.6 ± 0.11 | 1.9 ± 0.06 | 0.30 ± 0.011 | 3.7 ± 0.08 | 0.2 ± 0.006 | 61.5 ± 0.09 |
| Average | 8.2 ± 0.02 | 55.6 ± 0.64 | 46.4 ± 0.51 | 5.3 ± 0.07 | 0.56 ± 0.007 | 9.9 ± 0.12 | 3.4 ± 0.06 | 141.6 ± 2.13 |
| Treatments | Different Time-Scale | ||||
|---|---|---|---|---|---|
| GS | NSG | STP | TEP | ||
| CO2 flux (mg m−2 h−1) | Control | 645.8 ± 33.1 c | 89.3 ± 8.2 c | 100.3 ± 6.4 c | 431.8 ± 32.5 c |
| N | 699.9 ± 33.3 bc | 91.5 ± 8.0 c | 98.4 ± 4.4 c | 465.9 ± 34.4 bc | |
| P | 740.6 ± 35.1 b | 101.6 ± 8.2 b | 114.8 ± 6.2 b | 494.9 ± 36.2 b | |
| NP | 818.2 ± 34.0 a | 121.6 ±10.8 a | 130.3 ± 6.6 a | 550.3 ± 37.4 a | |
| CH4 flux (μg m−2 h−1) | Control | −33.6 ± 1.7 a | −14.6 ± 4.1 a | −11.6 ± 6.4 a | −26.3 ± 2.1 b |
| N | −30.0 ± 1.6 a | −13.6 ± 5.1 a | −9.2 ± 8.1 a | −23.7 ± 2.3 ab | |
| P | −29.8 ± 1.6 a | −4.8 ± 4.9 a | 0.2 ± 7.8 a | −20.2 ± 2.4 ab | |
| NP | −28.2 ± 1.6 a | −5.0 ± 6.1 a | 3.7 ± 9.6 a | −19.3 ± 2.7 a | |
| N2O flux (μg m−2 h−1) | Control | 7.5 ± 1.0 c | 8.0 ± 1.7 b | 9.5 ± 2.7 b | 7.7 ± 1.4 b |
| N | 27.0 ± 2.9 b | 28.7 ± 3.0 a | 31.8 ± 3.7 a | 27.6 ± 3.1 a | |
| P | 10.3 ± 0.9 c | 10.8 ± 1.9 b | 12.3 ± 2.8 b | 10.5 ± 1.4 b | |
| NP | 37.4 ± 4.0 a | 26.2 ± 3.0 a | 34.3 ± 3.5 a | 33.1 ± 3.8 a | |
| p-Values of RM-ANOVA | |||||
| CO2 flux | Nitrogen (N) | 0.012 | 0.005 | 0.042 | 0.008 |
| Phosphorus (P) | 0.001 | <0.001 | <0.001 | <0.001 | |
| Date (D) | <0.001 | <0.001 | <0.001 | <0.001 | |
| N × D | 0.003 | <0.001 | 0.023 | <0.001 | |
| P × D | 0.044 | 0.19 | 0.14 | <0.001 | |
| N × P | 0.58 | 0.016 | 0.015 | 0.43 | |
| N × P × D | <0.001 | 0.01 | 0.019 | <0.001 | |
| CH4 flux | Nitrogen (N) | 0.19 | 0.92 | 0.69 | 0.38 |
| Phosphorus (P) | 0.16 | 0.06 | 0.084 | 0.024 | |
| Date (D) | <0.001 | 0.018 | 0.37 | <0.001 | |
| N × D | 0.005 | 0.69 | 0.66 | 0.52 | |
| P × D | 0.057 | <0.001 | 0.001 | <0.001 | |
| N × P | 0.59 | 0.89 | 0.9 | 0.67 | |
| N × P × D | 0.051 | 0.001 | 0.004 | <0.001 | |
| N2O flux | Nitrogen (N) | <0.001 | <0.001 | 0.001 | <0.001 |
| Phosphorus (P) | 0.001 | 0.95 | 0.57 | 0.007 | |
| Date (D) | <0.001 | <0.001 | 0.006 | <0.001 | |
| N × D | <0.001 | <0.001 | 0.010 | <0.001 | |
| P × D | <0.001 | <0.001 | 0.001 | <0.001 | |
| N × P | 0.068 | 0.37 | 0.97 | 0.28 | |
| N × P × D | 0.01 | 0.011 | 0.13 | <0.001 | |
| Treatments | Different Time-Scale | ||||
|---|---|---|---|---|---|
| GS | NGS | STP | TWY | ||
| Cumulative CO2 emission (kg ha−1) | Control | 21,845.2 ± 850.5 c | 4537.4 ± 33.6 b | 720.5 ± 7.1 c | 26,382.5 ± 884.0 c |
| N | 23,495.0 ± 968.4 bc | 5016.3 ± 227.3 b | 717.9 ± 17.4 c | 28,511.3 ± 1172.2 bc | |
| P | 24,740.5 ± 239.5 b | 5092.1 ± 37.8 b | 824.8 ± 19.1 b | 29,832.6 ± 256.8 b | |
| NP | 28,008.7 ± 843.8 a | 6992.6 ± 292.7 a | 946.5 ± 30.6 a | 35,001.4 ± 925.7 a | |
| Cumulative CH4 emission (g ha−1) | Control | −1001.2 ± 68.5 a | −926.1 ± 63.9 a | −68.8 ± 19.9 a | −1927.3 ± 101.2 a |
| N | −899.5 ± 44.7 a | −861.5 ± 169.1 a | −54.2 ± 23.3 a | −1761.0 ± 208.5 a | |
| P | −905.1 ± 43.5 a | −539.4 ± 71.6 a | −3.9 ± 75.2 a | −1444.5 ± 71.0 a | |
| NP | −892.9 ± 89.6 a | −822.3 ± 167.9 a | 14.4 ± 33.6 a | −1715.2 ± 180.4 a | |
| Cumulative N2O emission (g ha−1) | Control | 239.5 ± 35.1 c | 301.1 ± 34.5 c | 66.7 ± 7.2 b | 540.7 ± 69.6 b |
| N | 854.1 ± 36.6 b | 1252.5 ± 101.3 a | 223.1 ± 55.2 a | 2106.6 ± 118.5 a | |
| P | 325.5 ± 26.1 c | 415.3 ± 48.1 c | 78.2 ± 9.3 b | 740.8 ± 70.9 b | |
| NP | 1199.4 ± 62.5 a | 956.9 ± 126.7 b | 242.1 ± 20.6 a | 2156.3 ± 92.8 a | |
| Treatments | GS | NGS | STP | TEP | |||||||||
|---|---|---|---|---|---|---|---|---|---|---|---|---|---|
| AT | ST | SM | AT | ST | SM | AT | ST | SM | AT | ST | SM | ||
| CO2 flux (mg m−2 h−1) | Control | 0.72 *** | 0.85 *** | 0.009 | 0.58 * | 0.71 ** | na | −0.30 | −0.18 | na | 0.76 *** | 0.89 *** | na |
| N | 0.74 *** | 0.86 *** | 0.037 | 0.67 ** | 0.78 ** | na | 0.22 | 0.35 | na | 0.78 *** | 0.90 *** | na | |
| P | 0.76 *** | 0.78 *** | −0.071 | 0.66 ** | 0.77 ** | na | 0.60 | 0.66 | na | 0.78 *** | 0.89 *** | na | |
| NP | 0.70 *** | 0.84 *** | −0.035 | 0.66 ** | 0.73 ** | na | 0.32 | 0.22 | na | 0.78 *** | 0.91 *** | na | |
| CH4 flux (μg m−2 h−1) | Control | −0.068 | −0.14 | −0.32 | 0.19 | 0.15 | na | −0.55 | −0.55 | na | −0.36 * | −0.51 *** | na |
| N | 0.041 | −0.16 | −0.23 | −0.005 | −0.041 | na | −0.49 | −0.46 | na | −0.26 | −0.36 * | na | |
| P | −0.081 | −0.15 | −0.078 | 0.17 | 0.049 | na | −0.087 | −0.081 | na | −0.47 ** | −0.64 *** | na | |
| NP | −0.038 | −0.12 | 0.009 | 0.25 | 0.14 | na | −0.058 | −0.099 | na | −0.22 | −0.39 * | na | |
| N2O flux (μg m−2 h−1) | Control | 0.14 | 0.17 | −0.12 | 0.075 | 0.068 | na | −0.30 | −0.084 | na | 0.036 | 0.011 | na |
| N | 0.70 ** | 0.60 ** | −0.059 | −0.063 | −0.041 | na | −0.64 | −0.55 | na | 0.15 | 0.098 | na | |
| P | 0.59 ** | 0.26 | −0.37 | 0.12 | −0.022 | na | 0.52 | 0.40 | na | 0.15 | 0.004 | na | |
| NP | 0.77 *** | 0.71 *** | −0.17 | 0.23 | 0.054 | na | −0.17 | −0.41 | na | 0.48 ** | 0.41 * | na | |
© 2018 by the authors. Licensee MDPI, Basel, Switzerland. This article is an open access article distributed under the terms and conditions of the Creative Commons Attribution (CC BY) license (http://creativecommons.org/licenses/by/4.0/).
Share and Cite
Wang, G.; Liang, Y.; Ren, F.; Yang, X.; Mi, Z.; Gao, Y.; George, T.S.; Zhang, Z. Greenhouse Gas Emissions from the Tibetan Alpine Grassland: Effects of Nitrogen and Phosphorus Addition. Sustainability 2018, 10, 4454. https://doi.org/10.3390/su10124454
Wang G, Liang Y, Ren F, Yang X, Mi Z, Gao Y, George TS, Zhang Z. Greenhouse Gas Emissions from the Tibetan Alpine Grassland: Effects of Nitrogen and Phosphorus Addition. Sustainability. 2018; 10(12):4454. https://doi.org/10.3390/su10124454
Chicago/Turabian StyleWang, Guangshuai, Yueping Liang, Fei Ren, Xiaoxia Yang, Zhaorong Mi, Yang Gao, Timothy S. George, and Zhenhua Zhang. 2018. "Greenhouse Gas Emissions from the Tibetan Alpine Grassland: Effects of Nitrogen and Phosphorus Addition" Sustainability 10, no. 12: 4454. https://doi.org/10.3390/su10124454
APA StyleWang, G., Liang, Y., Ren, F., Yang, X., Mi, Z., Gao, Y., George, T. S., & Zhang, Z. (2018). Greenhouse Gas Emissions from the Tibetan Alpine Grassland: Effects of Nitrogen and Phosphorus Addition. Sustainability, 10(12), 4454. https://doi.org/10.3390/su10124454