Article

Socio-Economic Factors Influencing Small-Scale Farmers’ Market Participation: Case of Rice Producers in Dano

1
West African Science Service Center on Climate Change and Adapted Land Use (WASCAL), 06 P.O. Box 9507, Ouagadougou 06, Burkina Faso
2
Department of Hydrology and Water Resources Management, National Institute of Water, University of Abomey-Calavi, P.O. Box 526, Cotonou 01, Benin
3
Agricultural Research Centre for International Development—CIRAD, TA C-90/15 l’Hortus 73 rue Jean-François Breton, 34398 Montpellier CEDEX 5, France
4
University Ouaga I Professor Joseph Ki-Zerbo, 03 P.O. Box 7021, Ouagadougou 03, Burkina Faso
5
Applied Science and Technology Research Institute–IRSAT/CNRST, P.O. Box 7047, Ouagadougou 03, Burkina Faso
6
Research Institute for Development—IRD, Université Montpellier 3 Site St Charles 2 71 rue Professeur Henri Serre, 34086 Montpellier, France
7
Environment and Agricultural Research Institute—INERA, 04 P.O. Box 8645, Ouagadougou 04, Burkina Faso
*
Author to whom correspondence should be addressed.
Sustainability 2018, 10(12), 4354; https://doi.org/10.3390/su10124354
Submission received: 15 October 2018 / Revised: 14 November 2018 / Accepted: 19 November 2018 / Published: 22 November 2018

Abstract

:
This paper explores the key factors influencing market participation decisions among smallholder lowland rice growers. Data were collected through purposive sampling technique. A total of 127 rice growers, from 16 lowlands (developed and traditional lowlands), was selected. Descriptive statistics and the probit regression model were used to analyse the data. The statistical analysis revealed significant differences in yields between developed and traditional lowlands rice plots (“lowland development effect”). The regression results showed that farmers’ behaviours were not gender neutral; male producers were more likely to take part in the market as compared to their female counterparts, implying a “gender effect”. With respect to the effect of membership in farmers’ organization, the results indicate that farmers’ involvement in an organization, was in general negatively associated to their market participation decisions. However, farmers from lowlands with functional rice producers’ organizations were more likely to sell their products in the market. Interestingly, this study also highlighted that lowland rice producers’ ability to generate a marketable surplus (at least 20 kg/person/year) positively influence their market participation decision. As hypothesized, the results revealed that farmers who have access to potential buyers of the output (secured market outlets) were less likely to produce rice for self-consumption.

1. Introduction

Burkinabe economy, relatively undiversified and vulnerable to climatic and external shocks, is heavily reliant on its agriculture. This sector accounted for about 15% of the Gross Domestic Product (GDP) in 2017 and absorbed more than 80% of the labour force [1]. Despite its importance in the economy, the sector faces the hardships of many natural disasters-floods, droughts, winds and so forth [2], that compromise agricultural yields. In addition to these precarious agro-climatic conditions, population growth has put more pressure on arable land, especially in the North leading to migration flows toward the West and South-western parts of the country [3,4]. In south-western Burkina Faso, the consequence of this demographic pressure has increased the relocations of lowlands. It is worth mentioning that lowlands were traditionally perceived as impassable areas and relegated to the background [5].
Lowlands can be broadly categorized into two types: the developed lowlands and the traditional lowlands. Developed lowlands refer to lowlands that have been developed/improved by projects, through the construction of water control facility, in order to enhance their performances; while traditional lowlands are lowlands with no external intervention and in which traditional farming methods are still used to grow rice. Initially devoted to grazing [6] and alternatively to maize and rice production, lowlands are currently used for the exclusive or partial production of rice. Henceforth, they have undergone rapid intensification processes, as much in the farming practices (ploughing, transplanting, varieties) and the hydraulic schemes, as in the use (exclusive production of rice). Accordingly, lowlands have become highly coveted areas and have acquired crucial economic importance for the communities that exploit them. However, these new developments expose lowlands to new risks [7].
Lowlands’ rice farming is carried out by small family farms; whose consumption comes from on-farm production. As argued in References [8,9], small-scale farmers produce crops primarily for subsistence and only the marketable surplus is sold. In other words, farmers’ market participation is directly related to marketable surplus generation [10,11,12]. Upender [13] defines this surplus as “the residual product available with the farmers for disposals left after their genuine requirements of family consumption, payment of wages in kind, seed, rent, wastage and other contractual obligations such as loan repayments in kind have been met.” In the literature, many authors reveal a positive relationship between marketable surplus and farmers’ market integration [14,15,16]. Smallholders’ participation in markets is significantly important and can help to alleviate poverty and enhance food security, as farmers’ can diversified their sources of incomes. Thus, it is an important determinant of farmers’ well-being and development [17].
In addition to marketable surplus, farmers’ decision to take part in market is influenced by many socio-economic and farm specific characteristics. For [18], smallholders’ participation in food markets is typically characterised by a constrained choice and this choice is critically dependent upon farmers’ ability and willingness to participate in markets. Some scholars argue that farmers’ market participation is influenced by factors which are both external (such as input and output markets, institutions, cultural and social factors, labour opportunity costs) and internal (natural capital) to the farmers’ socio-economic environment [16,19,20]. Several studies, have also pointed out the complementary role played by other additional factors. Authors (such as [19,21]) for instance, have pointed out the significant role played by household size, cropped area, yield, access to market, access to credit, age, total land size, group participation, market information and contractual agreement, household labour, inadequate transport and storage facilities.
Farmers’ social networks (farmers’ groups and others social organisations) can play a crucial role in farmers’ decision-making, through mechanisms such as information diffusion, knowledge sharing, cooperation, solidarity and social interaction [22,23]. A common feature of small-scale farmers is their low participation in the markets due of a range of constraints and barriers such as poor transport and storage infrastructures, weak banking system (lack of credit and insurance markets), non-competitive situations and inadequate market information. Most of these small-scale farmers face serious financial and cash flow difficulties. They are therefore very often forced to sell immediately after the harvest while prices are lower. Moreover, storage infrastructures are more often inefficient and as a result, farmers are unable to defer sales until prices rise, generating additional losses. Collective action is often proposed as a strategy to reduce the risks of market participation [24]. In a non-competitive market situation, many and dispersed small-scale farmers may find themselves in front of a limited number of buyers. In this case, the buyers are in dominant market positions and are price makers. To reverse this situation, farmers have to organise themselves and practice bundled sales.
Conversely, farmers’ ability to participate effectively in the market is most often hampered by personal, cultural and institutional constraints [21]. According to [12], farmers produce according to an “income-objective” (anticipation income). This objective-income is set to be used for socially obligatory expenses such as funerals, weddings and religious ceremonies on the one hand; and children’s education expenses, health expenses, the payment of taxes and unexpected expenditures on the other hand.
What could be the key factors impacting smallholder lowlands rice producers’ decisions to market their outputs?
A better understanding of the factors that shape farmers’ decision is needed to take appropriate measures. strengthen future programming. This could inform lowlands development projects and stakeholders and potentially strengthen future program interventions. The present study aims to understand Ioba’s lowlands rice-producers’ decision to participate in a market-based exchange. Specifically, the study probes whether the market participation decision of these producers is associated with their ability to generate a marketable surplus for income. In essence, this variable is expected to determine farmers’ implication to market, in particular for developed lowland farmers. Indeed, unlike traditional lowlands farmers, farmers’ commitment in developed lowlands requires their contribution to the maintenance of water control infrastructure and structures. This is generally done through an establishment of a working capital fund, in which each producer has to contribute financially. Moreover, farmers in developed lowlands are somehow engaged in intensive rice cultivation that requires more agricultural inputs like fertilizers, pesticides, herbicides and improved seeds. These costs must be covered by sales of the paddy. If the harvested rice remains self-consumed (as it is traditionally), it is unlikely that the producers release resources to intensify their rice production and ensure the maintenance of the lowland. Additionally, factors such as farmers’ socio-economic characteristics, farmers’ social capital, lowland characteristics and institutional factors are hypothesized to significantly influence lowland rice farmers’ decision-making.
The remainder of this paper is structured as follows. The second section provides a synopsis of the evolution of rice production in Burkina Faso. The third presents the materials and methodology used in this study. Section four discusses the results and the fifth section concludes and provides some recommendations.

2. Overview of Rice Production in Burkina Faso

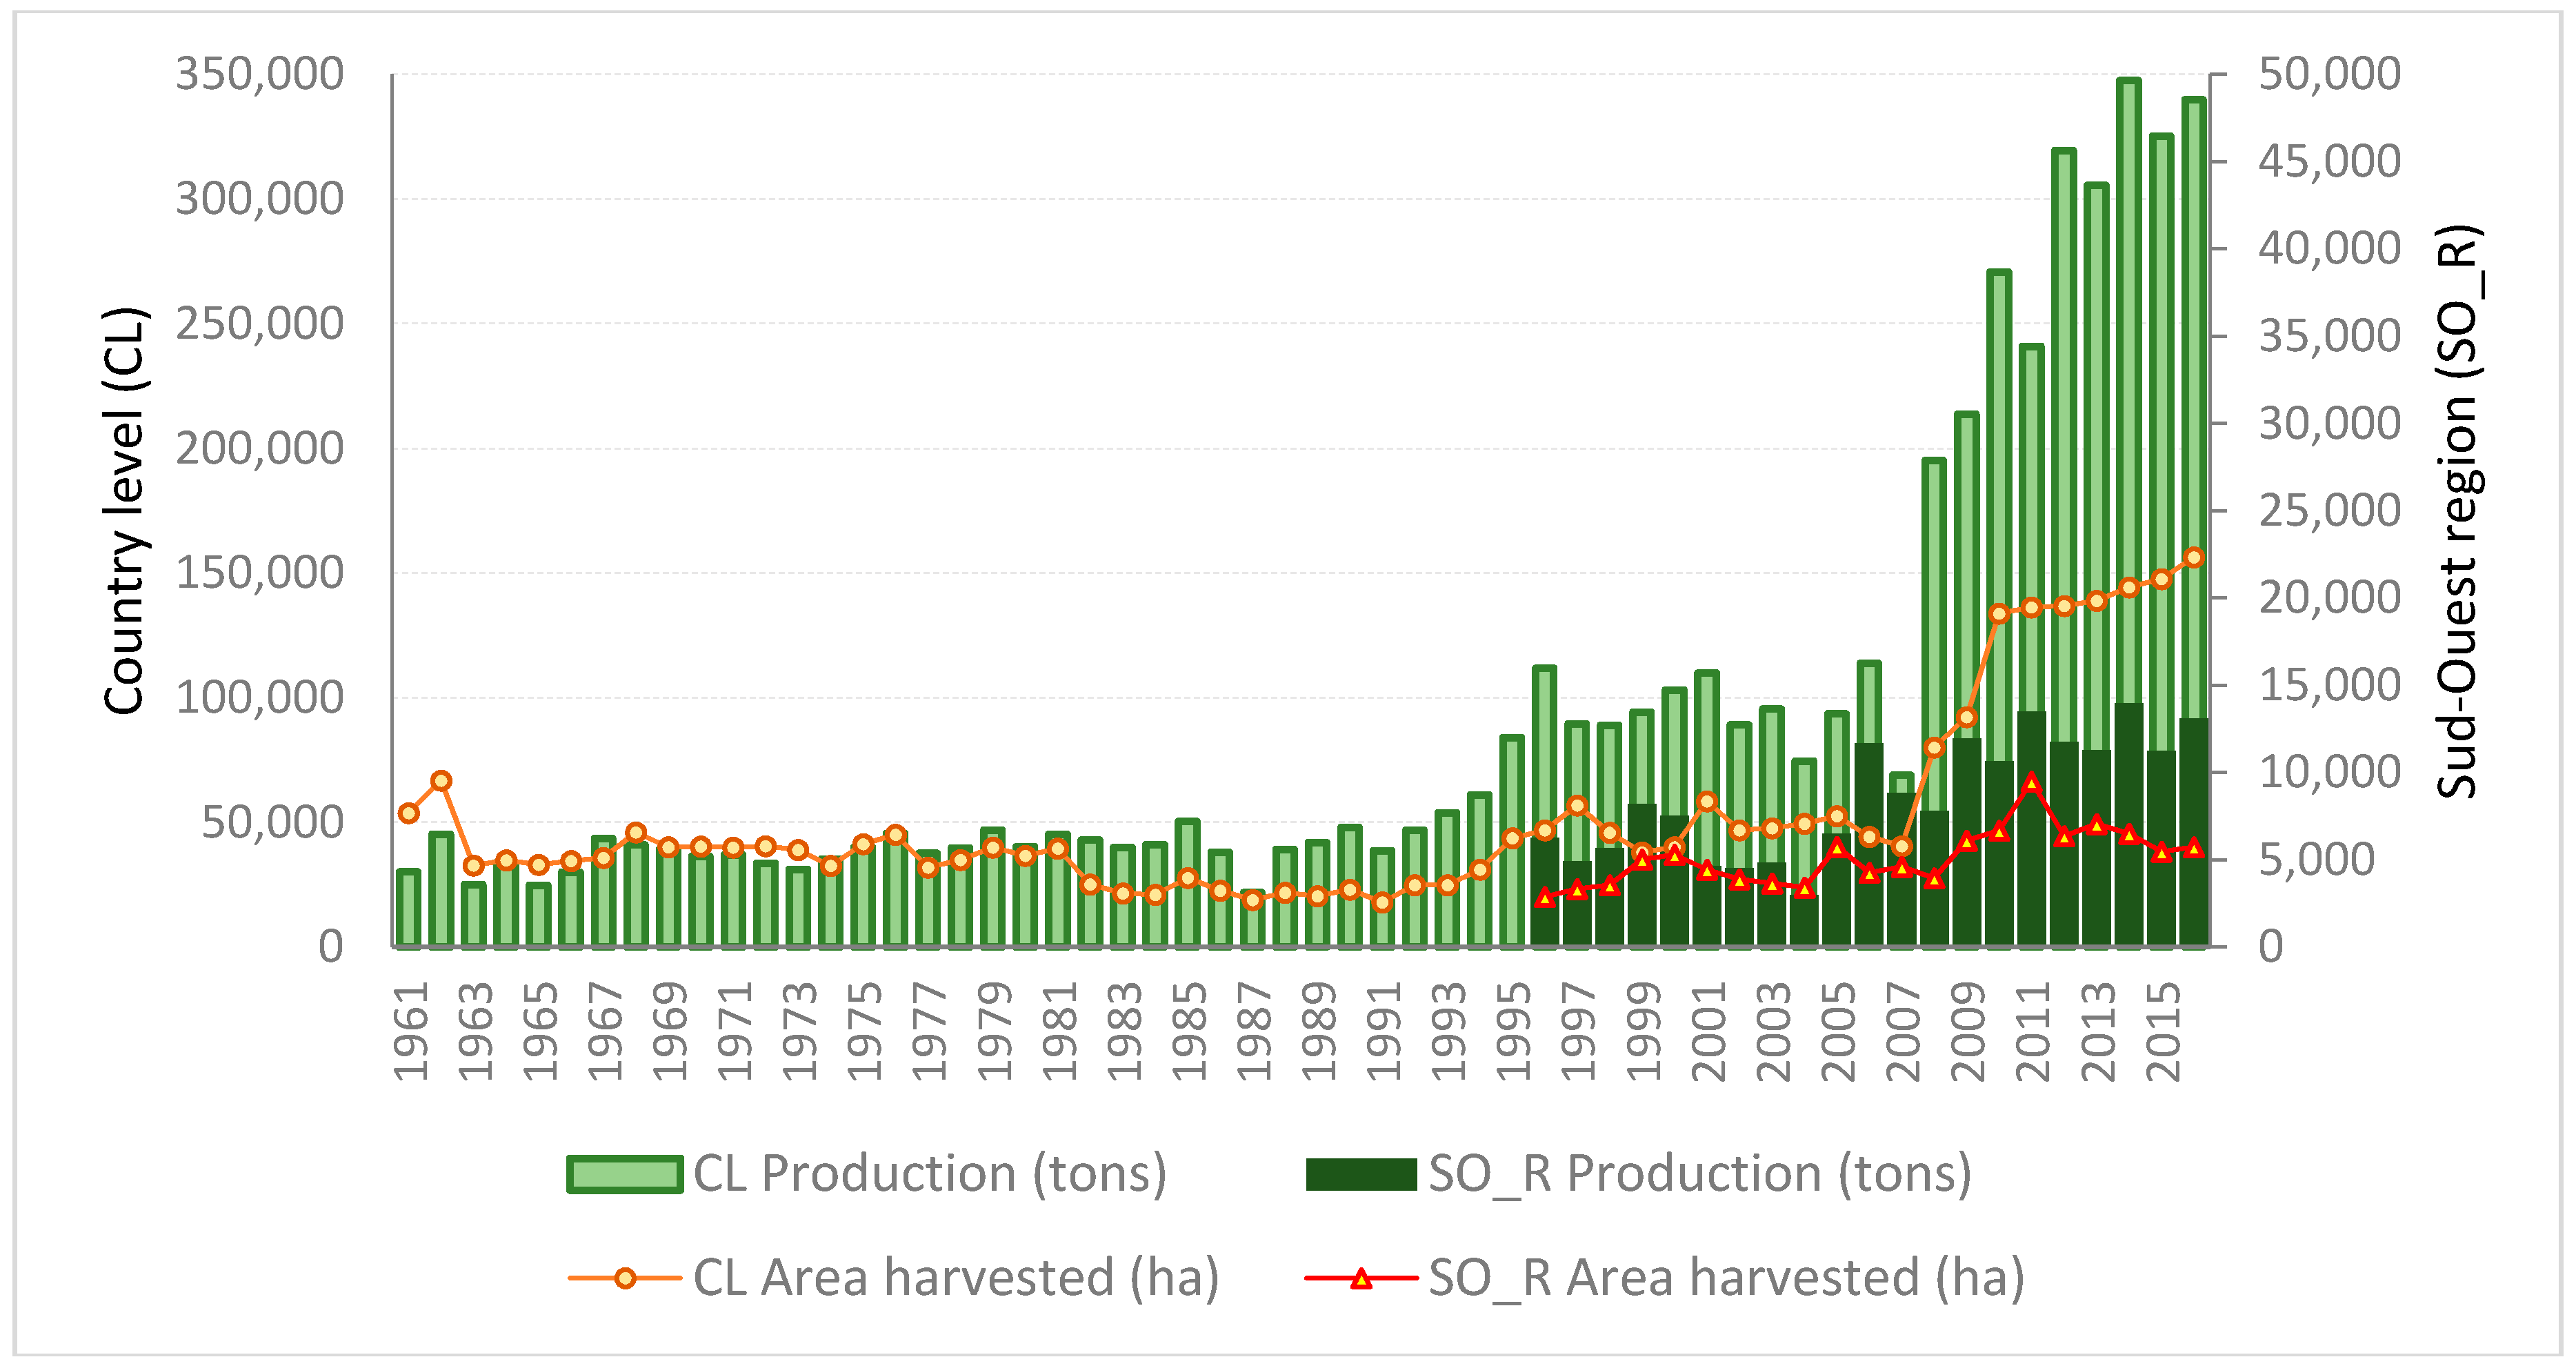
2.1. Evolution of Rice Production

Rice sector is one of the sectors which have chalked up phenomenal growth over the last twenty years; in terms of the areas cultivated, the volume produced and the annual consumption per capita [25]. It ranks in fourth place among the cereals grown in terms of area, production and per capita annual consumption [26]. Simple statistical analysis of the historical data on rice production and the area under rice in Burkina Faso provide insights into the evolution of rice sector. As indicated in Figure 1, rice production in Burkina Faso has experienced substantial growth during the period 1961–2016. This growth is much more linked to the intensification of rice production in recent decades than cropland expansion. This is shown by the rapid growth of the yield. Indeed from 560 kg per hectare in 1961 and 1080 kg per hectare in 1974, the yield reached two tons per hectare in 2000. The analysis further indicates that the average production of rice has increased between 1996 and 2016 with 6% Compounded Annual Growth Rate (CAGR) (Compounded Annual Growth Rate (CAGR) = ( ( P r o d u c t i o n   ( N n ) P r o d u c t i o n   ( N 0 ) ) 1 n ) 1 ) . Perceptibly, this evolution of rice production at the national level is also observed in Ioba province, where the agricultural potential is quite favourable given the acceptable climate conditions and the suitability of lowlands. The CAGR of rice production in the Sud-Ouest region was about 4% during the period 1996–2016.

2.2. Study Areas Farmers’ Market Participation

Like most cereal growers’ in Sub-Saharan Africa, lowlands rice growers decide to take part in the market, when they generate a marketable surplus. Marketable surplus refers to the portion of a harvest that a farmer can sell on the market; after meeting the rice consumption requirement of his household’s members and the other retention (seed purpose, gifts…). In other words, it refers to the difference between the total output produced by a farmer and the quantity kept for self-consumption, for seed, gifts and other contractual obligations (payments in kind). According to [27], the annual rice consumption per capita ranges from 10 to 15 kg per person, at the national level. This consumption reaches the threshold of 50 kg/person/year, in urban areas such as Ouagadougou and Bobo-Dioulasso. In order to estimate rice producers’ ability to generate a marketable surplus, we established a threshold of 20 kg/person/year above which farmers can generate a surplus that can be sold in the market (market participation index). This threshold is based on the local statistics and the authors’ experiences and familiarities with the study area. It encompasses self-consumption, seed retention, gifts and payments in kind to labourers.

3. Materials and Methods

3.1. Material

In order to better examine empirically factors that impact rice farmers’ decisions in the use of the output, we use a mixed approach combining quantitative data and qualitative research techniques through complementary approaches, namely Focus Group Discussions (FGDs), semi-structured and key informants interviews and lowlands external diagnosis. This mixed-methods approach allows us to better gather information on farmers’ perceptions, their activities on lowlands and uplands as well as biophysical features.

3.1.1. Sampling Procedure, Data Collection and Analysis

Ten developed lowlands and six traditional lowlands from four rural communes (districts) out of eight rural communes that comprise the province of Ioba were purposively sampled. A multi-stage sampling procedure was applied to select sampled lowlands. In the first stage of clustering, a desk study was carried out to make an inventory of lowlands and their types of development that can be found. In this process, 17 developed lowlands were selected. The second stage refers to the selection of ten developed lowlands, among the 17 lowlands initially sampled. These lowlands were selected in such a way that they cover the maximum diversity of lowlands based on the type of water control facility, the level of functionality or performance of water infrastructures and the position of the lowland in a watershed (Figure 2). Six traditional lowlands, located in the same watershed as developed lowlands, were also selected as control lowlands (Table A1). These activities were carried out by a multidisciplinary team including agronomists, geographers, hydrologists and economists.
The data were collected between May and June 2017. A total of 28 group-discussions, 17 external diagnoses and 127 lowland rice producers were surveyed. Individual survey data entry was done on CSpro software (Version 6.3, United States Census Bureau, Suitland, MD, USA) and the analysis on SPSS software (Version 20.0, IBM Corporation, Armonk, NY, USA) and Stata (Version 13.0, StataCorp., College Station, TX, USA). Graphs used in this study were produced in Microsoft Excel (Version 2013, Microsoft, Redmond, WA, USA).
A Student’s t-test was performed to test whether the means variables (rice area, the total production and the yield) significantly differ between developed and traditional lowlands; and by gender, respectively. Homogeneity of Variances was tested using F-test to ensure that any significant difference found were likely to be a genuine effect and not due to the differences in sample size. A Probit model was used to analyse the determinants of farmers’ market participation.

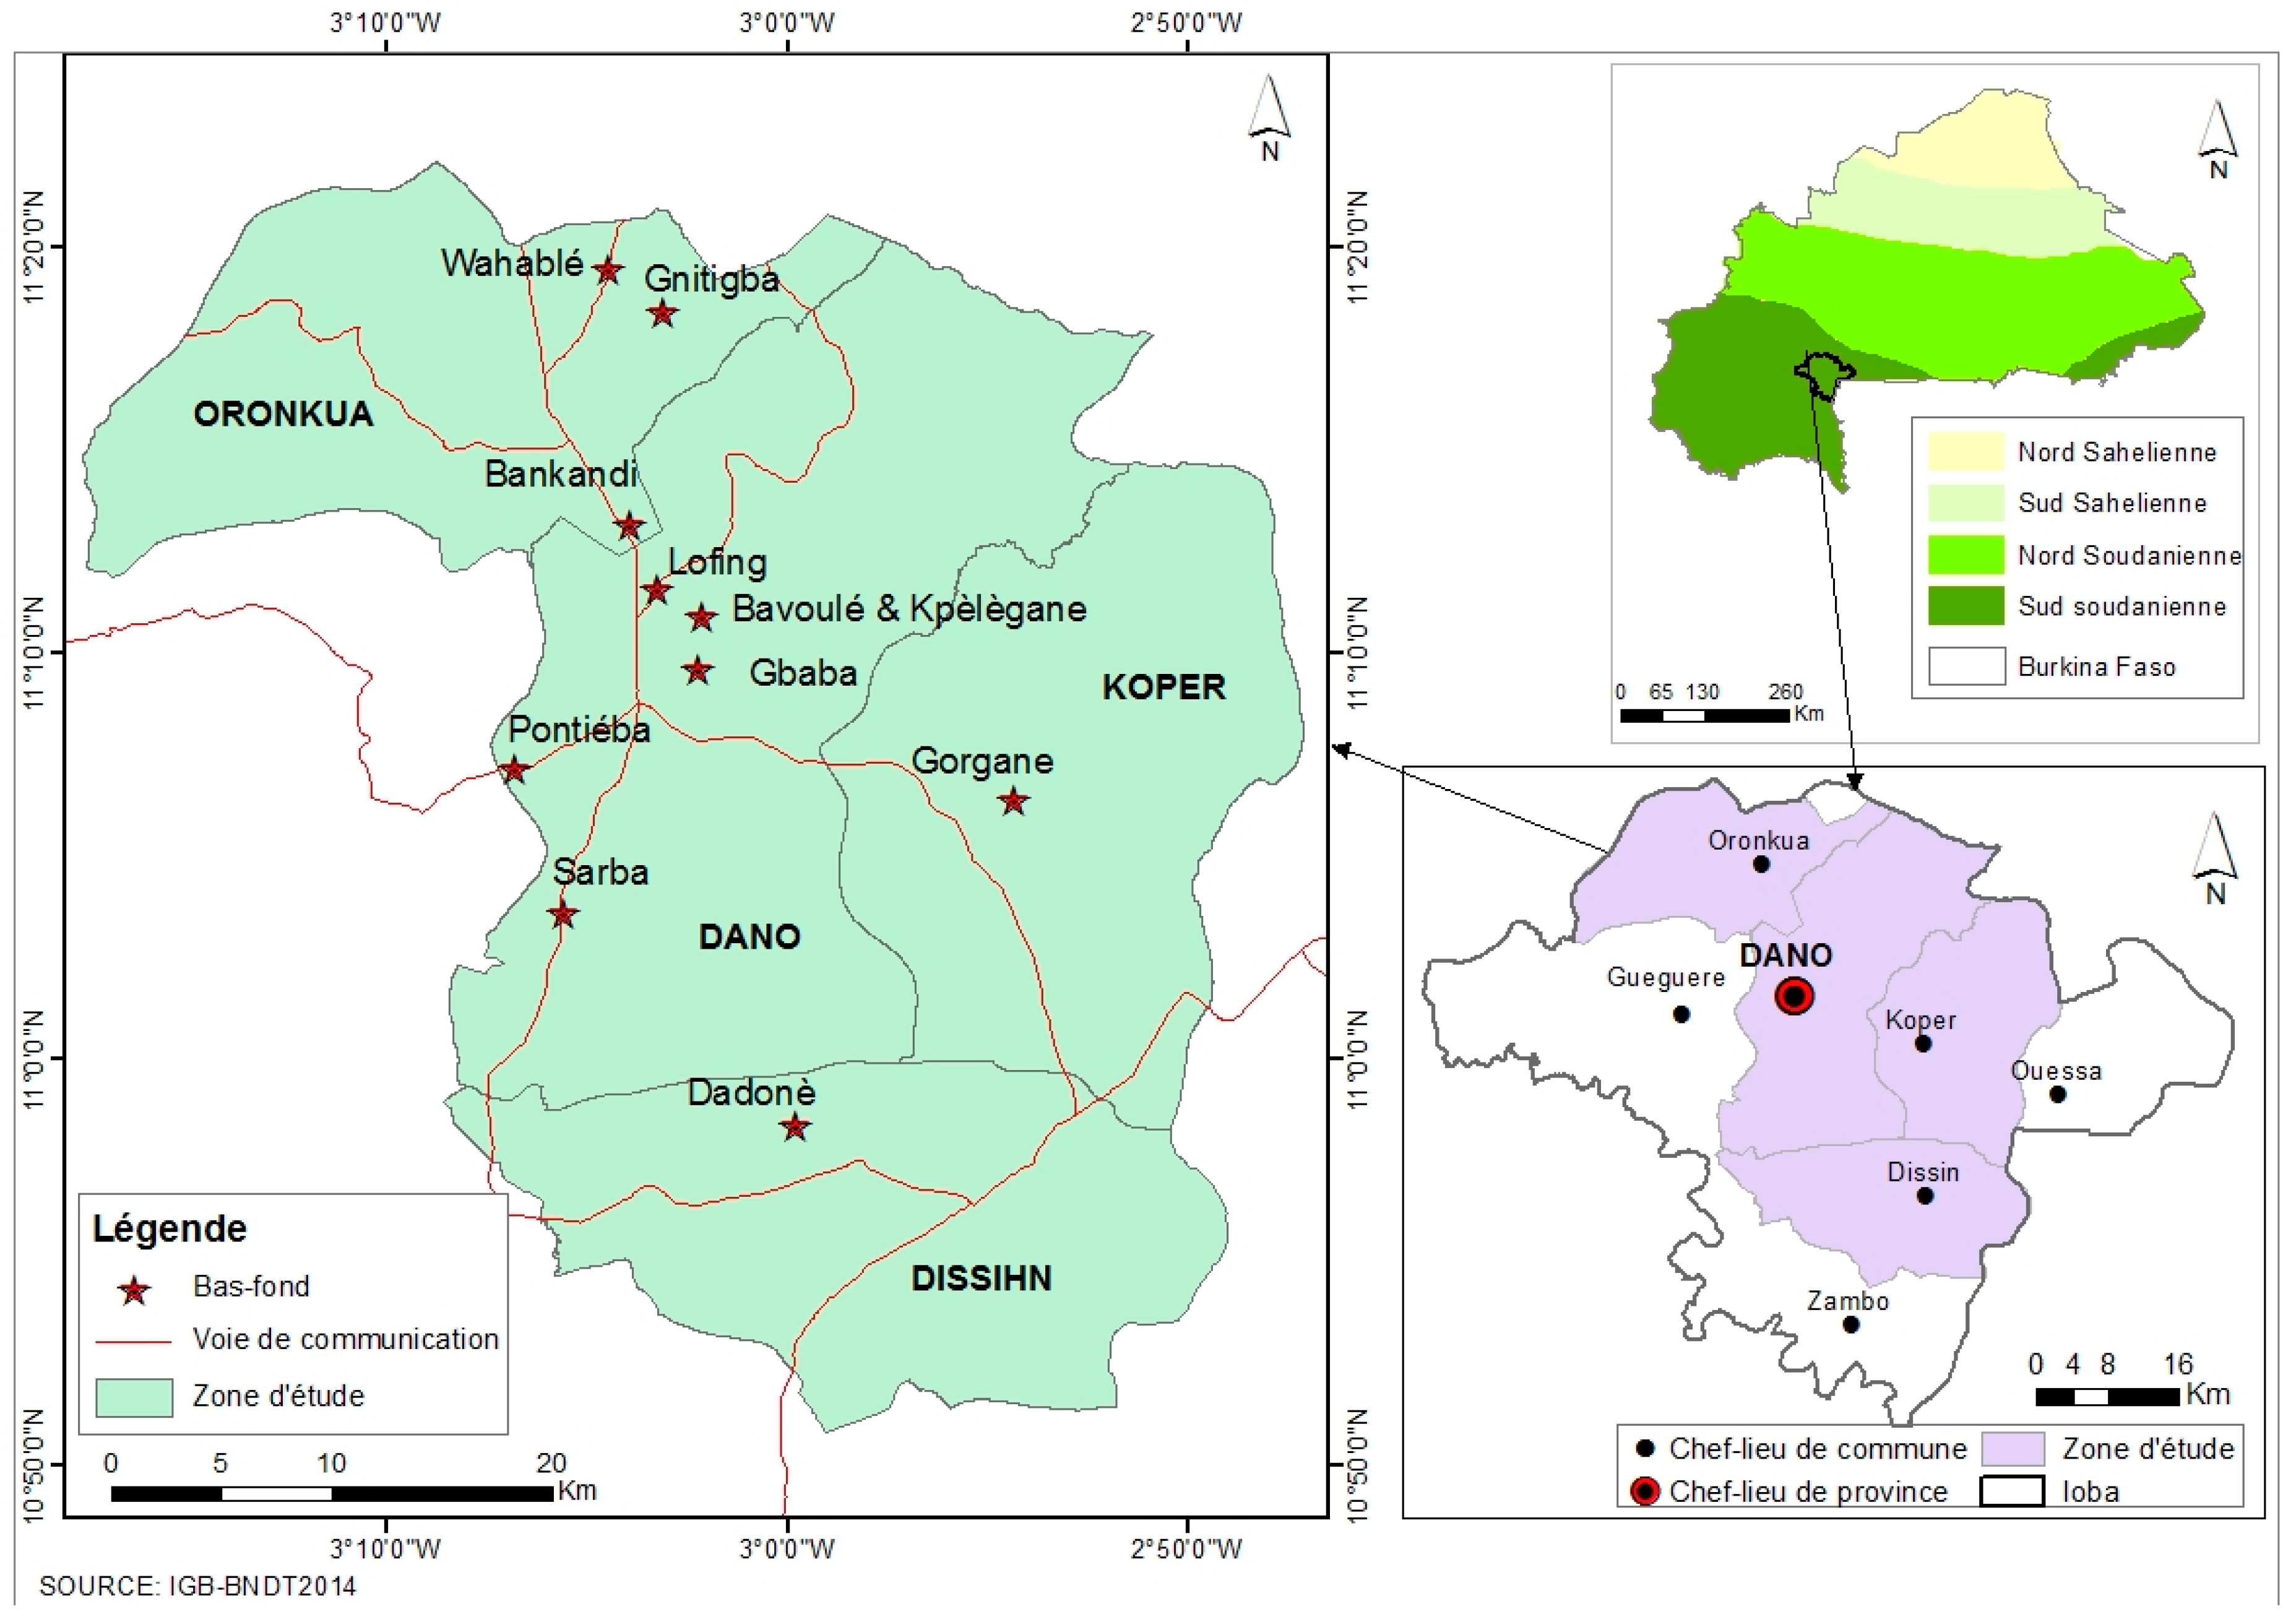
3.1.2. Study Area Description

The study was conducted in the Ioba province (11°55′ N, 3°22′ W), located in the South Sudan agroecological zone. It is located in the Sud-Ouest region of Burkina Faso (Burkina Faso is divided into 13 administrative regions, which are divided into 45 provinces and subdivided into 301 communes). The region counts about 68,490 hectares of lowlands, of which 36,334 hectares can easily be developed or improved. The study area is relatively endowed with a good climate and is among the wettest areas of Burkina Faso. The annual rainfall varies between 900 and 1200 mm. The length of the growing season in the study areas is 140–170 days [28,29]; the rainy season begins in late-April and reaches its peak in July/August. The average annual temperature is 27.7 °C. These climate conditions, added to the relatively good quality of soil, confer to Dano, a propitious area for agro-pastoral activities.

3.2. Empirical Model and Model Variables

3.2.1. Theoretical Framework

This study was built on the random utility theory, in which economic agents (farmers) decide to consume the entire output or participate in a market. The decision on whether or not to participate was considered under the general framework of utility or profit maximization [30,31]. In this theory, it is assumed that a decision-maker faces a choice among alternatives and would choose the alternative that provides the greatest utility. In other words, he will choose the alternative i if and only if, the utility he derives from this alternative is greater than all the other alternatives in the choice set.
U i >   U j       j i ,

3.2.2. Empirical Model

We used the probit model to examine factors influencing farmers’ decisions to participate in a market-based exchange. This model is appropriate when the dependent variable is qualitative and dichotomous, which is the case in this study. Let y i be the dichotomous variable taking the value 1 if the farmer is selling rice and zero if not. This model is based on utility theory [32], highlighting that the household makes an economic calculation by comparing the cost and the profit which depend on the utility which it obtains from the sale of rice and that related to do not selling it. The difference between profit and cost is considered as an unobserved variable noted y i * . Then the Probit model is described as follows:
y i * = X i β + ε i ,    ε i ~ [ 0 ,   1 ] ,
y i = 1 ,    i f    y i * > 0 ,    otherwise   y i = 0 ,
where, y i * is a latent variable representing farmers’ decisions to sell rice, X i is a vector of explanatory variables, β a vector of parameters associated with explanatory variables, ε i is the independently and normally distributed error term assumed to be normal as: ε i ~ [ 0 ,   1 ] .
Following Green (2011), the probability ( p i ) of farmers’ market participation can be expressed as:
p i = P r o b   [ y i = 1   |   X i ] = Φ ( X i β ) ,
where Φ represents the cumulative distribution of a standard normal random.
The probability of farmers’ market participation was estimated sequentially in three steps. In the first, we estimated the overall effect of lowland rice farmers’ ability to generate a marketable surplus on their decision to commercialise their outputs in market (step 1):
P r o b   [ V e n t e i j k = 1   |   β ,   X i j k ] = Φ ( β 0 + β 1 M S i j k ) ,
where Vente i j k refers to market participation decision made by farmer i (I = 1, …, 127), from village j (j = 1, …, 10) working in lowland type k (k = 1, 2). M S i j k refers to producers’ ability for generating surpluses that can be marketed after meeting their households’ members rice consumption requirement.
Then, in the second step, lowland characteristics ( L C j k ) and institutional factors ( I F j k ) were added to control for their potential effects (step 2):
P r o b   [ V e n t e i j k = 1   |   β ,   X i j k ] = Φ ( β 0 + β 1 M S i j k + β 2 L C i j k + β 3 I F i j k ) ,
Finally, we controlled for the effect of farmers’ socio-economic factors ( S E i j k ) and social capital ( S C i j k ) in lowland farmers’ market participation (step 3):
P r o b   [ V e n t e i j k = 1   |   β ,   X i j k ] = Φ ( β 0 + β 1 M S i j k + β 2 L C i j k   + β 3 I F i j k + β 4 S E i j k + β 5 S C i j k ) ,
● The marginal effect
The expected change in probabilities of rice producers’ market participation resulting from a unit change in the explanatory variables is giving by means of the marginal effect. It accounts for the partial change in the probability and can be derived as follows:
p i x i j k = ( X i β ) β j k ,
where represents the probability density function of a standard normal variable.
A total of 12 explanatory variables were identified as main influencing farmers’ decisions to sell rice (Table 1).

4. Results and Discussion

4.1. Socio-Economic Characteristics of Lowland Rice Producers

A total of 127 individuals is included in the study, of which about 46% are illiterate, while 21% and 33% of them had attained non-formal and formal education, respectively. The mean age of respondents is 44, which shows that rice farming is mainly practised by the middle-aged group (36–55 years). Approximately 67% of surveyed rice producers are men. The average household size is ten people and each respondent is in charge of about nine persons. About 78% of the sample are rice producers the in developed lowlands, with an average plot size of 0.25 ha; while 34% of them are working in the traditional lowlands, with an average plot size of 0.55 ha. The results further indicate that about 12% of rice producers, in this study, are operating on both types of lowlands. Nearly 102 rice producers out of 127, of which 23% are women, are able to produce at least 20 kg/person/year. An overwhelming majority of respondents (70%) are smallholders (farm size between 0 and 5 ha); the mean farm size, however, is about 4 ha. The result further shows that 85% of lowland rice producers belong to a social organization; while only 49% of them are working in lowlands with functional rice farmers’ organization.

4.2. Statistical Analysis of Rice Production in the Surveyed Lowlands

This sub-section presents the statistical analysis of rice production in the study sites. It starts with a brief description of the use of rice produced in lowlands. This is then followed by the statistical analysis of rice production. A comparison was made between developed and traditional lowlands rice producers and between male and female farmers. For that, a two-sample statistical test involving the F-test and t-test was used. If the F-test shows homogeneous variances (F-test nonsignificant), Student’s t-test is used to compare means; if on the contrary, the equal variance assumption is violated, the Welch’s t-test (unequal variances t-test) is used for comparison.

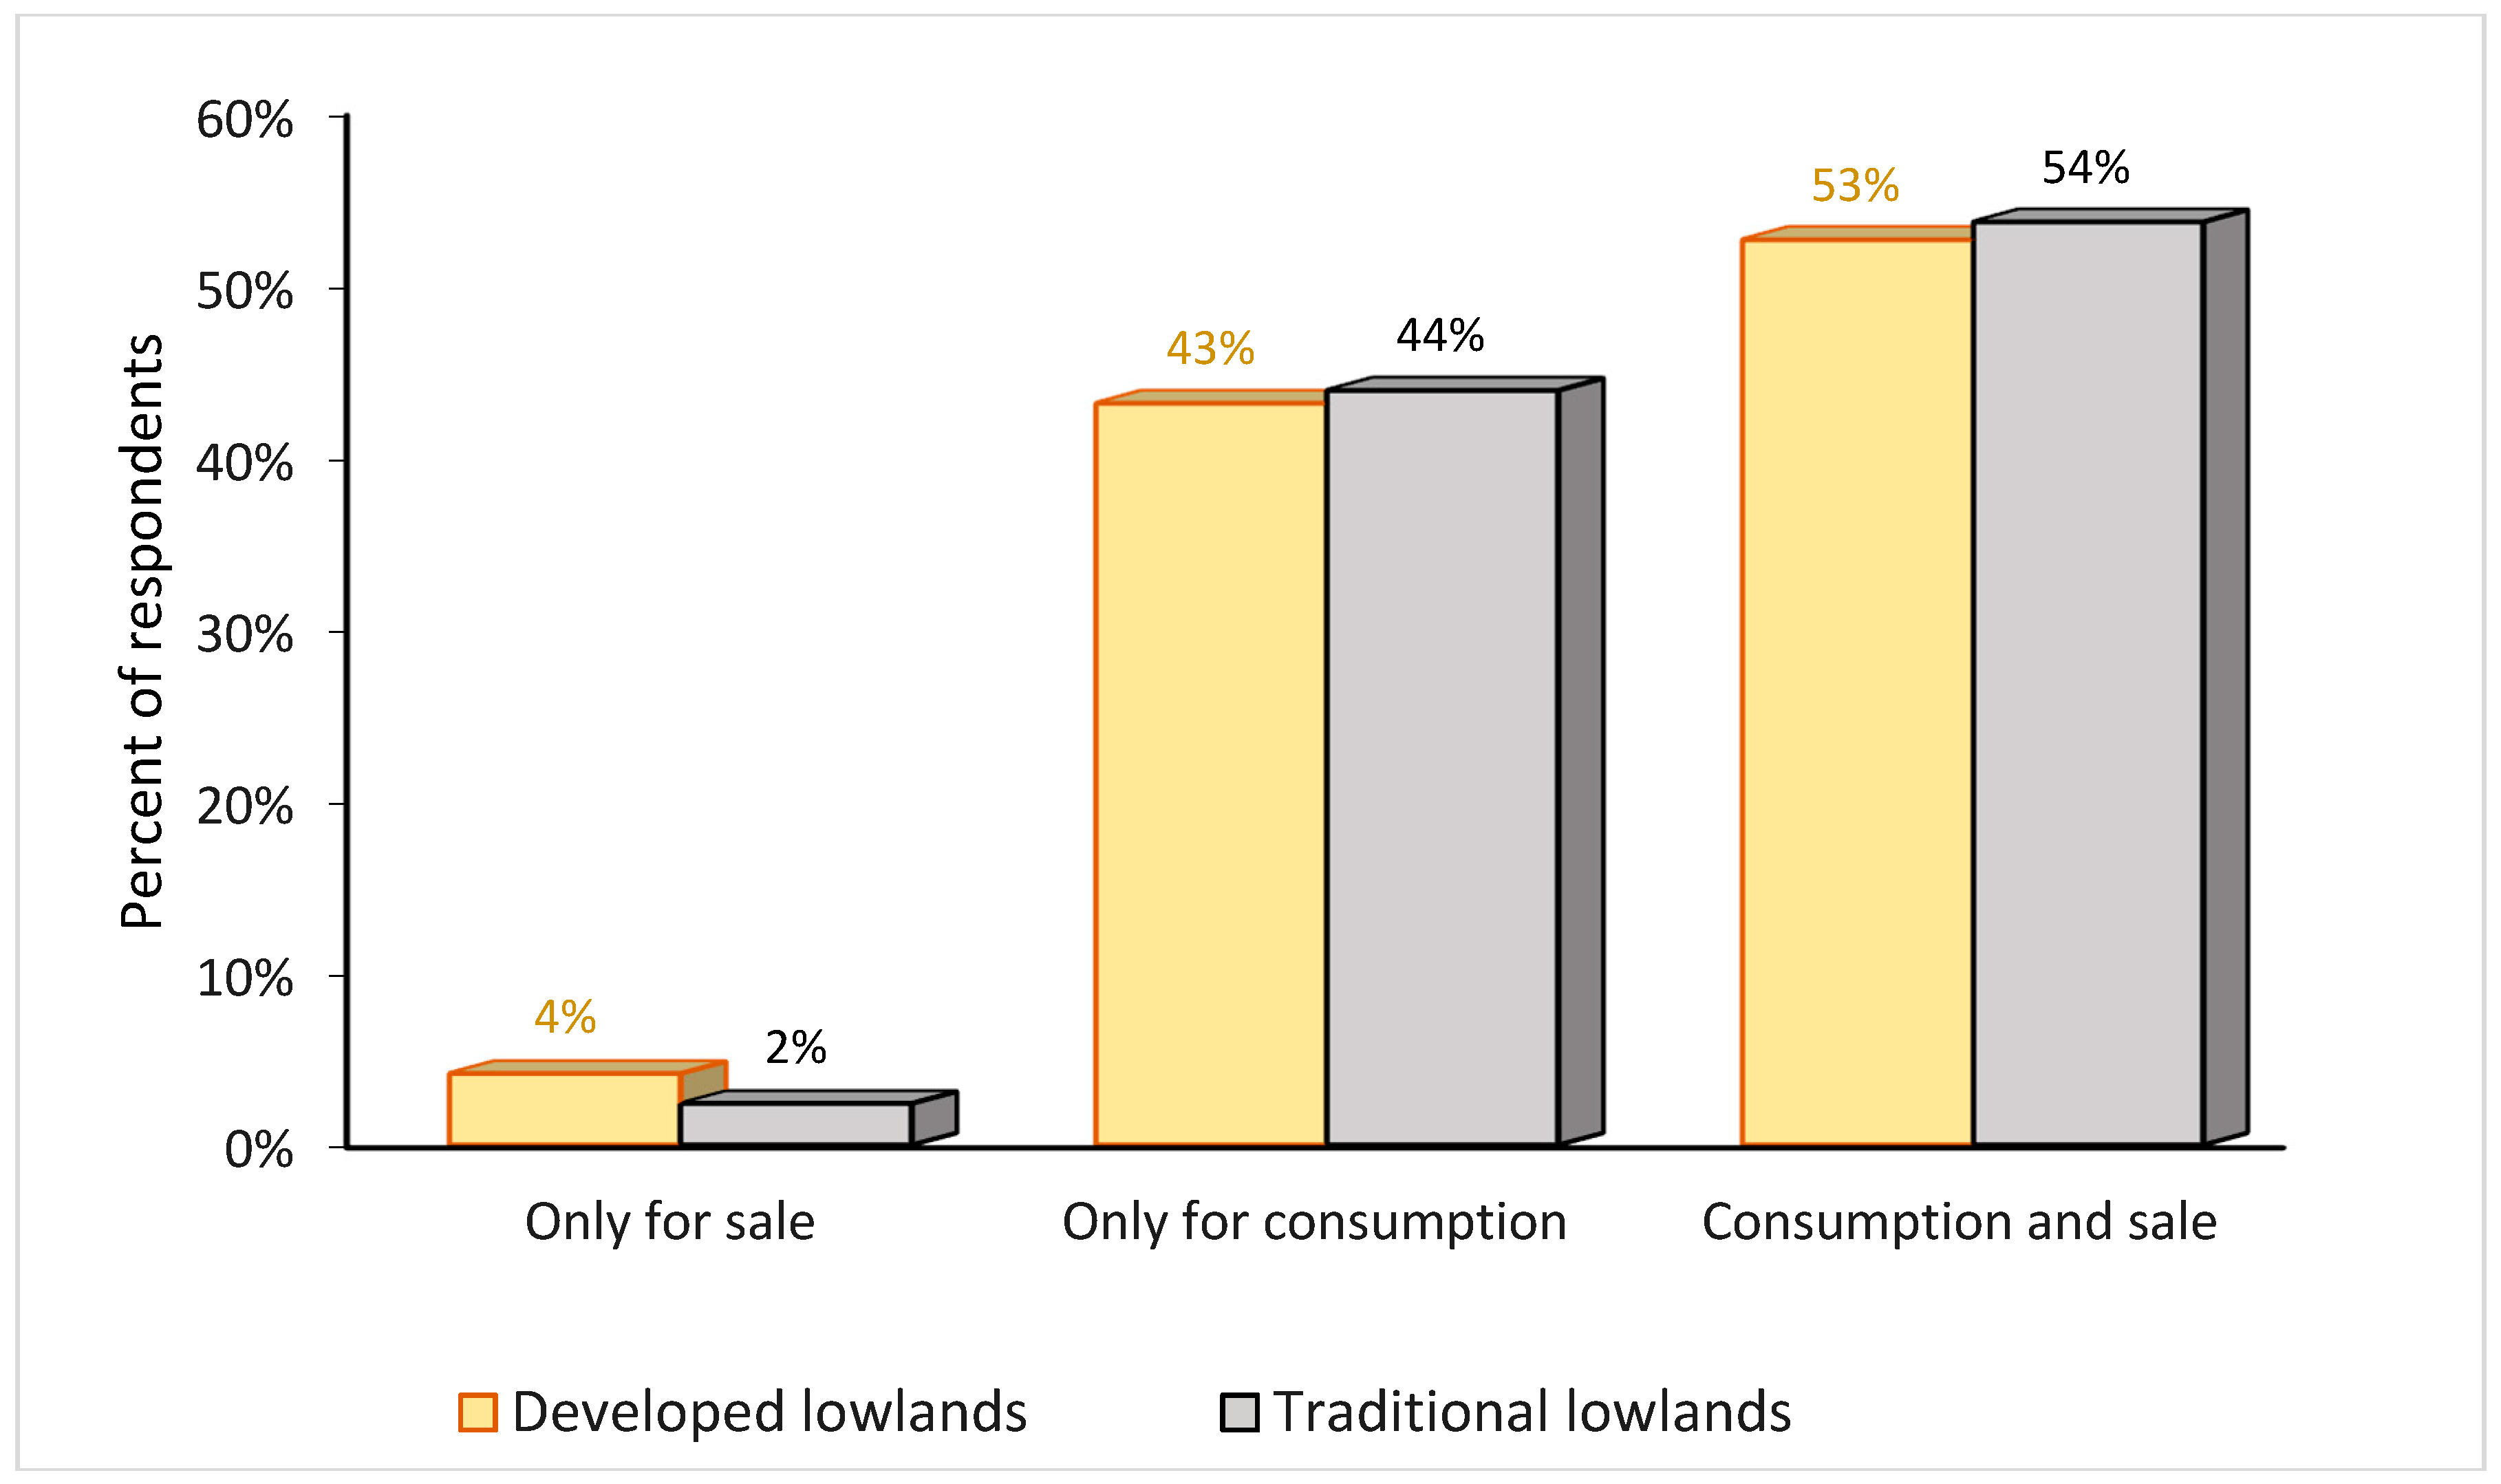
4.2.1. Lowlands Rice Use in the Study Area

The result depicted in Figure 3 indicates that an important part of rice produced in lowlands is directed toward self-consumption or non-market exchanges; about 43% (n = 41) and 44% (n = 18) respectively for developed and traditional lowlands rice growers. This result is quite higher than the aggregated rate from the country level results in which, rice growers’ self-consumption represents roughly 35% and 40% of the rice produced in the lowlands [33].
We further analysed, the relationship between the overproduction (higher than 20 kg/persons/years) and the use of the output. The results indicate that 66% of developed lowlands users produce rice for self-consumption or non-market exchanges, even though they were able to raise a marketable surplus (20 kg/persons/years); while in traditional lowlands, this represents about 72% of farmers. This fact reveals that for these farmers, the decision to consume all the product is not motivated by the lack of marketable surplus but a personal decision, reflecting their preference for rice. The conclusions that can be drawn from this result are twofold: (i) a change in farmers’ dietary habits when it is known that the main staple crop for the local population was made up almost exclusively of sorghum and millet; (ii) farmers’ social positioning, having a rice reserve for social events is a privileged social status. Indeed, in the area, rice was somehow considered as luxury products and such was only served on special occasions like weddings and funerals. The results further show that an overwhelming majority of respondents (roughly 92% in developed lowlands and 91% in traditional), who grow rice for both self-consumption and market, were also able to generate a marketable surplus.

4.2.2. Rice Production by Type of Lowlands

Based on the results depicted in Table 2, rice producers in developed lowlands are relatively better off than those working in traditional lowlands. As an illustration, the average yield is significantly higher in developed lowlands than in traditional lowlands. Our results confirm the hypothesis that the improvement of lowland operating systems has a positive and significantly effect on rice production in lowlands. This result is probably due to the predominance of traditional farming practices, lack of support from projects (inputs supply) and the absence of monitoring by the extension agents. The results further show in traditional inland valley, the average size of plot/producer is at least twice as large as the average plot area/producer in developed lowland.

4.2.3. Rice Production by Gender

The results reveal that about 42% of the respondents’ were women, suggesting that there were fewer female farmers involved in lowland rice production compared to their male farmers. Previous studies attributed these results to fact that rice production is more labour-intensive activity [34] and constrained by socio-economic factors such as resource endowment, shortage of land and lack of adequate extension services [35]. The results further indicate that all (100%) traditional lowlands users are male. For that reason, only developed lowland is considered for the statistical analysis of rice production by gender. The analysis of the results by gender reveals a yield gap of about 898 kg/ha (Table 3). As shown in this table the average rice yield in male producers’ plots is significantly higher than the one in female producers’ plots; this implies a “gender effect.” The result is in line with the findings of [36], in which the average yield of male rice farmers was about 3195 kg/ha versus 2459 kg/ha for female in Ebonyi State of Nigeria. According to extension agents, this relative low yield in plots own by women can be explained by the fact that in most cases rural female producers’ working time in their own land is relatively low compared to their male counterparts. Indeed, they usually work in two plots simultaneously, namely their husbands’ plot and their own plot. Besides, according to these agents, the women plots are less endowed in terms of fertilizers and pesticides than those of men. For instance, the obtained subsidized fertilisers and other inputs, the use of these inputs is mostly left to the discretion of their husbands. All those factors put together, add to the lack of training and access to extension services could probably explain yield inequality.

4.3. Results of the Probit Model

The probit regression results of the three steps (Equations (5)–(7)) described above are presented in Table 4. The goodness of fit, measured by the Chi-square value is highly significant (p < 0.000), showed that the model has a strong explanatory power. In other words, the choice of explanatory variables included in the probit model explained the variation in farmers’ decisions to participate in the market.
In the first step (Equation (5)), the results show that farmers’ decisions to participate in the market are positively and highly associated (p < 0.01) with their ability to generate an agricultural surplus. We additionally control for lowland characteristics and institutional factors potential effects in step 2 (Equation (6)); As a result, farmers’ market participation is still highly (p < 0.01) related to their ability to generate an agricultural surplus. Finally, when controlled for the effect of farmers’ socio-economic and social capital factors (Equation (7)), the relationship remains unchanged. This consistency in the association between farmers’ market participation and farmers capability to produce marketable surpluses denote the robustness of the relationships. To put it differently, the variable Marketable Surplus (Market Participation Index) is not sensible changes in model specification.
Concerning the effect of other variables, the results further indicate that farmers’ decisions to participate in the market is significantly associated with farmers’ socio-economic factors such as the gender of the respondent, farmers’ social capital factors (membership in farmers’ groups and in functional farmers’ lowland organization), institutional factors (availability of a potential buyers for the output) and lowland fixed effects (age of the lowland).

4.4. Discussion

Like most farmers in rural areas, lowland rice farmers are engaged in production for both self-consumption and market. To illustrate, as indicated above, about 43% of Ioba lowlands rice growers are producing rice for only self-consumption. That is to say that more than the half of lowlands rice producers (57%), included in this study, are engaged in market-based exchanges. On such, one of the key motivations for farmers’ participation in markets is when they produce sufficient marketable surplus after having satisfied their households’ rice consumption requirement [12,13] and other contractual and social obligations [15,16,17]. In order to estimate rice-producers’ ability to generate an agricultural surplus, we established a threshold of 20 kg/person/year above which farmers can generate a surplus that can be sold in the market (market participation index). In this study, about 80% of rice producers were able to produce at least 20 kg/person/year. The regression results, in Table 4, show a positive and significant sign of this variable, indicating that farmers who are able to produce at least 20 kg/person/year (household rice consumption needs) have a higher likelihood to sell their rice in the market. This result is in accordance with [21] findings.
Farmers’ market participation is directly related to distance to the nearest output market. Hence, farmers from lowlands located far away from the main market (Dano market) would have to bear high transaction costs due to the transport and exchange costs. These farmers may be discouraged to sell their output if prices in local markets are not competitive. As predicted, the lack of secured market outlets for rice justifies self-consumption of rice produced in lowlands. Indeed, the results show that lowland rice growers’ decision to participate in the output market is also affected by the existence of a market within the area. The positive value of the variable “Output market” reveals that farmers who have access to potential buyers of the output are less likely to consume their products. To illustrate, in Dano area, Dreyer Foundation (Dreyer is one of the lowlands development projects) has made commitments to purchase rice produced in the lowland that they have developed. In this respect, rice producers in Dreyer’s developed lowland are working in an environment of greater certainty as they know in advance at what price their production will be sold. The result implies that, farmers in this study may consume their production by default; this situation depicts the local market failure due to price instability, high transaction cost and/or lack of outlets for output.
The analysis of gender effect shows that farmers’ behaviours are not gender neutral. Indeed, the results indicate that male farmers have a higher chance of participating in the market than their female counterparts. To put it more simply, these results inform that female producers grow rice for self-consumption rather than for financial purposes. Interestingly, this situation revealed that women foremost incentive for rice cultivation in lowland is to satisfy the household demand for rice. Alternatively, Ref. [37] attribute Sub-Saharan African’s women low participation in the market to the unequal distribution of resources, social and cultural barriers. Conversely, analysing factors affecting smallholder rice farmers’ level of sales and market participation in Tanzania, Ref. [38] found that female-headed households were more market-oriented. As shown above, women’s only have access to developed lowlands. The absence of women in traditional lowland is due to the fact that women’s access to land is hampered by sociological and cultural factors: traditions, customs, land tenure systems that favour men. The reason put forward, during groups’ discussions, was that the lowland is the property of the community and hence cannot be given to strangers (Women are considered strangers in their husband’s communities). Some institutions in charge of lowland development (such as Dreyer and PIGO Project (PIGO Project (Irrigation Program in the Western Burkina Faso) is the new version of the PABSO (Project to develop the South-Western Lowlands), whose activities ended in 2016.)) had tried to correct this inequality by imposing a given quota of plots for women/women’s groups, before taking any action. For instance, PIGO required at least 25% quota of plots for women. This action would have an effect on the entire household wellbeing considering the fact that rice output in women plot is meant first to satisfy their households’ demands for rice. Such, improving women’s access, ownership and control over land could potentially contribute significantly to household food security. Even if it is clear that increasing property rights and tenure security alone are often not sufficient to stimulate investment. The link between increased land tenure security and increased investment in agriculture is fairly well established in the literature [39,40].
The results further highlight the importance of farmers’ groups and others social organisations in farmers’ decisions. Indeed, membership in groups and associations, usually used as a proxy of farmers’ social capital, provides numerous benefits to farmers, including information resources, reciprocal labour-hire arrangements and consequently improve farmers’ decisions making [39]. Additionally, smallholder farmers could be exposed to high transaction costs when they have the opportunity to enter formal markets (Kherallah and Kirsten, 2001, cited in Reference [19]). The positive relationship between lowland rice producers’ involvement in functional rice farmers’ groups indicates that farmers involved in such groups are more likely to favour the production of marketable surpluses over auto-consumption of rice. Similarly, the same relationships were pointed out by previous studies; in which farmers’ groups constitute platforms where members have the opportunity of sharing information [41,42], learning from their peers’ experiences [43,44] and can benefit from the collective investments made by their groups [45]. When farmers’ of a given sector join together, this allows to pool the means, to rebalance commercial relations on the market and to benefit from technical support. Moreover, this can provide a channel to informal financial sources that can relax the credit constraints. It also helps producers to practice bundled sales, thereby avoiding the wholesalers and middlemen. Conversely, the negative effect of respondent membership in farmers’ groups/social organization revealed that farmers’ social capital may have a dark side and discourage their market participation. In summation, membership in farmers’ social organization may play a positive effect on their decision to sell their output in the market if such social organization is functional and solely oriented toward rice production.
In order to probe the effectiveness of the development of the lowland by the projects with time, developed lowlands were separated into two types: young lowlands (less than 10 years of operation) and old lowlands (more than 10 years of operation). Half of the 10 developed lowlands selected have more than 10 years of operation, thus can be considered as old lowlands. The results indicate that farmers are less likely to produce rice when the developed lowlands become old (Table A1). Therefore, there is no effect of the accumulation of experience over years. The most compelling evidence is that more the lowland gets older, the less likely it is operated efficiently. This finding was confirmed by the statistics from the decentralized department of Agriculture (DPAHRH–Ioba). Among developed lowlands study area, about 74.7% of the surface area of old lowlands were exploited, while in young lowlands approximately 96.5% of the surface area was used; denoting a relative abandonment of old lowlands. According to extensions agents, this situation is much more due to the failure of lowland management and maintenance comities (usually established after lowland development) and the mismanagement of the lowland working capital resulting in a lack of interest of lowlands users. In fact, after the development of a lowland, the project and program withdraw gradually in order to allow the local population to take ownership of the lowlands management and assume the costs of management and maintenance. In this case, when a misuse or misappropriation (embezzlement) occurs, a serious lack of mutual trust between lowlands users and the leaders (e.g., Pontiéba, Sarba and Gorgane lowlands) takes place; as results, activities regarding to the lowland maintenance are usually wrecked by some of the producers.

5. Conclusions

This study explored factors that impact lowland rice farmers’ decisions to commercialise their outputs in the market. The main hypothesis in this study is that lowlands rice farmers only participate in the market if they manage to generate an agricultural surplus and after meeting their rice consumption requirement and other contractual and social obligations. Furthermore, socio-economic factors, social capital variables, institutional and plot characteristics variables were hypothesized to influence farmers’ decisions making and were included in the model. The results indicate that farmers who are able to produce at least 20 kg/person/year (household rice consumption needs) have a higher likelihood to commercialise their rice in the market. It came out from this study that farmers’ groups and others social organizations plays an importance role in farmers’ decisions. The analysis shows that farmers from lowlands with functional rice producers’ organisations were more likely to sell their products in the market; suggesting that farmers’ ability to work collectively constitute a motivating factor for their market participation. More often, when farmers participate in the market in a disorganised manner they are more often price takers. The study further demonstrates that the average yield in developed lowlands is significantly higher than in traditional lowlands. Farmers who have access to a secured outlets are more engaged in markets than their peers. Thus, the development of lowlands should be convoyed by the implementation of accompanying measures, such as rice purchasing structures, storage and processing facilities. In addition, the results inform that female producers are more likely to grow rice for self-consumption rather than for financial purposes. Such, improving women’s access, ownership and control over land could potentially play a key role in the entire household food security. Therefore, mechanisms of land tenure security that protect women access to lowlands could be one of the boosting factors of rice production in the lowlands, while improving food security at the household level. Moreover, as suggested in Arias 2014, there is a need for the development of basic staple food chains, where lowlands small-scale farmers can play their role as an element of the value chain. This would contribute more to poverty reduction, agricultural development, local successful practices and enhance food security for poor rural households.
Our findings should be interpreted within the context of some limitations. One limitation concerns the data collection methods used in this study. The study relied mainly on cross-sectional and self-reported data, the use of such data may have led to an overestimation of the relationships considered. The reliability of the data may also be affected due to misinterpretation of questions by respondents or untrusted answers, because of lack of memory on the subject. Some respondents may have difficulty in understanding the questionnaire’s format and the interviewer may lead to social desirability bias, whereby respondents provide responses that they think will please the interviewer or be consistent with social norms [46,47]. Thus, more research integrating physical evaluation of the output, market prices and access to different distribution channels, may provide additional insights into the drivers of rice production and consumption in lowlands. The data collection was confined to only the Sud-Ouest region of Burkina Faso; the replication of the study with much larger sample size at different regions of would enable better generalizability of the findings of the study.

Author Contributions

T.B.Y., A.Y.B., J.-L.F., B.M.T., G.S., D.E.C.D., Y.Y. and conceived and designed the study; T.B.Y., B.M.T., F.S. and M.M.D.-B. performed the data collection; T.B.Y. and J.-L.F. analysed the data; T.B.Y., A.Y.B., J.-L.F., D.E.C.D., B.M.T., Y.Y., G.S. and M.M.D.-B. contributed reagents/materials/analysis tools; T.B.Y. wrote the paper.

Funding

This research received no external funding.

Acknowledgments

The authors are grateful for the financial support provided by the French Agency for Development (AFD) under the auspices of the AGRICORA and GENERIA initiatives. They thank the German Federal Ministry of Education and Research (BMBF) for supporting the WASCAL project.

Conflicts of Interest

The authors declare no conflict of interest.

Appendix A

Table A1. List of selected lowlands.
Rural Communes LowlandsTypes of LowlandsYear of DevelopmentLowlands Development Projects
DanoGbagbaDL2016Dreyer Foundation
LofingDTL2013Dreyer Foundation
PontiébaDL1999Project to develop the South-Western Lowlands (PABSO)
SarbaDL2007Action Plan for the Rice Sector (PAFR)
Bavoulé & PkèlganeDL2014/20161-Dreyer Foundation
20132-Productivity and Food Security Improvement Project (PAPSA)
DissinDadonéDTL2009Project to develop the South-Western Lowlands (PABSO)
OronkuaWahabléDTL1997CISV NGO
GnigtebaDTL2016Project to develop the South-Western Lowlands (PABSO)
BankandiDTL2006Action Plan for the Rice Sector (PAFR)
KoperGorganeDTL2007Rainfed Rice Project (PRP)
DL = Only Developed Lowland; DTL = Developed and Traditional Lowland.

References

  1. World Bank. Burkina Faso—Growth and Competitiveness Credit (1–4); Project Performance Assessment Report 127424; World Bank: Washington, DC, USA, 2018. [Google Scholar]
  2. Pale, S.; Da, D.E.C. Traditional Lowlands Water Management in Dano, South-Western Burkina Faso. J. Water Resour. Prot. 2016, 8, 425. [Google Scholar] [CrossRef]
  3. Savonnet, G. Pina: Étude D’un Terroir de Front Pionnier en Pays Dagari (Haute Volta). 1970. Available online: http://www.documentation.ird.fr/hor/fdi:05878 (accessed on 11 March 2018). (In French).
  4. Pradeau, C. Adaptabilité d’une agriculture tropicale traditionnelle: Le pays Dagari (Haute-Volta). Études Rurales 1975, 58, 7–28. (In French) [Google Scholar] [CrossRef]
  5. Legoupil, J.-C.; Lidon, B. La Mise en Valeur des Bas-Fonds en Afrique Sub-Saharienne: Un Enjeu Important lié à la Connaissance et à la Maîtrise de Leurs Régimes Hydriques. 1995. Available online: http://agritrop.cirad.fr/467960/ (accessed on 2 March 2018). (In French).
  6. Fiéloux, M.; Lombard, J.; Kambou-Ferrand, J.-M. Images d’Afrique et Sciences Sociales: Les Pays Lobi, Birifor et Dagara (Burkina Faso, Côte-d’Ivoire et Ghana): Actes du Colloque de Ouagadougou, 10–15 Décembre 1990, Karthala Edition ed; ORSTOM: Paris, France, 1993; ISBN 2-7099-1120-5. (In French) [Google Scholar]
  7. Dorée, A. Gérer les Nouveaux Risques des Bas-Fonds Soudaniens (Dano, Burkina Faso). Mémoire de fin D’étude; Institut National d’Etudes Supérieures Agronomiques de Montpellier (Montpellier SupAgro): Montpellier, France, 2017. (In French) [Google Scholar]
  8. Thiombiano, T. La controverse empirique et théorique posée par le comportement des producteurs-consommateurs. Rev. Tiers Monde 1997, 38, 821–836. (In French) [Google Scholar] [CrossRef] [Green Version]
  9. Tollens, E. Wholesale markets in African cities: Diagnosis, role, advantages, and elements for further study and development. FAO Agric. Serv. Bull. 2000, 143, 1–13. [Google Scholar]
  10. Barrett, C.B. Smallholder market participation: Concepts and evidence from eastern and southern Africa. Food Policy 2008, 33, 299–317. [Google Scholar] [CrossRef]
  11. Chattopadhyay, M. Ipsita Sen Marketable Surplus and Size-Classes of Holdings. Econ. Polit. Wkly. 1988, 23, A151–A156. [Google Scholar]
  12. Sharma, V.P.; Wardhan, H. Marketed and Marketable Surplus of Major Food Grains in India; Springer: Berlin/Heidelberg, Germany, 2017; ISBN 81-322-3708-0. [Google Scholar]
  13. Upender, M. Marketable and Marketed Surplus in Agriculture: A Study at Farm Land; Mittal Publications: Delhi, India, 1990; ISBN 978-81-7099-232-5. [Google Scholar]
  14. Abafita, J.; Atkinson, J.; Kim, C.S. Smallholder Commercialization in Ethiopia: Market Orientation and Participation. Int. Food Res. J. 2016, 23, 1797. [Google Scholar]
  15. Ohen, S.B.; Etuk, E.A.; Onoja, J.A. Analysis of market participation by rice farmers in southern Nigeria. J. Econ. Sustain. Dev. 2013, 4, 6–11. [Google Scholar]
  16. Poole, N. Smallholder Agriculture and Market Participation; Practical Action Publishing: Rugby, UK, 2017; ISBN 1-85339-940-X. [Google Scholar]
  17. Makhura, M.T. Overcoming Transaction Costs Barriers to Market Participation of Smallholder Farmers in the Northern Province of South Africa, Department of Agricultural Economics, Extension and Rural Development-Faculty of Natural and Agricultural Sciences; University of Pretoria: Pretoria, South Africa, 2001. [Google Scholar]
  18. Arias, P.; Hallam, D.; Krivonos, E.; Morrison, J. Smallholder Integration in Changing Food Markets; Food and Agriculture Organization of the United Nations: Rome, Italy, 2013. [Google Scholar]
  19. Gani, O.; Hossain, E. Market participation decision of smallholder farmers and its determinants in Bangladesh. Ekonomika Poljoprivrede 2015, 62, 163–179. [Google Scholar] [CrossRef] [Green Version]
  20. Von Braun, J.; De Haen, H.; Blanken, J. Commercialization of Agriculture under Population Pressure: Effects on Production, Consumption, and Nutrition in Rwanda; International Food Policy Research Institution: Washington, DC, USA, 1991; ISBN 0-89629-087-5. [Google Scholar]
  21. Achandi, E.L.; Mujawamariya, G. Market participation by smallholder rice farmers in Tanzania: A double hurdle analysis. Stud. Agric. Econ. 2016, 118, 112–115. [Google Scholar] [CrossRef]
  22. Yaméogo, T.B.; Fonta, W.M.; Wünscher, T. Can Social Capital influence Smallholder Farmers’ Climate-Change Adaptation Decisions? Evidence from Three Semi-Arid Communities in Burkina Faso, West Africa. Soc. Sci. 2018, 7, 33. [Google Scholar] [CrossRef]
  23. Adger, W.N. Social capital, collective action, and adaptation to climate change. In Der Klimawandel; Springer: Berlin/Heidelberg, Germany, 2010; pp. 327–345. ISBN 3-531-15925-9. [Google Scholar]
  24. Gyau, A.; Franzel, S.; Chiatoh, M.; Nimino, G.; Owusu, K. Collective action to improve market access for smallholder producers of agroforestry products: Key lessons learned with insights from Cameroon’s experience. Curr. Opin. Environ. Sustain. 2014, 6, 68–72. [Google Scholar] [CrossRef]
  25. Bazié, Y.G.; Guissou, S.R.; Ilboudo, W.F.; Mas Aparisi, A. Analyse des incitations par les prix pour riz au Burkina Faso. Série Notes Tech. 2014, 62. (In French) [Google Scholar]
  26. Guissou, R.; Ilboudo, F. Analyse des incitations et pénalisations pour le riz au Burkina Faso. Sér. Notes Tech. 2012, 44, 1–44. (In French) [Google Scholar]
  27. Bila, N.K. Revue Documentaire des Etudes sur L’état des Lieux de la Filière riz au Burkina Faso; Comité Inter Professionnel du Riz (CIR-B): Ouagadougou, Burkina Faso, 2016; p. 80. (In French) [Google Scholar]
  28. Drabo, I.; Ilboudo, F.; Tallet, B. Dynamique des Populations, Disponibilités en Terres et Adaptation des Régimes Fonciers: Le Burkina Fao, une etude de cas; Marchal, J.-Y., Ed.; Comité International de Coopération Dans les Recherches Nationales en Démographie: Ouagadougou, Burkina Faso, 2003. (In French) [Google Scholar]
  29. SP/CONEDD. Troisième Rapport sur L’état de l’Environnement au Burkina (REEB3); Sécrétariat Permanent du Conseil National de l’Environnement et du Développement Durable (SP/CONEDD): Ouagadougou, Burkina Faso, 2010; p. 263. (In French) [Google Scholar]
  30. Meyer, J.R.; Kuh, E. The Investment Decision: An Empirical Study; Harvard University Press: Cambridge, MA, USA, 1957. [Google Scholar]
  31. Norris, P.E.; Batie, S.S. Virginia farmers’ soil conservation decisions: An application of Tobit analysis. South. J. Agric. Econ. 1987, 19, 79–90. [Google Scholar] [CrossRef]
  32. Greene, W.H. Econometric Analysis, 7th ed.; Prentice Hall: Upper Saddle River, NJ, USA, 2011; ISBN 81-7758-684-X. [Google Scholar]
  33. Food and Agriculture Organization. Analyse de la Compétivité de la Filière Riz Local au Burkina Faso; Food and Agriculture Organization: Rome, Italy, 2009. (In French) [Google Scholar]
  34. Addison, M.; Edusah, S.E.; Sarfo-Mensah, P. Gender Constraints and Rice Varietal Characteristics Preferences in Lowland Rice Ecosystem in Ghana. Dev. Country Stud. 2014, 4, 15. [Google Scholar]
  35. Rahman, S.A. Women’s involvement in agriculture in northern and southern Kaduna State Nigeria. J. Gend. Stud. 2008, 17, 17–26. [Google Scholar] [CrossRef]
  36. Okam, C.; Yusuf, O.; Abdulrahman, S.; Suleiman, A. Comparative analysis of profitability of rice production among men and women farmers in Ebonyi State Nigeria. Asian J. Agric. Ext. Econ. Sociol. 2016, 10, 1–7. [Google Scholar] [CrossRef]
  37. Sigei, G.; Bett, H.; Kibet, L. Determinants of Market Participation among Small-Scale Pineapple Farmers in Kericho County, Kenya. 2014. Available online: https://mpra.ub.uni-muenchen.de/56149/ (accessed on 20 September 2018).
  38. Boniphace, N.S.; Fengying, N.; Chen, F. An analysis of factors affecting smallholder rice farmers’ level of sales and market participation in Tanzania: Evidence from national panel survey data 2010–2011’. J. Econ. Sustain. Dev. 2014, 5, 185–204. [Google Scholar]
  39. Deininger, K.; Feder, G. Land registration, governance, and development: Evidence and implications for policy. World Bank Res. Obs. 2009, 24, 233–266. [Google Scholar] [CrossRef]
  40. Maddison, D. The Perception of and Adaptation to Climate Change in Africa; The World Bank: Washington, DC, USA, 2007. [Google Scholar]
  41. Katungi, E.; Akankwasa, K. Community-Based Organizations and Their Effect on the Adoption of Agricultural Technologies in Uganda: A Study of Banana (Musa spp.) Pest Management Technology. Acta Hortic. 2010, 719–726. [Google Scholar] [CrossRef]
  42. Saysay, L.J. Profit Efficiency among Smallholder Rice Farmers in Bein Garr and Panta Districts, Central Liberia; Sokoine University of Agriculture: Morogoro, Tanzania, 2016. [Google Scholar]
  43. Otieno, Z.; Okello, J.; Nyikal, R.; Mwang’ombe, A.; Clavel, D. The role of varietal traits in the adoption of improved dryland crop varieties: The case of pigeon pea in Kenya. Afr. J. Agric. Res. 2011, 6, 176–193. [Google Scholar]
  44. Wambugu, S.; Okello, J.; Nyikal, R. Effect of Social Capital on Performance of Smallholder Farmer Organizations in Western Kenya. J. Agric. Sci. Technol. 2010, 4, 6. [Google Scholar]
  45. Abdul-Hanan, A.; Ayamga, M.; Donkoh, S.A. Smallholder adoption of soil and water conservation techniques in Ghana. Afr. J. Agric. Res. 2014, 9, 539–546. [Google Scholar]
  46. Cheek, L. The Effect of Social Desirability Bias on Willingness-To-Pay for Organic Beef. 2007. Available online: https://ageconsearch.umn.edu/bitstream/113240/2/Paper4.pdf (accessed on 8 March 2018).
  47. Leggett, C.G.; Kleckner, N.S.; Boyle, K.J.; Dufield, J.W.; Mitchell, R.C. Social desirability bias in contingent valuation surveys administered through in-person interviews. Land Econ. 2003, 79, 561–575. [Google Scholar] [CrossRef]
Figure 1. Evolution of rice production in Burkina from 1961–2016. National data-1961–2016 from FAOSTAT (accessed 17 February 2018). Study area data (1996–2016) from General Directorate for Agricultural Forecasts and Statistics (DGPSA)/Ministry of Agriculture, Hydraulics and Fishery Resources.
Sustainability 10 04354 g001
Figure 2. Overview of the study area.
Sustainability 10 04354 g002
Figure 3. Lowlands rice use.
Sustainability 10 04354 g003
Table 1. Description of the independent variables.
VariableDescription of VariablesMeanMinMax
Gender1 if male respondent; 0 if female0.6701
AgeAge of the respondent (Continuous)43.561875
Level of Education1 if illiterate, 2 if formal education, 3 if informal education (vocational school or others)1.7613
Working peopleNumber of working people in the household (Continuous)5.86128
People in chargeNumber of people in charge (Continuous)8.73030
Output market1 if there is a potential buyer (secured market outlets); 0 if otherwise0.2501
Cotton farmers1 if cotton farmers; 0 if otherwise0.6301
Age of Infrastructure1 if the water control facility has been done less than 10 years; 0 if otherwise0.5901
Membership1 if member in farmers’ organizations; 0 if otherwise0.8501
Functionality1 if the lowland with functional rice farmers’ organization0.4901
Type of Lowland1 if developed lowland; 0 if otherwise0.7801
Marketable SurplusMarket participation index; 1 if farmer is able to produce 20 kg of rice per person per year; 0 if otherwise0.8001
Table 2. Rice production by type of lowlands.
Developed LowlandsTraditional LowlandsF-Testt-TestWelch’s t-Test
Average rice area (ha)0.260.55***NA**
Average production (kg)479.85459.37***NANSD
Average yield (kg/ha)2118.241300.52***NA***
Notes: ***, ** = significant at 1% and 5%, respectively; NSD = No Significant Difference; NA = Not Applicable.
Table 3. Rice production by Gender.
FemaleMaleF-testt-TestWelch’s t-Test
Average rice area (ha)0.250.27NSDNSDNA
Average production (kg)414.33530.81NSD*NA
Average yield (kg/ha)1599.552497.29***NA**
Notes: ***, **, * = significant at 1%, 5% and 10%, respectively; NSD = No Significant Difference; NA = Not Applicable.
Table 4. Results of the Probit Model.
Step 1Step 2Step 3
Coef.Marg. EffectCoef.Marg. EffectCoef. Std. Err.Marg. Effect
Marketable Surplus0.987 ***
(0.296)
0.377 ***0.832 ***
(0.304)
0.323 ***0.924 **
(0.381)
0.356 ***
Age of Infrastructure--−0.295
(0.330)
−0.1130.617 *
(0.379)
−0.226 *
Developed lowland--0.248
(0.359)
0.0970.691
(0.500)
0.268
Output market--0.993 ***
(0.339)
0.341 ***1.005 **
(0.456)
0.330 ***
Gender----0.737 **
(0.382)
0.282 **
Age----−0.007
(0.010)
−0.003
Formal Education----−0.226
(0.331)
−0.087
Informal Education----0.458
(0.395)
0.164
Working people----0.062
(0.064)
0.023
People in charge----−0.021
(0.041)
−0.008
Cotton farmers----0.259
(0.308)
0.099
Membership----0.814 *
(0.472)
−0.266 **
Functionality----0.848 **
(0.375)
0.312 **
Constant0.583 **
(0.267)
-0.693 **
(0.354)
-−1.124
(0.714)
-
Number of obs127 127 121
LR chi2(n)11.730 *** 22.170 *** 42.380 ***
Pseudo R20.068 0.128 0.260
Log likelihood−80.419 −75.202 −60.480
Notes: ***, **, * = significant at 1%, 5% and 10% probability level, respectively; standard errors are in parenthesis.

