Abstract
Through an empirical study of ocean-borne trade between Hong Kong and New York, we combined qualitative and quantitative analysis to examine route selection decisions in a post-expansion era of the Panama Canal. A two-stage methodological framework was developed to assess the competitiveness of the three route alternatives, namely the Panama and Suez canals and the US intermodal system. In the first stage, a combination of literature review and expert knowledge was employed to identify the determinants of route selection. In the second stage, fuzzy theory and the multi-criteria decision-making technique were used to evaluate the criteria and the route alternatives. The results indicate that transportation cost is the most important factor in choosing a route, followed by transportation time, reliability, and route characteristics. The “all water route” via the Panama Canal is preferred over the Suez and U.S. intermodal options.
1. Introduction
In recognition of the paramount importance of the Asia–Pacific–United States (U.S.) East Coast market, the Panama Canal expansion project has contributed to transit time reduction and accommodation of larger vessels [1,2]. Inarguably, the expansion of the Panama Canal has been of vital importance to global supply chains, and it has been accompanied by changes in maritime and multimodal transport and logistics patterns not only in the Pacific, but throughout the east–west trade [3,4,5,6]. Therefore, understanding the changes taking place in the shipping routes between Asia and the Americas has been indispensable in developing ocean carrier strategies. A number of studies have attempted to examine the implications for US West- and East-Coast ports [1,5,7,8]. However, studies regarding changes in global shipping networks and liner shipping operations [9] are still scarce.
Route selection is a complex multi-criteria decision-making (MCDM) problem in which qualitative and quantitative factors must be considered simultaneously. Previous studies propose mostly mathematical algorithms and models, while only a few studies utilize expert knowledge to solve routing problems [10,11,12]. In response to the need for efficient supply chain systems, rather than a direct comparison of transportation cost and time [11,13], various qualitative factors, such as reliability, safety, and security are of paramount importance, as mathematical measures have limitations in terms of illustrating numerical values accurately [14].
In this respect, our study investigated the determinant factors affecting route selection from Hong Kong to New York with insignificant differences in terms of sailing time and distance among alternatives via the Suez and Panama Canals, based on actual decision makers on route selection in liner shipping companies. To solve the MCDM problem, the fuzzy method, and the technique used to order performance according to similarity, the ideal solution (TOPSIS) methodology was applied to evaluate the transportation alternatives mentioned above. The method of fuzzy TOPSIS methodology is a common and powerful technique to identify the optimal transport route [15,16]. As a result, this study provides insights into the competitiveness of shipping route alternatives in the highest global container trade from the view of liner shipping companies to select the optimal route among the three alternatives.
To achieve this objective, following the Introduction, Section 2 reviews the related literature on route selection and implications in the expansion of the Panama Canal, and then the applied methodology is introduced in Section 3. The findings and important insights into the studied issues are highlighted in Section 4. Finally, Section 5 provides the conclusion, implications, limitations, and future research recommendations.
2. Literature Review
2.1. Route Selection
To enhance efficiency and effectiveness, one of the most prioritized and crucial decisions in supply chain management is transportation mode selection [17]. The decision-making process, to increase service quality and reduce cost and time, is increasingly complex [12]. Hence, efforts have been made, using various approaches, to increase awareness of route optimization among transport researchers.
Several previous studies solve the routing problem primarily using mathematical algorithms and models, such as mixed-integer programming and dynamic programming mainly aiming to minimize cost and time. Shintani et al. [18] proposed a genetic algorithm-based heuristic for containership routing networks that incorporates empty container repositioning among calling ports. Chang [19] proposed a mathematical model considering three crucial characteristics of international intermodal routes to choose the optimal route while minimizing the time and cost. Rich et al. [20] evaluated the mode choice and crossing for freight in the Oresund region by applying a weighted discrete choice model. Yang et al. [21] introduced an intermodal network optimization model to evaluate the 36 alternative routings for freight moving from two Chinese origins to four Indian destinations. Thereby, the most competitive routes qualifying transportation time and cost were identified by applying the principles of goal programming. Xie et al. [22] discussed the specific problem in multimodal transporting hazardous material by mixed integer programming. Ayar and Yaman [23] solved the routing problem by considering trucks and scheduled and capacitated maritime services at a minimum cost of transportation and stocking at the seaports by applying two mixed-integer programming formulations and valid inequalities. Cho et al. [24] utilized the label setting algorithm, a kind of dynamic programming algorithm, to identify the optimal route that minimizes the transport cost and time simultaneously among alternatives including single transport modes and intermodal transport from Busan to Rotterdam. Tian and Cao [25] introduced a generalized interval fuzzy mixed integer-programming model to solve the multimodal freight transportation problem under uncertain environment. Woo et al. [26] compared the real total transportation costs from Korea to the US of a Korean auto-parts company employing the inventory-theoretic model considering direct transport costs, in-transit carrying costs, and warehouse inventory costs. In an effort to diminish the environmental impacts associated with maritime transportation, the reduction of emissions has been considered in developing solutions to routing problems. Fagerholt et al. [27] developed an optimization model to determine maritime route and speed by qualifying the minimum operational cost and the regulations of emission control areas. Zis and Psaraftis [28] presented a modal split model to examine the modal shifts between maritime and land-based modes in sulfur emission control areas.
Another group of studies suggests that the routing problem is affected by multiple attributes along with transportation cost and transportation time. Shinghal and Fowkes [29] considered cost, transit time, reliability, and frequency, estimating the influential of freight mode choice in the Delhi to Bombay (India) route. Norojono and Young [30] proposed a disaggregate mode choice model proposed to examine how multiple attributes—safety and reliability—affect mode choice. Danielis et al. [10] clarified that time, reliability, and safety are of paramount importance compared to cost in assessing the service of freight transport from logistics managers’ perspective. Danielis and Marcucci [31] considered the attribute cut-offs in the mode choice between road only and intermodal, applying a logit model, to evaluate shippers’ preferences. The results show that cost, loss and damage, and flexibility are significant, followed by transit time, late arrivals, and frequency. Wang and Yeo [12] proposed Fuzzy Delphi and Fuzzy ELECTRE I methods to examine intermodal routes from Korea to Central Asia from the perspective of logistics companies decided by five principal determinants: total cost, reliability, transportation capacity, total time, and security. Belosevic et al. [15] evaluated the project alternatives by using extended VIKOR method under fuzzy environment. Moon et al. [16] applied fuzzy TOPSIS to analyze the Korea–Europe transport routes.
2.2. The Expansion of the Panama Canal
The Panama Canal is well known as one of the most crucial trading connections for maritime traffic in the world [4]. The Panama Canal was opened in 1914, contributing significantly to reducing transit time and cost for the container shipping industry [32], connecting the Atlantic and Pacific Oceans. The artificial waterway is operated by canal locks to lift ships up to 26 m above sea level. However, the capacity of the pre-expanded canal is limited by the vessel size of approximately 4400 twenty-foot equivalent units (TEUs) because of the drawbacks of the canal’s width and depth, although container vessels continue to increase in size. It is expected that the sizes of container ships will continue to grow in the future, as ultra-large Panamax containerships are scheduled for delivery over the next several years. Moreover, the Canal had a drawback of long transit times derived from the width of the locks, which were too small to allow two-way traffic time [1]. According to statistics issued by the Panama Canal Authority (PCA) (2014), it took an average of 8–10 h to pass through the canal and 26–28 h of additional average waiting time. Hence, the Panama Canal Authority conducted the largest expansion project by increasing both the depth and width of the canal to meet the growing demand of international trade to use larger vessels as a result of economies of scale (Table 1). The expansion allows large vessels up to 12,600 TEUs to transit the canal, thus increasing its capacity dramatically. In addition to increasing the capacity of the canal for a large number of ships, the transit reservation system complies with an 18-h transit time. The expansion of the Panama Canal resulted in a significant emission reduction of 17 million tons of CO2 in one year of operation as statistics of PCA (2017) by shorter traveling distance and larger cargo volume carrying. Moreover, compared to other alternative routes from Asia to U.S. East Coast such as via the Suez Canal and using U.S. intermodal system, transiting the Panama Canal produces the least CO2 emission per TEU at 2.51, 3.02, and 2.64 tons, respectively (PCA, 2015).

Table 1.
Particulars before/after the Panama Canal’s expansion.
Deriving from the significance in the volume and value of shipments from Asia to America [1], there have been a number of research initiatives concerning this market, especially with potential considerable changes in the Post Expansion Panama Era [33]. Fan et al. [8] focused on the effect of the expansion of the Panama Canal on container cargoes to U.S. markets in an optimization model accounting for congestion and demand uncertainty. They found that inter-port competition would be intense in the East Coast ports and that congestion and waiting time would be improved in the West Coast ports. Furthermore, Leachman [7] proposed a model for port and modal allocation for container shipments from Asia to the U.S. to minimize time and inventory costs. The author identified the shipment divers from Los Angeles and Long Beach to other alternatives if their port fee increases, as the total transportation time remains constant. On the other hand, Martinez et al. [1] conducted multilogit modeling basing on two datasets to determine the factors that affect coast choice between the East Coast and the West Coast caused by the Panama Canal expansion. The model simulated that the greatest increase in traffic to the East Coast is from shipments originating at East Asian ports (China, Hong Kong, Macao, Korea, Japan, Mongolia, and Taiwan). Liu et al. [34] applied cooperative game theory to examine competitive–cooperative relationships in the U.S. container import market. As the impact of Panama Canal expansion, the East-Coast players gain considerable market power in contrast to the losing West-Coast players.
These studies mainly focused on the U.S. ports’ impact in the Post Expansion Panama Canal Era, but the studies relating to changes in shipping routes selection are scant. It is evident from the literature that solving route selection using mathematical algorithms to minimize cost and time entails limitations to be examined for specific routes and factors having no data, such as service quality and reliability [12]. Therefore, it would be necessary and suitable to examine changes in the east–west route as an impact of the Panama Canal expansion. Thies study focused on routing selection using a sample of container cargo vessels originating in Hong Kong and destined for New York via the Panama Canal and via the Suez Canal, where the differences in distance and transit time are approximately 386 nautical miles (NM) and 21 h, respectively. A method that incorporates both quantitative and qualitative factors from the perspective of liner shipping companies is proposed to estimate route choice.
3. Methodology
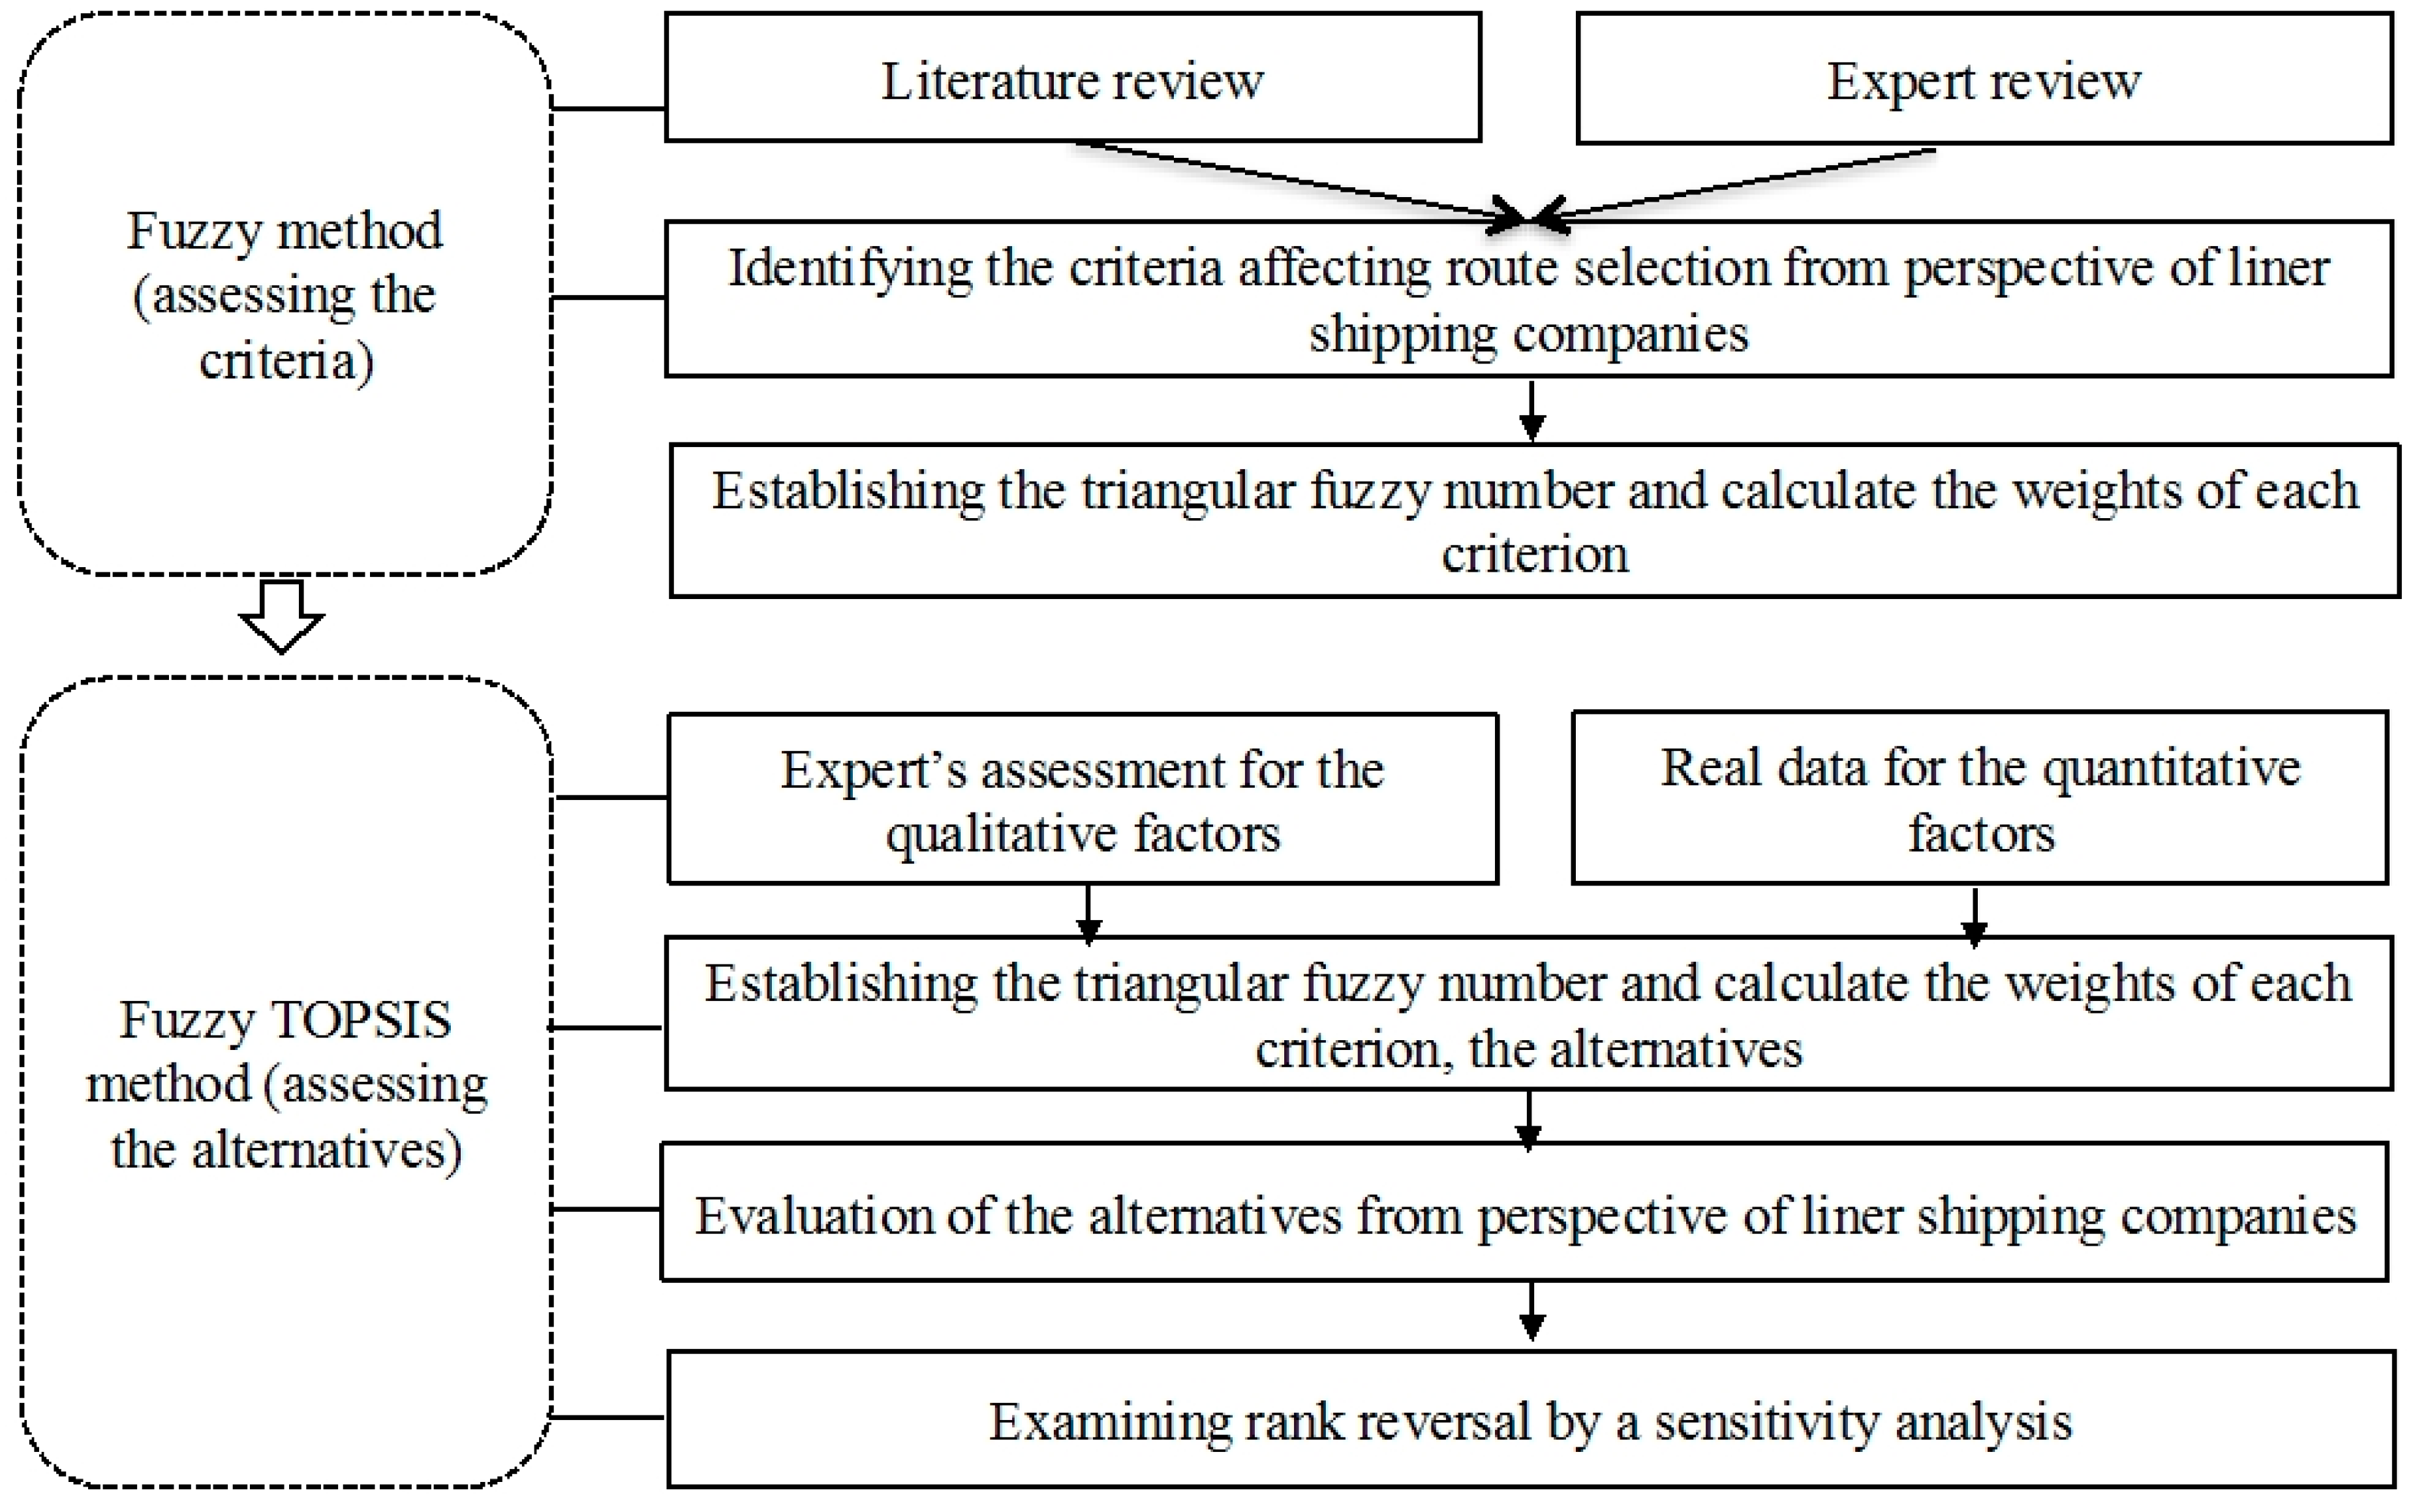
Route selection is a typical MCDM under uncertainty, as determined by both quantitative and qualitative factors (Figure 1). Despite the fact that without real data, experts’ knowledge is significant to evaluate qualitative factors, it is challenging to achieve exact numerical values for comparative ratios [14,35] due to the nature of uncertainty and imprecision of preferential models [36,37]. The fuzzy theory is a suitable method to reduce the uncertainty of evaluation to improve the accuracy of judgments using linguistic scales [38]. In addition, TOPSIS is one of most widely used tools to deal with complicated MCDM problems [39,40,41,42,43] such as choosing logistics service providers [44], choosing fuel vehicle [45], ranking causes of delay [46], and choosing facility site [47,48,49,50]. Hence, a combination of fuzzy evaluation and TOPSIS methods is a good approach to evaluate the influential factors and transport alternatives from Hong Kong to New York.
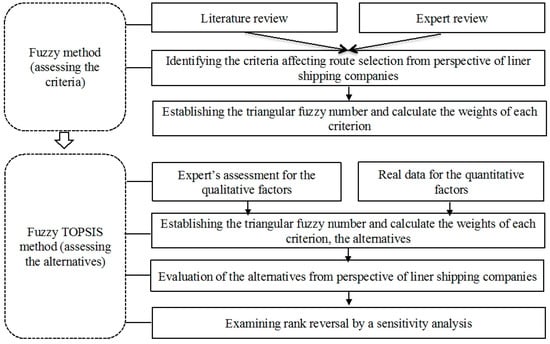
Figure 1.
Research diagram for the route selection.
3.1. Fuzzy Method
A fuzzy method introduced by Zadeh [51] was employed to judge the relative significance of the criteria. The method has been commonly utilized to overcome the multi-attribute decision-making problem basing on linguistic expression with a continuum of grades of variables. A fuzzy set is characterized by a membership function in which a grade of membership ranges from zero to one. In fuzzy theory, classical bivalent sets are commonly named crisp sets. Triangle fuzzy numbers comprised of three parameters (a1,a2,a3), and the membership function are denoted as Equation (1).
The ith triangle fuzzy number in membership function “n” is calculated by Equation (2).
Furthermore, fuzzy number is measured as:
The linguistic variables were expressed in words that fulfilled indicating as fuzzy set. The relative importance of weights of criteria assessed are divided into seven grades: “very low”, “low”, “medium low”, “medium”, “medium high”, “high”, and “very high”, as shown in Table 2.

Table 2.
Linguistic variables for the preference of each criterion.
Aiming to convert all results to actual values, de-fuzzification is the final step in which the center of gravity is a widely applied measurement [52]:
where is the G-factor and its value is measured by the center of gravity.
3.2. Fuzzy-TOPSIS Method
The TOPSIS method which is one common technique for the multiple-criteria decision-making (MCDM) problems was initially developed by Hwang and Yoon [53]. The main concept is to select the optimal solution with the furthest distance from the negative-ideal solution with the worst performance and the shortest distance from the positive-ideal solution that is the composite of the best values. In the classic TOPSIS, crisp values are used to evaluate the performance of alternatives, but it is inadequate in real situations due to the imprecision and vagueness of judgments. Thus, fuzzy TOPSIS efficiently addresses the problem in which linguistics expression is used instead of numerical values and the ratings are illustrated by means of linguistic variables [34,54]. The process of the fuzzy TOPSIS method is shown as follows:
Step 1: In terms of subjective factors, an expert questionnaire is used and defined in linguistics terms represented by a fuzzy number, , to rate alternatives. To eliminate the normalization step, the fuzzy linguistic rating , the range of normalized triangular fuzzy numbers is 0 to 10 (Table 3).

Table 3.
Linguistic variables for the preference of each alternative.
In terms of objective factors, the values are represented by crisp real numbers that need to be transformed into fuzzy ratings, as proposed by Chou [55]. Firstly, let be the crisp quantity of the objective factors, where . The criteria are featured in various units and must be transformed into dimensionless indices to ensure compatibility with the linguistic ratings. The alternative with the lowest cost (or highest benefit) should have the highest rating as follows:
where > 0, denotes the transformed fuzzy rating of objective benefit ; becomes larger when objective benefit is larger.
where > 0, denotes the transformed fuzzy rating of objective cost ; becomes smaller when objective cost is larger.
Step 2: Calculate the weighted normalized fuzzy-decision matrix by
where is the fuzzy weights measured by using expert questionnaires using the fuzzy method.
Step 3: Measure positive-ideal (FPIS, ) and negative-ideal (FNIS, ) options based on Equations (9) and (10):
where is the sets of benefit criteria and is the sets of cost criteria.
Step 4: Calculate the distances of each alternative from the ideal option and the negative-ideal option:
where a and b are two triangular fuzzy numbers presented by the triplets and .
Step 5: Identify the relative closeness of each alternative to the ideal option. The relative closeness of alternative concerning is characterized as follows:
4. Empirical Analysis
4.1. Alternative Routes from Hong Kong to New York
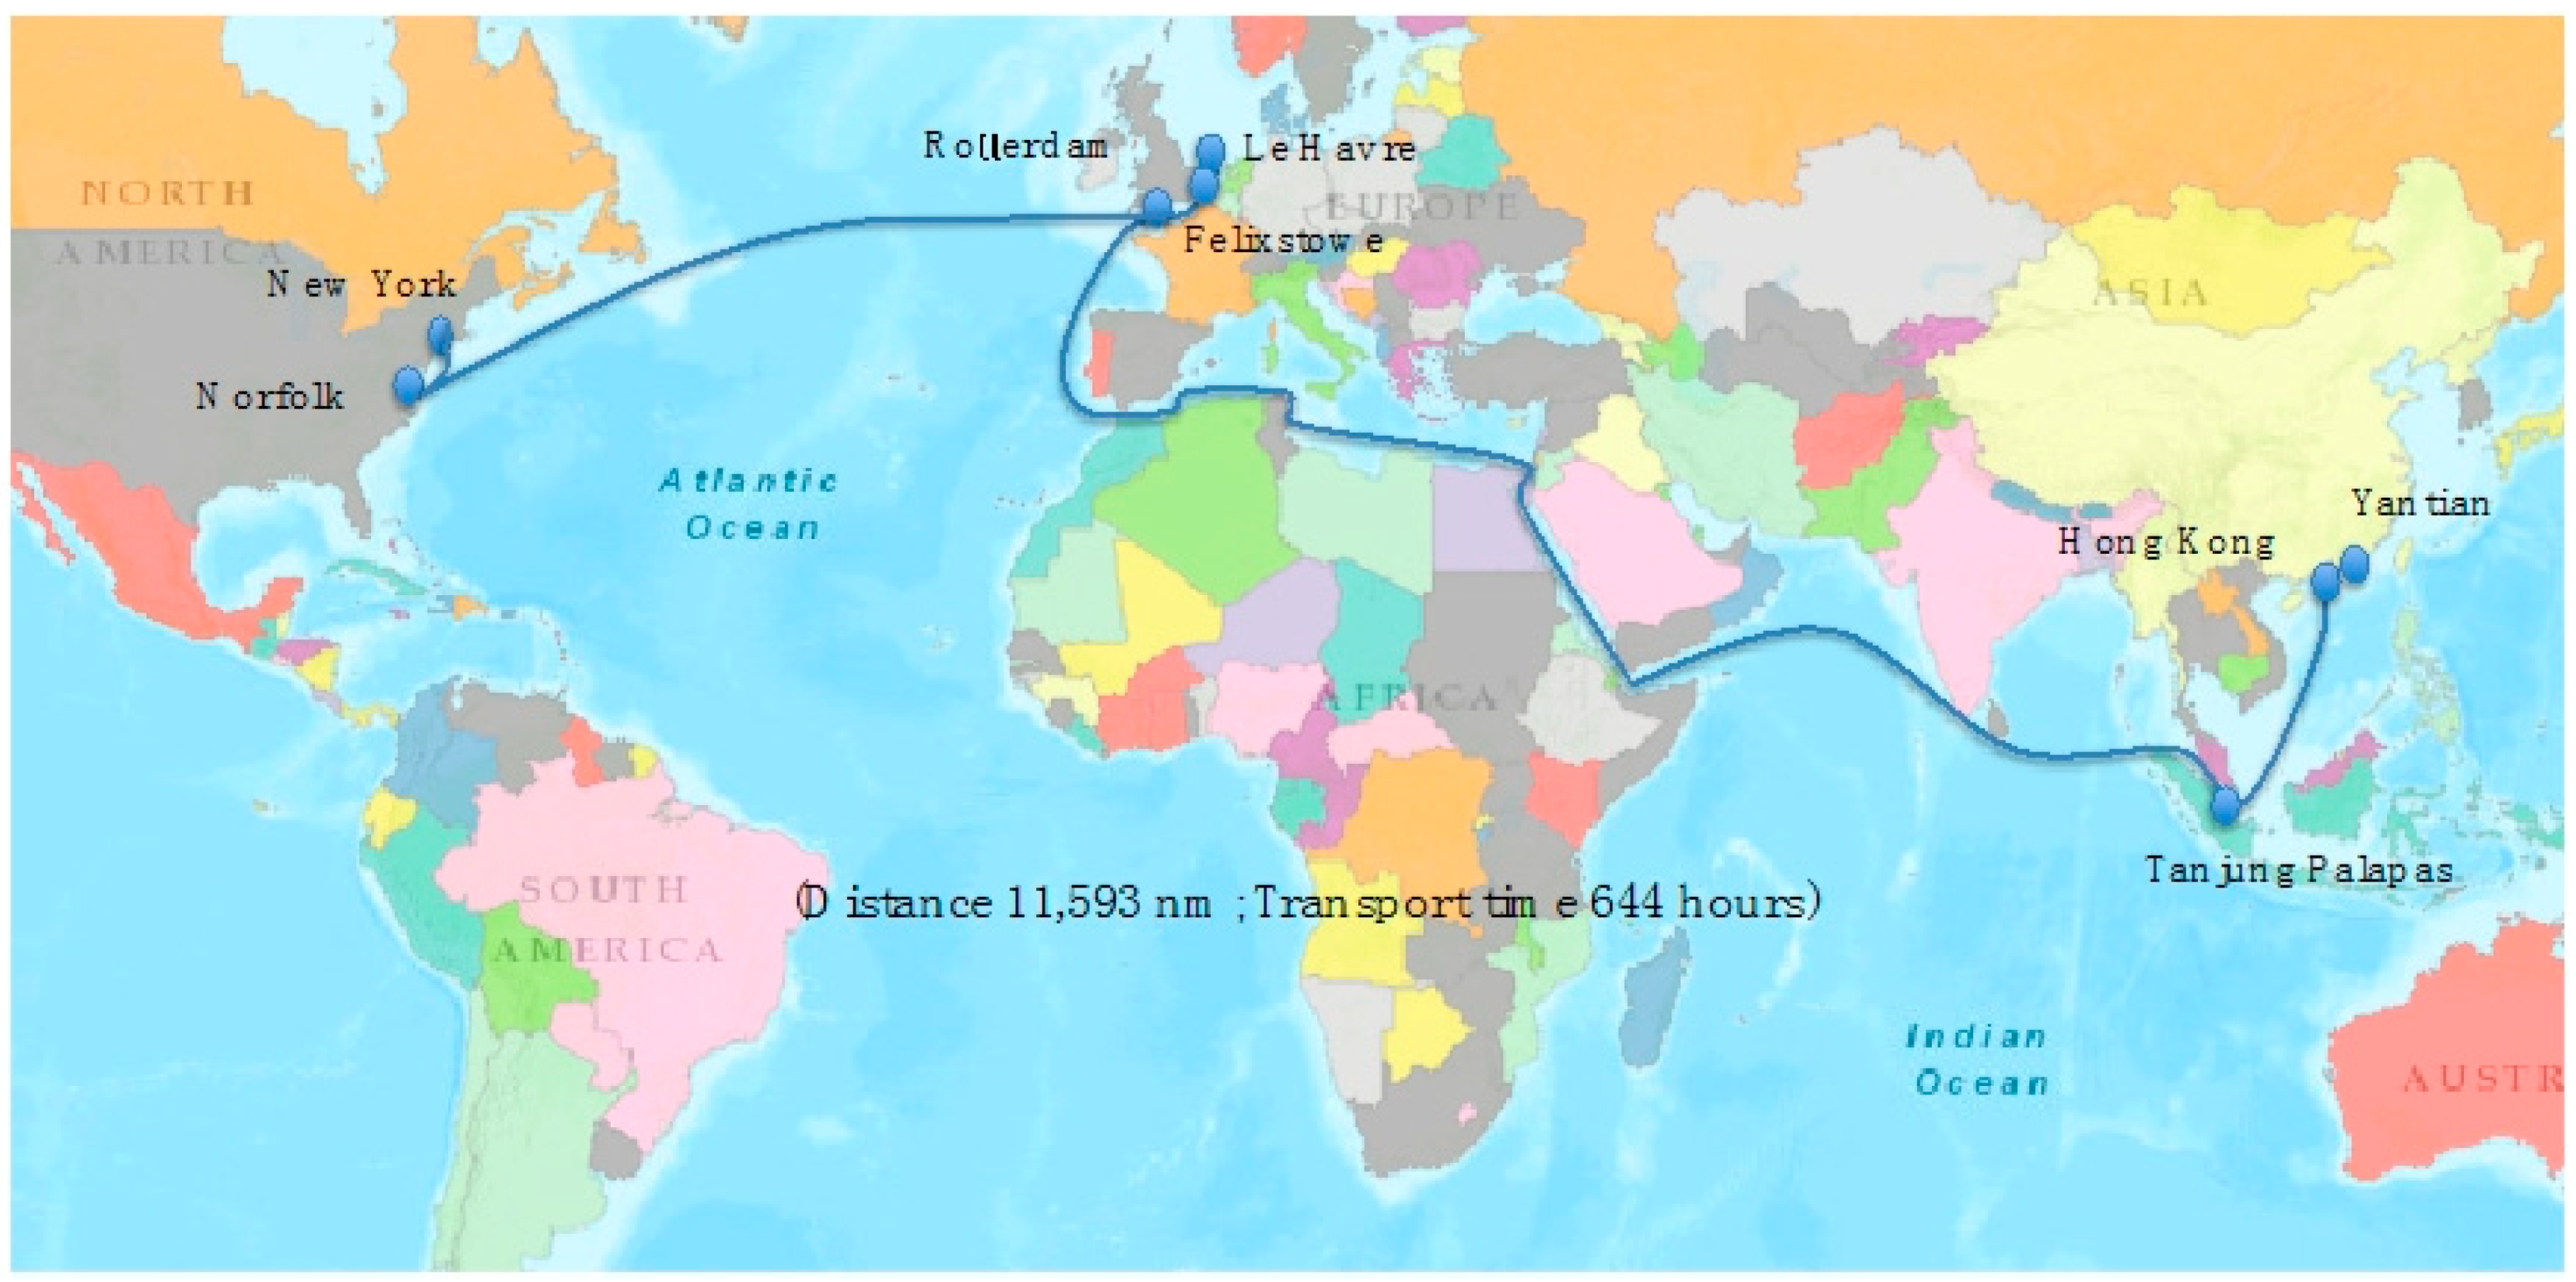
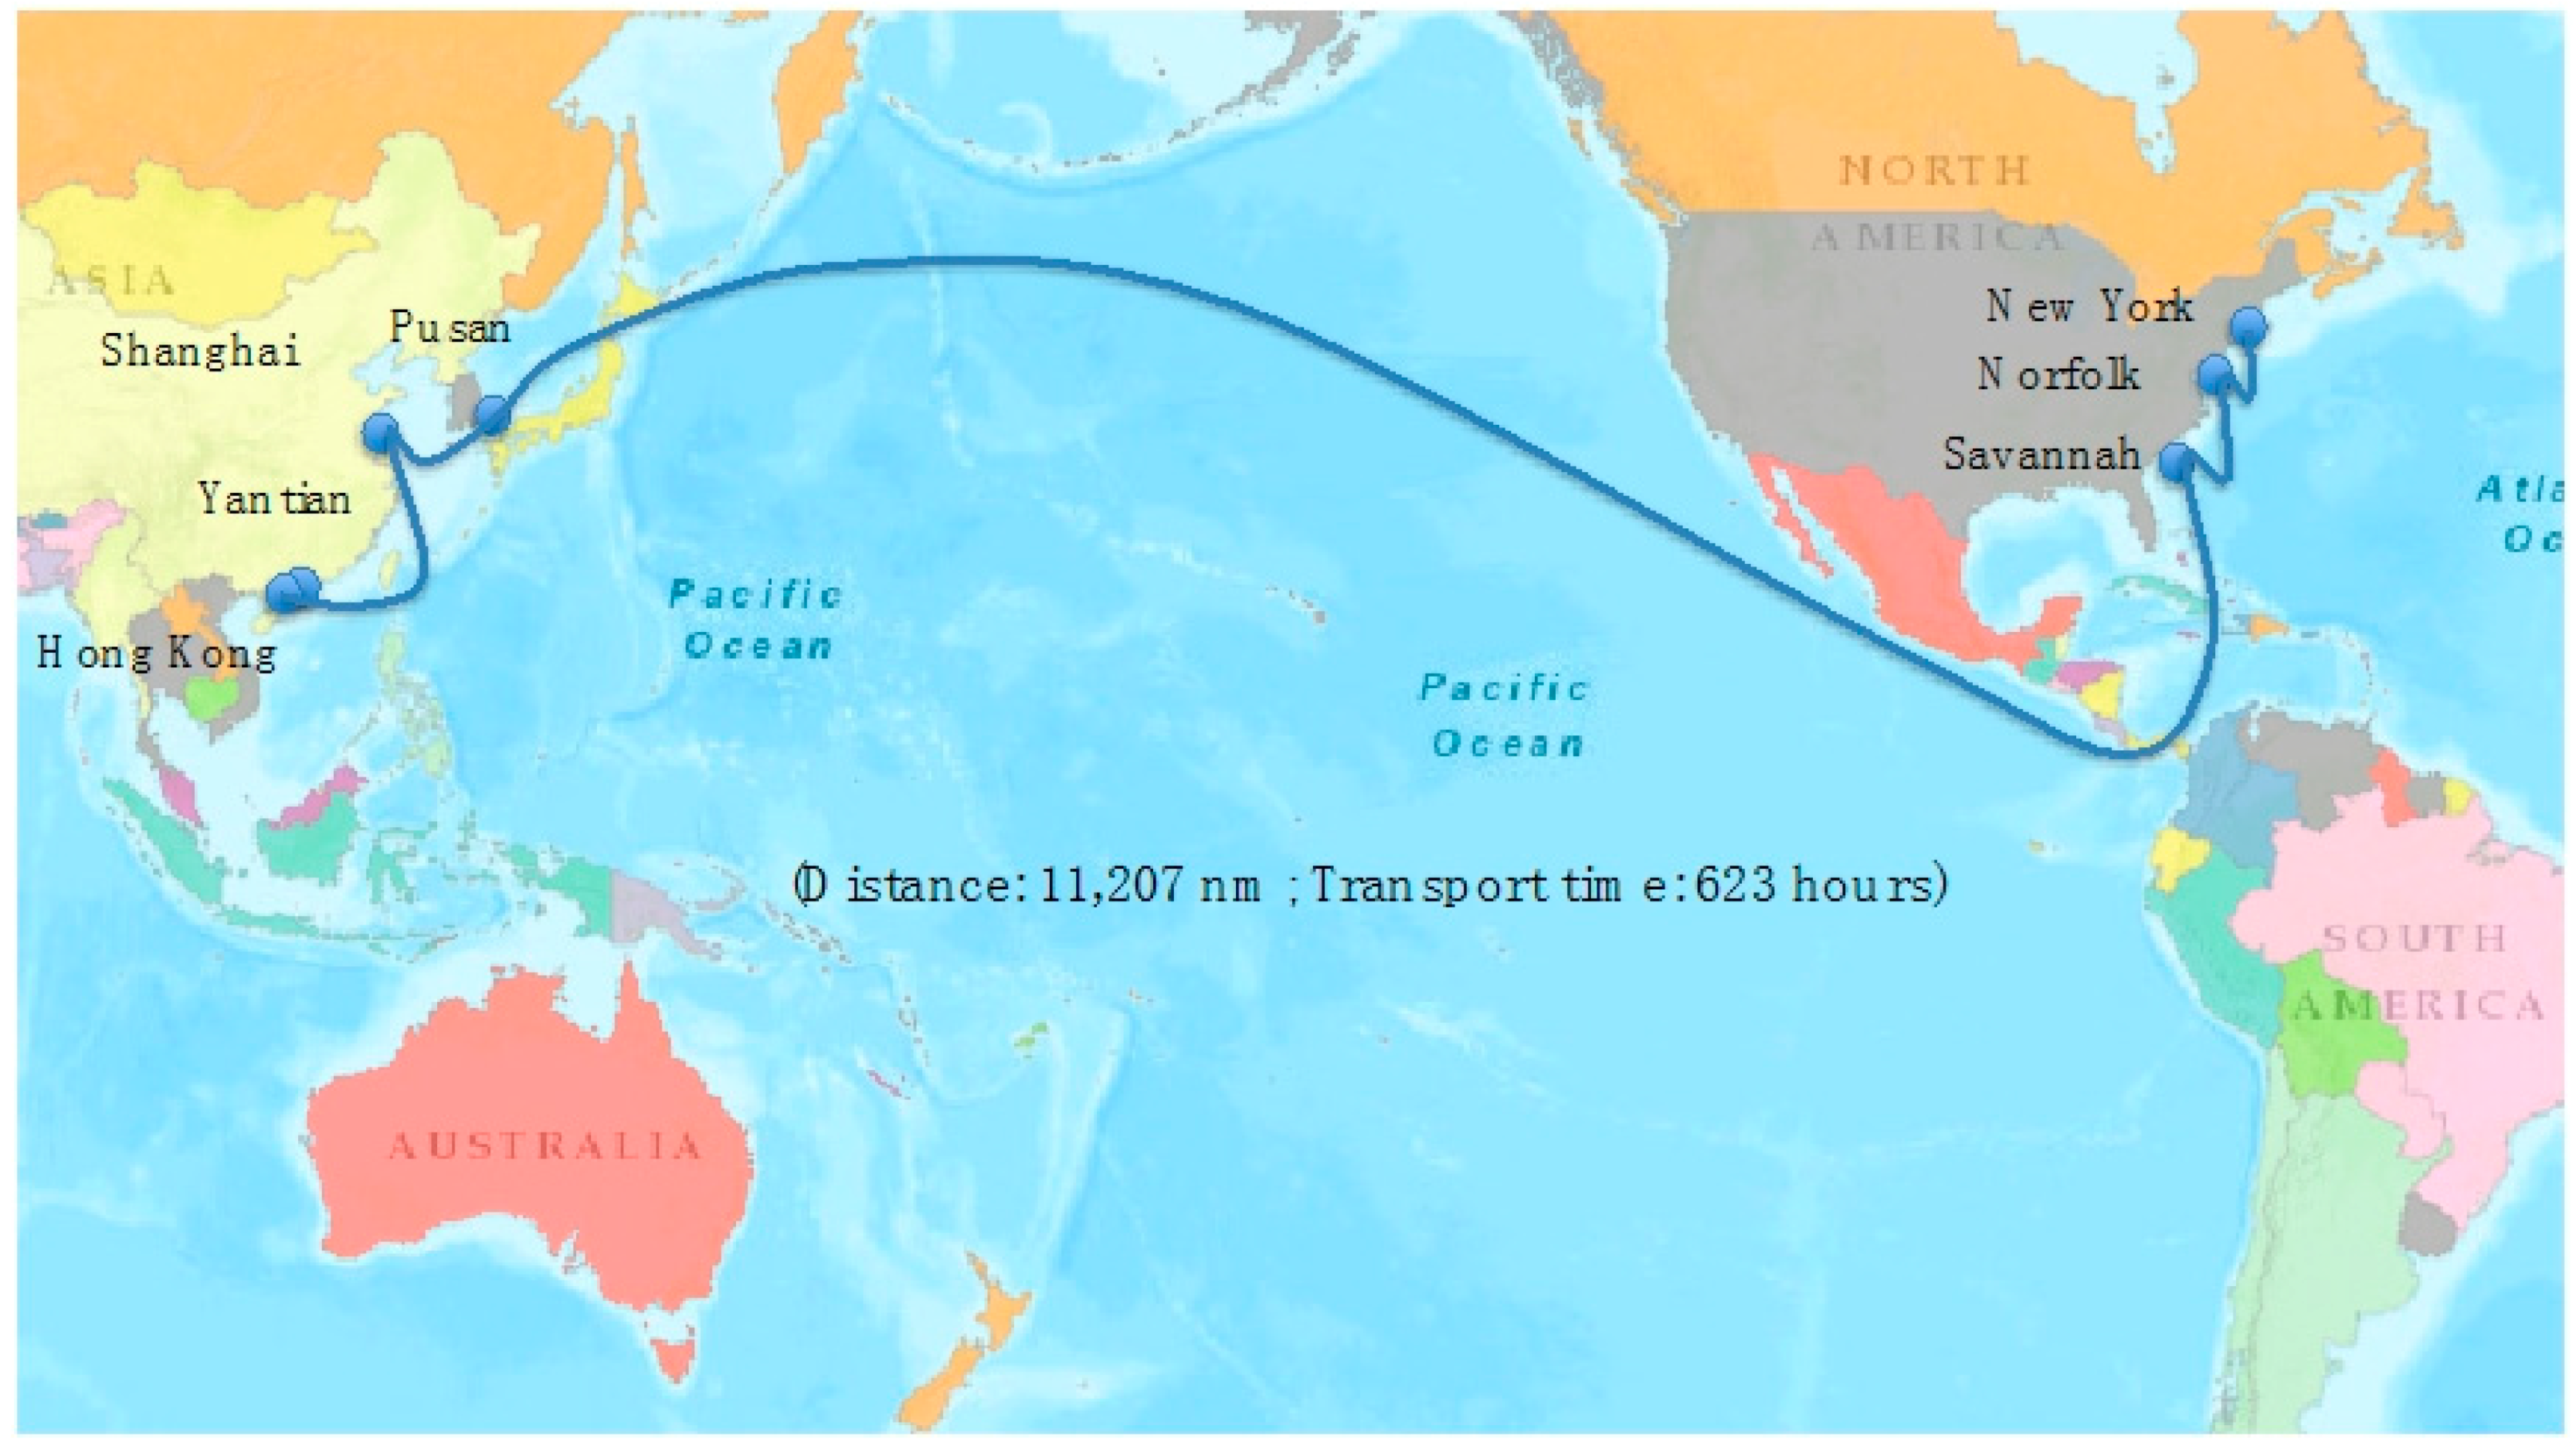
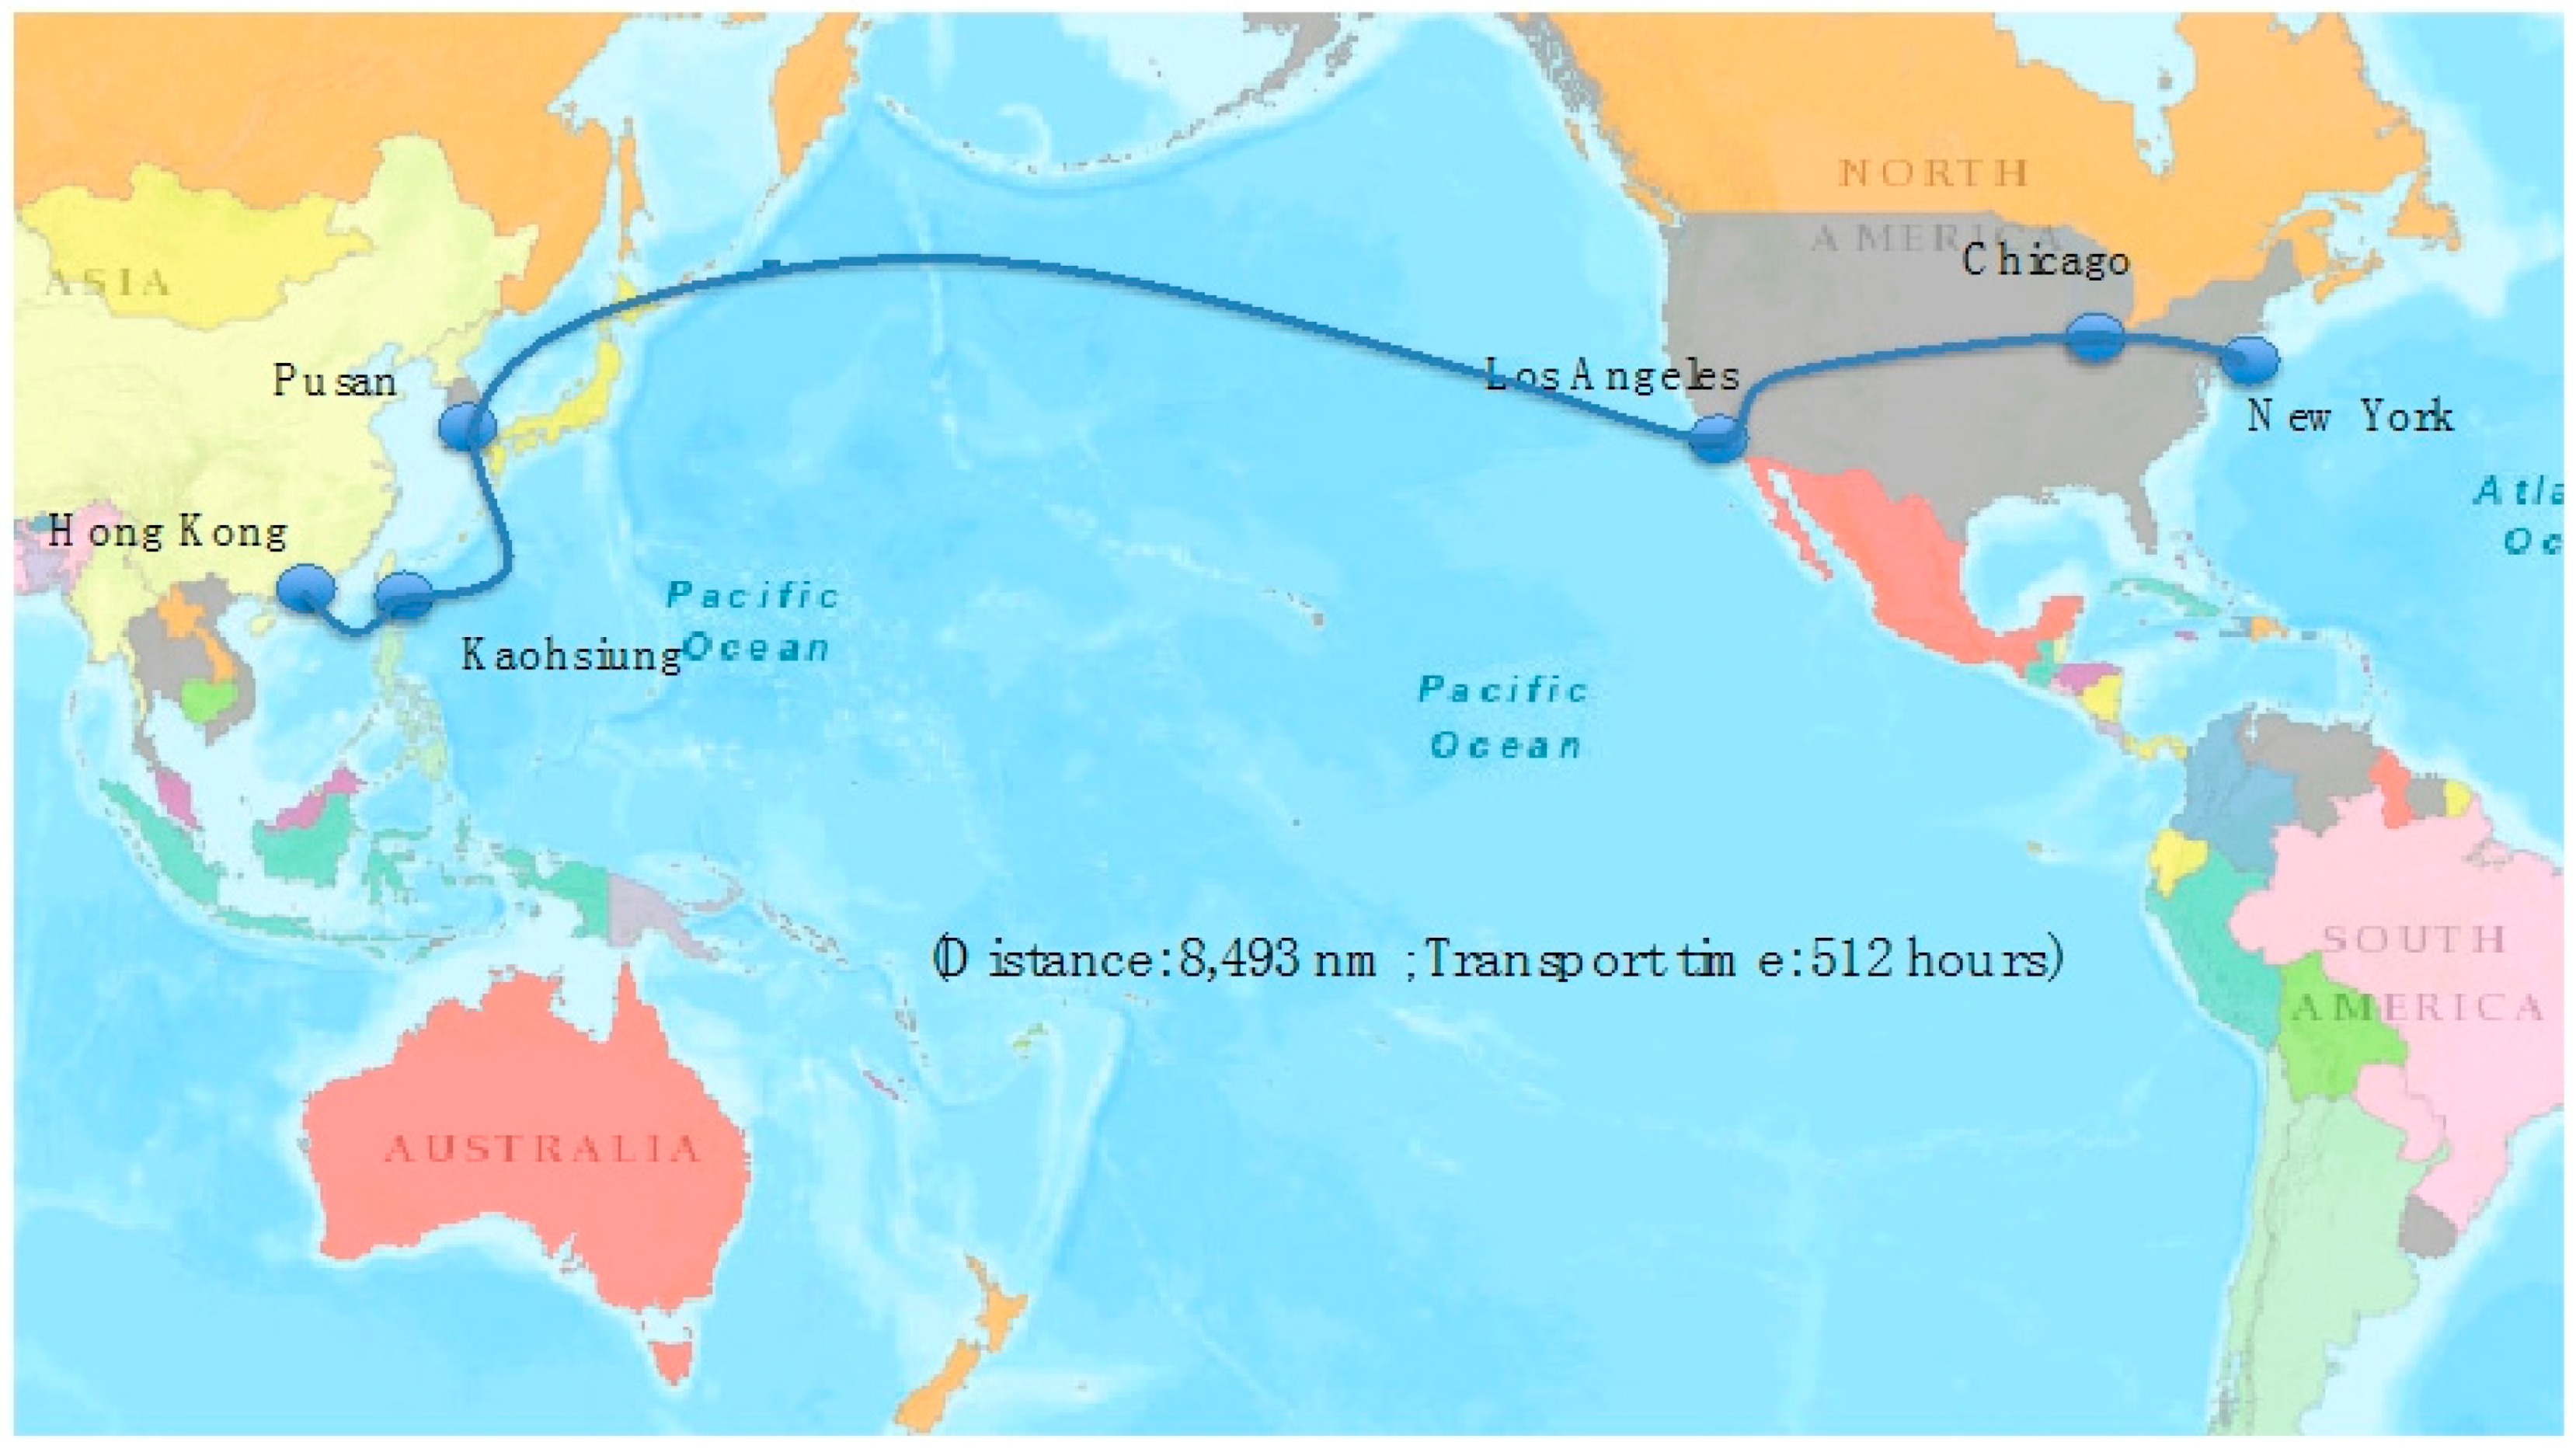
A case study on the route from Hong Kong to New York is performed to clarify the benchmarking rule in choosing an optimal route. The study examines all three main alternatives for container transport from Asia to the U.S. via the Panama Canal, including North America’s western ports via the land bridge to North America’s eastern ports (Hong Kong–Los Angeles–Chicago–New York) and through the Suez Canal (Table 4, Figure 2, Figure 3 and Figure 4). According to statistic of PCA (2015), by 2014, the shares of the three alternatives named via the Panama Canal, the Suez Canal, and using the land bridge were roughly equivalent at 37%, 32%, and 31%, respectively. The two other alternatives using the Cape of Good Hope and the Arctic Ocean were eliminated from consideration. In terms of an alternative around South Africa’s Cape of Good Hope, the route would increase shipping time as it is more suitable for oil tanker or tramper service rather than liner service due to a considerably extended shipping time compared to other alternatives. Regarding the route via the Arctic Ocean, the alternative would be a comparable selection with a significant reduction in distance, but the existing limitations are major challenges for shipping companies in conducting deployment, such as the harsh environment, inadequate infrastructure for navigation, fueling, repair, and navigability at certain times of the year.

Table 4.
Cost analysis for the alternative routes between Hong Kong and New York.
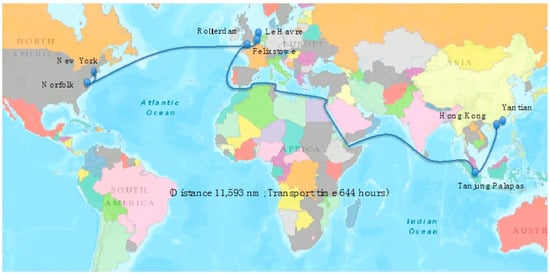
Figure 2.
Transport route for container cargo from Hong Kong to New York via the Suez Canal.
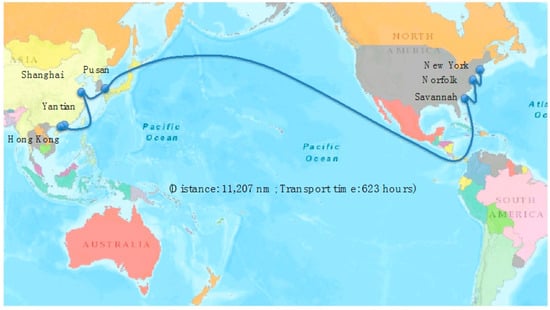
Figure 3.
Transport route for container cargo from Hong Kong to New York via the Panama Canal.
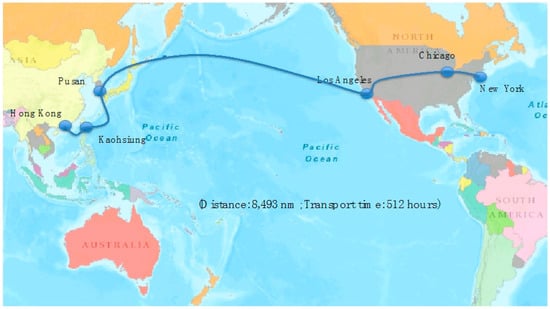
Figure 4.
Transport route for container cargo from Hong Kong to New York using U.S. intermodal system.
4.2. Selection and Weight of Determinants and Alternatives
The decision-making process for maritime route selection is determined by shipping companies. Therefore, considering the perspective of liner shipping companies is of vital importance. To clarify the process, two rounds of surveys were conducted using experts’ knowledge. In the first round, the criteria identification was based on literature review and open-ended questions and brainstorming sessions with experts in liner shipping companies. In the second-round, the survey was conducted by applying Fuzzy TOPSIS to weight the factors and alternatives.
In the first-round survey, previous studies regarding the selection of transport routes and implications from the expansion of the Panama Canal were examined among experts to acknowledge the emerging problem during 27 days (from 7 June to 3 July 2017). Respondents included general managers, operation managers of Hyundai Merchant Marine, the former Hanjin Shipping and business analysts for Heung A Shipping, PIL Singapore and NYK Japan, who have more than 23 years of professional experience. These experts were invited to participate in interviews aiming to discard superfluous factors and add missing factors extracted from the literature. The interviews were conducted face to face and by email to achieve the concession of seven determinants: transportation time, transportation cost, shipment size, reliability, route characteristics, the load capacity of railways/trucks, and vessel size.
However, among the seven factors affecting the three alternatives via the Panama Canal, the Suez Canal, and using the U.S. intermodal system in the case study of Hong Kong–New York, the capacities of railways and trucks, shipment size, and vessel size were unsuitable to take into consideration. Although the factor “capacity of railways and trucks” is considerable in making decisions among single-modal and multimodal transport routes, the factor was inappropriate to become a criterion to compare all-water routes (via the Panama Canal and via the Suez Canal) and multimodal route using U.S. land bridge. Similarly, the factor “vessel size” was eliminated to estimate the alternatives because there is no difference in capacity accommodating containership size deployed for the Asia–Pacific–United States (U.S.) East-Coast route. Therefore, the four factors that are the most influential determinants on route selection—transportation time, transportation cost, reliability, and route characteristics—were considered for the second-round survey (Table 5).

Table 5.
Determinants for route selection.
In the second-round survey conducted during 37 days from 10 July to 15 August 2017, the 12 experts were invited to complete the survey including the experts who participated in the first round to broaden the view of liner shipping companies to evaluate the factors and alternatives based one the criteria determined in the first-round survey. Therefore, the fuzzy TOPSIS method was applied to establish the weights of factors. The respondents are vice president, general manager, senior managers, and business analysts of SM Line, Core Bridge Consulting, and Cyberlogitec, who have average 19 years of working experience as operation managers and managers in the former Hanjin Shipping, which was a Korean liner carrier providing services crossing the Suez Canal and Panama Canal.
4.3. Assessment of the Criteria
The experts assessed the relative importance of factors using the linguistic variables shown in Table 2 and the results are shown in Table 6. It is indicated that, among the determinants of route selection, transportation cost was prioritized followed by transportation time, reliability, and route characteristics.

Table 6.
The ranking of the determinants of route selection.
According to liner shipping companies’ perspective, the highest priority was given to transportation cost when deciding upon the shipping route, as this factor contributes tremendously toward the total cost of cargo transport affecting the profit of the company and freight rates. Furthermore, transportation time was also a crucial factor when considering the route selection. A shorter transportation time would reduce the lead-time of transportation and increase ship turnaround times. The route selection decision-making process examined the factor reliability simultaneously to ensure on-time performance, avoiding uncertain and risky situations faced in transporting, especially at sea. Additionally, the route characteristics included the characteristics and constraints of the nodes and links that constitute the route, which is a significant factor to provide a stable shipping service.
4.4. Assessment of the Alternatives
To guarantee the objective of comparison, quantitative value is supreme, but there are major obstacles to achieving crisp value. Therefore, a combination of qualitative and quantitative analyses for selecting routes was applied to avoid subjectivity. The evaluation of subjective factors—reliability and route characteristics—was conducted using the questionnaire relying on the judgment of decision makers. A performance scale of each subjective factor is presented, as the linguistic terms as well as transformed into the fuzzy ratings, in Table 7.

Table 7.
Fuzzy ratings for the alternatives regarding subjective determinants.
Regarding the objective factors—transportation time and transportation cost—the real data would be transformed to fuzzy scores to ensure the compatibility of objective and subjective analyses. The crisp quantities for objective factors transformed into fuzzy ratings based on Equations (5) and (6) are illustrated in Table 8.

Table 8.
Fuzzy ratings for the alternatives regarding objective determinants.
The final ranking of the alternatives is demonstrated in Table 9. The assessment of the three alternative routes illustrates that the shipping route from Hong Kong to New York via the Panama Canal is preferred by liner shipping companies, followed by via the Suez Canal and the U.S. intermodal route in the three scenarios of different vessel sizes and shipment sizes.

Table 9.
The ranking of the alternatives.
According to the benchmark criteria, the shipping route via the Panama Canal is superior to the other alternatives due to the contribution of the most imperative factors such as transportation cost and reliability. In terms of transportation cost, deriving from the absolute advantage compared to other transportation modes and shorter distance, the all-water route via the Panama Canal has the lowest transportation cost among the three alternatives, although the Canal’s toll charge is considerably higher than the Suez Canal. In addition, the all-water route via the Panama Canal is assessed as the most reliable selection. The transportation time of the route would be a disadvantage factor compared to the multimodal transport alternative, but between the two all-water routes, via the Panama Canal achieves success in saving more time than via the Suez Canal due to the shorter distance.
As a result of the expansion of the Panama Canal, the shipping route via the Suez Canal was evaluated to lose its competitiveness with its shipping route counterpart due to its higher transportation cost as well as longer transportation time. The Egyptian government decided to expand the Suez Canal because of its contribution to the economy, which is expected to impact considerably on the composition of the shipping network. However, its competitiveness in transportation cost is gradually diminished due to the low oil prices and the absolute advantages regarding the cost and time of the via Panama Canal route deriving from the expansion. Additionally, the reliability of the route was assessed as the worse because of the political problems between the countries around the Suez Canal and the threat of pirates in the vicinity of the Suez Canal.
The least-preferred option was to use the U.S. intermodal system. The route has an absolute advantage in time compared to the all-water routes but the disadvantage in cost diminishes gradually its competitiveness. The voyage between Hong Kong and New York using the inland transportation system is shortened by approximately 26% in comparison with the Suez and Panama Canals, a reduction of 132 h and 111 h, respectively. The substantial reduction in valuable sailing time would lead to cost savings, including for fuel and transit fees, but the inland transportation costs cause a significantly higher transportation cost of the whole trip compared to all water routes. Although rail intermodal routes are far more efficient and productive than they used to be and are relatively safe and efficient in terms of fuel cost, driver shortages, and environmental matters, the cheaper route alternatives would be major barriers to increase the preference of the route as transportation cost is the decisive factor in route choice. However, the route was evaluated as the best among the three alternatives in terms of the criterion of the route characteristics. The route is the shortest and simplest sea route with the fewest calling ports and lowest potential risk of piracy or the possibility of political problems on the waterway.
4.5. Sensitivity Analysis
Deriving from the problems of MCDM in which data are difficult to qualify and are easily changeable, a sensitivity analysis is a fundamental concept to eliminate the errors of inaccurate measurements and provide reliable results [56]. Hence, a sensitivity analysis was performed to examine how the ranking of the alternatives changes when input data including the values and weights of the criteria change to new values [57]. A sensitivity analysis was conducted by increasing and decreasing 10% the importance weight of each factor. Accordingly, Table 10 presents the results for each of the four factors, and it illustrates the differences with respect to weighted scores for each alternative route.

Table 10.
Sensitivity analysis results.
Based on the high priority of transportation time and transportation cost factors compared to other factors in the decision-making process, preference for the alternatives was significantly sensitive to changes in these factors’ importance weights. By decreasing 10% the importance weight of the transportation time factor, the alternative via the Panama Canal and Suez Canal would significantly increase in competitiveness compared to the alternative using the U.S. system that has an absolute advantage in transportation time. For the alternatives via the Suez Canal, the change in the sensitivity of the transportation cost factor was the most notable in terms of the preference for the alternatives. By increasing the importance weight of transportation cost, the all water route via the Suez Canal would increase the in relative closeness to be the ideal option, especially because a group of vessel sized 13,000 TEU increases the most, by 0.022. In contrast, the intermodal route using the U.S. intermodal system would considerably increase in competitiveness if the importance weight of the transportation cost factor would decrease, as evidenced by the relative close distance to the ideal option, in which vessel size group of 8600 TEU is more beneficial than the other groups.
Even thoguh there are slight changes in preference scores for the alternatives, no change in the alternative routes’ rankings occurred. It is concluded that the methods and results are insensitive to possible errors in assessments, and, therefore, provide reliable results that the shipping route from Hong Kong to New York via Panama is the optimal route, followed by via the Suez Canal and using the U.S. intermodal system.
5. Discussion
The expansion of the Panama Canal is a vitally important project in the maritime industry, causing changes to maritime transport, multimodal transport, and shipping companies’ strategies and logistics patterns throughout the east–west route [3,4,5,6]. Thus, this paper examines the expansion’s associated impact to route choice, which is one of the most prioritized and crucial decisions of supply chain management [15].
Route choice involves many variables other than a direct comparison of transportation cost and transportation time. To explore the optimal route for container cargoes in the east–west route that is the largest market in the shipping business, this study examined alternative routes from Hong Kong (the representative port in South China) to New York (as the base port on the U.S. East Coast) where the differences in distance are the least among the options via the Panama Canal and via the Suez Canal. Using a combination of qualitative and quantitative factors, the fuzzy TOPSIS method was applied to weight four determinant factors and three alternative routes based on the opinions of experts from liner shipping companies. The results illustrate that transportation cost is the most important factor in deciding the transportation route, followed by transportation time, reliability, and route characteristics, and the shipping route via Panama is preferred over the shipping route via the Suez Canal and the route using the U.S. intermodal system.
Consequently, this study offers several academic and practical implications. In terms of academic implications, most studies are limited to the choice of the optimal route from the shippers’ perspective, and the quantitative factors are dominant. However, this study investigated which factors should be given priority when designing routes from the viewpoint of service suppliers who are actual decision makers of shipping routes. It is more meaningful in analyzing qualitative factors such as reliability and route characteristics with the increasing requirement of service quality in addition to quantitative factors such as transportation cost and transportation time. Furthermore, a sensitivity analysis was conducted to examine the accuracy of the measurements, overcoming the limitations of a static analysis. From a practical point of view, this study examined the competitiveness of the routes through the Panama Canal, the Suez Canal, and the U.S. intermodal system. Therefore, it would provide a more practical standard in the new shipping environment when planning routes for liner shipping companies.
However, the study did not consider factors such as the empty container handling rate and the empty container reposition cost, which account for a large portion of the operating costs of the liner shipping company. Besides, environmental factors were not examined in solving the routing problem. In the future, this study should be extended to a study of two-way routes, considering the factors related to container utilization, such as cost, time, and frequency of the return of empty containers as well as the effects on the environment. Moreover, despite wide application of TOPSIS method to solve the complicated MCDM problems, the rank reversal is unstable. Thus, other modifications such as the meaningful mixed data TOPSIS could be used to overcome the shortcomings.
Author Contributions
G.-T.Y. designed the framework of the paper, and reviewed and improved the paper. T.Y.P. analyzed the data and wrote the first draft of the paper. K.Y.K. conducted the survey.
Funding
This research received no external funding.
Conflicts of Interest
The authors declare no conflict of interest.
References
- Martinez, C.; Steven, A.B.; Dresner, M. East Coast vs. West Coast: The impact of the Panama Canal’s expansion on the routing of Asian imports into the United States. Transp. Res. Part E Logist. Transp. Rev. 2016, 91, 274–289. [Google Scholar] [CrossRef]
- Yahalom, S.; Guan, C. Containership port time: The bay time factor. Marit. Econ. Logist. 2018, 20, 211–227. [Google Scholar] [CrossRef]
- Rodrigue, J.P.; Notteboom, T.E. Containerization, box logistics and global supply chains: The integration of ports and liner shipping networks. Marit. Econ. Logist. 2008, 10, 152–174. [Google Scholar]
- Bhadury, J. Panama Canal expansion and its impact on East and Gulf coast ports of U.S.A. Marit. Policy Manag. 2016, 43, 928–944. [Google Scholar] [CrossRef]
- Justice, V.; Bhaskar, P.; Pateman, H.; Cain, P.; Cahoon, S. US container port resilience in a complex and dynamic world. Marit. Policy Manag. 2016, 43, 179–191. [Google Scholar] [CrossRef]
- Pagano, A.; Wang, G.; Sánchez, O.; Ungo, R.; Tapiero, E. The impact of the Panama Canal expansion on Panama’s maritime cluster. Marit. Policy Manag. 2016, 43, 164–178. [Google Scholar] [CrossRef]
- Leachman, R.C. Port and modal allocation of waterborne containerized imports from Asia to the United States. Transp. Res. Part E Logist. Transp. Rev. 2008, 44, 313–331. [Google Scholar] [CrossRef]
- Fan, L.; Wilson, W.W.; Tolliver, D. Logistical rivalries and port competition for container flows to US markets: Impacts of changes in Canada’s logistics system and expansion of the Panama. Marit. Econ. Logist. 2009, 11, 327–357. [Google Scholar] [CrossRef]
- Haralambides, H.E. Structure and operations in the liner shipping industry. In Handbook of Transport Modeling; Hensher, D.A., Button, K.J., Eds.; Elsevier: Amsterdam, The Netherlands, 2008; Volume 1, pp. 761–775. Available online: https://www.researchgate.net/publication/255587307_STRUCTURE_AND_OPERATIONS_IN_THE_LINER_SHIPPING_INDUSTRY (accessed on 21 November 2018).
- Danielis, R.; Marcucci, E.; Rotaris, L. Logistics managers’ stated preferences for freight service attribute. Transp. Res. Part E Logist. Transp. Rev. 2005, 41, 201–215. [Google Scholar] [CrossRef]
- Samimi, A.; Kawamura, K.; Mohammadian, A. A behavioral analysis of freight mode choice decisions. Transp. Plan. Technol. 2011, 34, 857–869. [Google Scholar] [CrossRef]
- Wang, Y.; Yeo, G.T. Intermodal route selection for cargo transportation from Korea to Central Asia by adopting Fuzzy Delphi and Fuzzy ELECTRE I methods. Marit. Policy Manag. 2018, 45, 3–18. [Google Scholar] [CrossRef]
- Cullinane, K.; Toy, N. Identifying influential attributes in freight route/mode choice decisions: A content analysis. Transp. Res. Part E Logist. Transp. Rev. 2000, 36, 41–53. [Google Scholar] [CrossRef]
- Tsai, H.Y.; Chang, C.W.; Lin, H.L. Fuzzy hierarchy sensitive with Delphi method to evaluate hospital organization performance. Expert Syst. Appl. 2010, 37, 5533–5541. [Google Scholar] [CrossRef]
- Belosevic, I.; Kosijer, M.; Ivic, M.; Pavlovic, N. Group decision making process for early stage evaluations of infrastructure projects using extended VIKOR method under fuzzy environment. Eur. Transp. Res. Rev. 2018, 10, 43. [Google Scholar] [CrossRef]
- Moon, D.S.; Kim, D.; Lee, E.K. A study on competitiveness of sea transport by comparing international transport routes between Korea and EU. Asian J. Shipping Logist. 2015, 31, 1–20. [Google Scholar] [CrossRef]
- Roorda, M.J.; Cavalcante, R.; McCabe, S.; Kwan, H. A conceptual framework for agent-based modelling of logistics services. Transp. Res. Part E Logist. Transp. Rev. 2010, 46, 18–31. [Google Scholar] [CrossRef]
- Shintani, K.; Imai, A.; Nishimura, E.; Papadimitriou, S. The container shipping network design problem with empty container repositioning. Transp. Res. Part E Logist. Transp. Rev. 2007, 43, 39–59. [Google Scholar] [CrossRef]
- Chang, T.S. Best routes selection in international intermodal networks. Comput. Oper. Res. 2008, 35, 2877–2891. [Google Scholar] [CrossRef]
- Rich, J.; Holmblad, P.M.; Hansen, C.O. A weighted logit freight mode-choice model. Transp. Res. Part E Logist. Transp. Rev. 2009, 45, 1006–1019. [Google Scholar] [CrossRef]
- Yang, X.; Low, X.J.M.W.; Tang, L.C. Analysis of intermodal freight from China to Indian Ocean: A goal programming approach. J. Transp. Geogr. 2011, 19, 515–527. [Google Scholar] [CrossRef]
- Xie, Y.C.; Lu, W.; Wang, W.; Quadrifoglio, L. A multimodal location and routing model for hazardous materials transportation. J. Hazard. Mater. 2012, 227–228, 135–141. [Google Scholar] [CrossRef] [PubMed]
- Ayar, B.; Yaman, H. An intermodal multicommodity routing problem with scheduled service. Comput. Optim. Appl. 2012, 53, 131–153. [Google Scholar] [CrossRef]
- Cho, J.H.; Kim, H.S.; Choi, H.R. An intermodal transport network-planning algorithm using dynamic programming intermodal tray: From Busan to Rotterdam in intermodal freight routing. Appl. Intell. 2012, 36, 529–541. [Google Scholar] [CrossRef]
- Tian, W.L.; Cao, C.X. A generalized interval fuzzy mixed integer programming model for a multimodal transportation problem under uncertainty. Eng. Optim. 2017, 49, 481–498. [Google Scholar] [CrossRef]
- Woo, S.H.; Kim, S.N.; Kwak, D.W.; Pettet, S.; Bereford, A. Multimodal route choice in maritime transportation: The case of Korean auto-part exporter. Marit. Policy Manag. 2018, 45, 19–33. [Google Scholar] [CrossRef]
- Fagerholt, K.; Gausel, N.T.; Rakke, J.G.; Psaraftis, H.N. Maritime routing and speed optimization with emission control areas. Transp.Res. Part C Emerg. Technol. 2015, 52, 57–73. [Google Scholar] [CrossRef]
- Zis, T.; Psaraftis, H.N. The implications of the new sulphur limits on the European Ro-Ro sector. Transp. Res. Part D Transp. Environ. 2017, 52, 185–201. [Google Scholar] [CrossRef]
- Shinghal, N.; Fowkes, T. Freight mode choice and adaptive stated preferences. Transp. Res. Part E Logist. Transp. Rev. 2002, 38, 367–378. [Google Scholar] [CrossRef]
- Danielis, R.; Marcucci, E. Attribute cut-offs in freight service selection. Transp. Res. Part E Logist. Transp. Rev. 2007, 43, 506–515. [Google Scholar] [CrossRef]
- Norojono, O.; Young, W. A stated preference freight mode choice model. Transp. Plan. Technol. 2003, 26, 195–212. [Google Scholar] [CrossRef]
- Huang, T.H. A comparative study on pollutant emission and hub port selection in Panama Canal expansion. Marit. Econ. Logist. 2015, 17, 163–178. [Google Scholar] [CrossRef]
- Wang, G.W.Y.; Talley, W.; Brooks, M.R. Maritime economics in a Post-Expansion Panama Canal Era. Marit. Policy Manag. 2016, 43, 161–163. [Google Scholar] [CrossRef]
- Liu, Q.; Wilson, W.W.; Luo, M. The impact of Panama Canal expansion on the container-shipping market: A cooperative game theory approach. Marit. Policy Manag. 2016, 43, 209–221. [Google Scholar] [CrossRef]
- Chen, C.T. Extensions of the TOPSIS for group decision-making under fuzzy environment. Fuzzy Sets Syst. 2000, 114, 1–9. [Google Scholar] [CrossRef]
- Yeo, G.T.; Wang, Y.; Chou, C.C. Evaluating the competitiveness of the aerotropolises in East Asia. J. Air Transp. Manag. 2013, 32, 24–31. [Google Scholar] [CrossRef]
- Deng, X.; Wang, Y.; Yeo, G.T. Enterprise perspective-based evaluation of free trade port areas in China. Marit. Econ. Logist. 2017, 19, 451–473. [Google Scholar] [CrossRef]
- Akkaya, G.; Turanoglu, B.; Oztas, S. An integrated fuzzy AHP and fuzzy MOORA approach to the problem of industry engineering sector choosing. Expert Syst. Appl. 2015, 42, 9565–9573. [Google Scholar] [CrossRef]
- Zavadskas, E.K.; Mardani, A.; Turskis, Z.; Jusoh, A.; Nor, K.M.D. Development of TOPSIS method to solve complicated decision-making problems – an overview on developments from 2000 to 2015. Int. J. Inf. Technol. Decis. Mak. 2016, 15, 645–682. [Google Scholar] [CrossRef]
- Saaty, T.L.; Ergu, D. When is a decision-making method trustworthy? Criteria for evaluating multi-criteria decision-making methods. Int. J. Inf. Technol. Decis. Mak. 2015, 2015. 14, 1171–1187. [Google Scholar] [CrossRef]
- Zavadskas, E.K.; Turskis, Z.; Kildiene, S. State of art surveys of overviews on MCDM/MADM methods. Technol. Econ. Dev. Econ. 2014, 20, 165–179. [Google Scholar] [CrossRef]
- Wang, Y.; Yeo, G.-T.; Ng, A.K.Y. Choosing optimal bunkering ports for liner shipping companies: A hybrid Fuzzy-Delphi–TOPSIS approach. Transp. Policy 2014, 35, 358–365. [Google Scholar] [CrossRef]
- Kim, Y.J.; Chung, E.S.; Jun, S.M.; Kim, S.U. Prioritizing the best sites for treated wastewater instream use in an urban watershed using fuzzy TOPSIS. Resour. Conserv. Recycl. 2013, 73, 23–32. [Google Scholar] [CrossRef]
- Sremac, S.; Stevic, Z.; Pamucar, D.; Arsic, M.; Matic, B. Evaluation of a Third-Party Logistics (3PL) Provider Using a Rough SWARA–WASPAS Model Based on a New Rough Dombi Aggregator. Symmetry 2018, 10, 305. [Google Scholar] [CrossRef]
- Watrobski, J.; Malecki, K.; Kijewska, K.; Iwan, S.; Karczmarczyk, A.; Thompson, R.G. Multi-Criteria Analysis of Electric Vans for City Logistics. Sustainability 2017, 9, 1453. [Google Scholar] [CrossRef]
- Seyed, H.R.H.; Shide, S.H.; Yousef, M.; Edmundas, K.Z. Fuzzy belief structure based VIKOR method: An application for ranking delay causes of Tehran metro system by FMEA criteria. Transport 2016, 31, 108–118. [Google Scholar]
- Deveci, M.; Canitez, F.; Gokasar, U. WASPAS and TOPSIS based interval type-2 fuzzy MCDM method for a selection of a car sharing station. Sustain. Cities Soc. 2018, 41, 777–791. [Google Scholar] [CrossRef]
- Zavadskas, E.K.; Turskis, Z.; Bagocius, V. Multi-criteria selection of a deep-water port in the Eastern Baltic Sea. Appl. Soft Comput. 2015, 26, 180–192. [Google Scholar] [CrossRef]
- Stevic, Z.; Pamucar, D.; Kazimieras Zavadskas, E.; Cirovic, G.; Prentkovskis, O. The Selection of Wagons for the Internal Transport of a Logistics Company: A Novel Approach Based on Rough BWM and Rough SAW Methods. Symmetry 2017, 9, 264. [Google Scholar] [CrossRef]
- Song, X.; Zhong, L.; Zhang, Z.; Xu, J.; Shen, C.; Pena-Mora, F. Multi-stakeholder conflict minimization-based layout planning of construction temporary facilities. J. Comput. Civ. Eng. 2017, 32, 04017080. [Google Scholar] [CrossRef]
- Zadeh, A. Fuzzy sets. Inf. Control 1965, 8, 338–353. [Google Scholar] [CrossRef]
- Jeon, J.W.; Yeo, G.T.; Thai, V.V.; Yip, T.L. An evaluation factors for ship management companies using fuzzy evaluation of the success factors for ship management companies using fuzzy evaluation method. Int. J. Shipping Transp. Logist. 2016, 8, 389–405. [Google Scholar] [CrossRef]
- Hwang, C.L.; Yoon, K. Multiple Attributes Decision Making Methods and Applications; Springer: Berlin/Heidelberg, Germany; New York, NY, USA.
- Buyukozkan, G.; Cifci, G. A combined fuzzy AHP and fuzzy TOPSIS based strategic analysis of electronic service quality in healthcare industry. Expert Syst. Appl. 2012, 39, 2341–2354. [Google Scholar] [CrossRef]
- Chou, C.C. An integrated quantitative and qualitative FMCDM model for location choices. Soft Comput. 2010, 14, 757–771. [Google Scholar] [CrossRef]
- Simanaviciene, R.; Ustinovichius, L. Sensitivity Analysis for Multiple Criteria Decision Making Methods: TOPSIS and SAW. Procedia. Soc. Behav. Sci. 2010, 2, 7743–7744. [Google Scholar] [CrossRef]
- Triantaphyllou, E.; Shu, B.; Sanchez, N.; Ray, T. Multi-criteria Decision Making: An operation Research Approach. Encycl. Electr. Electron. Eng. 1998, 15, 175–186. [Google Scholar]
© 2018 by the authors. Licensee MDPI, Basel, Switzerland. This article is an open access article distributed under the terms and conditions of the Creative Commons Attribution (CC BY) license (http://creativecommons.org/licenses/by/4.0/).

