Article

Investigating Key Factors Influencing Farming Decisions Based on Soil Testing and Fertilizer Recommendation Facilities (STFRF)—A Case Study on Rural Bangladesh

by
Faruque-As-Sunny
1,*,
Zuhui Huang
1 and
Taonarufaro Tinaye Pemberai Karimanzira
2
1
School of Public Administration, Zhejiang University, Hangzhou 310058, Zhejiang, China
2
School of Nontraditional Security Studies, Zhejiang University, Hangzhou 310058, Zhejiang, China
*
Author to whom correspondence should be addressed.
Sustainability 2018, 10(11), 4331; https://doi.org/10.3390/su10114331
Submission received: 16 October 2018 / Revised: 4 November 2018 / Accepted: 14 November 2018 / Published: 21 November 2018

Abstract

:
Proper nourishment is fundamental for satisfactory crop growth and production. However, for efficient crop production, it is important to understand the soil environment, to recognize the limitations of that environment, and to ameliorate them where possible without damaging the soil quality. Soil testing and fertilizer recommendation facilities (STFRF) can help farmers to achieve environmental and economic sustainability by assisting them in recognizing their soil condition, reducing agrochemicals usage, using an appropriate amount of fertilizer, minimizing input costs, and achieving higher yield. These facilities are not new in the context of Bangladesh, yet the adoption rate among farmers is low and its determinants have rarely been empirically tested based on microlevel data. Therefore, this study examined those factors underlying the adoption of soil testing and fertilizer recommendation facilities using field surveyed data of 176 individual farmers. Our evidence shows that young farmers with less farming experience are more likely to adopt these facilities. Additionally, being small-scale farmers, having higher education, having more farming income, and having more knowledge about these facilities and the fees of these facilities were found to have a significant effect on the adoption. On the other hand, gender, land ownership, and secondary income were found to be insignificant with regard to the adoption of soil testing and fertilizer recommendation facilities. Our results also revealed that most adopter farmers not only focused on profitability, but were additionally concerned with environmental well-being.

1. Introduction

Sustainable agriculture has been described as a concept/system that conserves the natural environment and resources in a technically appropriate, economically viable, and socially acceptable way [1]. The sustainable development of the agricultural sector critically depends on the adoption of improved, scale-appropriate, and eco-friendly technologies, which included soil quality measurement tools, site-specific fertilizer use measures, disease resistant and climate adjusted seeds, modern management practices, and the conservation of resources via scale appropriate agricultural machinery [2].
Bangladesh is primarily an agrarian economy that employs 39.06% of the actively employed population, translating to a 13% contribution to the gross domestic product (GDP) [3]. Nearly 65% of the Bangladeshi population live in rural areas and two-thirds of this population are directly employed into agriculture [4]. Thus, through agricultural activity, the Bangladeshi economy successfully increased by 7.1% in 2016 fiscal year (FY), which exceeded the national growth target and trajectory by 7.0% and 6%, respectively [5]. As a result, the population under poverty was reduced from 31.5% to 24.3% between 2010 and 2016 [6], which reflected a socioeconomic shift into lower middle-income status in 2015 [7]. However, 12.9% of the overall population remains ultra-poor, living on the equivalent of US $1.25 per day or less, with 31% living below the national poverty line of US $2 per day [6,8]. The World Bank [9] data indicated that 15.1% of the total population is still undernourished, while one-fourth of the population remains food insecure, including eleven million suffering from serious hunger [10,11].
According to the Soil Resource Development Institute (SRDI), agricultural land in Bangladesh is shrinking quickly wherein between 1976–1977 and 2010–2011, there was a loss of 0.27% annually [12]. Rahman [13] stated that if the current land loss trend continues, there would be no accessibly cultivatable land by 2068. Between FY2015 and FY2016, there was a negative crop growth of 0.9% and agricultural growth declined from 16% to 15% during those years. Furthermore, the total production of rice and wheat declined to 35.88 million metric tons (MMT) in 2016: A shortfall of about 0.5% [5]. In the same regard, the United States Agency for International Development (USAID) projected an annual −3.1% agricultural growth between the years 2005–2050 [14]. The principal causes of this decreasing agricultural throughput are assumed to be diminishing soil productivity, poor use of water and fertilizer, insufficient supply of quality seeds, low labor productivity, higher input costs, and the absence of efficient river management infrastructure [15,16,17,18]. Other challenges affecting agricultural production and food insecurity include human economic migration away from agriculture toward industry and services [19,20]. A recent roundtable meeting on “balanced fertilizer usage” organized by “The Daily Star” reported that the majority of Bangladeshi farmers did not follow fertilizer recommendation guides [21]. They were also unwilling to perform or rely upon soil tests and explicitly prepared recommendations of the required amount of fertilizers they needed, and instead put faith in tacitly acquired traditional farming experience and knowledge [21,22,23,24]. Subsequently, limited access to soil testing services, inappropriate use of modern production technologies, and the lack of knowledge in using fertilizers effectively resulted in the trend towards lower productivity [25,26,27,28,29].
At present, to ensure sustainable growth by introducing sustainable farming methods in Bangladesh’s agricultural sector, the Katalyst organization along with the Soil Resource Development Institute (SRDI), Grameen Intel (GI), and other private organizations have introduced soil testing and fertilizer recommendation facilities (STFRF). These facilities can assist farmers to recognize the condition and composition of their soil, as well as methods to sustain balanced nutrition within the soil. In this way, the correct doses of fertilizer for crops can be recommended, farmers can more efficiently manage the environment, the reduction in production waste can be realized, and eco-environmental sustainability is more likely to be achieved. These organizations have reported that by using these STFRFs, farmers can not only cut down superfluous costs, but can also increase the yield of rice and other crops by 20–25% and 15–20%, respectively [30,31]. Unfortunately, the Bangladeshi agricultural sector has a low adoption rate for these services [18,25,26,32] and its determinants have rarely been empirically tested based on microlevel data.
The adoption of new technologies and technological packages have reportedly had positive impacts on the environment, agricultural productivity, cost, and income in the developing world [33,34,35,36,37]. When analyzing the result of increased productivity based on new information, a study found that the use of scientifically accumulated information aided in greater yield in China [33]. An experiment to compare the tons per hectare (t ha−1) of rice production in China under three conditions of agricultural decision-making information sources (Nutrient Expert [NE], soil test only [ST], and usual Farming Practices [FP]) found that rice farmers enjoyed significantly larger yield increases (8.2 t ha−1 to 9.0 t ha−1) between 2013 and 2015 under NE. NE as a decision making tool in Chinese agronomic practices also greatly improved Nitrogen recovery in soil in relation to FP and illustrated the superiority of specified, contextual information against less quantifiable and less understandable information. The lesson learned through this study was that the application of science-based information with more inferential power had a net positive effect on yield production, soil conservation, and environmental protection. While researching the causal effect of adopting high yield varieties (HYVs) of rice on Bangladeshi resource-poor farmers’ income levels, Mendola [38] discovered that the adoption of HYVs resulted in a statistically significant 20% reduction in the probability of being poor for small and medium farmers. At the same time, there seems to be a lack of income-level impact on near-landless poor households when they grew HYVs. Although farmers could improve their future income and reduce poverty by growing these new varieties, the combined gross area effect on the poverty line was marginal unless other equity-enhancing policy measures are undertaken [38]. A Thai study [39] on nutrient management of soils illustrated the importance of including a site-specific knowledge management systemized approach to agriculture to increase farming productivity and sustainability. Ameliorating the process of capturing the best tacit knowledge held by local farmer leaders, then combining it with the well-tested scientific knowledge to produce information ready for dissemination for all levels of the demographics of farmers, was key to improving adoption of new techniques and practices. By simplifying access to critical farming information, training farmers to be receptive to identifying needs for farm practice change, and capturing new knowledge scientifically, productivity and environmental sustainability improved. Out of a sample of 248 farmers investing an average of US $406.4/ha, the study found an approximate 2000 kg average yield difference in favor of those who were using site-specific nutrient management (SSNM). Furthermore, SSNM users were able to lower fertilizer usage cost by US $39.42/ha (as compared to non-SSNM users), which assumes a more efficient use of fertilizer and a better soil management practice by farmers [39]. Subsequently, scientifically developed new technologies are worth investing in (and adopting) once the user is adequately versed in the effects and implications of said technologies, information, and practices. Using an agricultural household model in Ethiopia, Zeng et al. [40] discovered that improved maize varieties (IMV) adoption and consumption had positive overall impacts on child nutrition outcomes, measured both in height for age z-scores (HAZ) and weight for age z-scores (WAZ). It was found that the adoption-related increase in own-produced IMVs consumption explains almost 75% of the overall impacts on HAZ and more than 50% on WAZ. In addition to this, they also suggested that such findings are of direct policy relevance because most child nutrition determinants, such as the household socioeconomic conditions, are difficult to improve in the short run, while IMV adoption can be promoted through a number of policies to do such a thing.
The role of policy is not only to exclusively encourage adoption for its positive externalities to agriculture, but also to be heavily mindful of the negative effects policy can create around a new technology or where and how it is implemented. The case of “Happy Seeder” in Punjab, India, illustrated that taking into consideration not only technology, but also policies for subsidies on factors to production, such as capital, crop prices, energy, water, fertilizer, and land has an important effect on the efficacy of adopting critical changes to old practices [41]. The Happy Seeder (a tractor powered machine) allows farmers to choose not to burn past post-harvested rice straw to clear farmlands, but rather reuse them as fertilizers whilst planting new seeds at the same time. It is thus environmentally friendly, and efficient, but suffers from low adoption as a result of policy choices that affect factors to production. Technologies such as the Happy Seeder are not essentially critical for production, but rather for long-term environmental sustainability and, thus, making these kinds of technologies should be economically attractive.
In most research, the decision of which influencing factors are to be tested seems largely an exercise of explorative research. It also seems to be dependent on a number of internal and external influences, which differ along many different covarying factors [42,43,44]. In 1979, Davies developed an approach he coined the threshold model [45]. This model consisted of three elements that drive adoption decision-making and which were microeconomic behavior, a source of heterogeneity, and a dynamic process affecting microeconomic behavior and adoption. He believed that potential adopting decision-makers were heterogeneous and assumed they all were driven by profits. The sources of the heterogeneity (such as farm size, human capital, knowledge, information about the technology, risk, cost and benefit, learning by doing, changes in supply, etc.) are factors that might influence the potential user’s adoption decision. As adoption decisions required investments, time was considered to be an important factor and it was assumed that not all the population subsets would choose to adopt a new technology at the same time based on their heterogenic condition. According to Rogers’ diffusion of innovations theory (1995), ‘perceived attributes of innovation’, ‘types of innovation decisions’, ‘communication channels’, ‘nature of the social system’, and ‘extent of change agents’ promotion efforts relating to the adoption decision’ all affect the adoption rate of innovations [46]. Goodhue and Thompsons (1995) in their task-technology fit theory purported that so long as the technology met the needs and wants of the users, a good fit between task and technology increased the likelihood of utilization and, thus, performance impact [47]. The theory of reasonable action (TRA) by Fishbein and Ajzen (1975) and the theory of planned behavior (TPB) by Ajzen (1985, 1991) focused on theoretical constructs concerned with individual motivational factors as the determination of the likelihood of performing a specific behavior [48]. Decomposed theory of planned behavior by Taylor and Todd (1995) suggested that attitude, subjective norms, and perceived behavioral control influence behavioral intention and actual adoption behavior [42]. In his doctoral proposal, Davis (1986) introduced the model for technology acceptance (TAM). TAM specifically tried to understand what affected individuals’ motivation towards adopting a newer innovation in technology. There were three factors that were believed to be the key to shift a person towards actual new behaviors. These were perceived usefulness, behavioral intention, and perceived ease of use. Between the years 1989 and 2008, researchers explored what other mitigating factors there were and how they could have influenced these three major factors. This exercise led to the development of innovations to the original TAM model. The initial changes to the TAM model came by way of Davis, Bogozzi, and Warshaw (1989) [49], and Venkatesh and Davis (1996) [50,51]. Later, TAM2 by Venkatesh and Davis (2000) [52,53] and TAM3 by Venkatesh and Bala (2008) [54] were developed. Meanwhile, a new model by Venkatesh, Morris, Davis, and Davis named UTAUT (unified theory of acceptance and use of technology) was also introduced in 2003 [55].
Several common factors that explain the behavior of agricultural innovation adopters across the world have been noted in the literature. In the cases where significant relationships were found, larger farm size [56,57,58,59], higher education [60,61], gender [62,63], younger age of the farmers [64], longer farming experience [65,66], land ownership [67], and larger income earners [68,69] predicted higher adoption of new technologies and practices. However, this line of research is not without its share of inconsistencies, as the abovementioned factors were also found to have negative associations to adoption, which in some cases were significant. For instance, in South Africa and Israel, having a larger farm size translated to lower adoption of new technologies [70,71]. Likewise, Samiee, Rezvanfar, and Faham [72] while researching the factors influencing the adoption of integrated pest management (IPM) by wheat growers in Varamin County, Iran, concluded that the size of farmers’ land holdings did not affect IPM adoption and suggested that IPM technologies are mostly scale-neutral. Several studies from North India, Bangladesh, Brazil, the US, and Ghana established that farmers’ education level is a key factor to technology adoption [73,74,75,76,77]. However, Uematsu and Mishra [78], using 2006 agricultural resource management survey (ARMS) data, while analyzing the impact of education on technology adoption, found evidence that formal education is a barrier to technology adoption, especially for small farmers. Chuchird et al. [79] conducted a study in Thailand and narrated an insignificant effect of gender and education on technology adoption. Moreover, Nigussie et al. [80] in Northwestern Ethiopia found a significant negative effect of male gender on sustainable land management technologies. Farid et al. [81] in their study on Northern Bangladesh discovered that age does not have any significant relationship with adoption. Nevertheless, age has been found to have a positive relationship with the decision to adopt imazapyr-resistant maize (IRM) technology in Western Kenya, implying that old farmers are more willing to adopt IRM than young farmers [82]. Other studies on aquaculture systems by Louisiana [83] and farmers’ technology use practices in Bangladesh [84] found that the influence of farming experience and higher income were either negligible or insignificant with regard to technology adoption.
The acquisition of new technology information has been considered a critical factor related to the technology adoption process [85], as farmers are more willing to adopt those technologies about which they have heard or are aware of and which have proved to be profitable [86]. However, excessive access to information can create ‘information noise’ that distracts, complicates, and makes new technologies less encouraging to consider [87].
Extension services are considered a great source of knowledge and play a great role in promoting improved agricultural practices to farmers, as they create links between the stimulation system and acquisition system [88]. Evidence from Bangladesh and Greece confirmed that farmers with available (and, presumably, effective) extension services are likely to have higher adoption rates for new technology. This is because extension agents provide knowledge about the specific technologies that help farmers to develop insights into the consequences of each option, reduce transaction cost when passing the information to a large population of farmers, and can counterbalance the negative effect of a lack of years of formal education in the overall decision to adopt some technologies [89,90].
According to Feder [91], farmers’ initial investment on a technology was described as a barrier to a more rapid adoption decision. A Malawian study on the access to credit for the adoption of hybrid maize and a Bangladeshi study on factors associated with small-scale agricultural machinery adoption pointed out that access to credit can ease farmers’ liquidity constraints, alleviate households’ risk-bearing conditions, and thus increase the adoption chances of a new technology [92,93]. Contrarily, research on Iran and Niger reported that a farmer receiving credit for adopting a new agricultural technology can often misuse it for other purposes (school fees, house repair, etc.) [88], creating a high reimbursement risk [94]. Several other studies from Northern Ethiopia, Bangladesh, Uganda, and the Philippines revealed that the secondary or off-farm income is positively associated with technology adoption, as it solves some of the experienced credit constraint issues or acts as a substitute for borrowed capital [93,95,96,97].
Mendola’s study on Bangladesh [38] and Tessema et al.’s on Ethiopia [98] has narrated that friends and neighbors employing new technology positively affects farmers’ decision-making process to adopt that technology. Other factors, such as farmers’ participation in the agricultural exhibition, availability of the new technology, and personal innovativeness, are linked with the technology adoption process, too [99,100,101].
Furthermore, Leathers and Smale [102] suggested that learning by doing could influence farmers towards a new technology adoption. As noted before, the ability for a piece of technology to register a favorable return on investment can only be demystified through some level of experimentation [91,102]. The resulting tacit knowledge on how the technology actually works and how it can be best made use of can maximize the expected perceived utility from a stream of profit subjects to a bounded rate of adoption [102].
The foregoing literature suggested that, though a number of studies on various technology adoptions have been conducted across the world, soil testing and fertilizer recommendation facilities have not been well investigated yet, especially in the context of Bangladesh.
Therefore, in this study, we firstly unravel those factors that influence the adoption of soil testing and fertilizer recommendation facilities among peasant farmers in two districts of Bangladesh. Secondly, this study investigates the interpretation of the respondent farmers’ sentiment towards adoption and non-adoption in order to assess their sensitivity about these facilities. Finally, we found it necessary to shed light on the existence of any gap between service providers and farmers in regard to what affects the new adoption methods and processes. In conclusion, this study seeks to provide some possible suggestions for the future successful diffusion and adoption of these innovations in our study areas.

2. Method and Materials
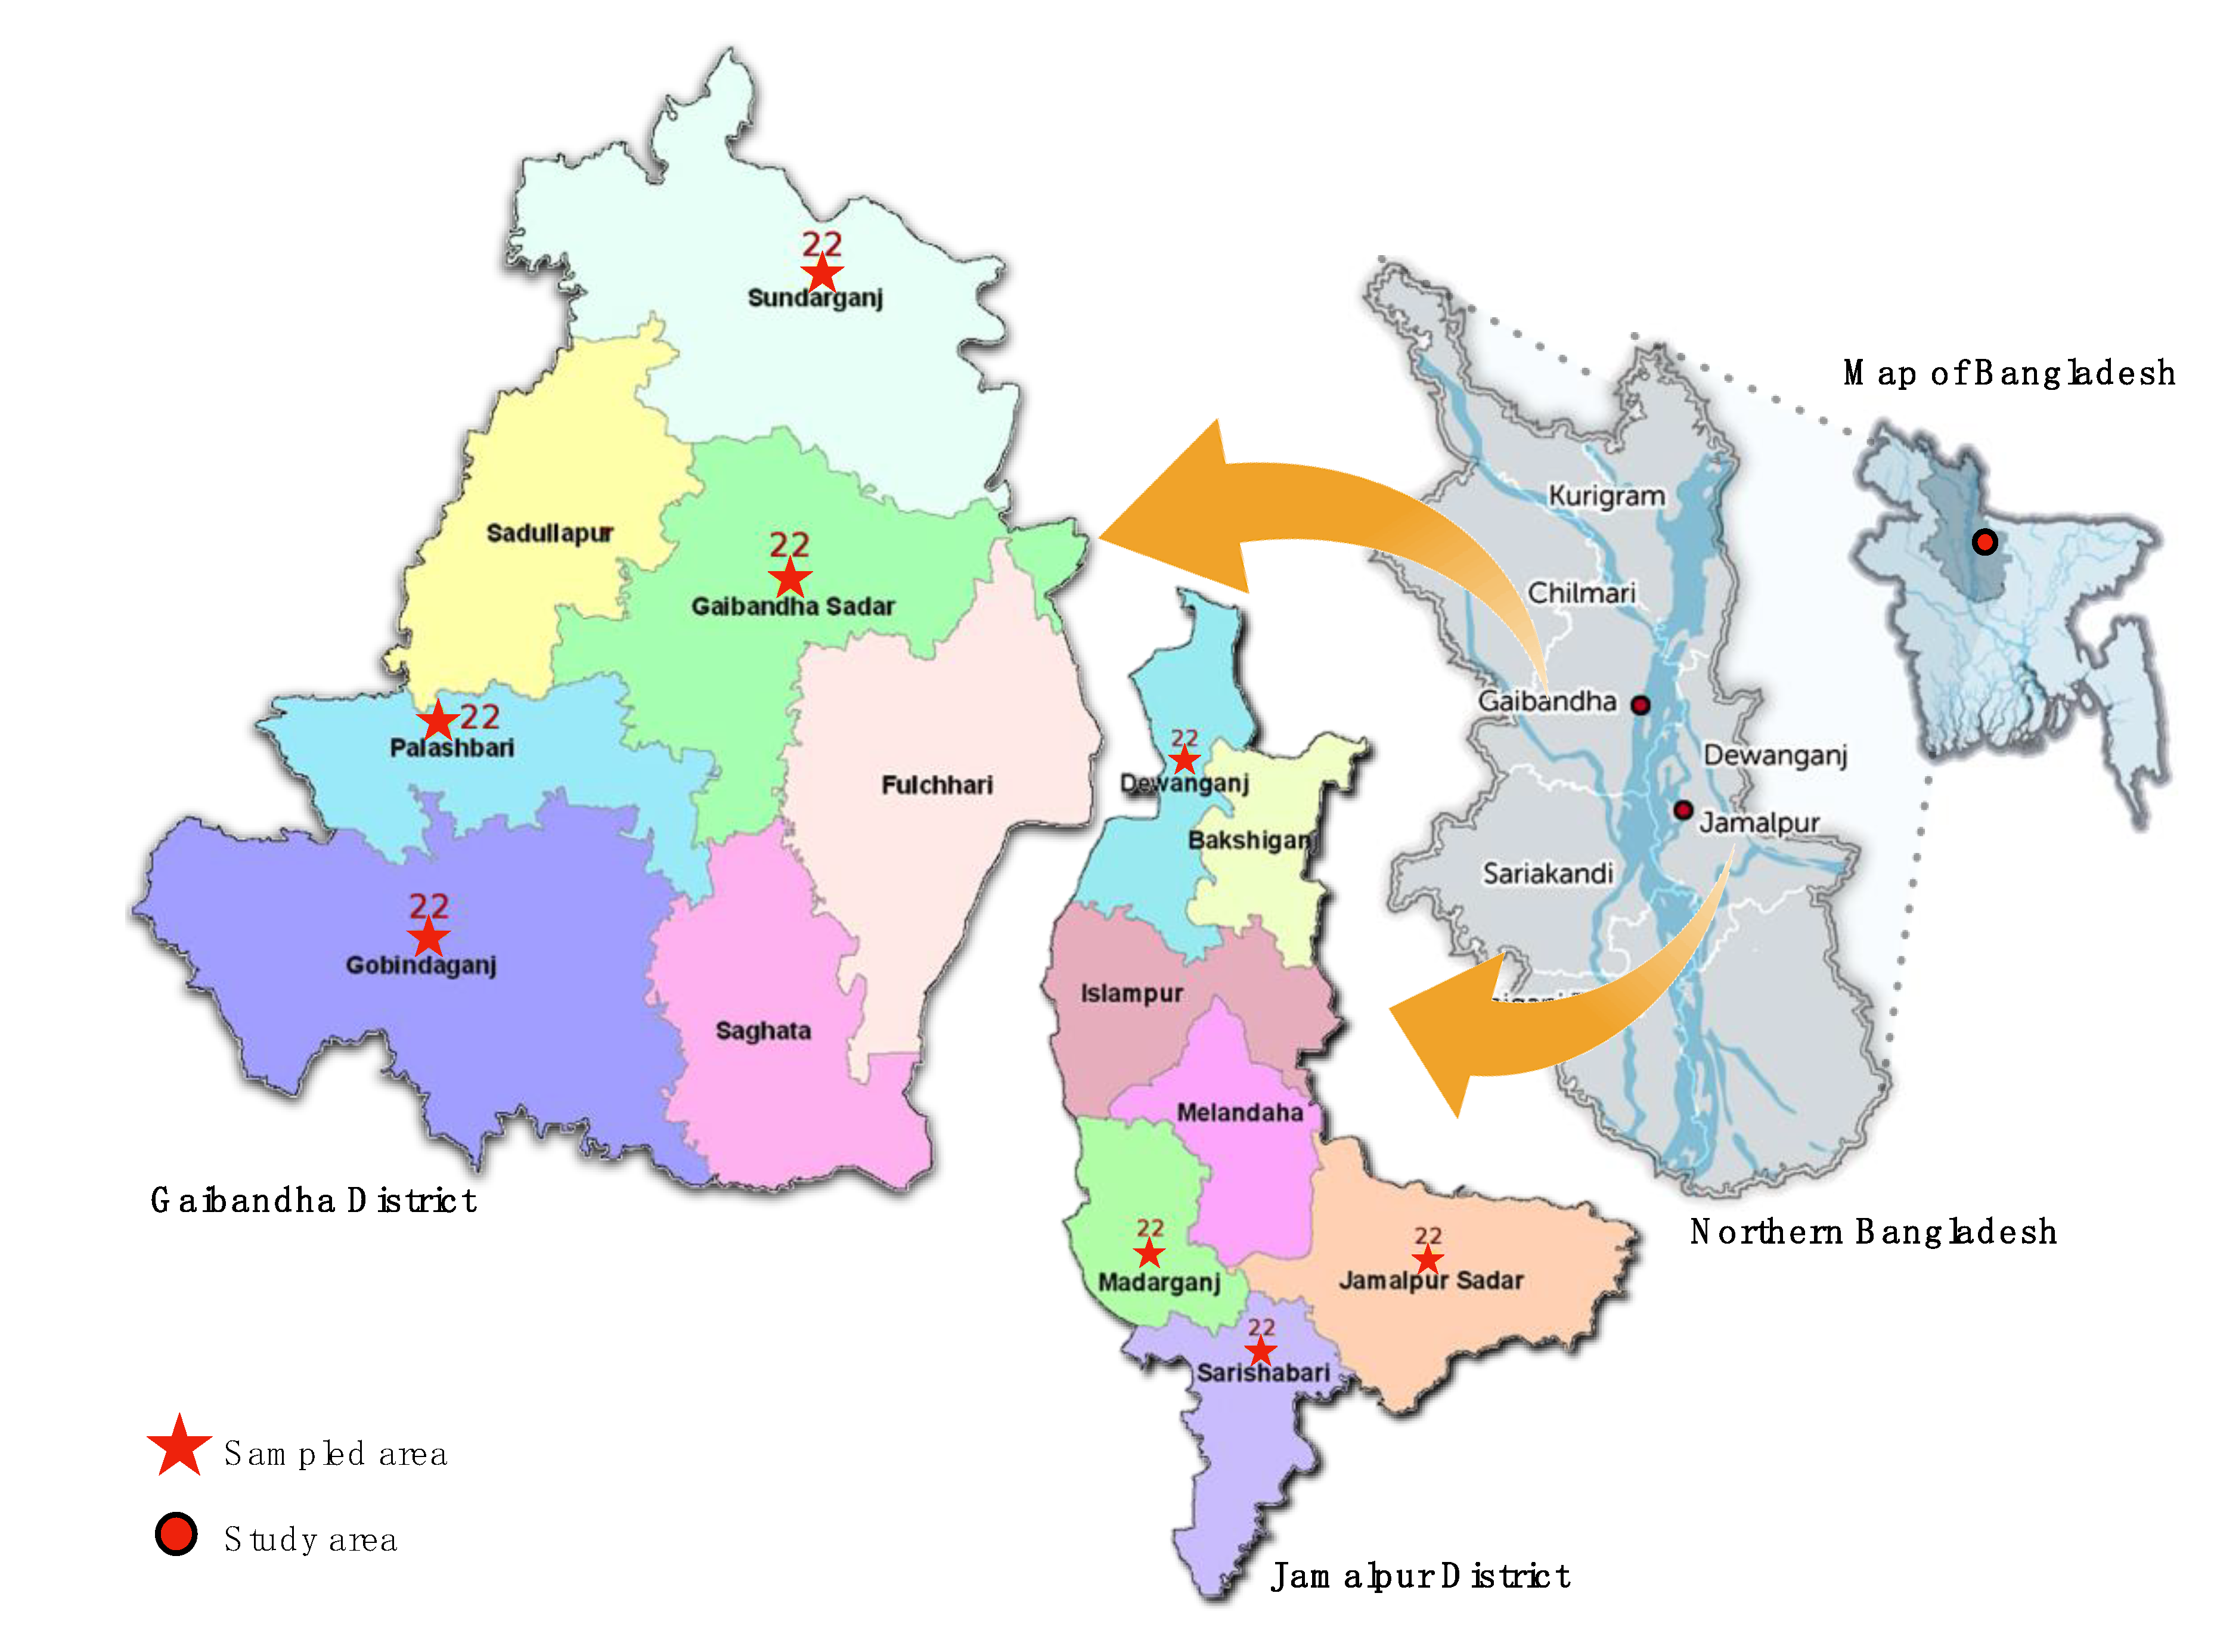
2.1. Study Area

The study was conducted in the northeast part of Bangladesh in May 2017. We purposively selected the north and northeast (Jamalpur and Gaibandha) of Bangladesh (Figure 1), since the agriculture produce is diverse and agricultural products are the primary source of income in these regions. Jamalpur is an important market center of the rice, sugarcane, jute, tobacco, and mustard produced in the region, whereas the main crops in Gaibandha district are paddy, wheat, jute, sugarcane, potato, brinjal, mustard seed, chili, onion, garlic, and vegetables. Secondly, the food insecurity and poverty rate is high in these regions [103,104]. Thirdly, higher illiteracy rates, lack of irrigation facilities, low output price, labor scarcity, lack of proper knowledge about improved varieties, insect pest and diseases management, and weak research extension farmers’ linkages, etc. are other important factors affecting crop growth in these areas [105]. Finally, there is an established relationship between the researchers and the farmers; therefore, it was assumed that access to the relevant populations would be high. Furthermore, Rabi season (starting from November and ending around April) was chosen since during this season the farmers usually grow a variety of crops, to include: Wheat, maize, boro rice, potato and sweet potato, mustard, sesame, lentil, brinjal, tomato, carrot, bottle gourd, country bean, chili, onion, garlic, coriander, cumin, sugarcane, tobacco, watermelon, etc. [106].

2.2. Sampling Technique and Questionnaire Design

We employed multistage sampling techniques for this study. There are 14 total subdistricts (upazilas) in the Gaibandha and Jamalpur districts, and both districts are divided into 7 upazilas equally. Therefore, a simple random sampling method was used to select four out of the seven upazilas from each district. In the next stage, we selected twenty-two households from each upazila, determining the sample size. Hence, sample sizes of 88 households (1 district × 4 upazilas × 22 household heads = 88) were selected from one district. Likewise, a similar proportion of upazilas and households were taken from another district. All study areas had 11 adopters and 11 non-adopters. Thus, finally, the sample number of two districts stood at 176.
This study employed qualitative research techniques that involved the collection of data through semi structured personal interviews with farmers. This method (face-to-face, focus group discussion, and phone interviews) was effective for data collection, as it gave an opportunity for feedback between researchers and respondents. The interviewed respondents were engaged in agricultural work, with the majority of them being rice farmers and the rest producing vegetables. The questionnaire included household farmers’ demographic and socioeconomic condition, their adoption or non-adoption behavior, and their knowledge about and opinion regarding the service quality of soil testing and fertilizer recommendation facilities.

2.3. The Analytical Framework

A great deal of the studies that investigated the adoption of a technology employed dichotomous choice data models (adopt or not adopt). Both logit and probit models can be used to assess the functional relationship between the probability of adoption and its determinants. Many studies used binary models to specifically analyze farmers’ adoption decisions on a single technology [94,95,107]. This is considered the most suitable approach, as it provides more detailed information on the characteristics of farmers who would adopt a specific technology.
For this specific study, we used the logit model to investigate the factors influencing the adoption of the soil testing and fertilizer recommendation facilities, as the adoption process itself is logistic in nature and is consistent with the literature on adoption [46,108]. The theory that we considered, related to this study, is the threshold decision-making theory [45,109,110,111]. Since the theory is related to farmers’ decisions of whether to adopt a technology or not, a reaction threshold which is dependent on a certain set of factors arises. As such, no adoption is observed when a certain value of stimulus falls below the threshold, while at the critical threshold value, a reaction is stimulated. Such phenomena are generally modeled using the relationship:
Y i = β X i + u i ,
where, Y i equals one (1) when a choice is made to adopt and zero (0) otherwise. This means:
Y i = { 1 ,     i f   X i X * 0 ,     i f   X i < X *   for   all   i ,   i = 1 ,   2 , . ,   n .  
Here, X* is the combined effects of the independent variables ( X i ) at the threshold level.
Equation (1) represents a binary choice model involving the estimation of the probability of adoption of a given technology (Y) as a function of independent variables (X). Mathematically, this is represented as:
P r o b ( Y i = 1 ) = F ( β X i )
P r o b ( Y i = 0 ) = 1 F ( β X i )
where Y i is the observed response for the ith observation of the response variable, Y. This means Y i = 1   for an adopter of soil testing and fertilizer recommendation facilities, Y i =   0 for a non-adopter of soil testing and fertilizer recommendation facilities, and X i is the set of independent variables which is associated with the ith probability of adoption, (P). The function, F may take the form of a normal, logistic, or probability function. The logit model uses a logistic cumulative distributive function to estimate, P, as follows [112,113]:
P ( Y 1 ) = e β X 1 + e β X   ,
P ( Y 0 ) = 1 e β X 1 + e β X = 1 1 + e β X   .
According to Greene [112], the probability model is a regression of the conditional expectation of Y on X giving:
E ( Y / X ) = 1 [ F ( β X ) ] + 0 [ 1 F β X ) = F ( β X ) .
Since the model is nonlinear, the parameters are not necessarily the marginal effects of the various independent variables. The relative effect of each of the independent variables on the probability of adoption is obtained by differentiating Equation (6) with respect to X i j resulting in Equation (7) [112]:
P i X i j = [ λ β X ( 1 λ β X ) 2 ] β = F ( β X ) [ 1 F ( β X ) ] β .
The maximum likelihood method was used to estimate the parameters.
Applying the logit model in this paper allows the researchers to see when the farmer would decide to adopt or not, especially when considering how different factors can create critical mass against resistance to change. The preference for the probability model (logit) to the conventional linear regression models is based on the fact that the parameter estimates from the former are asymptotically consistent and efficient. The estimation procedure employed resolves the problem of heteroskedasticity and constrains the conditional probability of making the decision to adopt technology to lie between zero (0) and one (1).
The Logit model is preferred over the probit model in this paper for its mathematical simplicity and ease of use [112], while also being common across similar studies [46,91,113].
The empirical model for the logit model estimation is specified as follows:
Z i = l o g P i 1 P i = α + β X i + ε i j
where, Xi is the combined effects of explanatory variables to decision making about adopting or not adopting modern agricultural production technologies and l o g P i 1 P i is the logarithm of the odds of farm households’ decision to adopt the modern agricultural technologies ( Y i = 1 )   versus not adopt ( Y i = 0 ) .

2.4. Variable Declaration

In the literature review, we briefly described the various factors associated with agriculture and other technology adoption. We also explained the choice of variables by researchers according to their investigation motivations. In our study, to fulfill the research objectives, the variables that were used in logistic regression are shown in Table 1.
In continuation with the idea that the variables could either have a positive or a negative influence on the final adoption behavior, we suggest that each geographical location would possess varying composites of variable influence. Therefore, we have listed our assumption on the direction of the relationship between our dependent and independent variables.

2.5. Data Analysis

The Chi-square test was used to check the relationship between independent and dependent variables, at 95% confidence level (p < 0.05) using software for statistics and data science (STATA) version 14.0. The test is 2-tailed (non-directional), and in each case, the null hypothesis (Ho) states that there is no relationship between variables being tested, while the alternate hypothesis (Ha) states that there is a relationship. If the observed p was less than 0.05, the Ho was rejected and Ha accepted, and vice versa. Phi and Cramer’s V were measured using SPSS (Version 21) software to find out the strength of relationships, while Pearson’s test and likelihood ratio were used to compare the p-value to the rejection level when basic Chi-square assumptions were violated [114]. Descriptive statistics and tables were used to present the distribution of results across variables. We conducted a logistic regression to show the factors most influencing the soil testing and fertilizer recommendation facilities in the survey areas. The variance-inflation factor (VIF) and tolerance were applied to test for multicollinearity among the independent variables using the “Collin” command in STATA software. Finally, the results of this analysis have been presented using frequency tables, cross-tabulations, and figures. STATA, SPSS, along with Microsoft Word and Excel (Version 2010) software were used for the data analyses.

3. Results and Discussion

3.1. Demographic and Socioeconomic Factors

Table 2 illustrates the demographic and socioeconomic profiles of the respondent farmers relative to soil testing and fertilizer recommendation facilities. In Table 2, out of 176 respondent farmers, fewer than one eighth were female (N = 21) and the rest were male (N = 155). When the gender of farmers was compared to adoption, males (N = 75) adopted more frequently than females (N = 13). On the other hand, among 88 non-adopters, females again were less represented (N = 8) against men (N = 80). However, proportionally, 62% of the females tended to adopt against 48.3% of the males. The results of the test showed statistical insignificance (p > 0.05) in the relationship between adoption and gender and the strength of the relationship was very weak (Cramer’s V = 0.088).
When age was compared with adoption, we found that there is a significant relationship between these two variables (p < 0.05) and the associations are moderately strong (Cramer’s V = 0.268), indicating age significantly influences the positive adoption of soil testing and fertilizer recommendation facilities. Our results show that around 74% of the young farmers (65) whose age is ≤40 years compared to 26.14% of the older farmers (23) whose age is ≥40 years have adopted the recommendations, indicating a positive uptake of new technology adoption by the younger generation than the older. However, non-adoption rates among older generation (46) farmers (52.27%) compared to those of young generation (42) farmers (47.73%) are higher in terms of technology adoption. This might be due to an absence of inheritance of knowledge and wisdom of improved soil management tools.
In terms of education, the result revealed that education has significantly influenced the positive adoption of soil testing and fertilizer recommendation facilities (p < 0.05) and the association between two variables is moderate (Cramer’s V = 0.216). The findings indicated that among 87 of the overall participating farmers who could read, write, and sign their name, 53 have adopted the soil testing and fertilizer recommendation facilities, whereas those who were illiterate accounted for 61.36% (54) of the ones that choose not to adopt.
In our study, we classified farming experience into two categories, according to the lengths of time of the farmers’ association with the agricultural work. The results depicted that the relatively fewer experienced farmers (farming experience between 1–25 years) accounted for 53.41% of those are more likely to adopt the soil testing and fertilizer recommendation facilities. However, out of 88 non-adopters, 75% fall into the farming experience range of 26–55 years. The Chi-square test result shows that the length of farming experience was statistically significant with regard to the adoption of soil testing and fertilizer recommendation facilities (p < 0.05), and the strength of association is moderately strong (Cramer’s V = 0.290).
The farm sizes were categorized into two groups according to their sizes: Small and big. The result showed that the farm size is statistically significantly associated with the adoption of soil testing and fertilizer recommendation facilities (p < 0.05), and the strength of association was moderate (Cramer’s V = 0.238). Small-scale (0.01 to 0.033 acre) farmers constituted the largest group (64.77%), followed by big-scale (0.034 to >1.00 acre) farmers, who accounted for 35.23%. Our findings indicated that out of 114 small-scale farmers, 76.14% (N = 67) adopted the soil testing and fertilizer recommendation facilities, while 53.41% (N = 47) did not. On the other hand, among the remaining 62 farmers who own big farming land, 23.86% (N = 21) of them have adopted these facilities and 46.59% (N = 41) did not.
Among the respondents, 138 farmers have full ownership rights to their land, whereas 38 farmers do not own any land. Approximately 16% (N = 14) of the farmers who did not have ownership of the land did adopt soil testing and fertilizer recommendation facilities, however; approximately 84% (N = 74) adopters have full ownership of their land. Among non-adopters, 27.27% (N = 24) did not own any land and 72.73% (N = 64) farmers owned their land. Furthermore, land ownership was statistically insignificant relating to soil testing and fertilizer recommendation facilities (p > 0.05), and the strength of association was moderate (Cramer’s V = 0.138).

3.2. Binary Logit Estimates

The factors influencing farm households’ adoption of soil testing and fertilizer recommendation facilities were analyzed using the binary logistic regression and the results are presented below (Table 3). As the coefficient result only expresses the direction of change and not the probability or magnitude of change, therefore, the marginal effects are also analyzed and included in the table.
The logistic model estimation in Table 3 indicating a pseudo is considered to be indicative of extremely good fits to model criteria, as it falls between the range of 0.2 and 0.4 [115]. The LR chi2 also reported that the logit model as a whole is statistically significant (p = 0.000), compared to an empty model.
Among the variables shown above (Table 3), farmer’s age was found to have a positive relationship with the probability of soil testing and fertilizer recommendation facilities. It was found to be significant at the 5% level. The estimated marginal effect of this variable indicates that the probability of adopting technology increases by 14.6% if a farmer is younger in age. The value of VIF is 1.17 (less than 10), showing that there is no serious collinearity. This finding is consistent with the literature that possibly younger farmers are considered more welcoming and fearless when it comes to experimenting with new things [116,117,118]. However, this result also leads to the importance of further study on factors affecting old farmers’ lower adoption rate in these regions. Furthermore, it indicates that more attention to the service providers is required in order to increase the older farmers’ response towards adoption.
The education level of the respondent farmers exhibits statistical significance (p < 0.05) and is positively related to the probability of adoption of soil testing and fertilizer recommendation facilities. On the other hand, farmers with a better education have a greater probability to accumulate and process information that would lead them to find suitable matching technologies that work alongside and enhance their farming expertise. Moreover, the estimated marginal effect of this variable indicated that the farmers’ probability of adopting soil testing and fertilizer facilities increases by 14.48% when there are single unit increases in literacy rates, ceteris paribus. Furthermore, the value of VIF for farmers’ education is 1.08, showing that there is no serious collinearity. The output is in line with the previous works which revealed that literate farmers appear to have higher tendencies to adopt new improved technologies compared to less educated farmers [70,89,119,120].
Gender was found to be insignificantly associated to adoption (p > 0.05). Morris and Doss [121] explain that if technology adoption decisions depend on access to land, labor, or other resources, and if in a particular situation, men may tend to have better access to these resources than women, then in that context, the technologies will not benefit men and women equally. However, in this study, we failed to find significance between the gender groups.
Farming experience, from our results, was found to be statistically significant (p < 0.01). Although higher farming experience is postulated to have a positive influence on technology adoption of soil testing and fertilizer recommendation facilities, our findings indicated that more experienced farmers are less likely to adopt these recommendations. When other things remained constant, one unit increase in farmers’ farming experience translated to the probability of adoption of soil testing and fertilizer recommendation facilities decreasing by 22.38%. Thus, we can interpret the result by saying that farmers with more years of experience in our study areas are more likely to stick with the original methods that are familiar to them rather than adopting newer farming techniques. The value of VIF (1.41) for farming experience is also less than 10, showing that there is no serious collinearity. However, in line with previous research, farmers with relatively lacking experience and hence lower opportunity costs of learning new technologies were, from our indications, expected to be more vigorous in trying out newer innovations compared to older and more experienced farmers [119,122,123].
Farm size was found to be a relevant factor encouraging the adoption of soil testing and fertilizer recommendation facilities. Although it was found to be significant (p < 0.01), it was negatively related to adoption and the VIF value 1.32, demonstrating no serious collinearity issue. The result indicated that farmers owning a big proportion of land are less likely to adopt soil testing and fertilizer recommendation facilities in our survey areas. Similar results were observed in other studies; for instance, Wisconsin and Bangladesh [124,125]. The results on marginal effects show that a unit increase in farm size will decrease the chance of adoption by approximately 30%. This result is meaningful in a sense, as it amalgamated with the fact that out of 570 million small farms in the world, 74% are located in Asia, and Bangladesh holds 15 million [126]. Other reports showed that small farms account for 96% of operational holdings, with a share of 69% of the cultivated area in Bangladesh [127]. Synthesizing insights from other existing literature coinciding with this finding indicated several reasons for negative adoption decisions, such as unsustainable management practices on bigger land, farmers’ unwillingness to alter their existing farming systems, and fear of risk [64,70,71,91,128,129]. Furthermore, findings also stated that although large farmers were the early adopters of modern varieties of the crop, small farmers adopted later and managed to catch up with them [130].
The adoption of soil testing and fertilizer recommendation facilities and farm income were significantly positively correlated (p < 0.05), suggesting that the increased income from the sales of crops and vegetables contributed to the greater likelihood of the STFRF adoption. The results on marginal effects expressed that higher farming income gave farmers a 20.66% higher chance of adopting soil testing and fertilizer recommendation facilities relative to low earners, ceteris paribus. The VIF value 1.41 is less than 10, validating no serious collinearity issue. This result matched with our assumption and other studies in such a way that higher income provides higher facilities incorporated with purchasing inputs essential for farming, thus increasing the chance of engaging in conservation agriculture [89,124,128,130,131,132].
The result of the logistic regression shows that secondary income and ownership rights on land were found to be insignificant (p > 0.05) and not correlated to STFRFs’ adoption. The VIF value for both cases is less than 10, validating no serious collinearity issue.
STFRF knowledge by farmers was found to be a significant determinant (p < 0.01) in our study areas as expected, and the VIF value 1.08 exhibited no serious collinearity problem. As the STFRT knowledge level of the respondents increased, their adoption decision of soil testing and fertilizer recommendation facilities also increased significantly. Our result confirmed Bairagi et al’s findings [133]. If other things remain constant, one unit increase in farmers’ STFRT knowledge leads to an increase of 19.79% in the probability of adoption of STFRF recommendations.
Fee opinion has been found to be significant (p < 0.01), but negatively related to adoption. Results on marginal effects show that a unit increase in fees will decrease the chance of adoption rate by 19.51%, ceteris paribus. The VIF value of 1.22 indicated there was no serious collinearity issue. Although the result of the analysis ties with our assumption, it is important to shed light on some facts that might help others to understand the situation better. Most of the STFRFs in Bangladesh are cheap (US $1.5 approximately/once), and since service providers recommended that farmers test their soil twice in a year, farmers’ concerns were aroused in regard to additional fees, which led to a general unwillingness to pay. This indicates the farmers’ credit constraint issues, a lack of understanding of the long-run benefit of these facilities [70], or the lack of effective publicity by government and service providers.

3.3. Source of the Information

We wanted to go into more depth about the respondents’ primary sources of farming information and knowledge, since various studies have testified that the knowledge source could influence the technology adoption process. The result (Table 4) reveals that among 176 respondents, around 42% (46 adopters and 28 non-adopters) farmers were able to acquire proper knowledge about the benefit of soil testing and fertilizer recommendation facilities from various sources. 39.2% recounted that they received their knowledge from service providers (N = 29), 22.9% from a nongovernmental organization (N = 17), 18.9% from agriculture officers (N = 14), 14.9% from friends (N = 11), and 4.1% via radio (N = 3).
Furthermore, out of a total of 88 adopters, the largest source of information seemed to come through friends and neighbors (N = 22), showing that a network of nearby adopters is more influential than a network of more distanced influencers [134]. Moreover, 18 adopter farmers were able to gather knowledge via radio announcements, indicating that the influence of participatory communication techniques (shares information in local languages and is understandable by both literate and illiterate farmers) [135]) on respondent farmers’ adoption process is about 20.45%.

3.4. The Sentiment of the Farmers Related to Adoption and Non-Adoption

We wanted to know what motivated farmers to adopt soil testing and fertilizer recommendation facilities and the answers of the respondents are presented in Table 5. Among 88 of the adopters, 35.22% only had the urge to achieve higher yields. However, 48.9% of the adopters informed us that apart from their desire for higher yields, they also wished to protect the environment, know the appropriate amount of fertilizer doses, and increase their soil quality. In addition, 6.8% of the adopters wanted to improve their crop quality, 3.4% wanted to know how to protect their crops, 3.4% wanted to identify what deficiency exists in their soil, and the rest (2.3%) wanted to know either about soil productivity or how to maintain their soil quality. As can be seen, 64.8% of the adopter farmers were not just focusing on the profitability, but were also concerned with issues of sustainable farming practice.
On the other hand, 31.8% of the non-adopters were happy with their existing cultivation methods and yields. Likewise, they neither felt it necessary to adopt, nor did they trust the effectiveness of these facilities. Furthermore, 25% of them believed that adopting these facilities would waste their money and 42.05% reported that they were not aware of these facilities, which can be considered as the reason behind the failure of the extension services’ ability at reaching out to a mass audience [136].

3.5. Service Quality Satisfaction Level of the Adopters and Non-Adopters

According to our survey result outlined in Table 6, 26.1% of adopters (N = 46) reported that they were satisfied with the providers’ service quality. However, 31 adopters criticized the service quality by saying that they either have failed to receive the materials on time, could not avail themselves of proper training, had irregular meetings with the service providers or thought the distance between their home and the service providers’ office was big.
Of the total respondents, 4 adopters and 10 non-adopters reported that the behavior of the service providers and extension workers was not up to the mark of the respondents’ expectation level, as they were unwilling to answer all the questions of the respondents and thus failed to establish a decent relationship with the farmers.
Around 15.9% of the total respondent farmers blamed service providers for not choosing the most effective advertising media that could easily reach them.
Out of 37 non-adopter farmers (who had no knowledge about these facilities), 16 farmers expressed their dissatisfaction by stating that none of the providers or extension workers came to visit them and the rest (21 farmers) reported they did not hear any types of advertisement. Some of the respondent farmers said that only influential farmers have contacts with extension workers and get benefits from them. Additionally, the other 41 non-adopters stated service providers or extension workers were unreliable. This indicated that the extension field staff did not perform their duties satisfactorily.

4. Conclusions and Recommendations

In this article, we have attempted to reveal those factors that are key to the adoption and/or non-adoption of soil testing and fertilizer recommendation facilities in two districts of Bangladesh. It was found that young farmers with less experience were more likely to adopt these facilities compared to older farmers. Although this result indicated a strong influence of the youth empowerment processes, it also creates an urge to discover how to engage older aged farmers with higher experience to adopt critical new farm practices. More literate farmers were also higher adopters of STFRF, which depicted a positive sign for the country’s overall education-led development. However, illiteracy is more prevalent in rural Bangladesh than anywhere else in the country. Therefore, it is also very important for service providers to find a way to make illiterate farmers understand the benefit of the inventions that will lead to a higher adoption rate, as well as focus on policies on raising literacy in the area. Although farming income and STFRT knowledge were positively associated with the adoption of these facilities, fee opinion was found to be negatively related, which seemed counterintuitive to the old adage, “you spend money to make money”.
Secondary income, land ownership, and gender did not correlate with the adoption of STFRF. Out of 176 respondents, 59% did not have a secondary income source and they relied exclusively on direct farm earnings. The majority of the farmers’ secondary income sources in our study areas were from the operation of small teashops, dispensaries, grocery stores, and businesses, where debt culture is commonly practiced. Most of the transactions were credit transactions and, usually, the shop owners needed to wait for a long time to get their money back, which negatively affected their ability to save. Finally, it is assumed that unwillingness in short-term investment and spending more time on off-farm activities might have reduced on-farm workforce availability, which inversely influenced the adoption of these facilities [56,89,137]. With respect to gender, land ownership, and adoption, Bangladeshi agriculture is mainly male-dominated and gender division is strictly demarcated with women. Most of the women are not allowed to undertake the field-oriented agricultural work [138] and are disadvantaged relative to men with respect to input in production, ownership, and property rights of assets such as land, livestock, agricultural machinery, credits, and human capital [139,140,141,142].
Most of the adopters received information about soil testing and fertilizer recommendation facilities through service providers, and friends or neighbors. However, information spread to the non-adopter farmers were either via radio or by service providers. Although 26.1% of the respondents (only 46 adopters of these facilities) expressed full satisfaction about the quality of the service they received from the providers, the majority of the respondents (73.9%) included adopters and non-adopters who gave various reasons that reflected their dissatisfaction level.
To tackle these challenges, it is important to promote sustainable agriculture practice and culture, to include: Improving the livelihoods and capacities of small-scale farmers, allowing equal access to land, new technology adoption, and access to markets. This also requires international cooperation to ensure investment in infrastructure and technology facilities to improve agricultural productivity [143].
The improvement of the agriculture sector and the acceleration of its growth is a national priority for ensuring food security and reducing rural poverty in Bangladesh. Although the increased use of fertilizers has led to increased production, the growth in yield of major crops in recent years has been affected by many soil-related constraints, such as depletion of soil organic matter, imbalanced use of fertilizers, nutrient mining, degradation of the physical and chemical properties of soil, scantily using bio and organic fertilizers, and poor management practices [144]. In particular, the proportion of different nutrients used in agriculture without soil testing in recent years is highly deleterious to soil productivity.
As stated earlier, the adoption rate of these facilities among farmers is low; hence, by understanding what influences or obstructs the diffusion and adoption of these facilities, it is possible for scientists, private businesses, and the government to play an essential role in planning and executing technology-related programs in terms of meeting the challenges of food production and to ensure sustainability in the agriculture sector in Bangladesh. Likewise, to enhance the adoption rate of these facilities in the Bangladeshi agricultural sector, we continue with additional society-influencing propositions.
Firstly, as gender inequality is quite noticeable in the Bangladeshi agriculture sector, with women’s participation noticeably lower than men’s, the task of government and nongovernment organizations along with service providers is to encourage and motivate women-led households to engage in agricultural activities, but also try to convince male-headed households to allow them. If the participation rate inclines, it is expected to have a higher adoption rate.
Secondly, facilitating technological adoption via information and communication technology (ICT) based extension programs—for instance, mobile phones—can be used as a means of making improvements. It can facilitate in spreading news of these technologies whilst collecting both farmer- and agent-level data, while in the same breadth agents’ visits can be verified, thus improving the accountability of extension services [145,146].
Thirdly, the results of the analysis indicate that young people are more likely to innovate than the elderly. It would be beneficiary to invent a system that improves the knowledge of those who are wary of new innovations.
Fourth, organizational readiness can enhance the successful diffusion and adoption process of soil testing and fertilizer recommendation facilities among farmers. Due to respondent farmers’ criticisms of the service quality of the providers, the strengthening of the staff’s skill and knowledge, availability of the resource, innovation-supportive values and goals, innovation-system fit, and eagerness for change can increase the adoption process. Pilot programs need to be assessed using rigorous impact evaluations, which not only assess the causal impact, but also its mechanisms; determine whether such approaches are complements or substitutes for traditional extension; identify the types of information which are best suited for these programs; calculate the demand for such services and, hence, their potential sustainability; and calculate their cost-effectiveness [145]. Although it is always assumed that the market mechanism can influence the adoption and scaling up of a technology, in many cases, initial support in the form of subsidies and technical support can facilitate the scaling up process of a useful technology. Programs that would improve contact with extension agents and regular advertisement through print, broadcast, and outdoor mediums promoting the benefit of soil testing and fertilizer recommendation facilities are expected to have a positive effect on adoption.
Fifthly, while making agricultural/land management policies, attention should always be given not only to the maximization of agricultural production, but also to the environmental resource overexploitation [147]. We suggest that in order to ensure sustainability in the agricultural sector, it is important for policymakers to include green components in the national policy. We emphasize governments should better regulate barriers to entry through review and thorough documentation of these new technologies. The output of such review and documentation should take into consideration the literacy, age and experience, history with emerging technologies, gender, and economic bracket of the end user before being disseminated. Though this extra step may increase the wait time for the introduction of new technology, it may go some way towards building trust in new methods and technologies as endorsed by the government, as well as increase sustainable practices.
Finally, it is important to consider the role of risks. For instance, while considering promoting the use of soil testing and fertilizer recommendation facilities, policies must be put in place to hedge against the potential production risk associated with the introduction of the technology. Without an insurance market, this is perhaps possible through the introduction of safety nets to cover against such a downside risk.
Note that this study is based on information collected from 176 sampled farmers (not including service providers) in Bangladesh, only from two districts, and only attempted to examine the factors associated with the adoption of STFRF rather than focusing on post-adoption benefits enjoyed by the farmers. Considering these factors as limitations of the present study, future research endeavors should expand the soil testing and fertilizer recommendation facilities demonstration program to all potential areas of Bangladesh.

Author Contributions

F.-A.-S. developed the concept and framework, carried out the data collection procedure, and drafted the manuscript. T.K. modified the concept and drafted the manuscript for the final submission. H.Z. supervised and verified the scholastic depth of the manuscript. All authors contributed to the discussion and final outcome of the manuscript.

Funding

This research received no external funding.

Acknowledgments

Firstly, we wish to thank all the respondent farmers for their valuable time and for sharing their experiences. Secondly, we wish to thank Mamun Pradhan for helping us in the process of collecting the data and Nahid Ferdous for the preliminary syntax proofreading. Finally, we would like to extend our sincere gratitude to all the editors including Ms. Edith Li (assistant editor) and the reviewers for their precious time and invaluable comments. Your careful, thorough reading of this manuscript, thoughtful comments, and constructive suggestions helped us to improve the quality of this manuscript.

Conflicts of Interest

The authors declare no conflict of interest.

References

  1. Food and Agriculture Organization (FAO). The State of Food and Agriculture. World and Regional Reviews. Sustainable Development and Natural Resource Management; FAO Agriculture Series, No. 2; FAO: Rome, Italy, 1989; p. 172. [Google Scholar]
  2. Mottaleb, K.A. Perception and Adoption of a New Agricultural Technology: Evidence from a Developing Country. Technol. Soc. 2018, 55, 126–135. [Google Scholar] [CrossRef]
  3. World Bank. World Development Indicators: Structure of Output. Available online: http://wdi.worldbank.org/table/4.2 (accessed on 10 April 2017).
  4. The World Bank. Employment in Agriculture (% of Total Employment) (Modeled ILO Estimate). Available online: https://data.worldbank.org/indicator/SL.AGR.EMPL.ZS?locations=BD (accessed on 26 January 2018).
  5. Bangladesh Bank. Bangladesh Bank Annual Report 2016–2017. Available online: https://www.bb.org.bd/pub/annual/anreport/ar1617/index1617.php (accessed on 20 January 2018).
  6. Reaz, A.; Rejaul, K.B. Poverty Reduction Rate Slows Down. Front Page Article. The Daily Star, 18 October 2017; 1. [Google Scholar]
  7. CIA. The World Fact Book. Available online: https://www.cia.gov/library/publications/the-world-factbook/geos/bg.html (accessed on 15 September 2017).
  8. Misha, F.; Sulaiman, M. Bangladesh Priorities: Poverty, Sulaiman and Misha; Bangladesh Priorities, Copenhagen Consensus Center; Project Report; Copenhagen Consensus Center: Tewksbury, MA, USA, 2016. [Google Scholar]
  9. The World Bank. Prevalence of Undernourishment (% of Population). Available online: https://data.worldbank.org/indicator/SN.ITK.DEFC.ZS?locations=BD (accessed on 20 January 2017).
  10. WFP. Bangladesh. Available online: http://www1.wfp.org/countries/bangladesh (accessed on 8 January 2017).
  11. United States Agency for International Development (USAID). Bangladesh: Nutrition Profile; United States Agency for International Development (USAID): Washington, DC, USA, 2018.
  12. Hasan, Md. N.; Hossain, M.S.; Islam, Md. R.; Bari, Md. A.; Karim, D.; Rahman, M.Z. Trend in the Availability of Agricultural Land in Bangladesh; Soil Resource Development Institute (SRDI): Dhaka, Bangladesh, 2013; p. 71.
  13. Rahman, J. Preserving Farmlands: No Action Yet. The Financial Express, 17 February 2017; 1. [Google Scholar]
  14. Magnani, R.; Oot, L.; Sethuraman, K.; Kabir, G.; Rahman, S. USAID Office of Food for Peace Food Security Country Framework for Bangladesh FY 2015–2019; FHI360/FANTA; United States Agency for International Development (USAID): Washington, DC, USA, 2015.
  15. Ali, H. Fundamentals of Irrigation and On-Farm Water Management, 1st ed.; Springer: New York, NY, USA, 2010; Volume 1. [Google Scholar]
  16. Kashem, M.A.; Faroque, M.A.A. A country scenarioes of food security and governance in Bangladesh. J. Sci. Found. 2011, 9, 41–50. [Google Scholar] [CrossRef]
  17. Jaim, W.M.H.; Shaheen, A. Seed, Fertilizer and Innovation in Bangladesh: Industry and Policy Issue for the Future; International Food Policy Research Institute (IFPRI): Washington, DC, USA, 2012. [Google Scholar]
  18. Gurstein, M. A Decision Support System to Assist the Rural Poor in Bangladesh. IEEE Technol. Soc. Mag. 2013, 32, 11–20. [Google Scholar] [CrossRef]
  19. Jolliffe, D.; Sharif, I.; Gimenez, L.; Ahmed, F. Bangladesh—Poverty Assessment: Assessing a Decade of Progress in Reducing Poverty, 2000–2010; The World Bank: Washington, DC, USA, 2013. [Google Scholar]
  20. Sylvia, S. Is Bangladesh Likely to Achieve Its 2021 Universal Food Security Target? In End Poverty in South Asia; World Bank Blogs: Washington, DC, USA, 2014. [Google Scholar]
  21. The Daily Star. Balanced Fertiliser Usage. The Daily Star, 25 September 2016; 1.
  22. Rahman, M.Z.; Yamao, M.; Alam, M. Barriers Faced by Small Farmers in Adopting the Integrated Plant Nutrient System for Sustainable Farming Development. Sabaragamuwa Univ. J. 2010, 7, 3–21. [Google Scholar] [CrossRef]
  23. Rahman, K.M.A.; Zhang, D. Effects of Fertilizer Broadcasting on the Excessive Use of Inorganic Fertilizers and Environmental Sustainability. Sustainability 2018, 10, 759. [Google Scholar] [CrossRef]
  24. Mondal, M.H. Crop Agriculture of Bangladesh: Challenges and Opportunities. Bangladesh J. Agric. Res. 2010, 35, 235–245. [Google Scholar] [CrossRef]
  25. Sultana, J.; Siddique, M.N.A.; Abdullah, M.R. Fertilizer Recommendation for Agriculture: Practice, Practicalities and Adaptation in Bangladesh and Netherlands. J. BiNet 2015, 1, 20–40. [Google Scholar] [CrossRef]
  26. Huq, S.M.I.; Hasan, M.N. Sustainable Management and Protection of Soil Resources; Food and Agriculture Organization (FAO): Rome, Italy, 2015. [Google Scholar]
  27. Sharif Uddin, A.B.M.; Rahman, M.M.; Alam, M.B.; Kamaly, M.H.K. Factors contribution to the adoption of production technologies by potato growers in northwest bangladesh. J. Agribus. Rural Dev. 2014, 3, 283–297. [Google Scholar]
  28. Saleque, M.A.; Rashid, H.A.; Paul, V.M.; Bentley, J.W. Village Soil Fertility Maps. In Innovations in Rural Extension: Case Studies from Bangladesh; Van Mele, P., Salahuddin, A., Magor, N.P., Eds.; CAB International Publishing (CABI): Oxfordshire, UK, 2005. [Google Scholar]
  29. Islam, M. Practice does not Make Perfect: Understanding Fertilizer Mismanagement in Bangladesh through Leaf Color Charts; Preliminary Draft; Harvard University: Harward, MA, USA, 2014. [Google Scholar]
  30. Saiful about Services from SRDI—Soil Resource Devlopment Institute, Bangladesh. Available online: https://agricultureandfarming.wordpress.com/2013/03/16/about-services-from-srdi-soil-resource-devlopment-institute-bangladesh/ (accessed on 26 October 2018).
  31. Nisha Desai. How Intel Apps Are Helping Small Farmers Boost Crops—And Incomes; CSR@Intel: Santa Clara, CA, USA, 2014. [Google Scholar]
  32. Cook, S.; Henderson, C.; Kharel, M.; Begum, A.; Rob, A.; Piya, S. Collaborative Action on Soil Fertility in South Asia: Experiences from Bangladesh and Nepal; IIED: London, UK, 2016. [Google Scholar]
  33. Xu, X.; He, P.; Yang, F.; Ma, J.; Pampolino, M.F.; Johnston, A.M.; Zhou, W. Methodology of Fertilizer Recommendation Based on Yield Response and Agronomic Efficiency for Rice in China. Field Crops Res. 2017, 206, 33–42. [Google Scholar] [CrossRef]
  34. Ludena, C.E. Agricultural Productivity Growth, Efficiency Change and Technical Progress in Latin America and the Caribbean; IDB Working Paper Series; IDB WORKING PAPER IDB-WP-186; Inter-American Development Bank (IDB): Washington, DC, USA, 2012; p. 35. [Google Scholar]
  35. Narmilan, A. E-Agricultural Concepts for Improving Productivity: A Review. Sch. J. Eng. Technol. 2017, 5, 11–17. [Google Scholar]
  36. He, P.; Xu, X.; Chuan, L.; Johnston, A. Evaluation of a New Fertilizer Recommendation Approach to Improve Nitrogen Use Efficiency across Small-Holder Farms in China. In Proceedings of the 2016 International Nitrogen Initiative Conference, Melbourne, Australia, 4–8 December 2006. [Google Scholar]
  37. Liu, C.; Liu, Y.; Li, Z.; Zhang, G.; Chen, F. A Novel Way to Establish Fertilization Recommendations Based on Agronomic Efficiency and a Sustainable Yield Index for Rice Crops. Sci. Rep. 2017, 24, 1001. [Google Scholar] [CrossRef] [PubMed]
  38. Mendola, M. Agricultural Technology Adoption and Poverty Reduction: A Propensity-Score Matching Analysis for Rural Bangladesh. Food Policy 2007, 32, 372–393. [Google Scholar] [CrossRef]
  39. Attanandana, T.; Verapattananirund, P.; Yost, R. Refining and Disseminating Site-Specific Nutrient Management Technology in Thailand. Agron. Sustain. Dev. 2008, 28, 291–297. [Google Scholar] [CrossRef]
  40. Zeng, D.; Alwang, J.; Norton, G.; Shiferaw, B.; Jaleta, M.; Yirga, C. Agricultural Technology Adoption and Child Nutrition: Improved Maize Varieties in Rural Ethiopia. Presented at the Agricultural and Applied Economics Association’s 2014 Agricultural and Applied Economics Association (AAEA) Annual Meeting, Minneapolis, MN, USA, 27 July 2014. [Google Scholar]
  41. Nick, M.; Jason, C.; Rajinder, P.S. The Implications of Policy Settings on Land Use and Agricultural Technology Adoption in North-West India. In Proceedings of the 55th Annual AARES National Conference, Melbourne, Victoria, 8–10 February 2011. [Google Scholar]
  42. Taylor, S.; Todd, P.A. Understanding Information Technology Usage: A Test of Competing Models. Inf. Syst. Res. 1995, 6, 144–176. [Google Scholar] [CrossRef]
  43. Andrew, D.F.; Mark, R.R. Microeconomics of Technology Adoption. Annu. Rev. Econ. 2010, 2, 395–424. [Google Scholar] [Green Version]
  44. Daniel, H.S.; Marvin, B.L. Internal and External Influences on Adoption Decisions in Multi-Unit Firms: The Moderating Effect of Experience. Strateg. Organ. 2010, 8, 132–154. [Google Scholar]
  45. Davies, S.W. Inter-Firm Diffusion of Process Innovations. Eur. Econ. Rev. 1979, 12, 299–317. [Google Scholar] [CrossRef]
  46. Rogers, E.M. Diffusion of Innovations, 4th ed.; Thee Free Press, A Division of Simon & Schuster Inc.: New York, NY, USA, 1995. [Google Scholar]
  47. Goodhue, D.L.; Thompson, R.L. Task-Technology Fit and Individual Performance. MIS Q. 1995, 19, 213–236. [Google Scholar] [CrossRef]
  48. Fishbein, M.; Ajzen, I. Belief, Attitude, Intention, and Behavior: An Introduction to Theory and Research; Addison-Wesley: Reading, MA, USA, 1975. [Google Scholar]
  49. Davis, F.D.; Bagozzi, R.P.; Warshaw, P.R. User Acceptance of Computer Technology: A Comparison of Two Theoretical Models. Manag. Sci. 1989, 35, 982–1003. [Google Scholar] [CrossRef]
  50. Davis, F.D.; Venkatesh, V. A Critical Assessment of Potential Measurement Biases in the Technology Acceptance Model: Three Experiments. Int. J. Hum. Comput. Stud. 1996, 45, 19–45. [Google Scholar] [CrossRef]
  51. Venkatesh, V.; Davis, F.D. A Model of the Antecedents of Perceived Ease of Use: Development and Test. Decision Sciences. Decis. Sci. 1996, 27, 451–481. [Google Scholar] [CrossRef]
  52. Venkatesh, V.; Davis, F.D. A Theoretical Extension of the Technology Acceptance Model: Four Longitudinal Field Studies. Manag. Sci. 2000, 46, 186–204. [Google Scholar] [CrossRef]
  53. Venkatesh, V. Determinants of Perceived Ease of Use: Integrating Control, Intrinsic Motivation, and Emotion into the Technology Acceptance Model. Inf. Syst. Res. 2000, 11, 342–365. [Google Scholar] [CrossRef]
  54. Venkatesh, V.; Bala, H. Technology Acceptance Model 3 and a Research Agenda on Interventions. Decis. Sci. 2008, 39, 273–312. [Google Scholar] [CrossRef]
  55. Venkatesh, V.; Morris, M.G.; Davis, F.D.; Davis, G.B. User Acceptance of Information Technology: Toward a Unified View. MIS Q. 2003, 27, 425–478. [Google Scholar] [CrossRef]
  56. Akudugu, M.A.; Guo, E.; Dadzie, S.K. Adoption of Modern Agricultural Production Technologies by Farm Households in Ghana: What Factors Influence Their Decisions? J. Biol. Agric. Healthc. 2012, 2, 2224–3208. [Google Scholar]
  57. Uaiene, R.N.; Arndt, C.; Masters, W.A. Determinants of Agricultural Technology Adoption in Mozambique. Discuss. Pap. 2009, 67. [Google Scholar]
  58. Herdt, R.W.; Capule, C. Adoption, Spread, and Production Impact of Modern Rice Varieties in Asia; International Rice Research Institute: Manila, Philippines, 1983. [Google Scholar]
  59. Alauddin, M.; Tisdell, C. Patterns and Determinants of Adoption of High Yielding Varieties: Farm-Level Evidence from Bangladesh. Pak. Dev. Rev. 1988, 27, 183–210. [Google Scholar] [CrossRef]
  60. Schultz, T.W. Transforming Traditional Agriculture—Studies in Comparative Economics; Yale University Press: New Haven, CO, USA, 1964. [Google Scholar]
  61. Huffman, W.E. Allocative Efficiency: The Role of Human Capital. Q. J. Econ. 1977, 91, 59–79. [Google Scholar] [CrossRef]
  62. Ong, C.S.; Lai, J.Y. Gender Differences in Perceptions and Relationships among Dominants of E-Learning Acceptance. Comput. Hum. Behav. 2006, 22, 816–829. [Google Scholar] [CrossRef]
  63. Atibioke, O.A.; Ogunlade, I.; Abiodun, A.A.; Ogundele, B.A.; Omodara, M.A.; Ade, A.R. Effects of Farmers’ Demographic Factors on the Adoption of Grain Storage Technologies Developed by Nigerian Stored Products Research Institute (NSPRI): A Case Study of Selected Villages in Ilorin West LGA of Kwara State. Res. Humanit. Soc. Sci. 2012, 2, 56–63. [Google Scholar]
  64. Uddin, M.N.; Bokelmann, W.; Entsminger, J.S. Factors Affecting Farmers’ Adaptation Strategies to Environmental Degradation and Climate Change Effects: A Farm Level Study in Bangladesh. Climate 2014, 2, 223–241. [Google Scholar] [CrossRef] [Green Version]
  65. Ainembabazi, J.H.; Mugisha, J. The Role of Farming Experience on the Adoption of Agricultural Technologies: Evidence from Smallholder Farmers in Uganda. J. Dev. Stud. 2014, 50, 666–679. [Google Scholar] [CrossRef]
  66. Foster, A.; Rosenzweig, M. Learning by Doing and Learning from Others: Human Capital and Farm Household Change in Agriculture. J. Polit. Econ. 1995, 103, 1176–1209. [Google Scholar] [CrossRef]
  67. Bhuiyan, M.S.R. Influence of Tenurial Status of Land on the Adoption of Improved Production technology in an area of bangladesh. Bangladesh J. Agric. Econ. 1987, 10, 89–99. [Google Scholar]
  68. Sanzidur, R. Impact of Technological Change on Income Distribution and Poverty in Bangladesh Agriculture: An Empirical Analysis. J. Int. Dev. 1999, 11, 935–955. [Google Scholar]
  69. Ghadim, A.K.A.; Pannell, D.J. A Conceptual Framework of Adoption of an Agricultural Innovation. Agric. Econ. 1999, 21, 145–154. [Google Scholar] [CrossRef]
  70. Ntshangase, N.L.; Muroyiwa, B.; Sibanda, M. Farmers’ Perceptions and Factors Influencing the Adoption of No-Till Conservation Agriculture by Small-Scale Farmers in Zashuke,
KwaZulu-Natal Province. Sustainability 2018, 10, 555. [Google Scholar] [CrossRef]
  71. Yaron, D.; Voet, H.; Dinar, A. Innovations on Family Farms: The Nazareth Region in Israel. Am. J. Agric. Econ. 1992, 74, 361–370. [Google Scholar] [CrossRef]
  72. Samiee, A.; Rezvanfar, A.; Faham, E. Factors Influencing the Adoption of Integrated Pest Management (IPM) by Wheat Growers in Varamin County, Iran. Afr. J. Agric. Res. 2009, 4, 491–497. [Google Scholar]
  73. Caswell, M.; Fuglie, K.; Ingram, C.; Jans, S.; Kascak, C. Adoption of Agricultural Production Practices: Lessons Learned from the US Department of Agriculture Area Studies Project; Agriculture Economic Report AER-792; US Department of Agriculture, Resource Economics Division, Economic Research Service: Washington, DC, USA, 2001; p. 116.
  74. Chaudhri, D.P. Education, Innovations and Agricultural Development: A Study of North India (1961–1972); Croom Helm Ltd.: London, UK, 1979. [Google Scholar]
  75. Uttam, K.D.; Mahabub, H. Effect of Education on Technology Adoption and Aggregate Crop Output in Bangladesh. Bangladesh J. Agric. Econ. 1996, XIX, 1–15. [Google Scholar]
  76. Strauss, J.; Barbosa, M.; Teixeira, S.; Thomas, D.; Junior, R.G. Role of Education and Extension in the Adoption of Technology: A Study of Upland Rice and Soybean Farmers in Central-West Brazil. Agric. Econ. 1991, 5, 341–359. [Google Scholar] [CrossRef]
  77. Adetola, I.A. Factors Influencing Irrigation Technology Adoption and Its Impact on Household Poverty in Ghana. J. Agric. Rural Dev. Trop. Subtrop. 2009, 109, 51–63. [Google Scholar]
  78. Uematsu, H.; Mishra, A.K. Can Education Be a Barrier to Technology Adoption? Presented at the AAEA, CAES, & WAEA Joint Annual Meeting of Agricultural & Applied Economics Association 2010, Denver, CO, USA, 25–27 July 2010. [Google Scholar]
  79. Chuchird, R.; Sasaki, N.; Abe, I. Influencing Factors of the Adoption of Agricultural Irrigation Technologies and the Economic Returns: A Case Study in Chaiyaphum Province, Thailand. Sustainability 2017, 9, 1524. [Google Scholar] [CrossRef]
  80. Nigussie, Z.; Tsunekawab, A.; Haregeweyn, N.; Adgo, E.; Nohmi, M.; Tsubo, M.; AKlog, D.; Meshesha, T.D.; Abele, S. Factors Influencing Small-Scale Farmers’ Adoption of Sustainable Land Management Technologies in North-Western Ethiopia. Land Use Policy 2017, 67, 57–64. [Google Scholar] [CrossRef]
  81. Farid, K.S.; Tanny, N.Z.; Sarma, P.K. Factors Affecting Adoption of Improved Farm Practices by the Farmers of Northern Bangladesh. J. Bangladesh Agric. Univ. 2015, 13, 291–298. [Google Scholar] [CrossRef]
  82. Mignouna, D.B.; Manyong, V.M.; Mutabazi, K.D.S.; Senkondo, E.M. Determinants of Adopting Imazapyr-Resistant Maize Technologies and Its Impact on Household Income in Western Kenya. J. Dev. Agric. Econ. 2011, 3, 572–580. [Google Scholar]
  83. Caffey, R.H.; Kazmierczak, R.F., Jr. Factors Influencing Technology Adoption in a Louisiana Aquiculture System. J. Agric. Appl. Econ. 1994, 26, 264–274. [Google Scholar] [CrossRef]
  84. Islam, M.S.; Grönlund, Å. Bangladesh Calling: Farmers’ Technology Use Practices as a Driver for Development. Inf. Technol. Dev. 2011, 17, 95–111. [Google Scholar] [CrossRef]
  85. McCardle, K.F. Information Acquisition and the Adoption of New Technology. Manag. Sci. Inf. 1985, 3, 1372–1389. [Google Scholar] [CrossRef]
  86. Feder, G.; Slade, R. The Acquisition of Information and the Adoption of New Technology. Am. J. Agric. Econ. 1984, 66, 312–320. [Google Scholar] [CrossRef]
  87. Bonabana-Wabbi, J. Assessing Factors Affecting Adoption of Agricultural Technologies: The Case of Integrated Pest Management (IPM) in Kumi District, Eastern Uganda. Master’s Thesis, Virginia Polytechnic Institute and State University, Blacksburg, VA, USA, 2002. [Google Scholar]
  88. Shadi-Talab, J. Factors Affecting Farmers’ Adoption of Agricultural Technology in Less Developed Countries: Iran. Ph.D. Thesis, Iowa State University, Ames, IA, USA, 1977. [Google Scholar]
  89. Uddin, M.T.; Dhar, A.R.; Islam, M.M. Adoption of Conservation Agriculture Practice in Bangladesh: Impact on Crop Profitability and Productivity. J. Bangladesh Agric. Univ. 2016, 14, 101–112. [Google Scholar] [CrossRef]
  90. Genius, M.; Koundouri, P.; Nauges, C.; Tzouvelekas, V. Information Transmission in Irrigation Technology Adoption and Diffusion: Social Learning, Extension Services, and Spatial Effects. Am. J. Agric. Econ. 2013, 96, 328–344. [Google Scholar] [CrossRef] [Green Version]
  91. Feder, G.; Just, E.R.; Zilberman, D. Adoption of Agricultural Innovations in Developing Countries: A. Survey. Econ. Dev. Cult. Chang. 1985, 33, 255–298. [Google Scholar] [CrossRef]
  92. Simtowe, F.; Zeller, M. The Impact of Access to Credit on the Adoption of Hybrid Maize in Malawi: An Empirical Test of an Agricultural Household Model under Credit Market Failure; MRPA: Hattiesburg, MS, USA, 2006. [Google Scholar]
  93. Mottaleb, K.A.; Krupnik, T.J.; Erenstein, O. Factors Associated with Small-Scale Agricultural Machinery Adoption in Bangladesh: Census Findings. J. Rural Stud. 2016, 46, 155–168. [Google Scholar] [CrossRef] [PubMed]
  94. Karidjo, B.Y.; Wang, Z.; Boubacar, Y.; Wei, C. Factors Influencing Farmers’ Adoption of Soil and Water Control Technology (SWCT) in Keita Valley, a Semi-Arid Area of Niger. Sustainability 2018, 10, 288. [Google Scholar] [CrossRef]
  95. Mariano, M.J.; Villano, R.; Fleming, E. Factors Influencing Farmers’ Adoption of Modern Rice Technologies and Good Management Practices in the Philippines. Agric. Syst. 2012, 110, 41–53. [Google Scholar] [CrossRef]
  96. Hailu, B.K.; Abrha, B.K.; Weldegiorgis, K.A. Adoption and impact of agricultural technologies on farm income: evidence from southern tigray, northern ethiopia. Int. J. Food Agric. Econ. 2014, 2, 91–106. [Google Scholar]
  97. Diiro, G. Impact of Off-Farm Income on Technology Adoption Intensity and Productivity: Evidence from Rural Maize Farmers in Uganda; International Food Policy Research Institute (IFPRI): Washington, DC, USA, 2012. [Google Scholar]
  98. Tessema, Y.M.; Asafu-Adjaye, J.; Kassie, M.; Mallawaarachchi, T. Do Neighbours Matter in Technology Adoption? The Case of Conservation Tillage in Northwest Ethiopia. Afr. J. Agric. Resour. Econ. 2016, 11, 211–225. [Google Scholar]
  99. Makokha, G.S.; Odera, H.; Iruria, D.M.; Maritim, H.K.; Okalebo, J.R. Farmers’ Perception and Adoption of Soil Management Technologies in Western Kenya. Afr. Crop Sci. J. 1999, 7, 549–558. [Google Scholar] [CrossRef]
  100. De Janvry, A.; Macours, K.; Sadoulet, E. Learning for Adopting: Technology Adoption in Developing Country Agriculture; De Janvry, A., Macours, K., Sadoulet, E., Eds.; Fondation Pour les études et Recherches sur le Développement International (Ferdi): Clermont-Ferrand, France, 2017. [Google Scholar]
  101. Wu, J.; Qi, D. Moderating Effect of Personal Innovativeness in the Model for E.-Store Loyalty; IEEE: Guangzhou, China, 2010. [Google Scholar]
  102. Leathers, H.D.; Smale, M. A Bayesian Approach to Explaining Sequential Adoption of Components of a Technological Package. Am. J. Agric. Econ. 1991, 73, 734–742. [Google Scholar] [CrossRef]
  103. Rooy, C.D.; Wang, S. A Case for Geographic Targeting of Basic Social Services to Mitigate Inequalities in Bangladesh; The United Nations International Children’s Emergency Fund (UNICEF): Dhaka, Bangladesh, August 2010. [Google Scholar]
  104. Khondker, B.H.; Mahzab, M.M. Lagging Districts Development (Background Study Paper for Preparation of the Seventh Five-Year Plan); Background paper for the 7th Five Year Plan of the Government of Bangladesh; Bangladesh Planning Commission, Government of the People’s Republic of Bangladesh: Dhaka, Bangladesh, 2015; pp. 1–61.
  105. BARI. BARI Annual Report 2015–2016; Bangladesh Agricultural Research Institute (BARI): Rajshahi, Bangladesh, 2016.
  106. Banglapedia. Crop. Available online: http://en.banglapedia.org/index.php?title=Crop (accessed on 1 December 2016).
  107. Asfaw, S.; Shiferaw, B.; Simtowe, F.; Lipper, L. Impact of Modern Agricultural Technologies on Smallholder Welfare: Evidence from Tanzania and Ethiopia. Food Policy 2012, 37, 283–295. [Google Scholar] [CrossRef]
  108. Griliches, Z. Hybrid Corn: An Exploration in the Economics of Technological Change. Econometrica 1957, 25, 501–522. [Google Scholar] [CrossRef]
  109. Pindyck, R.S.; Rubinfeld, D.L. Econometric Models and Economic Forecasts, 4th ed.; McGraw-Hill/Irwin: New York, NY, USA, 1997. [Google Scholar]
  110. Hill, L.; Kau, P. A Threshold Model of Purchasing Decisions. J. Mark. Res. 1972, 9, 264–270. [Google Scholar]
  111. Hill, L.; Kau, P. Application of Multivariate Probit to a Threshold Model of Grain Dryer Purchasing Decisions. Am. J. Agric. Econ. 1973, 55, 19–27. [Google Scholar] [CrossRef]
  112. Greene, W.H. Econometric Analysis, 6th ed.; Prentice Hall: Upper Saddle River, NJ, USA, 2007. [Google Scholar]
  113. Green, D.A.G.; Ng’ong‘ola, D.H. Factors affecting fertilizer adoption in less developed countries: an application of multivariate logistic analysis in Malaŵi. J. Agric. Econ. 1993, 44, 99–109. [Google Scholar] [CrossRef]
  114. Andy, F. Discovering Statistics Using SPSS: And Sex and Drugs and Rock “n” Roll, 4th ed.; Sage: London, UK, 2013. [Google Scholar]
  115. McFadden, D. Quantitative Methods for Analyzing Travel Behavior of Individuals: Some Recent Developments. In Behavioural Travel Modelling; Hensher, D.A., Stopher, P.R., Eds.; Croom Helm: London, UK, 1979. [Google Scholar]
  116. Lambrecht, I.; Vanlauwe, B.; Merckx, R.; Maertens, M. Understanding the Process of Agricultural Technology Adoption: Mineral Fertilizer in Eastern DR Congo. World Dev. 2014, 59, 132–146. [Google Scholar] [CrossRef]
  117. Lencsés, E.; Takács, I.; Takács-György, K. Farmers’ Perception of Precision Farming Technology among Hungarian Farmers. Sustainability 2014, 6, 8452–8465. [Google Scholar] [CrossRef] [Green Version]
  118. Ghimire, R.; Huang, W.C. Adoption Pattern and Welfare Impact of Agricultural Technology: Empirical Evidence from Rice Farmers in Nepal. J. South Asian Dev. 2016, 11, 113–137. [Google Scholar] [CrossRef]
  119. Chi, T.T.N.; Yamada, R. Factors Affecting Farmers’ Adoption of Technologies in Farming System: A Case Study in OMon District, Can Tho Province, Mekong Delta. Omonrice 2002, 10, 94–100. [Google Scholar]
  120. Hagos, B.G.; Hadush, M. Does Improved Wheat Seed Adoption Benefit Farmers? Empirical Evidence from Southern Tigrai Ethiopia. J. Agric. Crops 2017, 3, 1–11. [Google Scholar]
  121. Morris, M.; Doss, C. How Does Gender Affect the Adoption of Agricultural Innovations? The Case of Improved Maize Technology in Ghana. In Proceedings of the Annual Meeting, American Agricultural Economics Association (AAEA), Nashville, TN, USA, 8–11 August 1999. [Google Scholar]
  122. Alexander, C.; Thuy, V.M. Determinants of Corn Rootworm Resistant Corn Adoption in Indiana. AgBioForum 2005, 8, 197–204. [Google Scholar]
  123. Lydia, N.N.; Bjorn, V.C.; David, A. Stimulating Agricultural Technology Adoption: Lessons from Fertilizer Use among Ugandan Potato Farmers; IFPRI Discussion Paper 1608; International Food Policy Research Institute (IFPRI): Washington, DC, USA, 2017; p. 36. [Google Scholar]
  124. Ahmed, I. Technological Change and Agrarian Structure: A Study of Bangladesh; International Labour Office: Geneva, Switzerland, 1981. [Google Scholar]
  125. Gould, B.W.; Saupe, W.E.; Klemme, R.M. Conservation Tillage: The Role of Farm and Operator Characteristics and the Perception of Soil Erosion. Land Econ. 1989, 65, 167–182. [Google Scholar] [CrossRef]
  126. Lowder, S.K.; Skoet, J.; Raney, T. The Number, Size, and Distribution of Farms, Smallholder Farms, and Family Farms Worldwide. World Dev. 2016, 87, 16–29. [Google Scholar] [CrossRef]
  127. Thapa, G.; Gaiha, R. Smallholder Farming in Transforming Economies of Asia and the Pacific: Challenges and Opportunities. In New Directions for Smallholder Agriculture; Peter, B.R., Hazell, A.R., Eds.; OUP: Oxford, UK, 2014; Chapter 4; p. 608. [Google Scholar]
  128. Shiyani, R.L.; Joshi, P.K.; Bantilan, M.C.S. Impact of Chickpea Research in Gujarat; Impact Series No. 9; International Crops Research Institute for the Semi-Arid Tropics: Andhra Pradesh, India, 2001; p. 40. [Google Scholar]
  129. Kinuthia, B.K.; Mabaya, E. The Impact of Agricultural Technology Adoption on Farmer Welfare in Uganda and Tanzania; Africa Portal: Johannesburg, South Africa, 2017. [Google Scholar]
  130. Alauddin, M.; Tisdell, C. Dynamics of Adoption and Diffusion of HYV Technology: New Evidence of Inter-Farm Differences in Bangladesh; Research Report or Occasional Paper, No. 155; Resource and Development Research Papers, No. 4; Department of Economics, University of Newcastle: New South Wales, Australia, 1988. [Google Scholar]
  131. Sarker, M.A.; Itohara, Y.; Hoque, M. Determinants of Adoption Decisions: The Case of Organic Farming (OF) in Bangladesh. Ext. Farm. Syst. J. 2005, 5, 39–46. [Google Scholar]
  132. Kalba, K. The Adoption of Mobile Phones in Emerging Markets: Global Diffusion and the Rural Challenge. Int. J. Commun. 2008, 2, 631–661. [Google Scholar]
  133. Bairagi, S.; Bhandari, H.; Das, S.B.; Mohanty, S. Impact of Submergence-Tolerant Rice Varieties on Smallholders’ Income and Expenditure: Farm-Level Evidence from Bangladesh. Presented at the Agricultural & Applied Economics Association Annual Meeting 2018, Washington, DC, USA, 5–7 August 2018. [Google Scholar]
  134. Ward, P.S.; Pede, V.O. Capturing Social Network Effects in Technology Adoption: The Spatial Diffusion of Hybrid Rice in Bangladesh. Aust. J. Agric. Resour. Econ. 2014, 59, 225–241. [Google Scholar] [CrossRef]
  135. Chapman, R.; Blench, R.; Kranjac-Berisavljevic, G.; Zakariah, A.B.T. Rural Radio in Agricultural Extension: The Example of Vernacular Radio Programmes on Soil and Water Conservation in N. Ghana; Overseas Development Institute (ODI): London, UK, 2003. [Google Scholar]
  136. Ragasa, C.; Ulimwengu, J.; Randriamamonjy, J.; Badibanga, T. Factors Affecting Performance of Agricultural Extension: Evidence from Democratic Republic of Congo. J. Agric. Educ. Ext. 2016, 22, 113–143. [Google Scholar] [CrossRef]
  137. Goodwin, B.; Mishra, A. Farming Efficiency and the Determinants of Multiple Job Holding by Farm Operators. Am. J. Agric. Econ. 2004, 86, 722–729. [Google Scholar] [CrossRef]
  138. Sanzidur, R. Women’s employment in bangladesh agriculture: composition, determinants and scope. J. Rural Stud. 2000, 16, 497–507. [Google Scholar]
  139. Esha, S.; Malapit, H.J.; Quisumbing, A.R.; Akhter, U.A. Women’s Empowerment in Agriculture: What Role for Food Security in Bangladesh? World Dev. 2014, 61, 11–52. [Google Scholar]
  140. Jost, C.; Kyazze, F.; Naab, J.; Neelormi, S.; Kinyangi, J.; Zougmore, R.; Aggarwal, P.; Bhatta, G.; Chaudhury, M.; Tapio-Bistrom, TB.; et al. Understanding Gender Dimensions of Agriculture and Climate Change in Smallholder Farming Communities. Clim. Dev. 2015, 8, 133–144. [Google Scholar] [CrossRef] [Green Version]
  141. Ahmed, A.; Ghostlow, J.; Hossian, N. Empowering Women in Bangladesh by Strengthening the Agriculture-Nutrition-Gender Nexus. International Food Policy Research Institute (IFPRI) Blog. Available online: http://www.ifpri.org/blog/empowering-women-bangladesh-strengthening-agriculture-nutrition-gender-nexus (accessed on 19 June 2018).
  142. Sonia, A.; Pieter, R.; Joyce, L.; Nyo, M.H.; Su, S.S.; Budi, R.; Arlyna, P. Women’s Empowerment and Gender Equity in Agriculture: A Different Perspective from Southeast Asia. Food Policy 2017, 69, 270–279. [Google Scholar]
  143. Gisselquist, D.; Nash, J.; Pray, C. Deregulating the Transfer of Agricultural Technology: Lessons from Bangladesh, India, Turkey, and Zimbabwe. World Bank Res. Obs. 2011, 17, 149–159. [Google Scholar] [CrossRef]
  144. Habiba, U.; Abedin, M.A.; Hassan, A.W.R.; Shaw, R. Food Security and Risk Reduction in Bangladesh, 2015th ed.; Springer: New York, NY, USA, 2015. [Google Scholar]
  145. Aker, J.C. Dial “A” for Agriculture: A Review of Information and Communication Technologies for Agricultural Extension in Developing Countries. Agric. Econ. 2011, 42, 631–647. [Google Scholar] [CrossRef]
  146. Ali, J.; Kumar, S. Information and Communication Technologies (ICTs) and Farmers’ Decision-Making across the Agricultural Supply Chain. Int. J. Inf. Manag. 2011, 31, 149–159. [Google Scholar] [CrossRef]
  147. Toma, P.; Miglietta, P.P.; Zurlini, G.; Valente, D.; Petrosillo, I. A Non-Parametric Bootstrap-Data Envelopment Analysis Approach for Environmental Policy Planning and Management of Agricultural Efficiency in EU Countries. Ecol. Indic. 2017, 83, 132–143. [Google Scholar] [CrossRef]
Figure 1. Breakdown of the Bangladesh study areas.
Sustainability 10 04331 g001
Table 1. Variables used in the logistic regression model to determine the influencing factors of the soil testing and fertilizer recommendation facilities.
Notation of the VariableVariable NameDescriptionVariable Type/CriteriaAssumptions
YAdoption (Dependent variable)Farmer’s adoption of soil testing and fertilizer recommendation facilitiesDummy:
1 if adopted, 0 otherwise
N/A
X1GenderRespondent’s gender1 = Male (M),
0 = Female (F)
M adopt > F adopt
X2AgeRespondent’s age1 = Young farmer whose age is in between 15–40 years,
0 = Old farmers, whose age is in between 41–75 years
+
X3EducationLevel of education0 = Illiterate (can only sign the name),
1 = Literate (can read, write and sign)
+
X4Farming experienceYears of farming experience0 = If the farming experience is in between 1 to 25 years,
1 = If the farming experience is in between 26 to 55 years.
+
X5Farm sizeTotal cultivation area in acres1 = Small (if the farmers’ land size is in between 0.01 to 0.033 acre),
2 = Big (if the farmers’ land size is in between 0.034 to >1.00 acre)
+
X6Land OwnershipFarmers’ land ownership rights0 = if the farmer does not have full ownership rights
1 = if the farmer has full ownership rights
+
X7Farming incomeLevel of earning 0 = Low earners, if the earning is 0 to 10,000 TK
1 = High earners, if the earning is >10,000 TK
+
X8Secondary IncomeRespondents’ secondary/out farm income source1 = Has secondary income,
0 = Does not
+
X9STFRF KnowledgeFarmers’ knowledge about soil testing and fertilizer recommendation facilities0 = No,
1 = Otherwise
+
X10Fee OpinionFarmers’ opinion about the fee of the soil testing and fertilizer recommendation facilities0 = Not high,
1 = Otherwise
-
Source: Field survey data, 2017.
Table 2. The basic sociodemographic information of the respondents.
VariableAttributesPercentageMean Std. Dev.
GenderFemale11.930.88068 0.32509
Male88.07
χ2 = 1.3518, df = 1, p = 0.245
Age≤40 years60.800.60795 0.48960
≥41 years39.20
χ2 = 12.6106, df = 1, p = 0.000 *
EducationIlliterate50.570.494320.50139
Literate49.43
χ2 = 8.2056, df = 1, p = 0.004 *
Farming experience 1–25 years40.340.59659 0.49198
26–55 years59.66
χ2 = 14.7552, df = 1, p = 0.000 *
Farm size 0.01 to 0.033 acre64.771.352270.47904
0.034 to >1.00 acre35.23
χ2 = 9.9604, df = 1, p = 0.002 *
Land OwnershipNot own21.590.78409 0.41263
Own78.41
χ2 = 3.3562, df = 1, p = 0.067
Source: Field survey data, 2017. Note: * are statistically significant at 5% (p < 0.05).
Table 3. Logistic regression analysis of the factors influencing soil testing and fertilizer recommendation facilities in Bangladesh.
VariableCoefficientStd. Err.zP > |z|Marginal Effects (dy/dx)VIF
Gender−0.073040.56701−0.130.898−0.01191.04
Age
Young0.865420.410552.110.035 *0.146671.17
Education
Literate0.865880.391172.210.027 *0.144821.08
Farming Experience
26–55 years−1.313810.41221−3.190.001 **−0.223861.15
Farm Size
Big−1.845540.50353−3.670.000 ***−0.302931.32
Land Ownership0.593180.503271.180.2390.097221.11
Farming Income1.28370.516322.490.013 *0.206691.41
Secondary Income0.705920.420681.680.0930.116331.19
STFRT Knowledge1.17810.404452.910.004 **0.197911.08
Fee Opinion
High−1.188220.43991−2.70.007 **−0.195191.22
Number of observations = 176; LR chi2 (10) = 70.87; Prob > chi2 = 0.0000; Log likelihood = −86.55796; McFadden Pseudo R2 = 0.2905; Note: * represents 5% (p < 0.05), ** 1% (p < 0.01), and *** 0.1% (p < 0.001) significance levels. Source: Field survey data, 2017.
Table 4. Respondents’ knowledge level and the information sources of soil testing and fertilizer recommendation facilities.
STFRF KnowledgeKnowledge Source
Level of KnowledgeFrequency SourcesFrequency
(n = 176)(n = 176)
Proper74Service Providers34
Partial or Not at all102NGO24
Agriculture officer22
Friends or Neighbors30
Radio29
Never heard37
Source: Field survey data, 2017.
Table 5. The sentiment of the farmers related to adoption and non-adoption.
Reasons for AdoptionFrequency (n = 88)
Better yield 31
Better yield, increase soil quality, fertilizer quantity, and doses30
Better yield and protect environment 13
Improve crop quality6
Identify deficiency in soil3
Maintain soil quality and to know soil productivity2
Reasons for No AdoptionFrequency (n = 88)
Did not know37
Do not trust15
Not necessary14
Wastage of money22
Source: Field survey data, 2017.
Table 6. Service quality satisfaction level of the adopters and non-adopters.
Service Quality of the ProvidersFrequencyPercent
AdopterNon-AdopterTotal
Satisfied4604626.1
Delay to supply materials on time100105.7
Lack of advertisement 7074.0
No regular meeting6063.4
No proper training9095.1
Place location is not convenient6063.4
Unfriendly410148.0
Not heard any advertisement and No interaction with providers0373721.0
Failed to convince me0414123.3
Total 8888176100.00
Source: Own survey data, 2017.

