Intensification and Upgrading Dynamics in Emerging Dairy Clusters in the East African Highlands

 , ,
, ,
Abstract
1. Introduction
2. Methodology
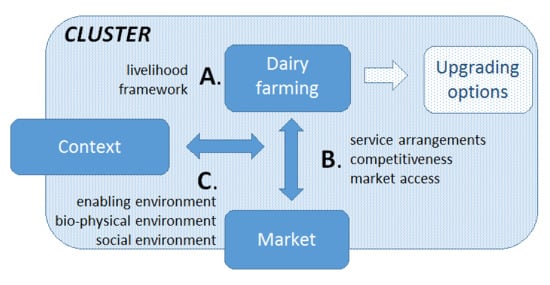
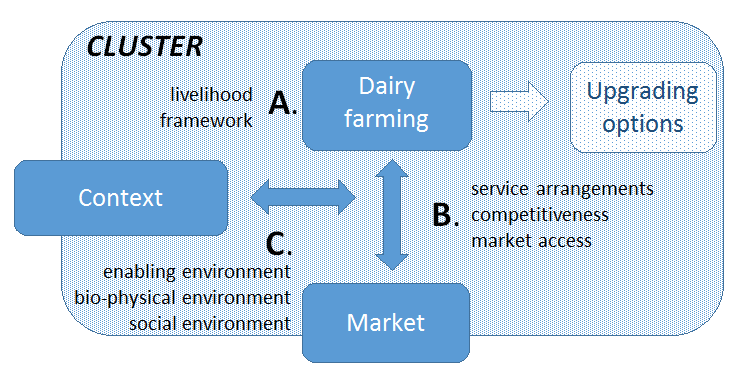
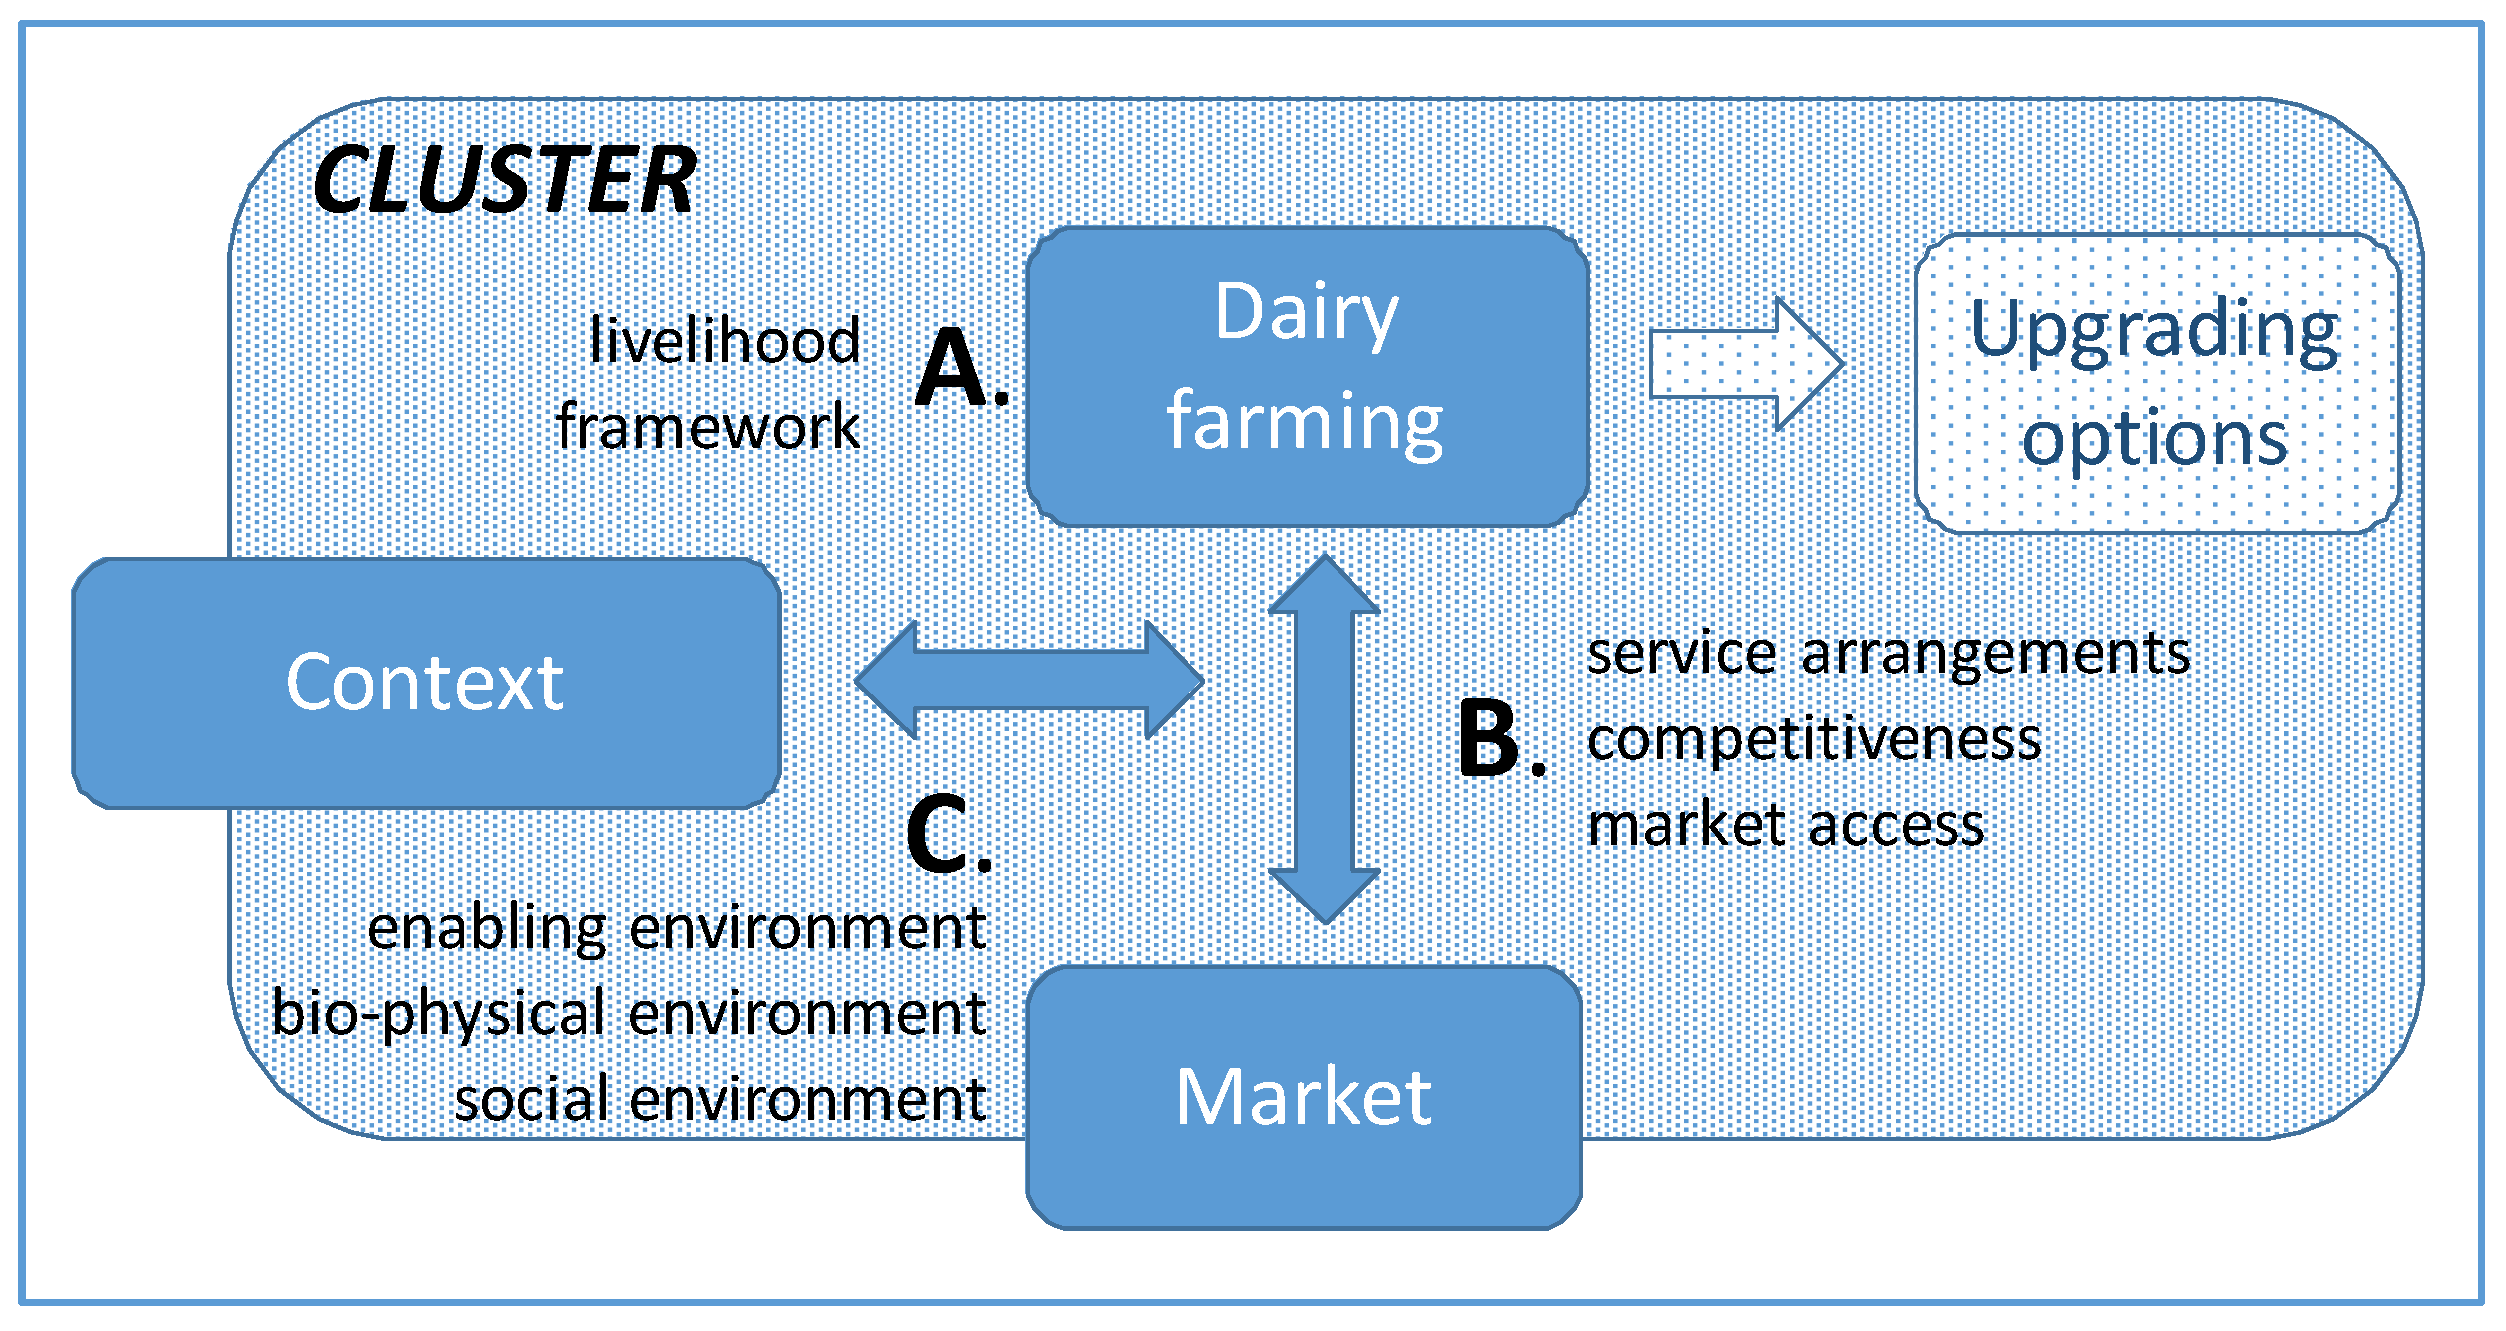
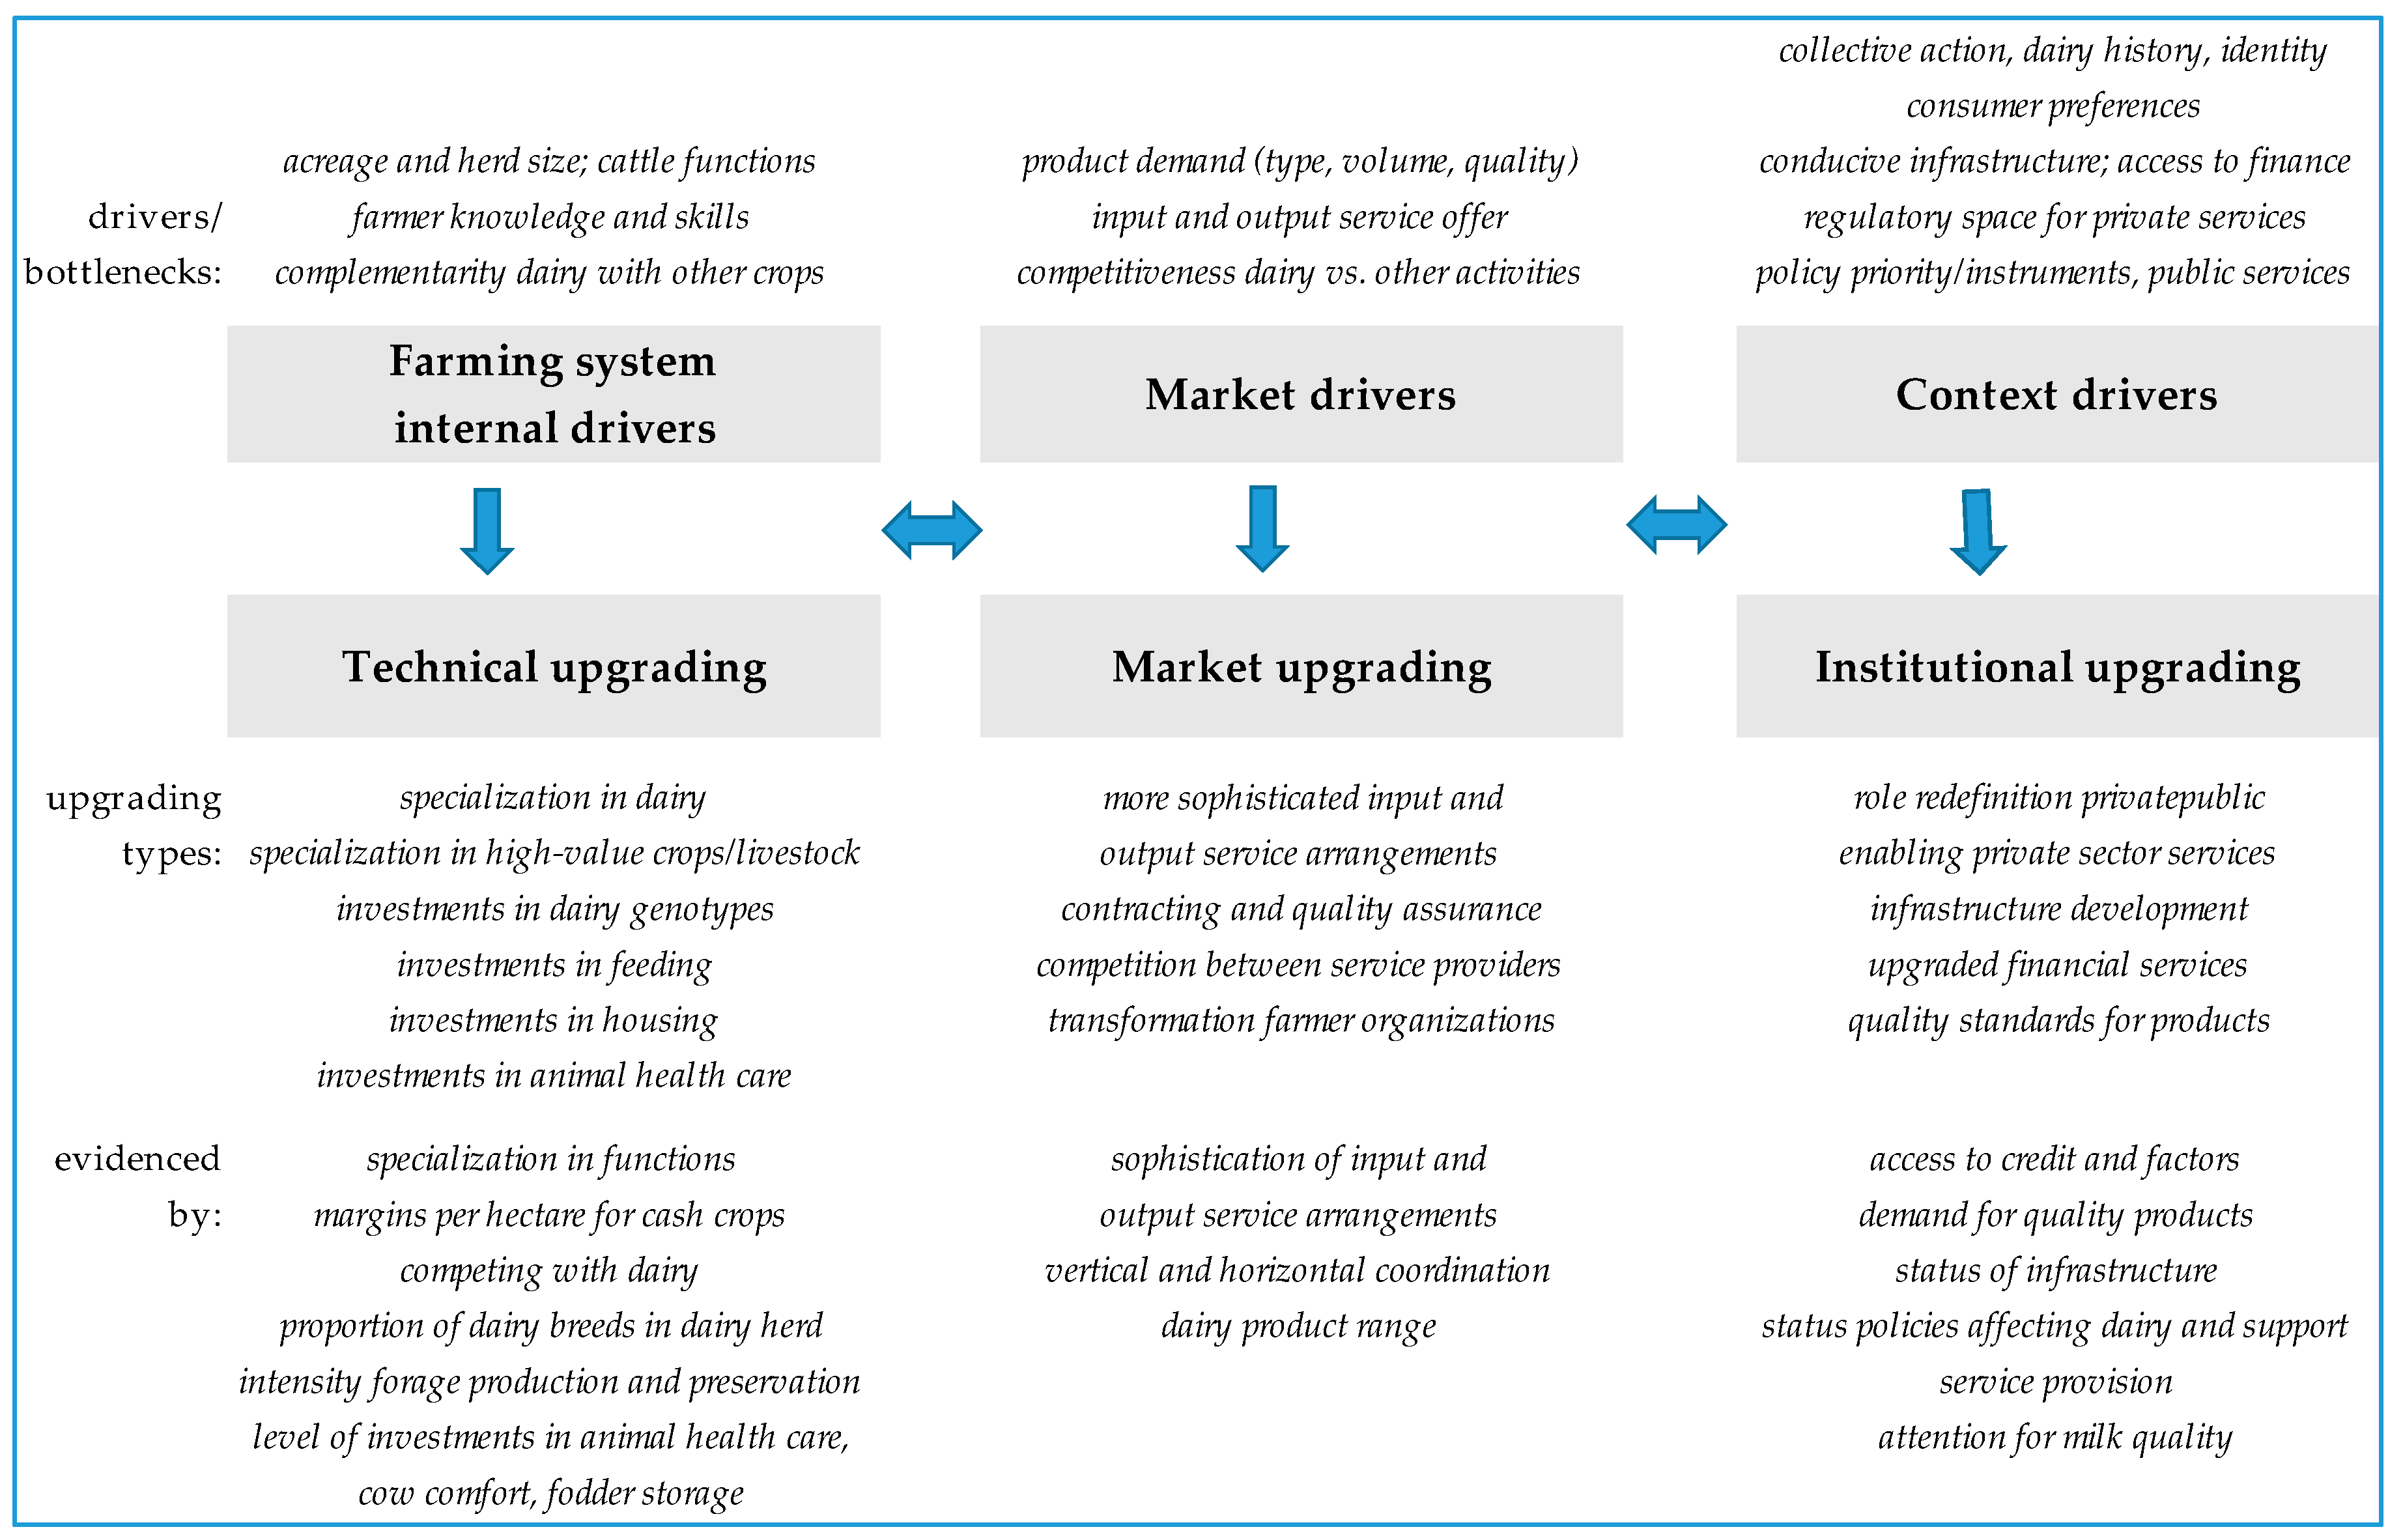
2.1. Analytical Framework—Two Subsystems in Context
- Farming system factors—Technical upgrading of the farming system is explored based on the sustainable livelihoods framework [30]. This considers how farmers combine the different types of livelihood resources they own or can get access to into livelihood activities, such as food and cash cropping, livestock-keeping, and off-farm activities, using a variety of practices, which often reinforce each other [31,32]. Farmers optimize several objectives into a livelihood strategy [33]. We thus assessed dynamics in the current mixed crop–dairy farming systems by looking at changes in the livestock and crops grown and at their functions in the farm, e.g., livestock for meat, milk, manure, draft power, social functions, household food, or sale; crops for food or sale [6].
- Farm–market interaction—Value chain upgrading changes the way a farm interacts with the market. Following the Windmill approach of Leonardo et al. [34], we explored the influence of the various service arrangements that determine farmers’ options for marketing their produce. We looked at farmers’ access to markets, associated transaction costs, and fit of service arrangements with particular degrees of market integration [13,17]. The service arrangements offer varying degrees and combinations of the horizontal (between farmers) and vertical (with input and output side chain actors) coordination that are necessary to effectively integrate smallholders into markets [11,35]. Market-integrated dairy requires a large variety of pre-production inputs and professional services, so this typology needs to cover service arrangements on both the input and output side.
- Context influence on farm–market interaction—Lastly, several context factors significantly influence farm–market interaction and determine the need for institutional upgrading, i.e., the improvement of institutional voids that constrain value chain operations [1,23]. We considered three types of factors: (1) factors in the biophysical environment, which include land-use patterns, infrastructure (roads and utilities), climate and weather, animal and crop pests and diseases, risks of natural and human-induced disasters (such as droughts and wars), seasonality of production, and environmental impact of farming, including effects of agro-chemical use [18,36]; (2) factors in the enabling context, i.e., the regulatory framework elements and their enforcement (such as agricultural policies, subsidies, access to finance, property rights, and quality standards) that determine whether the institutional context enables upgrading [16,23,29,37,38]; and (3) factors in the social environment, i.e., social identity and (dairy) farming history [39].
2.2. Data Collection and Analysis
- Farming system internal factors: Changes in farmer livelihood strategies, practices, outcomes, and resources (also called capitals or assets) including natural (land acreage and soils, water, climate and weather, herd size and genetics, functions of and interaction between livestock and crops used); economic (capital); physical (farm structures, equipment); human (labor, knowledge and skills); and social resources (networks, groups)
- Market factors: Dairy pre- and post-production service arrangements and service offer; farmer utilization and satisfaction; demand for dairy products (product, price, place); scarcity of inputs, services, and production factors; key marketing institutions, such as competition, role division in service supply, availability of market information, actor relationships, and milk quality assurance
- Context factors: Collective action; dairy history and identity; consumer preferences; conducive infrastructure; access to production factors; regulatory space for private services; policy priority/instruments, public services, and subsidies; social inclusion and environmental impact.
3. Results
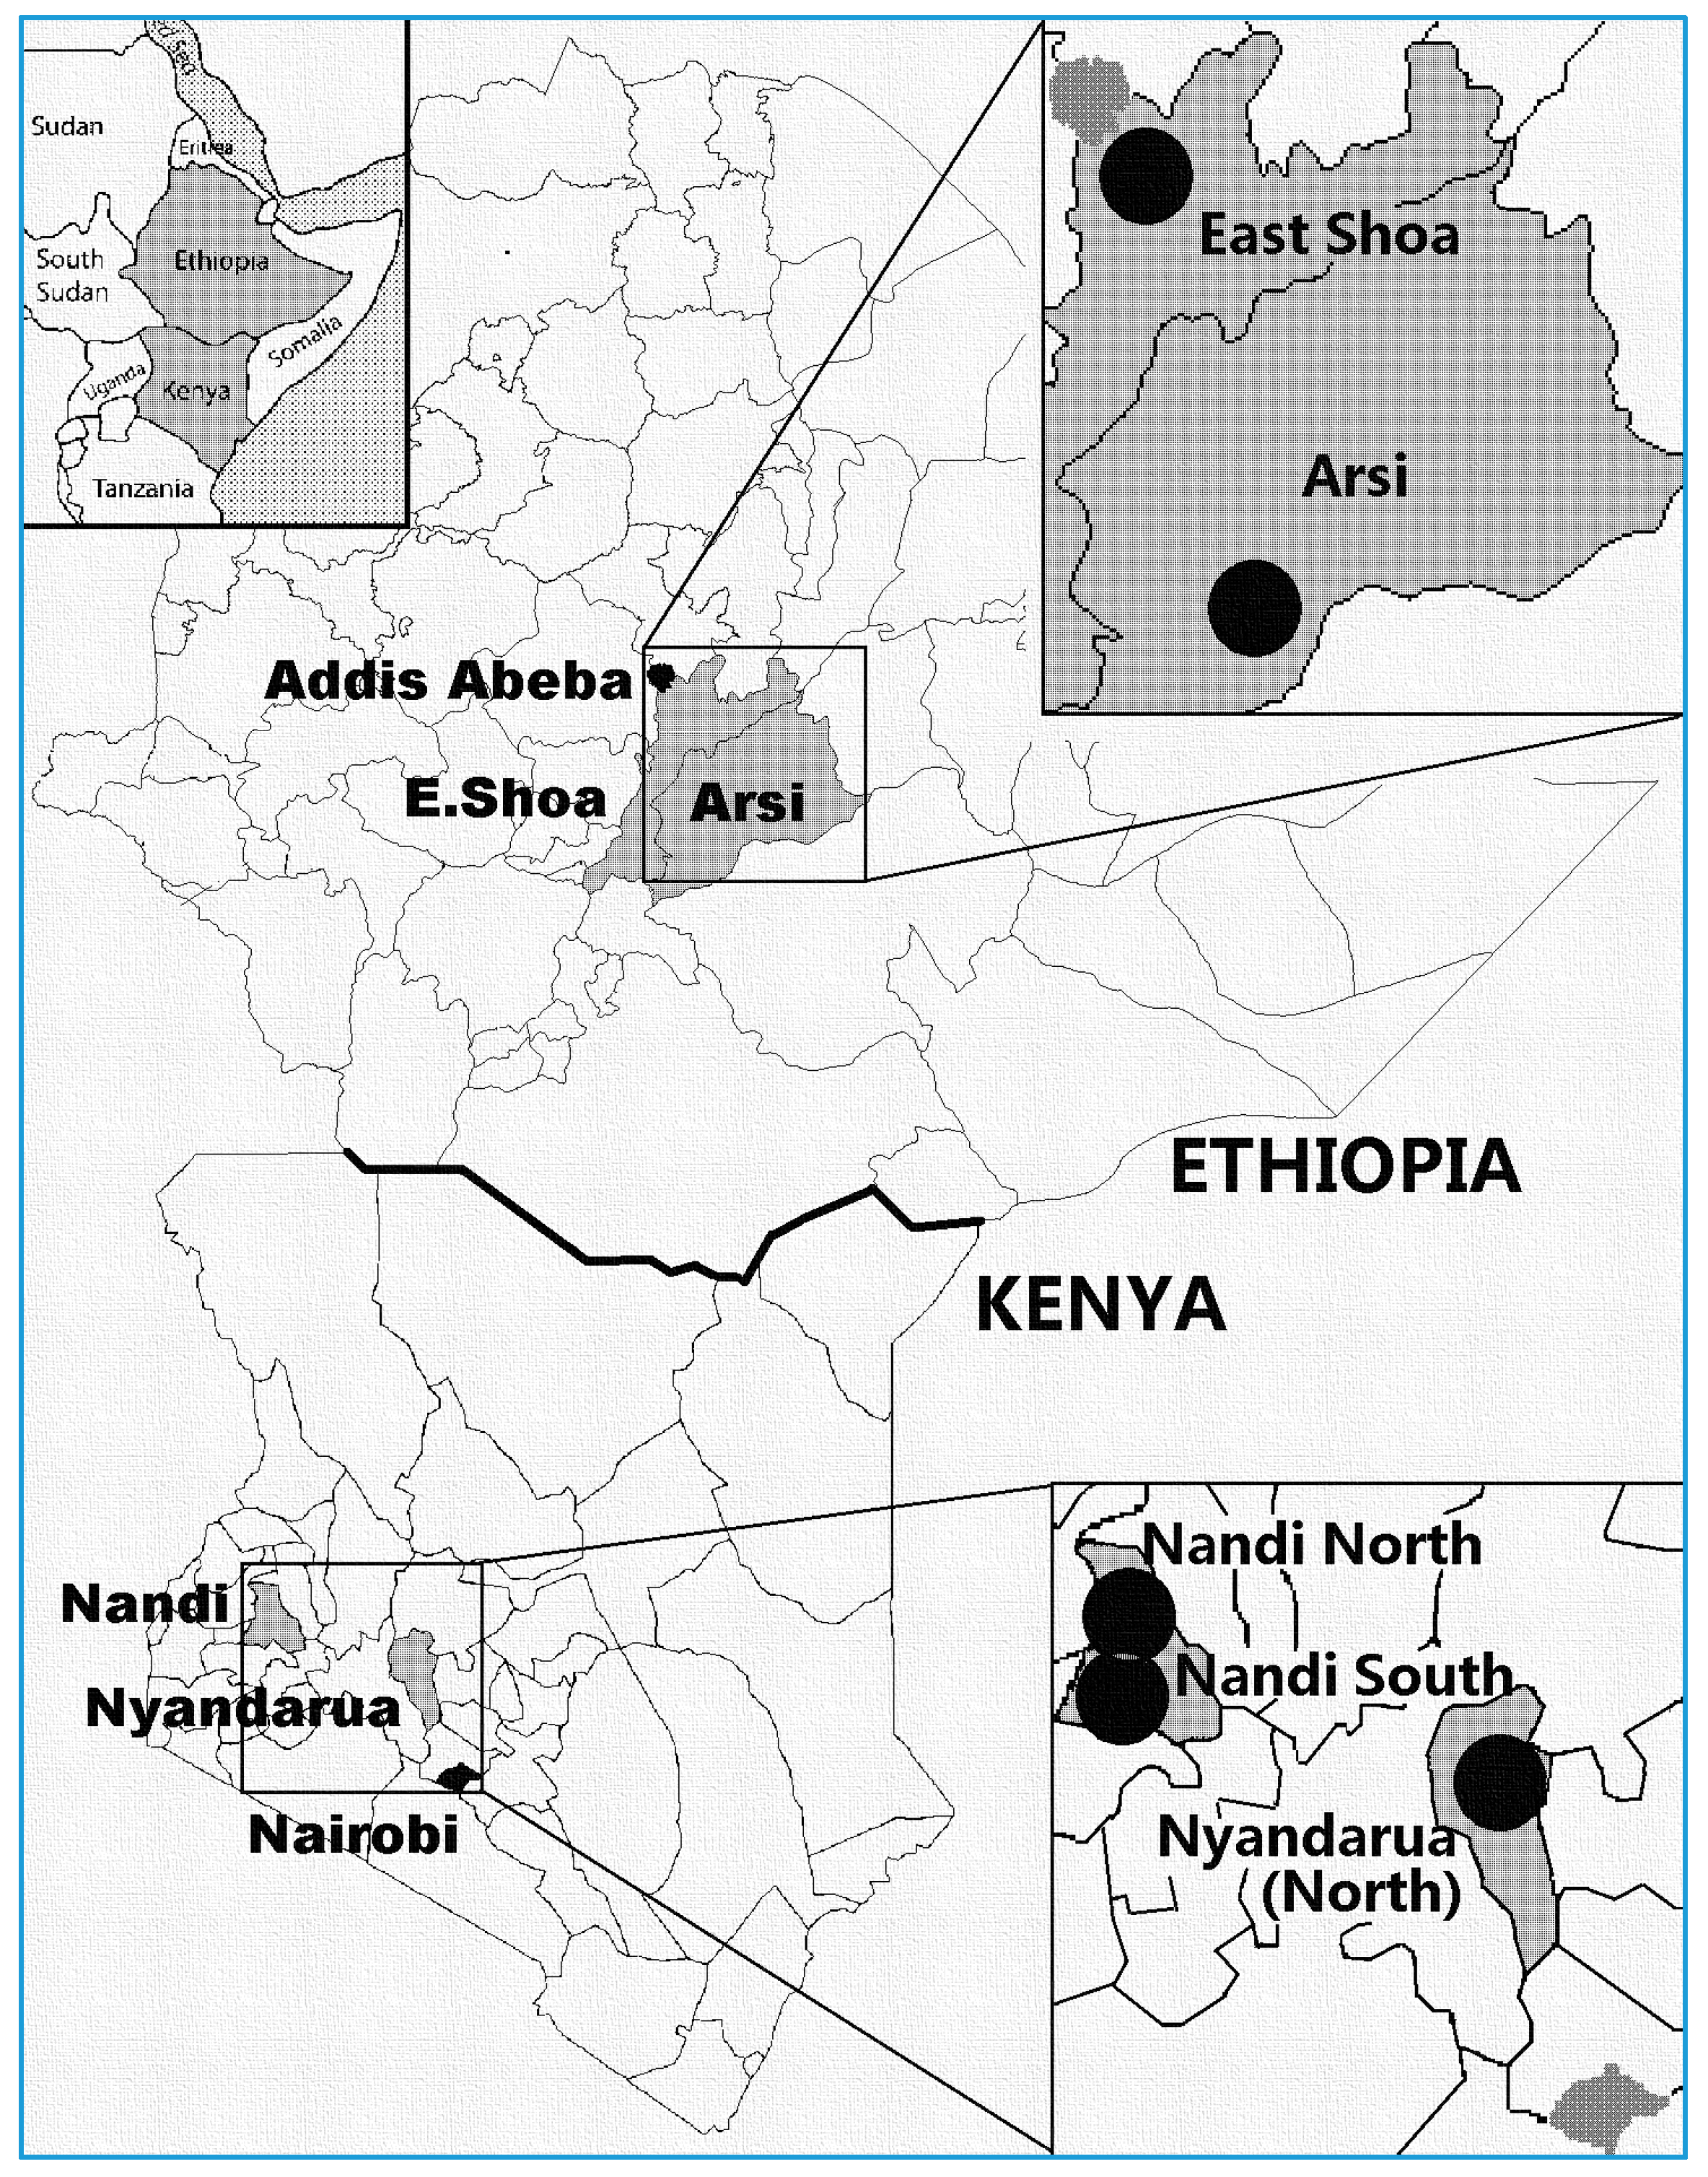
3.1. Cluster Description
- Dairy clusters—HdHc Nandi North and Nyandarua gradually specialize to dairy and become increasingly market-oriented; there is significant milk collection by cooperatives and processors; increasingly sophisticated types of service arrangements exist; other cash crops or livestock products are produced as a second activity; Nyandarua enjoys high demand for milk from processors and traders; 98% of the dairy farm herd is either crossbred or purebred exotic; potatoes come second after dairy; Nandi North has more non-dairy farmers and more medium- and large-scale farms; the choice of dairy over horticulture or perennials is still tentative.
- Grain and fattening cluster—LdLc Arsi specializes in barley and wheat as cash crops, enabled by farm sizes that still allow such relatively extensive crops; for a long time, poor roads limited market access for dairy; just before roads improved around 2012, farmers adopted improved grain crop packages promoted by government and agribusiness; as a result, farmers focus on livestock activities, other than dairy, that utilize cash crop residues, but do not require daily marketing, i.e., beef, mutton, and heifer production; dairy development interventions have been occurring since the 1950s.
- Perennial and horticultural crop cluster—LdHc Nandi South saw a diminishing role for dairy, as a move to high-value/ha activities occurred; farmers specialize in tea due to better support services; milk collection is almost only informal; cattle are being replaced by small livestock; semi-subsistence farming with extensive livestock and off-farm labor continues in areas unsuitable for tea and vegetable marketing.
- Mixed cluster—LdHc East Shoa, some farmers specialize in dairy (Type I), others in horticulture (Type III), while in more remote areas grains prevail (Type II). In the dairy herds of interviewed farmers, only 34% of animals are crossbred or purebred exotic; both subsectors benefit from fresh food demand in the nearby metropolis; competition for land occurs between the two and with export-oriented flower farming and urban development.
3.2. Analysis of Upgrading in Three Domains
3.2.1. Farming System Factors (A)
- Investments in dairy genotypes using AI or improved bulls. This breed-replacement process is ongoing in Ethiopia and mostly completed in Kenya; except for in some remote, barely specialized villages, farmers in Kenya overwhelmingly keep purebred or crossbred Ayrshire, Friesian, Jersey, and Guernsey
- Investments in feeding practices follow a standard pattern over time: (1) grazing and crop residues are supplemented with industrial by-products and mixed rations; (2) grazing land is paddocked; (3) investments are made in production and preservation of planted forages such as oats, maize, and Napier and Rhodes grass to counter forage shortages
- Investments in animal housing in Ethiopia include new barns to house improved breeds; in Kenya, zero-grazing units and feed storage are used when intensifying further
- Investments in animal health care increase; due to the failure of communal cattle dips to control tick-borne diseases, in Kenya many farmers have moved to individual spraying and some vaccination for East Coast Fever; treatment by veterinary workers is increasing, as is self-administration of drugs purchased from agro-veterinary shops, especially de-wormers; in Ethiopia, farmers use government veterinary personnel, who often provide better private service on the side.
3.2.2. Farm–Market Interaction (B)
3.2.3. Context Influence on Farm–Market Interaction (C)
4. Discussion
4.1. Present Upgrading Status of Farming and Clusters
4.2. Cluster Upgrading Pathways Toward the Future
- HdHc—Dairy clusters. Dairy is competitive against other commodities; service arrangements become increasingly sophisticated and competitive; private and/or cooperative actors play a strong role. Continued development of HdHc clusters toward dairy seems likely, provided upgrading in farming, market, and context progresses. Further specialization may lead to singular focus on dairy (HdLc). This expected further upgrading of the HdHc dairy clusters contradicts modeling outcomes of Herrero et al. [4], who only foresaw such upgrading for peri-urban dairy in Kenya, and may warrant review of their modeling assumptions.
- LdLc—Grain and fattening cluster. Strong public policy directions and public–private collaboration made grains in LdLc Arsi cluster more competitive than dairy. Future development of LdLc clusters toward dairy depends on serious value chain and institutional upgrading, if dairy is to effectively compete with cash crops. For the time being, available farmer expertise and presence of improved dairy breeds in LdLc Arsi keep the door open for upgrading of dairy, but heifer production and commercial forage production for supply to other dairy clusters seem to be more attractive alternatives. These alternative opportunities are enhanced by (1) the competition for fodder between dairy and draft animals in Ethiopia; and (2) the low capacity of intensifying tropical dairy systems to produce sufficient replacement stock and fodder [52], which results in high prices for dairy heifers and fodder.
- LdHc—Perennial and horticultural crop cluster. Severe land scarcity affects these clusters, with specialization toward perennials, horticulture, and intensive livestock. Due to strong path dependency, further upgrading and specialization of LdHc clusters around perennials and horticulture are most likely, along with intensive non-dairy livestock-keeping in areas not suitable for perennials and horticulture. It will be interesting to watch whether farmers with a strong ‘cattle identity’ will give up dairy.
4.3. Upgrading Options at Farm Level
4.4. Sustainability of Intensification Pathways
- (i)
- Market access for resource-poor farmers can be positively impacted by policy support instruments and development interventions; these have their own dynamics, which often appear to be at odds with the space for private service provision. Long-term impact assessment is critical, as their effects are often slow and not very noticeable [56].
- (ii)
- Cooperatives offer no panacea for upgrading. In less sophisticated markets, cooperatives with a basic service offer can stimulate market orientation. In intermediate market conditions, they serve as collection and aggregation centers that are highly valued. In more sophisticated markets, however, in order to stay competitive they have to move beyond being what Royer, et al. [57] call a ‘claim group’ and develop into more efficient service providers.
- (iii)
- As membership of cooperatives consists of resource-endowed smallholders with a relatively large feasibility space, supporting them through the cooperatives has a large potential to grow agricultural output [58] but excludes resource-poor smallholders.
- (iv)
- The quality of public services generally is insufficient for dairy farming upgrading, which requires dependable pre-production inputs and services [6]. While in Ethiopia authorities unintentionally hamper dairy farming upgrading by monopolizing key support services, authorities in Kenya at times hinder private service delivery development by subsidizing inputs and services to farmers who have sufficient purchasing power.
4.5. Upgrading Dynamics as Result of Farm–Market–Context Interactions
4.6. Positive and Negative Co-Dependencies in Relation to System Jumps
5. Conclusions
- Co-dependencies between technical, value chain, and institutional upgrading processes are key to understanding the adaptive cycle dynamics of farming- and market-system upgrading, including system jumps, stagnation, and collapse. We coin the concept of ‘concurrency’ to describe co-dependency in terms of timing of synergistic upgrading in different domains. When a sizable number of upgrades needs to occur concurrently, a system jump can be expected upon reaching a certain threshold of pressure to transform. The implications for studies of technical upgrading in farming systems are that synergies between internal (farming system) and external (market and context) factors determine upgrading outcomes.
- The upgrading status of dairy clusters results from diverging pathways along two dimensions: feeding system intensification and cash crop intensification. Intensive dairy is competing with other high-value cash crop options—intensive livestock activities, horticulture, and perennials—that farmers specialize in depending on market and context conditions. Clusters can be expected to move further along the intensification pathway started, unless actors consciously influence direction through investments in upgrading conditions. The implications for the debate on cluster upgrading are that (1) transition emerges from synergistic technical, value chain, and institutional upgrading; and (2) evaluation of upgrading options needs to consider notions of path dependency, concurrency, and investments in upgrading conditions.
- Farmers’ feasibility space for participation in transition expands along with their resource base, access to production factors, presence of service arrangements, and conduciveness of context factors. Resource endowment levels help explain why particular farmers participate in particular chains. Transition from ‘semi-subsistent farmers supplying to local markets’ to ‘market-oriented farmers supplying to urban markets’ may take decades when market and context conditions are sub-optimal. This adds to earlier work on inclusiveness of connecting resource-poor farmers to markets.
- The most upgraded HdHc cluster appears to be facing another transformation that will manifest in upgraded feeding strategies and further value chain upgrading, which will ensure supply certainty and improved access to and quality of inputs and services. Studies of such real-life system transformation cases will add to understanding of system jumps.
Supplementary Materials
Author Contributions
Funding
Acknowledgments
Conflicts of Interest
References
- Kilelu, C.; Klerkx, L.; Omore, A.; Baltenweck, I.; Leeuwis, C.; Githinji, J. Value chain upgrading and the inclusion of smallholders in markets: Reflections on contributions of multi-stakeholder processes in dairy development in Tanzania. Eur. J. Dev. Res. 2017, 29, 1102–1121. [Google Scholar] [CrossRef]
- Giuliani, E.; Pietrobelli, C.; Rabellotti, R. Upgrading in global value chains: Lessons from Latin American clusters. World Dev. 2005, 33, 549–573. [Google Scholar] [CrossRef]
- Oosting, S.J.; Udo, H.M.J.; Viets, T.C. Development of livestock production in the tropics: Farm and farmers’ perspectives. Animal 2014, 8, 1238–1248. [Google Scholar] [CrossRef] [PubMed]
- Herrero, M.; Thornton, P.K.; Bernués, A.; Baltenweck, I.; Vervoort, J.; van de Steeg, J.; Makokha, S.; van Wijk, M.T.; Karanja, S.; Rufino, M.C. Exploring future changes in smallholder farming systems by linking socio-economic scenarios with regional and household models. Glob. Environ. Chang. 2014, 24, 165–182. [Google Scholar] [CrossRef]
- Mockshell, J.; Kamanda, J. Beyond the agroecological and sustainable agricultural intensification debate: Is blended sustainability the way forward? Int. J. Agric. Sustain. 2018, 16, 127–149. [Google Scholar] [CrossRef]
- Udo, H.M.J.; Aklilu, H.A.; Phong, L.T.; Bosma, R.H.; Budisatria, I.G.S.; Patil, B.R.; Samdup, T.; Bebe, B.O. Impact of intensification of different types of livestock production in smallholder crop-livestock systems. Livest. Sci. 2011, 139, 22–29. [Google Scholar] [CrossRef]
- Burke, W.J.; Myers, R.J.; Jayne, T.S. A triple-hurdle model of production and market participation in Kenya’s dairy market. Am. J. Agric. Econ. 2015, 97, 1227–1246. [Google Scholar] [CrossRef]
- Novo, A.M.; Slingerland, M.; Jansen, K.; Kanellopoulos, A.; Giller, K.E. Feasibility and competitiveness of intensive smallholder dairy farming in Brazil in comparison with soya and sugarcane: Case study of the Balde Cheio programme. Agric. Syst. 2013, 121, 63–72. [Google Scholar] [CrossRef]
- Olwande, J.; Smale, M.; Mathenge, M.K.; Place, F.; Mithöfer, D. Agricultural marketing by smallholders in Kenya: A comparison of maize, kale and dairy. Food Policy 2015, 52, 22–32. [Google Scholar] [CrossRef]
- Didanna, H.L.; Wossen, A.M.; Worako, T.K.; Shano, B.K. Factors influencing intensification of dairy production systems in Ethiopia. Outlook Agric. 2018, 47, 0030727018770463. [Google Scholar] [CrossRef]
- Kilelu, C.W.; Klerkx, L.; Leeuwis, C. Supporting smallholder commercialisation by enhancing integrated coordination in agrifood value chains: Experiences with dairy hubs in Kenya. Exp. Agric. 2016, 53, 269–287. [Google Scholar] [CrossRef]
- Dirven, M. Dairy clusters in Latin America in the context of globalization. Int. Food Agribus. Manag. Rev. 2001, 2, 301–313. [Google Scholar] [CrossRef]
- Brasier, K.J.; Goetz, S.; Smith, L.A.; Ames, M.; Green, J.; Kelsey, T.; Rangarajan, A.; Whitmer, W. Small farm clusters and pathways to rural community sustainability. Community Dev. 2007, 38, 8–22. [Google Scholar] [CrossRef]
- Morosini, P. Industrial clusters, knowledge integration and performance. World Dev. 2004, 32, 305–326. [Google Scholar] [CrossRef]
- van Dijk, M.P.; Sverrisson, Á. Enterprise clusters in developing countries: Mechanisms of transition and stagnation. Entrep. Reg. Dev. 2003, 15, 183–206. [Google Scholar] [CrossRef]
- Kebebe, E.G.; Duncan, A.J.; Klerkx, L.; de Boer, I.J.M.; Oosting, S.J. Understanding socio-economic and policy constraints to dairy development in Ethiopia: A coupled functional-structural innovation systems analysis. Agric. Syst. 2015, 141, 69–78. [Google Scholar] [CrossRef]
- Ruben, R.; Dekeba Bekele, A.; Megersa Lenjiso, B. Quality upgrading in Ethiopian dairy value chains: Dovetailing upstream and downstream perspectives. Rev. Soc. Econ. 2017, 75, 296–317. [Google Scholar] [CrossRef]
- Omiti, J.; Otieno, D.; Nyanamba, T.; McCullough, E. Factors influencing the intensity of market participation by smallholder farmers: A case study of rural and peri-urban areas of Kenya. Afr. J. Agric. Resour. Econ. 2009, 3, 57–82. [Google Scholar]
- Duru, M.; Therond, O. Livestock system sustainability and resilience in intensive production zones: Which form of ecological modernization? Reg. Environ. Chang. 2015, 15, 1651–1665. [Google Scholar] [CrossRef]
- Vroegindewey, R.; Hodbod, J. Resilience of agricultural value chains in developing country contexts: A framework and assessment approach. Sustainability 2018, 10, 916. [Google Scholar] [CrossRef]
- Dorward, A.; Anderson, S.; Bernal, Y.N.; Vera, E.S.; Rushton, J.; Pattison, J.; Paz, R. Hanging in, stepping up and stepping out: Livelihood aspirations and strategies of the poor. Dev. Pract. 2009, 19, 240–247. [Google Scholar] [CrossRef]
- Poulton, C.; Dorward, A.; Kydd, J. The future of small farms: New directions for services, institutions, and intermediation. World Dev. 2010, 38, 1413–1428. [Google Scholar] [CrossRef]
- Medina, G.; Almeida, C.; Novaes, E.; Godar, J.; Pokorny, B. Development conditions for family farming: Lessons from Brazil. World Dev. 2015, 74, 386–396. [Google Scholar] [CrossRef]
- Martin, G.; Allain, S.; Bergez, J.-E.; Burger-Leenhardt, D.; Constantin, J.; Duru, M.; Hazard, L.; Lacombe, C.; Magda, D.; Magne, M.-A. How to address the sustainability transition of farming systems? A conceptual framework to organize research. Sustainability 2018, 10, 2083. [Google Scholar] [CrossRef]
- Campbell, R. A framework for inclusive market systems development. In LEO Brief; USAID: Washington, DC, USA, 2014. [Google Scholar]
- Ramirez, M.; Clarke, I.; Klerkx, L. Analysing intermediary organisations and their influence on upgrading in emerging agricultural clusters. Environ. Plan. A 2017. [Google Scholar] [CrossRef]
- Schiere, J.B.; Darnhofer, I.; Duru, M. Dynamics in farming systems: Of changes and choices. In Farming Systems Research into the 21st Century: The New Dynamic; Darnhofer, I., Gibbon, D., Dedieu, B.E., Eds.; Springer: Berlin, Germany, 2012; pp. 337–363. [Google Scholar]
- Duncan, A.; Teufel, N.; Mekonnen, K.; Singh, V.; Bitew, A.; Gebremedhin, B. Dairy intensification in developing countries: Effects of market quality on farm-level feeding and breeding practices. Animal 2013, 7, 2054–2062. [Google Scholar] [CrossRef] [PubMed]
- Veldwisch, G.J.; Beekman, W.; Bolding, A. Smallholder irrigators, water rights and investments in agriculture: Three cases from rural Mozambique. Water Altern. 2013, 6, 125–141. [Google Scholar]
- Department for International Development (DFID). Sustainable Livelihoods Guidance Sheets; Department for International Development: London, UK, 1999. [Google Scholar]
- Darnhofer, I.; Gibbon, D.; Dedieu, B.E. Farming Systems Research into the 21st Century: The New Dynamic; Springer: Berlin, Germany, 2012; p. 490. [Google Scholar]
- Kebebe, E.G. Understanding Factors Affecting Technology Adoption in Smallholder Livestock Production Systems in Ethiopia: The Role of Farm Resources and the Enabling Environment. Ph.D. Thesis, Wageningen University, Wageningen, The Netherlands, 2015. [Google Scholar]
- Bosman, H.; Moll, H.; Udo, H. Measuring and interpreting the benefits of goat keeping in tropical farm systems. Agric. Syst. 1997, 53, 349–372. [Google Scholar] [CrossRef]
- Leonardo, W.J.; Bijman, J.; Slingerland, M. The windmill approach: Combining transaction cost economics and farming systems theory to analyse farmer participation in value chains. Outlook Agric. 2015, 44, 207–214. [Google Scholar] [CrossRef]
- Bijman, J.; Muradian, R.; Cechin, A. Agricultural cooperatives and value chain coordination. In Value Chains, Social Inclusion and Economic Development: Contrasting Theories and Realities; Helmsing, A., Vellema, S., Eds.; Routledge: Abingdon, UK, 2012; pp. 82–101. [Google Scholar]
- Odhong, C.; Wahome, R.; Vaarst, M.; Kiggundu, M.; Nalubwama, S.M.; Halberg, N.; Githigia, S. Dairy cattle management, health and welfare in smallholder farms: An organic farming perspective. J. Org. 2015, 2, 3–20. [Google Scholar]
- Arias, P.; Halam, D.; Krivonos, E.; Morrison, J. Smallholder Integration in Changing Food Markets; FAO: Rome, Italy, 2013. [Google Scholar]
- Zeleke, T.; Awulachew, S.B. Policy Analysis of Water for Productive Use among Smallholder Irrigators in Ethiopia; OXFAM America: Boston, MA, USA; Addis Abeba, Ethiopia, 2014. [Google Scholar]
- Poole, N.D.; Chitundu, M.; Msoni, R. Commercialisation: A meta-approach for agricultural development among smallholder farmers in Africa? Food Policy 2013, 41, 155–165. [Google Scholar] [CrossRef]
- Kenya National Bureau of Statistics (KNBS). Nandi County Statistical Abstract; Republic of Kenya, Kenya National Bureau of Statistics: Nairobi, Kenya, 2015.
- Kenya National Bureau of Statistics (KNBS). Nyandarua County Statistical Abstract; Republic of Kenya, Kenya National Bureau of Statistics: Nairobi, Kenya, 2015.
- van der Lee, J.E.A. Influence of proximity to input and output markets on dairy farming in Ethiopia and Kenya. in preparation.
- Jayakaran, R. The Ten Seed Technique; World Version China: Beijing, China, 2002.
- Francesconi, G.N. Cooperation for Competition: Linking Ethiopian Farmers to Markets; Wageningen Academic Publishers: Wageningen, The Netherlands, 2009. [Google Scholar]
- Amankwah, K.; Klerkx, L.; Oosting, S.J.; Sakyi-Dawson, O.; van der Zijpp, A.J.; Millar, D. Diagnosing constraints to market participation of small ruminant producers in northern Ghana: An innovation systems analysis. NJAS Wageningen J. Life Sci. 2012, 60–63, 37–47. [Google Scholar] [CrossRef]
- Gebremedhin, B.; Jaleta, M. Commercialization of smallholders: Is market participation enough? In Proceedings of the Joint 3rd African Association of Agricultural Economists (AAAE) and 48th Agricultural Economists Association of South Africa (AEASA) Conference, Cape Town, South Africa, 19–23 September 2010.
- Pearson, O.; Schmidt, M. Commodity individuation of milk in the Somali region, Ethiopia. Area 2017, 50, 213–221. [Google Scholar] [CrossRef]
- Kijima, Y.; Yamano, T.; Baltenweck, I. Emerging markets in the post-liberalisation period: Evidence from the raw milk market in rural Kenya. J. Afr. Econ. 2010, 19, 88–110. [Google Scholar] [CrossRef]
- Recha, C.W. Local and Regional Variations in Conditions for Agriculture and Food Security in Kenya; AgriFoSe2030 Report 7; Lund University, Sweden Egerton University: Njoro, Kenya, 2018. [Google Scholar]
- Makoni, N.; Mwai, R.; Redda, T.; van der Zijpp, A.J.; van der Lee, J. White Gold: Opportunities for Dairy Sector Development Collaboration in East Africa; Centre for Development Innovation, Wageningen UR: Wageningen, The Netherlands, 2014; p. 205. [Google Scholar]
- KDB. Website Kenya Dairy Board. Available online: www.kdb.co.ke (accessed on 15 September 2018).
- Bebe, B.O. Assessing potential for producing dairy replacements under increasing intensification of smallholder dairy systems in the Kenya highlands. Livest. Res. Rural Dev. 2008, 20, 24. [Google Scholar]
- Roessler, R.; Mpouam, S.E.; Muchemwa, T.; Schlecht, E. Emerging development pathways of urban livestock production in rapidly growing West Africa cities. Sustainability 2016, 8, 1199. [Google Scholar] [CrossRef]
- Gonzalez-Mejia, A.; Styles, D.; Wilson, P.; Gibbons, J. Metrics and methods for characterizing dairy farm intensification using farm survey data. PLoS ONE 2018, 13, e0195286. [Google Scholar] [CrossRef] [PubMed]
- Waithaka, M.M.; Thornton, P.K.; Herrero, M.; Shepherd, K.D. Bio-economic evaluation of farmers’ perceptions of viable farms in western Kenya. Agric. Syst. 2006, 90, 243–271. [Google Scholar] [CrossRef]
- Reardon, T. The hidden middle: The quiet revolution in the midstream of agrifood value chains in developing countries. Oxf. Rev. Econ. Policy 2015, 31, 45–63. [Google Scholar] [CrossRef]
- Lie, H.; Rich, K.M.; van der Hoek, R.; Dizyee, K. An empirical evaluation of policy options for inclusive dairy value chain development in Nicaragua: A system dynamics approach. Agric. Syst. 2018, 164, 193–222. [Google Scholar] [CrossRef]
- Royer, A.; Bijman, J.; Bitzer, V. Linking smallholder farmers to high quality food chains: Appraising institutional arrangements. In Quality and Innovation in Food Chains: Lessons and Insights from Africa; Wageningen Academic Publishers: Wageningen, The Netherlands, 2016; pp. 359–381. [Google Scholar]
- Mellor, J.W. High rural population density Africa—What are the growth requirements and who participates? Food Policy 2014, 48, 66–75. [Google Scholar] [CrossRef]
- Murage, P.; Ngigi, M.; Bebe, B.; Ndambi, O. Technical efficiency of smallholder dairy farms across dairy business models and associated determinants in the Kenya highlands. J. Rural Stud. 2018. submitted. [Google Scholar]
- Paul, B.K.; Frelat, R.; Birnholz, C.; Ebong, C.; Gahigi, A.; Groot, J.C.J.; Herrero, M.; Kagabo, D.M.; Notenbaert, A.; Vanlauwe, B.; et al. Agricultural intensification scenarios, household food availability and greenhouse gas emissions in Rwanda: Ex-ante impacts and trade-offs. Agric. Syst. 2018, 163, 16–26. [Google Scholar] [CrossRef]
- Tittonell, P. Farm typologies and resilience: The diversity of livelihood strategies seen as alternative system states. In Proceedings of the 5th World Congress on Conservation Agriculture, Brisbane, Australia, 26–29 September 2011. [Google Scholar]


| Country: | Ethiopia | Kenya | ||||
|---|---|---|---|---|---|---|
| Cluster Type: | LdLc | LdHc | LdHc | HdHc | HdHc | |
| Characteristics | Cluster Name: | Arsi | East Shoa | Nandi S | Nandi N | Nyandarua |
| Average farm size (ha) | 3.2 | 4.0 | 0.8 | 1.6 | 2.9 | |
| Proportion improved cattle | 55% | 34% | n.a. | 95% | 98% | |
| Feeding system (1) | grazing and residues | grazingand residues | grazing and residues | residues + planted fodder | residues + planted fodder | |
| Main cash crop(s) (2) | grains | various | tea | various | Potatoes | |
| Main marketing channel | traders | processors and coops | traders | coops | coops | |
| Milk demand | low | medium | low | medium | high | |
| Average est. milk sales (US$/yr) | 859 | 2,384 | 1,621 | |||
| Input service offer | low | low–med. | low | med–high | high | |
| Main service providers | public | public | private | private | private | |
| Country: | Ethiopia | Kenya | |||
|---|---|---|---|---|---|
| Cluster type: | LdLc | LdHc | LdHc | HdHc | HdHc |
| Cluster Name: | Arsi | East Shoa | Nandi South | Nandi North | Nyan darua |
| Upgrading Type | |||||
| Technical upgrading | |||||
| - specialization in ‘dairy as business’ | + | ++ | + | ++ | +++ |
| - investments in dairy genotypes | ++ | ++ | + | ++ | +++ |
| - investments in feeding | + | + | + | ++ | ++ |
| - investments in housing | + | + | + | ++ | +++ |
| - investments in animal health care | + | ++ | + | ++ | +++ |
| - specialization in high-value crops/livestock i.o. dairy | ++ | ++ | +++ | ++ | + |
| Value chain upgrading | |||||
| - more sophisticated input and output service arrangements | + | + | ++ | +++ | |
| - contracting and quality assurance | ++ | + | +++ | +++ | |
| - competition in service provision | ++ | + | ++ | +++ | |
| - transformation farmer organizations | + | + | ++ | +++ | |
| Institutional upgrading | |||||
| - role redefinition private–public | + | ++ | +++ | ||
| - enabling private sector services | + | + | + | ++ | +++ |
| - infrastructure development | + | ++ | ++ | ++ | +++ |
| - upgraded financial services | + | + | ++ | +++ | +++ |
| - quality standards for products | + | ++ | ++ | ||
| Clusters (with sub-Counties/Districts Where Study Sites Are Located) | No. of Villages (FGI Part.) | Management Level (% of Dairy Farms) (1) | Farm Size (ha) (2) | Herd Size | Milking Cows as % of herd | % Improved Cattle in Herd (2) | Main crops (2),(3) (Dominant Crops in Bold) | % hh w/Off-farm Activ. (2) | Non-Dairy Farms (% of hh.) | |||||
| Low | Medium | High | ||||||||||||
| Breed type | Local | Local and improved | Improved | |||||||||||
| Market focus | Within village | Mixed | Outside village | |||||||||||
| LdLc | Arsi (Limu-Bilbilo and Digalu-Tiyo) | 6 (42) | 61 | 39 | 3.2 | 6.5 | 31 | 55 | Cereals, pulses, vegetables | 42 | 13 | |||
| LdHc | East Shoa (Ada’a) | 3 (21) | 67 | 33 | 4.0 | 7.6 | 31 | 34 | Cereals, pulses, oil seed, veg. | 35 | 40 | |||
| Average for clusters Ethiopia | 64 | 36 | 3.4 | 6.9 | 31 | 45 | 40 | 27 | ||||||
| Farm Size (% of Dairy Farms) | ||||||||||||||
| Very sm. | Small | Medium | Large | |||||||||||
| Farm size (ha) | <2.5 | <2.5 | 2.5–8 | >8 | ||||||||||
| No.of dairy cows | 1–2 | 3–5 | 6–20 | >20 | ||||||||||
| LdHc | Nandi South (Aldai, Nandi South) | 6 (63) | 78 | 16 | 6 | 0 | 0.8 | 2.2 | 66 | n.a. | Tea, maize, RTB, veg., fruits | n.a. | 19 | |
| HdHc | Nandi North (Chesumei, Nandi North) | 6 (47) | 76 | 20 | 4 | 1.6 | 3.3 | 64 | n.a. | Maize, sugarc., tea, veg., fruits | n.a. | 25 | ||
| HdHc | Nyandarua (Ol Kalou, Kipipiri) | 9 (63) | 92 | 8 | 0 | 2.9 | 4.3 | 65 | 98 | Potatoes, cereals, pulses, veg. | 40 | 13 | ||
| Average for clusters Kenya | 87 | 11 | 1 | 1.8 | 3.3 | 65 | 19 | |||||||
| Output Service Arrangements with Integrated Input Services (If Any) | Input Service Arrangements (5) | ||||||||||||
|---|---|---|---|---|---|---|---|---|---|---|---|---|---|
| Service Delivery Model: | Local Market | Trader/Restaur. (1),(2) | Self-help group (3) | Cooperative (4) | Processor | Cooperative Company (4) | Processor w/Services | Independ. Suppliers | Dept. of Livestock | Dev. Agencies | |||
| Arrangement type: | Spot market | Relational contract | Formal contract | Multilateral contract | Formal contract | Equity participation | Vertical integration | Formal contract | Public services | Various | |||
| Prevalence in: | |||||||||||||
| Ethiopia | |||||||||||||
| Arsi | ++ | ++ | + | +/- | ++ | + | |||||||
| East Shoa | + | + | + | ++ | +/- | + | ++ | + | |||||
| Kenya | |||||||||||||
| Nandi South | +/- | ++ | +/- | + | +/- | +/- | |||||||
| Nandi North | +/- | + | + | ++ | + | ++ | +/- | ++ | +/- | +/- | |||
| Nyandarua | +/- | + | + | ++ | + | ++ | + | +++ | + | +/- | |||
| Output services offered to farmers | |||||||||||||
| Collection from farm | + | + | +/- | +/- | +/- | +/- | |||||||
| Chilling | +/- | +/- | +/- | +/- | +/- | ||||||||
| Transportation MCC to plant | +/- | + | +/- | + | |||||||||
| Quality testing at collection | +/- | + | + | + | |||||||||
| Input services offered to farmers | Eth | Ken | Eth | Ken | |||||||||
| Farm advice | +/- | +/- | + | +/- | +/- | ||||||||
| AI | +/- | +/- | + | + | +/- | ||||||||
| Veterinary services | +/- | +/- | +/- | + | + | + | |||||||
| Feed, forage, and drugs | +/- | + | + | + | +/- | ||||||||
| Linking to input suppliers | +/- | +/- | +/- | + | +/- | ||||||||
| Facilitate access to finance | +/- | + | +/- | +/- | |||||||||
| Input advancing (on credit) | +/- | + | +/- | ||||||||||
| Service Arrangement: | Local Market | Trader + Restaur. | Self-help group | Cooperative | Processor | Cooperative company | Processor w/ Serv. |
|---|---|---|---|---|---|---|---|
| Dominant farm size | Smallholders (peri-urban) | Resource-poor smallholders | Resource-endowed smallholders | Resource-endowed smallholders | Larger farmers, organized smallholders | Resource-endowed smallholders | Larger farmers, organized smallholders |
| Factors affecting choice | |||||||
| Payment period (days) (1) | direct | negotiable | <45 | <45 | <45 | <45 | <45 |
| Farmgate price (US/kg) (2) | |||||||
| - Ethiopia: milk | 0.35–0.90 | 0.55–0.75 | - | 0.35–0.65 | 0.35–0.70 | - | - |
| - Ethiopia: butter | 3–12 | 7–13 | - | - | - | - | - |
| - Kenya: milk | 0.30–0.45 | 0.30–0.50 | 0.28–0.37 | 0.26–0.34 | 0.26–0.37 | 0.26–0.34 | 0.26–0.37 |
| Milk buyer advances | - | cash | - | (inputs) | - | inputs | inputs |
| Proximity to services | <1 h | farmgate | ------------------- depending on location ------------------------- | ||||
| Country: | Ethiopia | Kenya | ||||
|---|---|---|---|---|---|---|
| Cluster Type: | LdLc | LdHc | LdHc | HdHc | HdHc | |
| Context factors | Cluster Name: | Arsi | East Shoa | Nandi S | Nandi N | Nyandarua |
| Biophysical | ||||||
| Climate/weather | +++ | ++ | ++ | ++ | +++ | |
| Absence of disease threat | + | + | ++ | |||
| Infrastructure | + | + | + | ++ | +++ | |
| Enabling environment | ||||||
| Policies promoting dairy | + | ++ | +++ | |||
| Policy space for private service prov. | + | + | ++++ | ++++ | ++++ | |
| Public disease prevention services | ++ | ++ | + | + | + | |
| Research–extension–farmer linkages | ++ | ++ | + | + | + | |
| Enforcement of service quality | + | ++ | + | |||
| Enforcement of milk quality | + | + | + | |||
| Access to finance | + | ++ | ++ | |||
| Chain upgrading facilitators | ++ | ++ | ++ | ++ | ++ | |
| Social environment | ||||||
| Dairy history and culture | +++ | +++ | +++ | +++ | +++ | |
| Dairy seen as business | + | + | ++ | +++ | ++++ | |
| Milk consumption | + | + | +++ | +++ | +++ | |
| Land availability | + | + | + | |||
| Labour availability | +++ | ++ | ++ | ++ | ++ | |
© 2018 by the authors. Licensee MDPI, Basel, Switzerland. This article is an open access article distributed under the terms and conditions of the Creative Commons Attribution (CC BY) license (http://creativecommons.org/licenses/by/4.0/).
Share and Cite
Van der Lee, J.; Klerkx, L.; Bebe, B.O.; Mengistu, A.; Oosting, S. Intensification and Upgrading Dynamics in Emerging Dairy Clusters in the East African Highlands. Sustainability 2018, 10, 4324. https://doi.org/10.3390/su10114324
Van der Lee J, Klerkx L, Bebe BO, Mengistu A, Oosting S. Intensification and Upgrading Dynamics in Emerging Dairy Clusters in the East African Highlands. Sustainability. 2018; 10(11):4324. https://doi.org/10.3390/su10114324
Chicago/Turabian StyleVan der Lee, Jan, Laurens Klerkx, Bockline Omedo Bebe, Ashenafi Mengistu, and Simon Oosting. 2018. "Intensification and Upgrading Dynamics in Emerging Dairy Clusters in the East African Highlands" Sustainability 10, no. 11: 4324. https://doi.org/10.3390/su10114324
APA StyleVan der Lee, J., Klerkx, L., Bebe, B. O., Mengistu, A., & Oosting, S. (2018). Intensification and Upgrading Dynamics in Emerging Dairy Clusters in the East African Highlands. Sustainability, 10(11), 4324. https://doi.org/10.3390/su10114324