2. Literature Review
Included in the Rome Treaty (1957), the Common Agricultural Policy (CAP) has been central to debates of the past few decades, as well as in supporting agriculture in European Union member states. But the increasing need for farm modernization and the protectionist attitude towards agricultural products led to significant changes in the CAP. The Food and Agriculture Organization of the United Nations [
6] defines, in “Codex Alimentarius”, organic agriculture as a “holistic production management system which promotes and enhances agro-ecosystem health, including biodiversity, biological cycles, and soil biological activity”. Moreover, the Council Regulation (EC) No.834/2007 of 28 June 2007 on organic production and labelling of organic products and repealing Regulation (EEC) No.2092/91 [
7] defines organic production as “an overall system of farm management and food production that combines best environmental practices, a high level of biodiversity, the preservation of natural resources, the application of high animal welfare standards and a production method in line with the preference of certain consumers for products produced using natural substances and processes”. According to Gold [
8], the United States Department of Agriculture defines organic agriculture as the ecological production management system that promotes and enhances biodiversity, biological cycles and soil biological activity. Organic agriculture is based on minimal use of off-farm inputs and management practices that restore, maintain and enhance ecological harmony. The development of each country depends on the economic and fiscal landscape, but also on subsidies for farmers, utilized agricultural area and employed persons. As such, for independent variables for the panel models we used percentage changes in fixed capital formation, subsidies and compensations of employees from the agricultural field. In this context, Brožová [
9] found that subsidies influenced the results of the organic agriculture process in the Czech Republic. Mader et al. [
10] found that the inputs of fertilizers and energy in organic agriculture are 34–53% lower than those of conventional agriculture, but led to smaller returns. From analysis of the mountain fields of Ethiopia, Agegnehu et al. [
11] found that the use of organic substances led to improved soil fertility and increased barley grain yields, a fact that may be used to significantly reduce the quantity of fertilizers used for long-term barley crops. Therefore, we used, as one of the independent variables, percentage changes in fertilizers and soil improvers. The study of Mohamad et al. [
12] on olive trees determined that the net present value and internal rate of return obtained in organic farming is larger than the conventional farming. Moreover, Cavigelli et al. [
13] found that organic systems with a two-year rotation period had the largest net present value and the highest average return. We, therefore, used the rate of change in net value added as an independent variable in the proposed data panel models. Between 2005–2014, the area utilized by organic farming in the European Union increased by 60%, with an increase of less than 44% for the EU-15 and an increase of 144% for the new member states. In the European Union, of the 10.3 million hectares of organic agricultural land, 7.3 million hectares were fully converted (7.7 million in Europe) and 1.4 million were under conversion (1.6 million in Europe) [
14]. Therefore, another independent variable considered was the percentage change in organic area and in utilized agricultural land. One of the disadvantages of conventional agriculture is the large-scale use of chemical products, such as fertilizers and pesticides, which harm the environment. To reflect this aspect, the percentage change in the production value of fertilizers and pesticides was used as another independent variable in the models.
From a microeconomic perspective, the opinion that conventional agriculture should be less lucrative than organic farming, according to Cobb et al., is still strongly debated. As stated by several authors, such as Dyson [
15], organic farming should be more advantageous from an ecological, social and economic perspective, as well as with respect to health and food safety. In this context, European agricultural policies provide the instruments for enhancing farm sustainability and promotion of the organic culture [
16].
For several decades, in some European regions some forms of sustainable agriculture have been implemented. These can be termed ecological in some countries and organic or biological farming in others, as stated in the European Commission Regulation no. 834/2007 [
7], with implementation features presented in the EU Regulation no. 889/2008 [
17]. This form of agriculture occurred as an alternative to conventional agriculture, an intensive and industrial form that developed mainly after the 1950’s. Conventional agriculture led to significant increase in production, as a consequence of using very productive inputs (seeds, hybrids, etc.) and also genetically modified organisms, together with a larger mechanization of processes and large-scale usage of water pipe-lines, fertilizers, pesticides and bio-stimulators [
2].
Over the last 40 years, conventional farming used to represent intensive agriculture displayed at least some of the following characteristics, according to Morgan and Murdoch [
18]: strategic thinking, superior levels of political governance, and a high degree of innovation with a focus on the increase in productivity. Efficiency is the defining element of conventional agriculture, expressed by an increase in annual yields, as a result of pesticides, fertilizers, vehicles, seed selection, etc.
In this case, productivity is mainly based on the usage of chemical substances. But the usage of chemical enhancers alters the environment and ecological systems, as well as affecting human health. These are the main reasons for which organic farming becomes an alternative to conventional farming, yielding positive effects on the sustainable development of the EU member states [
19]. The conventional agricultural system, although productive, has proven to be non-sustainable, as it requires very large investments and uses significant quantities of energy (even fossil fuels), that frequently overcome the quantity of energy that enters into the photosynthesis process. The energy of fossil fuels is used in the production of fertilizers and pesticides, in the large-scale mechanization of the agricultural processes, in production, packaging and storing of products, etc. These all contribute to increased pollution of the environment and to unpredictable and unmanageable ecological vulnerability [
20].
The occurrence of organic farming is considered as an expression of consumers’ mistrust in the food safety measures used in conventional agriculture, after frequent recurrences of diseases caused by the consumption of products with various exhaust emissions (carcinogens, teratogens, multi-resistant strains of bacteria, prion type diseases, allergens, etc.). According to the European Commission [
21], the term organic farming is used to characterize a type of agricultural process that utilizes fertilizers and natural pesticides (herbicides, insecticides and pesticides), such as bone meal, but excludes or strictly limits the utilization of different methods, such as fertilizers and petrochemical pesticides, hormones for accelerating crop growth, antibiotics for cattle, and genetically modified organisms.
Worldwide, the topic of organic farming versus conventional farming has generated intense debates. On one hand, Smil [
22] considers that intensive agriculture, that uses large quantities of inputs, such as fertilizers, pesticides, labour force and capital, has made it possible to obtain sufficient agriculture production to satisfy actual global needs. On the other hand, these practices have transformed agriculture into a major driver for changing the usage of agricultural areas, according to Goldewijk and Ramankutty [
23], UNEP [
24], and Soule et al. [
25], leading to environmental harm and to the deterioration of many habitats.
Patil et al. [
26] compared the economic and ecologic sustainability of conventional agriculture with that of organic farming. The study analysed the differences between conventional farming indicators and those related to organic farming, especially the economic indicators (returns, production costs, etc.) and environmental indicators (loss of nutrients, nutritional equilibrium, water usage) in two regions from India. The main results show that the organic farming has the potential to increase net profit, to reduce the risks of altered crops, and to reduce the impact on the environment [
27].
Analysis of key economic indicators illustrating the profitability of organic farming relative to that of conventional agriculture has been conducted in several studies, such as: Girardin et al. [
28]; Rigby et al. [
29]; Van der Werf and Petit [
30]; Halberg et al. [
31]; Halberg [
32].
In this respect, in order to address the major challenges facing the food sector at a global level, organic farming—aiming at the production of food with minimum effects on the ecosystems, animals and humans—is considered a future solution that benefits the consumers, according to De Schutter [
33]. Despite this, organic farming may have lower returns than conventional agriculture, according to Trewavas [
34] and Robertson et al. [
35]. Seufert and Ramankutty [
36] and Ponti et al. [
37] consider that, even though the organic farming is offering more nutritive products, the returns are lower than those obtained in conventional agriculture.
Finally, at the European level, agriculture as well as industry must respond to the need for sustainable development. Among the objectives of the 2020 Europe Agenda, some relate to sustainable economic growth based on organic farming, which is more efficient in terms of resource utilization. Therefore, we consider that agriculture will significantly contribute to achieving these objectives [
21].
At the same time, structural differences within the EU member states play an important role in assessing the impact of organic farming on the entire economy. In this respect, Staniszewski [
38] reveals how sustainable development in the EU shows important differences between the member states comprising EU-12 and EU-15.
Considering this, we aim to assess the impact of organic agriculture relative to conventional agriculture on the change in agriculture output, using macroeconomic indicators computed at the national level, for relevant European countries (the EU member states, excluding Croatia that became a member state in 2013, plus Norway and Switzerland).
3. Research Methodology
Panel data models were used to analyze the impact of the various measures of conventional and organic farming on the dynamics of agriculture production. The estimated methods for panel data models in EViews [
5] are panel least squares (for fixed effects) and panel feasible generalized least squares (for random effects), with the choice of the appropriate model determined using the Hausman test, according to Manole [
39].
The main advantages of using panel data are reduction of multi-collinearity, increase in the degrees of freedom, and control of heterogeneity of each of the panel units and variables that cannot be observed or measured [
40].
In order to assure comparability of data, we consider that it is necessary to have a uniform system of data collection and dissemination at the European level. Such a system may lead to increased transparency for the decision-making process and related marketing activities, ensuring information reliability for the general public and identifying fraud in international transactions, by comparing the data on production and trades between different countries. Sustainable development of the European countries may also provide these aspects.
In order to complete the study, we collected the data from the Eurostat database [
41].
Table 1 contains a short description of the selected variables.
Starting with the data collected for 29 European countries, we estimated the relationship between the change in agriculture production and some determinants, such as those associated with conventional farming, namely, the production of fertilizers, soil improvers, plant protection products, herbicides, insecticides and pesticides. We also considered the dynamics of gross fixed capital formation in agriculture, of subsidies on products and of compensation of employees. In order to assess the impact of organic farming, we used data representing the organic crop area and the utilized agricultural area as measures of the efforts made by authorities and companies to increase the efficiency of agriculture production in an environmental-friendly manner. Moreover, we considered net added value in agriculture as a variable that reflects the wealth accumulation derived from these processes.
We opted for panel data models as the number of observations is relatively small for each country, and the time frame considered contains the most recent available data (those for 2016).
Annual percentage changes were calculated for each variable, aiming to increase the comparability of data and to eliminate the potential effects induced by the different measurement scales of the variables.
We started from the hypothesis that the variables that impact the annual change of agriculture production are associated with both conventional and organic farming. Therefore, we considered the following research hypothesis:
Hypothesis 1 (H1). The intensive use of fertilizers has a positive influence on the annual change of agriculture production.
Hypothesis 2 (H2). The intensive use of plant protection substances has a positive impact on the annual change of agriculture production.
Hypothesis 3 (H3). Fostering the adoption of new technologies in the agriculture sector has a positive influence on the annual change of agriculture production.
Hypothesis 4 (H4). The intensive use of organic farming negatively influences the annual change in agriculture production.
In order to study these relationships, we used the panel data model, proposed by de Schmidheiny [
42], respectively:
where
i is the cross-section dimension (transversal section);
t stands for time (time series dimension);
α,
β are the equation’s coefficients;
is the
ith observation of the explanatory variables;
is the individual effect; and
is the residual.
The research methodology has been shaped to lead to a better description of the results that would reflect the achievement of the objectives. For development of the model and identification of its parameters we adopted the general procedure developed by Toda-Yamamoto [
43]. For statistical hypothesis testing we chose the significance threshold of 5% according to Andrei et al. [
44]. In order to find the appropriate model, we estimate both the fixed effect model and the random effect model, and select the most appropriate of the two based on Hausman test results [
39].
We collected the data from the Eurostat database for 29 European countries, of which 27 are member states of the European Union (except Croatia, where no available data were found), together with Norway and Switzerland (important trading partners of the European Union).
Consequently, the selected variables, representing the annual data from 2008–2016, are: the value of agriculture production at basic prices: the production value of fertilisers and soil improvers, plant protection products, herbicides and pesticides: gross fixed capital formation (excluding deductible VAT); subsidies on products; and compensation of employees. Data are expressed in million euro. Moreover, we considered the utilized agricultural area and organic crop area, expressed in hectares. In the following models, we will use the percentage change in these measures as the variables analysed in the regressions.
4. Results
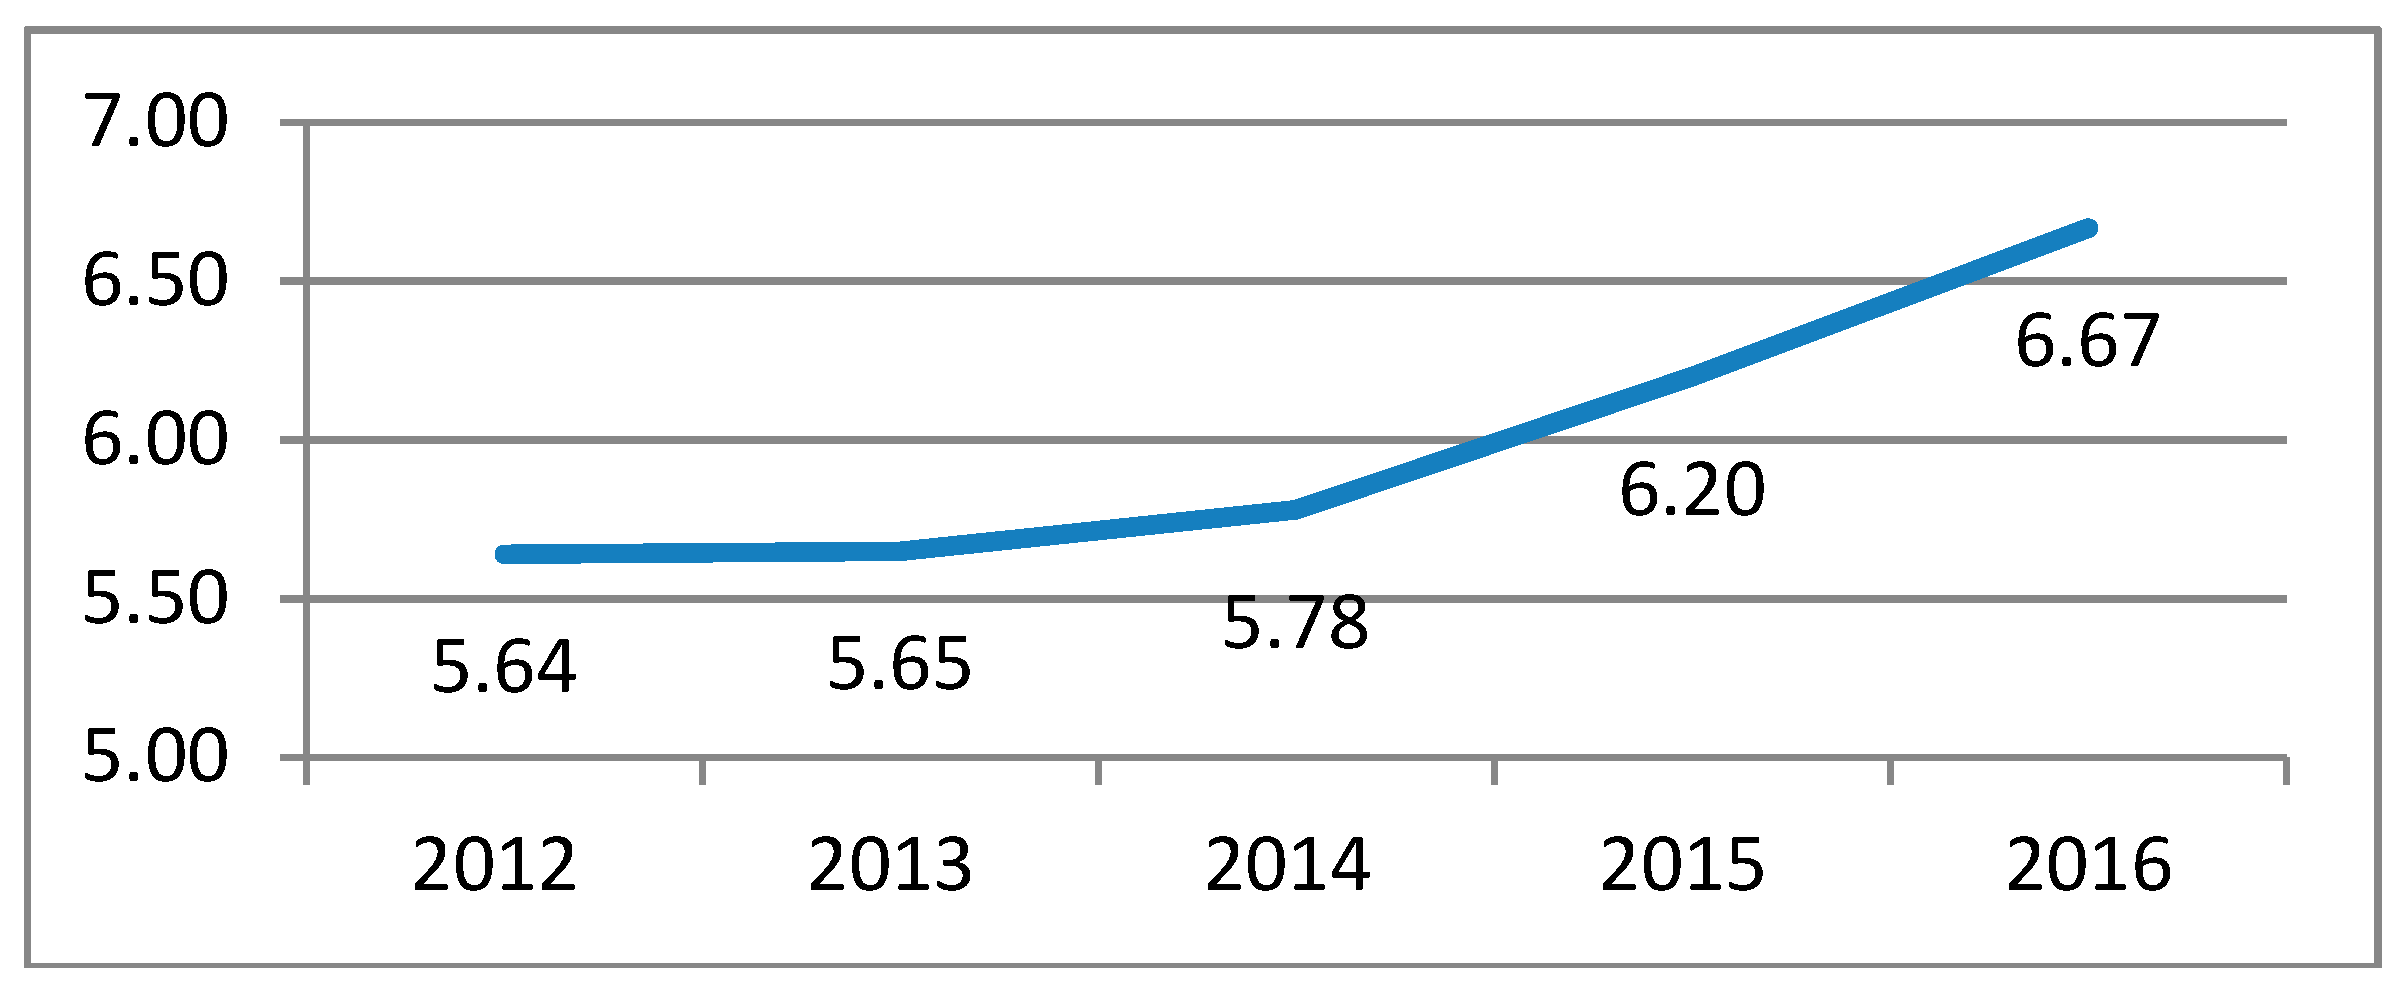
We start by emphasizing the importance given to organic farming in the European Union, as can be seen in
Figure 1, where the organic food area, as a percentage of the total utilized agricultural land, is depicted [
44]. The data used to make this graph are based on the organic farming definition included in the Council Regulation (EC) no. 834/2007 of 28 June 2007 on organic production and labelling of organic products and repealing Regulation (EEC) no. 2092/01 [
7].
From
Figure 1 we may observe the trend that is present at the European Union level, of increased organic crop area, even though the absolute level is still low and conventional farming remains predominant. Organic farming might be considered a component of sustainable rural development strategies and as an alternative for conventional farming. As such, in order to foster the development of organic farming, diversification of agriculture production seems necessary. However, the structure of agriculture production is mainly influenced by the consumers’ preferences.
Therefore, we can assert that organic farming contributes to the diversification of agriculture production by providing healthier and higher quality products that meet consumers’ preferences. For this reason, we used the percentage change of agriculture production as the dependent variable.
Furthermore, from
Figure 1, we can see that the annual rate of change in the organic crop area in the European Union was only 4% for the analysed period.
Before analyzing the impact that the selected independent variables have on the dependent variable, we analyse the main descriptive characteristics of the explanatory variables (see
Appendix A).
Between 2009 and 2016, the independent variables were not extremely volatile at each country level. For the FERT variable, of 29 analysed countries, in 10 countries (Denmark, Estonia, Latvia, Lithuania, Netherlands, Poland, Romania, Slovakia, Slovenia, Great Britain) the values were greater than the average, with the remaining 19 countries (Austria, Belgium, Bulgaria, Cyprus, Czech Republic, Finland, France, Germany, Greece, Hungary, Ireland, Italy, Luxembourg, Malta, Norway, Portugal, Spain, Switzerland and Sweden) having lower values. For the CAP_FORMATION variable, 11 countries (Czech Republic, Estonia, Ireland, Latvia, Lithuania, Luxembourg, Malta, Poland, Portugal, Slovakia and Switzerland) had values larger than the average of 0.020296 (representing an annual average change of gross fixed capital of 2.0296%), and the remaining 18 (Austria, Belgium, Bulgaria, Cyprus, Denmark, Finland, France, Germany, Greece, Hungary, Italy, Netherlands, Norway, Romania, Slovenia, Spain, Sweden and Great Britain) were lower than the average. For the PLANT_PROTEC variable, which measures the percentage change in the production of protection plant substances, for 11 countries (Bulgaria, Cyprus, Denmark, Estonia, Latvia, Lithuania, Poland, Portugal, Romania, Spain and Switzerland) the values were larger than the average, and for 18 countries (Austria, Belgium, Czech Republic, Finland, France, Germany, Greece, Hungary, Ireland, Italy, Luxembourg, Malta, Netherlands, Norway, Slovakia, Slovenia, Sweden and Great Britain) the values were below the average. Regarding the SUBSIDIES variable, 5 countries (Estonia, Ireland, Latvia, Slovakia and Sweden) had a value larger than the average, and the other 24 countries were below the average. For the COMPENS variable, 13 countries (Austria, Belgium, Bulgaria, Denmark, Estonia, Germany, Hungary, Latvia, Lithuania, Luxembourg, Slovakia, Sweden and Switzerland) had values larger than the average, and the remaining 16 (Cyprus, Czech Republic, Finland, France, Greece, Ireland, Italy, Malta, Netherlands, Norway, Poland, Portugal, Romania, Slovenia, Spain and Great Britain) were below the average. For the AREA variable, 12 countries (Estonia, Finland, France, Greece, Ireland, Latvia, Lithuania, Luxembourg, Malta, Portugal, Romania and Slovakia) had values that were larger than the average, while the other 17 countries (Austria, Belgium, Bulgaria, Czech Republic, Cyprus, Denmark, Germany, Hungary, Italy, Netherlands, Norway, Poland, Slovenia, Spain, Sweden, Switzerland and Great Britain) had lower values. 8 countries (Belgium, Bulgaria, Cyprus, Estonia, France, Malta, Poland and Spain) had more intensive dynamics of organic farming areas, compared to the average, the other 21 countries (Austria, Czech Republic, Denmark, Finland, Germany, Greece, Hungary, Ireland, Italy, Latvia, Lithuania, Luxembourg, Netherlands, Norway, Portugal, Romania, Slovakia, Slovenia, Sweden, Switzerland and Great Britain) had weaker dynamics.
In order to estimate the change in agriculture production, as shown by the AGR_PROD variable, that was generated by conventional and organic farming, we used the panel data models [
45]. First, we obtained model 1, where the dependent variable is AGR_PROD, and the independent variables are FERT, PLANT_PROTEC, CAP_FORMATION, D(SUBSIDIES), COMPENS, AREA and ORGANIC, the results being presented in
Table 2. In order to decide which model type is appropriate, we used the Hausman test [
45] that revealed that the random effect model is appropriate. In this model, we considered the first difference of the SUBSIDIES variable, as the initial variable (that measures the percentage change in subsidies) was found to have a unit root.
Model 1 shows a positive relationship between the change in agriculture production and those variables that characterize conventional farming, such as the change in production and usage of fertilizers or plant protection substances. This result confirms the empirical observations that emphasize the positive impact of the measures, adopted in order to enhance the efficiency of conventional farming, on the change of the agriculture production. From
Table 2, the coefficient for the change in production and usage of fertilizers is 0.260 and for the change in the production of plant protection substances it is 0.1190, both being statistically significant. As such, from
Table 2, we observe that a 1% increase in the production of fertilizers will generate an increase of 0.260% in agriculture production, revealing the existence of a positive relationship between the change in production of fertilizers and the change in agriculture production. Thus, we can confirm the H1 hypothesis. Moreover, 44.03% of the variance of the dependent variable AGR_PROD is explained by the independent variables.
The identified positive relationship also implies that the dynamic of agriculture production has not yet reached its full potential, considering gross fixed capital, the technologies and machineries used in agriculture. For example, using the decreasing returns to scale hypothesis, which asserts decreasing marginal returns once the use of inputs becomes more intensive, from the equation that is presented in
Table 2 we may derive that there is enough space to use the technologies associated with intensive conventional farming aimed to increase agriculture production. However, these technologies must not harm the environment and not lead to severe changes in soil properties, in order to obtain healthier food without additives.
In this context, it is worth mentioning that, because of the development disparities between the European Union member states, less developed countries (such as Bulgaria, Romania, Greece, Cyprus etc.) have not implemented large-scale advanced technological solutions for agricultural processes. As such, the increase in agriculture production in these states may require the expansion and diversification of the mechanization of agriculture, because it increases the labour productivity and provides better quality and more timely services with associated cost decreases and larger crops. Moreover, by using machineries in large scales, the crops are better serviced and, therefore, measures are implemented to ensure sustainable development of agriculture in these European countries, such as protecting the environment and the health of the population.
Alongside conventional farming methods, based on fertilizers and soil improvers, in the European Union, increasing importance is given to the reinsertion of the results associated with the circular economy (such as compost) into agricultural processes, in order to increase agriculture production and reduce greenhouse gas emissions and the prices of secondary raw materials. These solutions are particularly implemented in developed European countries, such as Switzerland, Norway and Sweden, as intermediary steps towards a sustainable ecological agriculture.
From model 1, presented in
Table 2, a 1% increase in the production of plant protection substances will generate an increase of 0.1190% for agriculture production, a positive relationship that is statistically significant and validates the H2 hypothesis. This result also confirms the empirical observations regarding the positive impact of the focus of companies that operate in agriculture towards the use of plant protection substances.
The positive relationship between gross fixed capital, as measured by the CAP_FORMATION variable, and the change in agriculture production (1% increase in gross capital formation will generate an increase of 0.0933% in agriculture production), validates the H3 hypothesis.
On the other hand, the coefficients for AREA and ORGANIC variables are both negative and not statistically significant at the 5% threshold. These values are explained by the need to invest significant resources in order to expand the organic crop area (compared to the intensive means that correspond to conventional farming), especially in the early stage of development, that impact the efficiency and the annual change in agriculture production. The negative relationship between the dynamics of organic farming areas and the annual change in agriculture production validates the H4 hypothesis.
The Fisher probability associated with model 1 is less than the 5% threshold, meaning that the model is well specified, and identifies a relationship between the dependent variable AGR_PROD and the selected independent variables given by:
But using this equation must take into consideration the limits of econometric models, such as the restrictive conditions that must be met by the independent variables (such as stationarity, to avoid spurious correlation between variables). Moreover, model 1 might be carefully used to estimate the future values of the dependent variable, as there may be some other variables that impact the former (not specified by the model), as well as some statistical properties of the selected variables (endogeneity, for example).
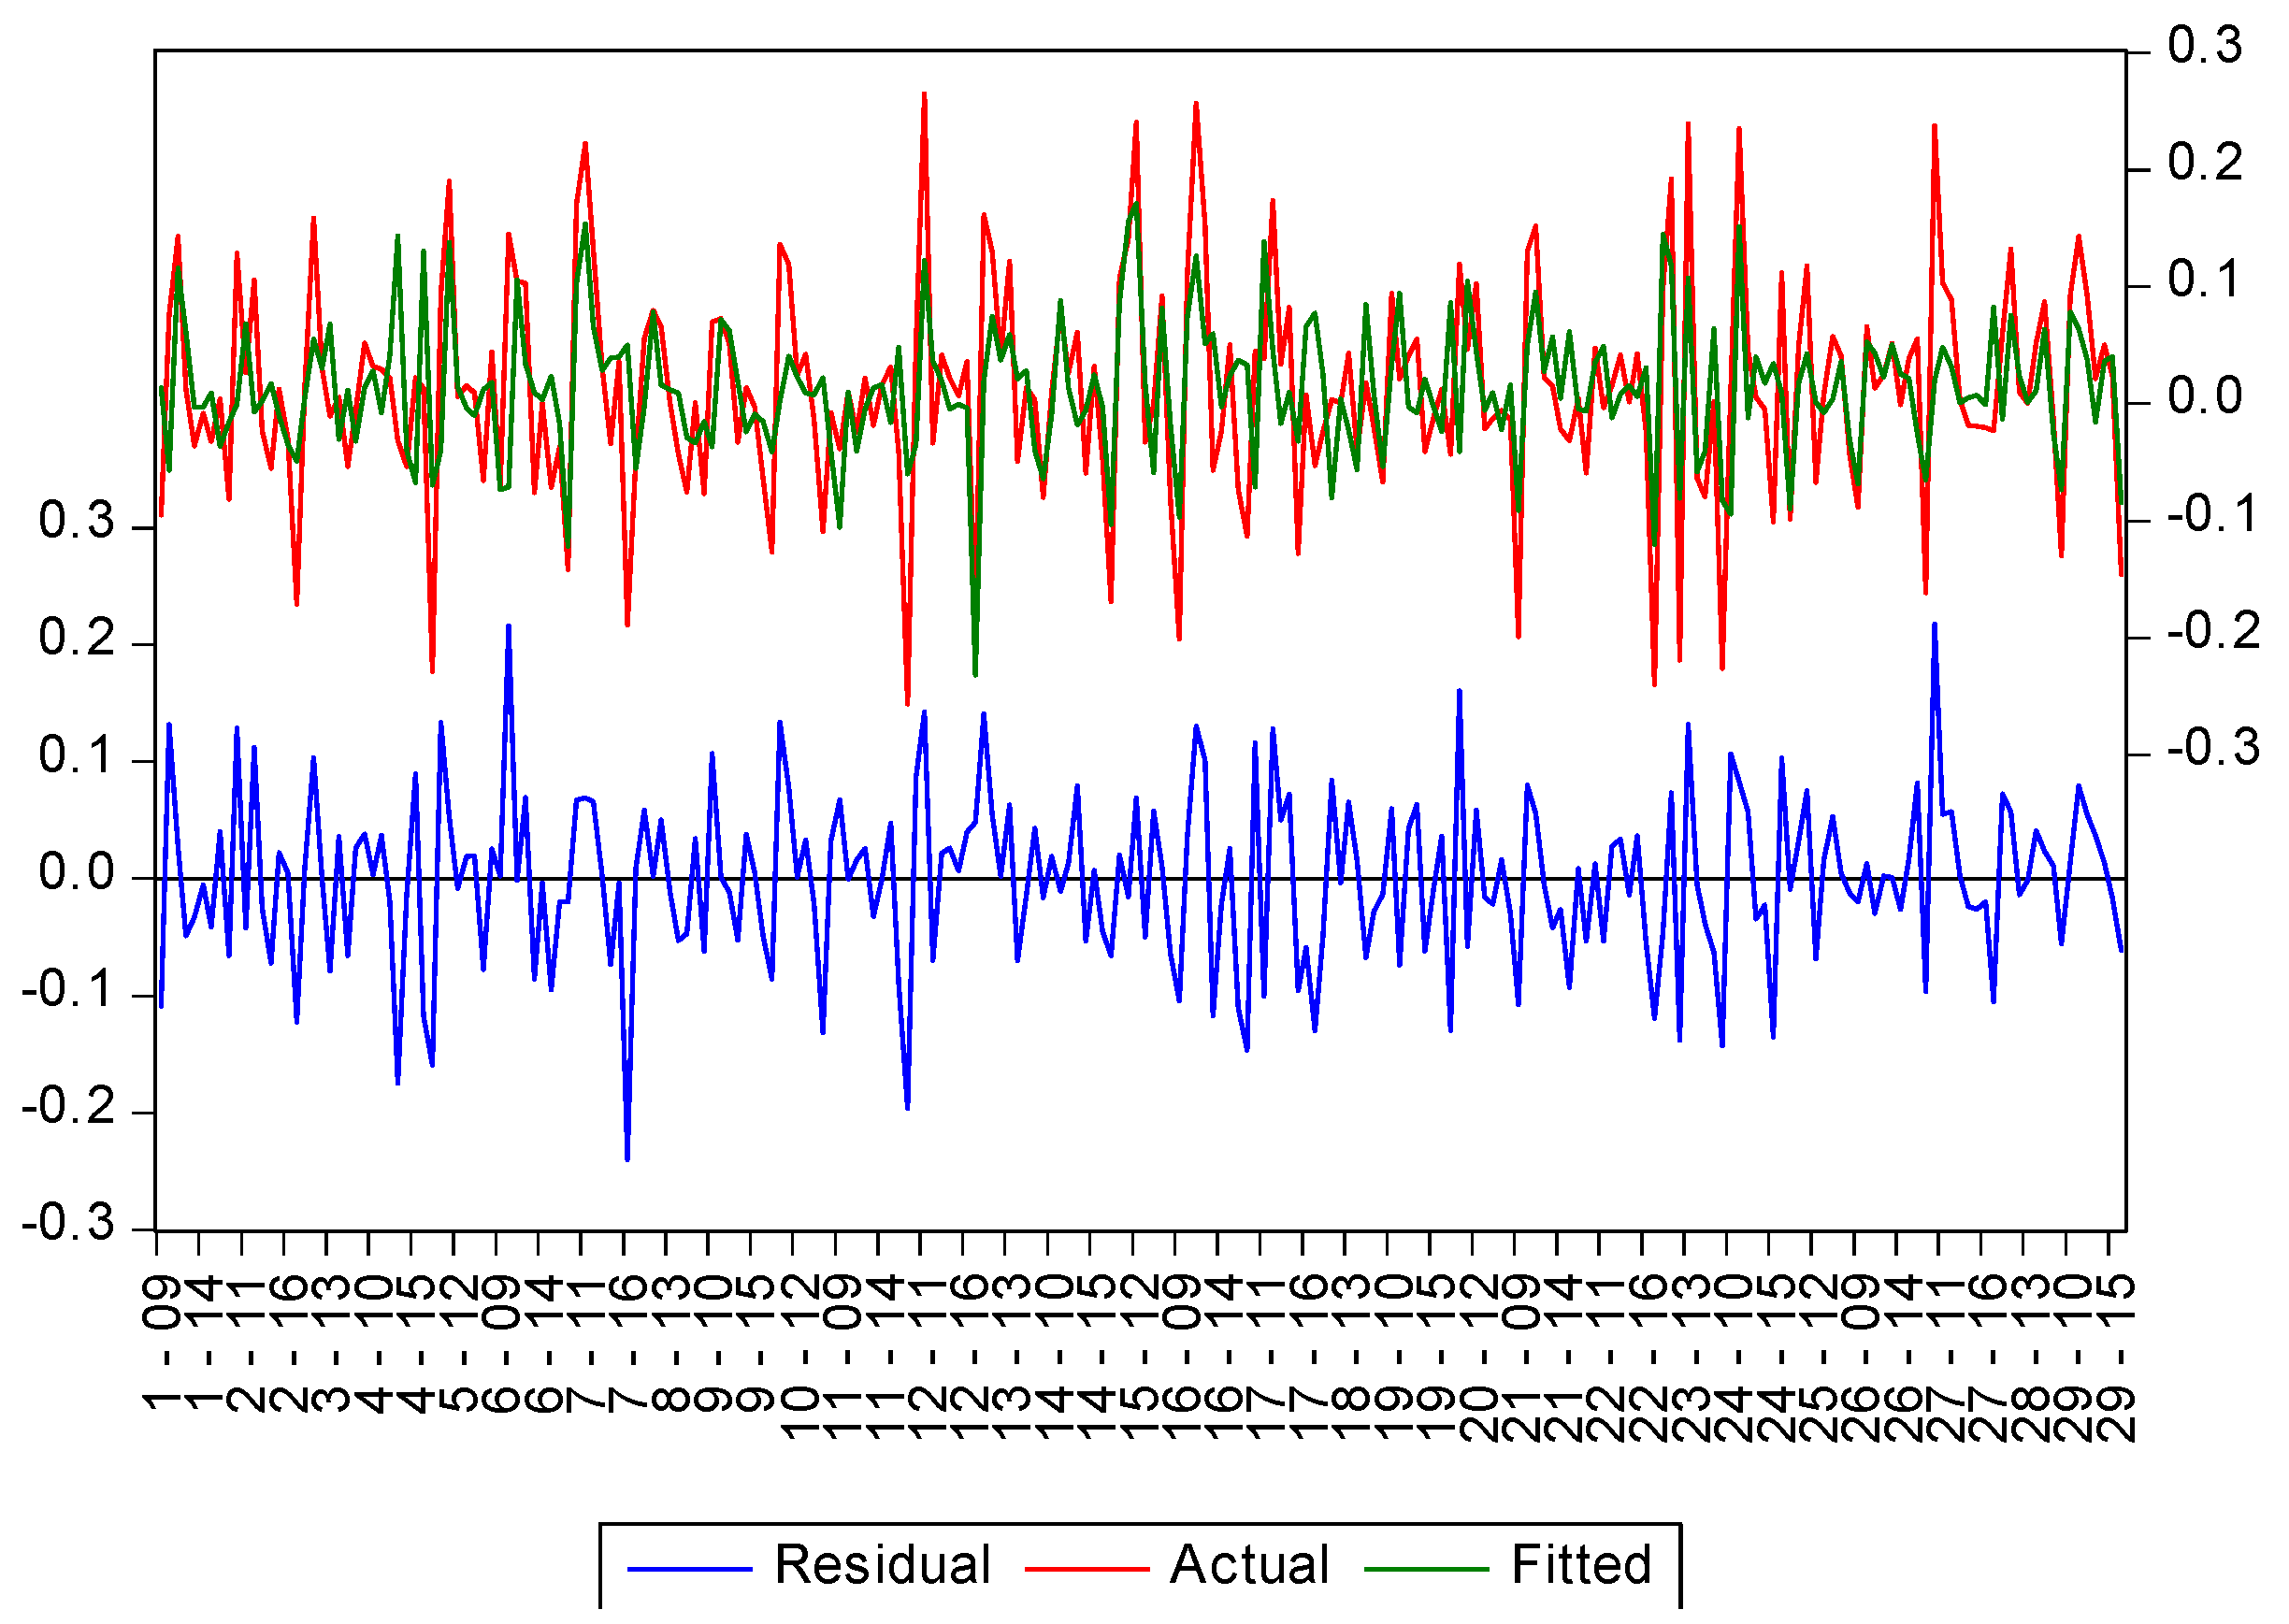
In order to assess the appropriateness of model 1, we use the figure presented in
Appendix B that graphically represents the actual, residual and fitted values for the dependent variable. From this figure it can be appreciated that network points are uniformly distributed without gaps, so it is concluded that the relationship between the independent variables that characterize conventional versus organic farming and the rate of change in agricultural production in 29 EU countries is linear.
We continue the analysis by removing the variables with statistically non-significant coefficients, obtaining model 2, in which the dependent variable is AGR_PROD. According to the results of the Hausman test, the random effect model is appropriate, and the main features of the model are presented in
Table 3.
In model 2, where the R-squared value is marginally diminished, we find a positive relationship between the change in agriculture production and measures of conventional farming (such as the percentage change in production of fertilizers and soil improvers, in production of plant protection substances, or in gross fixed capital formation) and a negative relationship between the dependent variable and the AREA variable (as a loose proxy for organic farming). Model 2 has an R-squared equal to 41.78% (meaning that, ceteris paribus, 41.78% of the variance of the dependent variable is explained by the independent variables) and a Fisher probability that is less than the 5% threshold, meaning that it is correctly identified. Moreover, all the independent variables have coefficients that are statistically significant, with the same signs as those from the corresponding variables from
Table 2.
In order to enhance these models, we include, as an independent variable, the change in the net added value in agriculture. This is a measure of an incentive for making new investments in this sector (as the perspective of future gains justifies new investments), and is also an indicator of the result of agriculture production (that may be used to analyze future investments).
Table 4 presents the main features of model 3.
Model 3 reveals that the positive relationships found in
Table 2 still hold, namely, those between the annual change in agriculture production, on the one hand, and, on the other, the annual change in production of fertilizers and soil improvers, the annual change in production of plant protection substances, the annual dynamics of subsidies and the annual change in gross fixed capital formation. From
Table 4 we can also observe that the negative relationship between the selected measures of organic farming (the annual change in utilized agricultural area and organic crop area) still holds. The slight difference occurs in the COMPENS coefficient, although statistically non-significant at the 5% threshold, it becomes negative (due to the introduction of the new independent variable). The coefficient of the NVA independent variable is positive and statistically significant, revealing that the perspective of future gains in agriculture remains a main driver for investments in this field. The obtained results show the benefits of the use of new technologies in agriculture, as they enhance productivity and efficiency of the inputs, including capital.
The Fisher probability associated with model 3 is below the 5% threshold, meaning that the model is correctly identified, and the independent variables collectively explain 52.5075% of the variance of the dependent variable AGR_PROD, with the regression given by:
But again, we may only carefully use the relationship given by model 3 to estimate the values of the dependent variable, as there are some other independent variables not considered in the model (as indicated by the R-squared value of 0.5251) or there are possible situations of endogeneity of independent variables (that might be explored in future research papers).
Despite these limitations, model 3 is relevant as it reveals that the changes that occurred in conventional farming have a positive impact on the annual changes of agriculture production, meaning that the full potential of this sector has not yet been reached for the selected countries (after which, the decreasing returns to scale theories are expected to apply). As such, the study provides an additional reason for the use of fertilizers and plant protection substances, but in a sustainable manner, as part of a larger European Union set of policies, aimed to transform the traditional economy into a circular one.
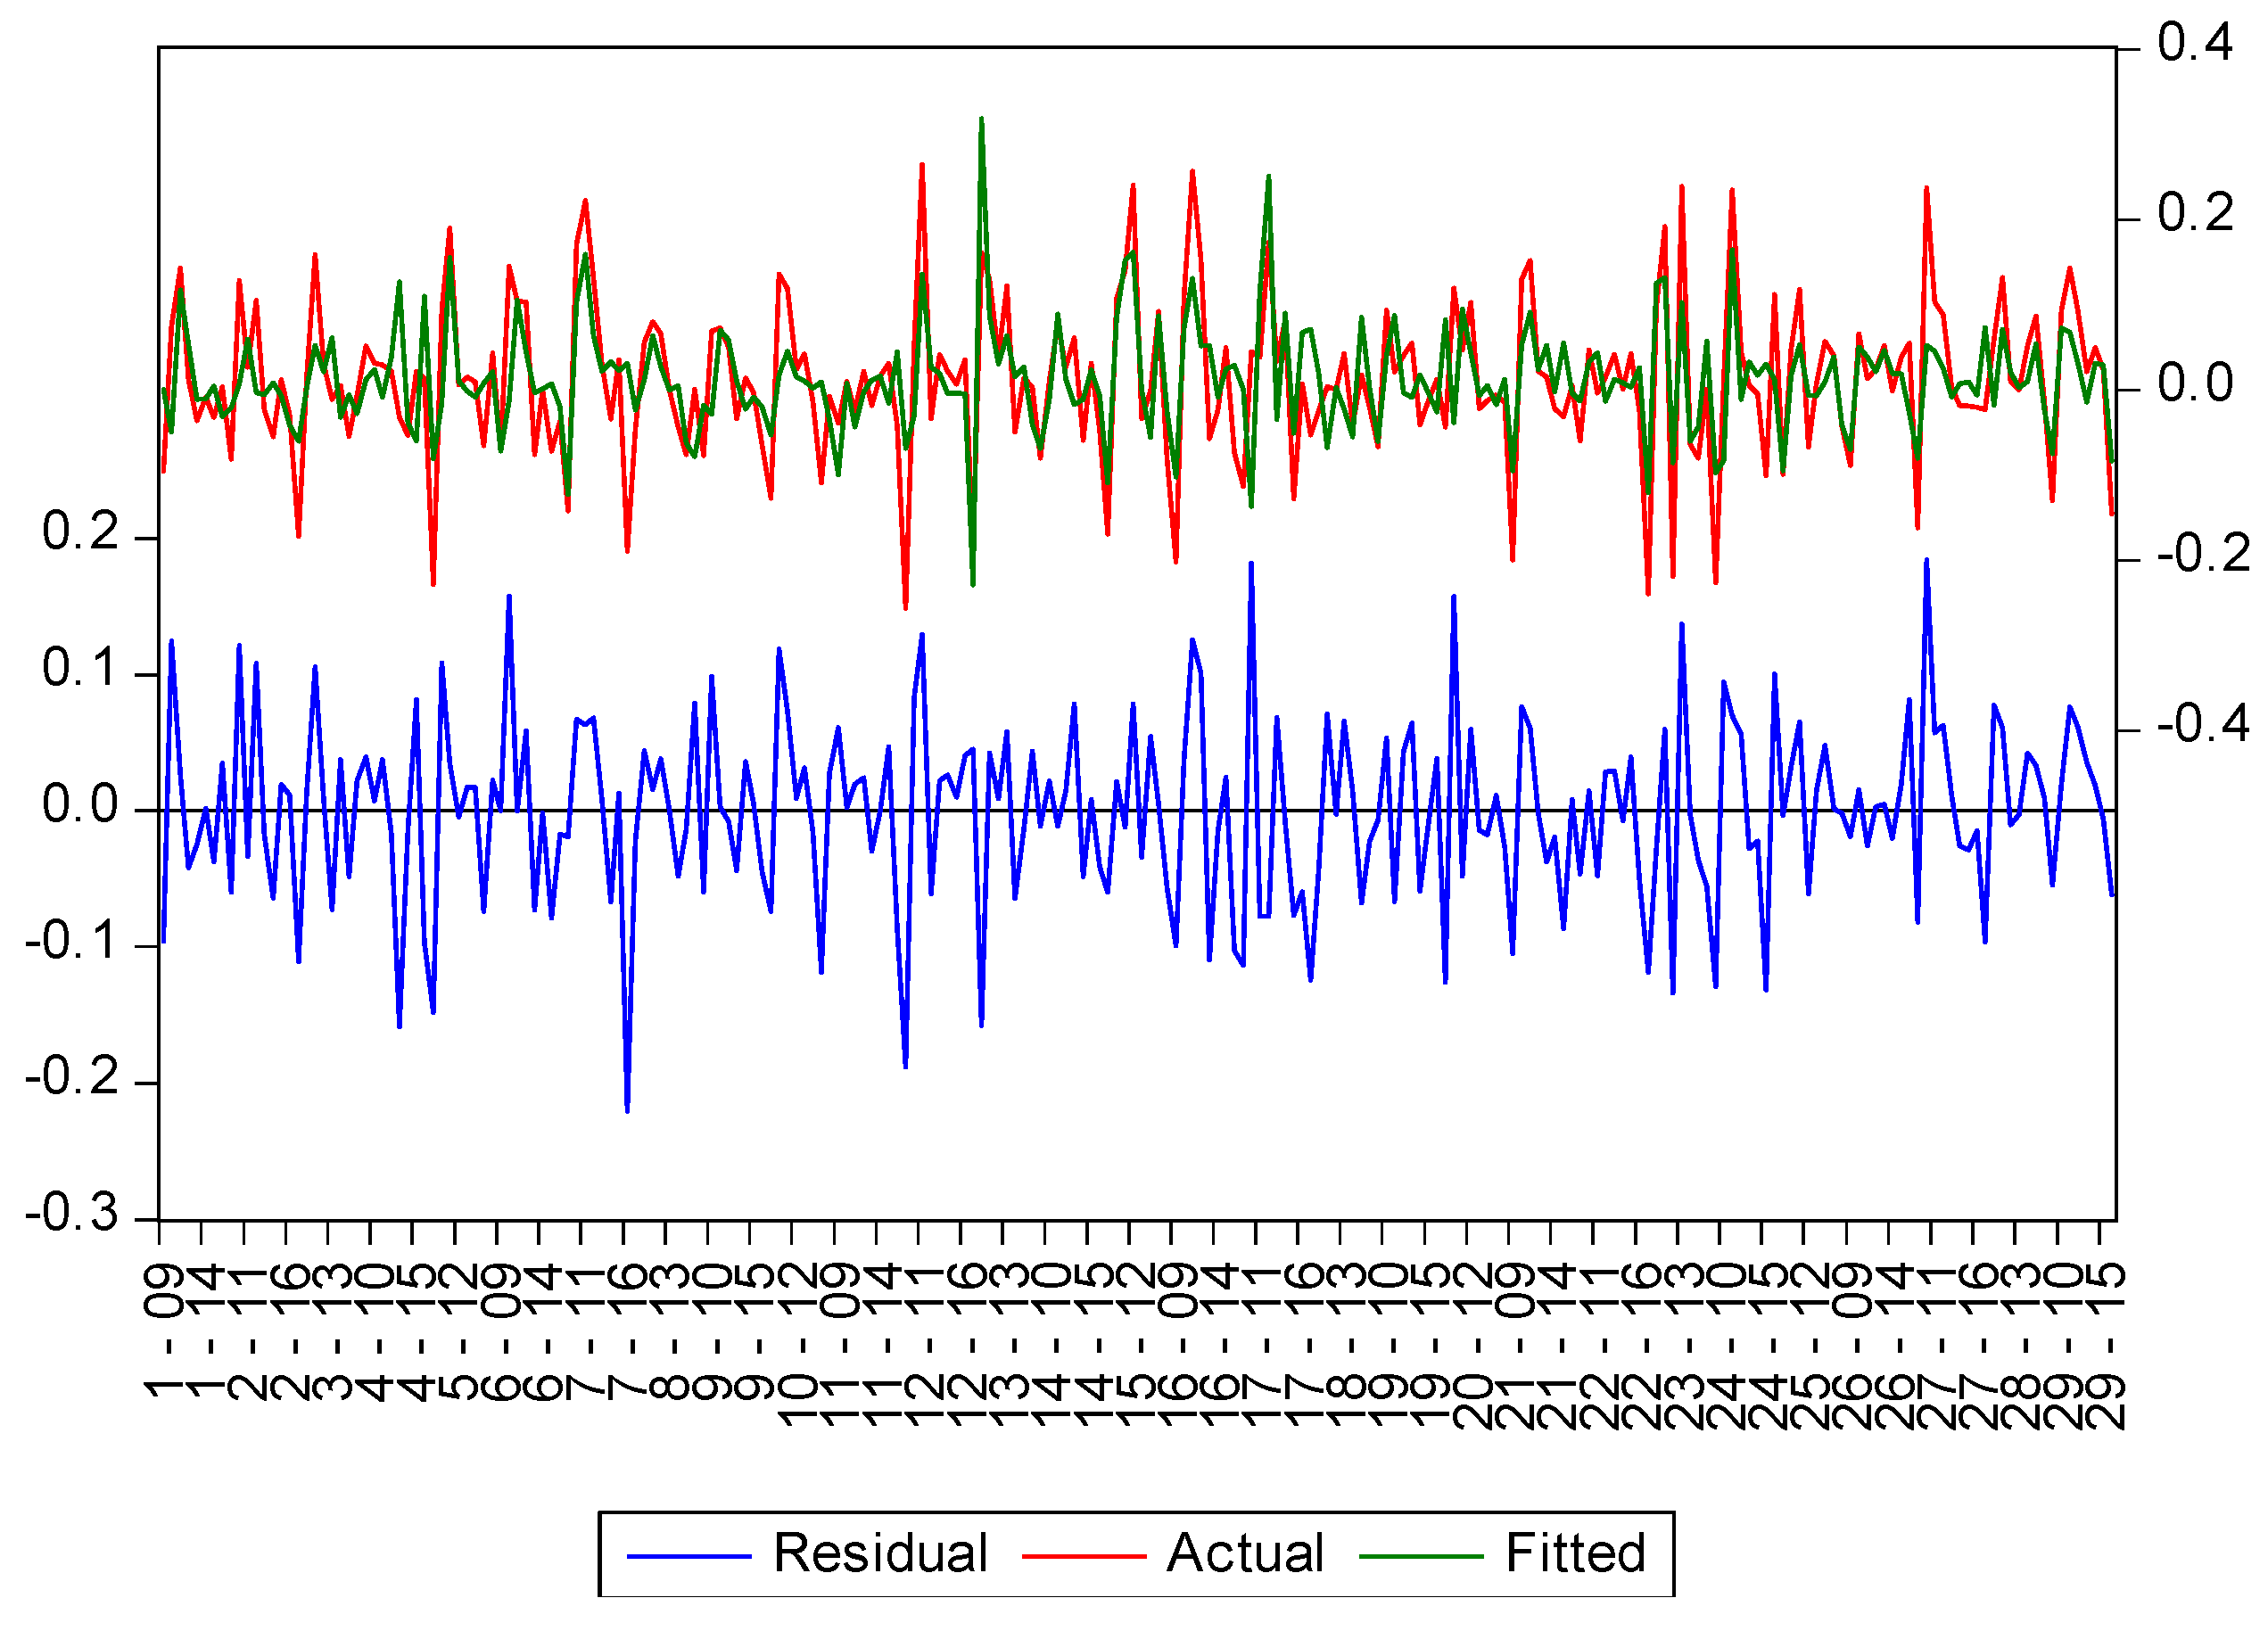
Analyzing the chart presented in
Appendix C, we see that the network points are uniformly distributed, without gaps between them and, therefore, we may assert that the relationship between the independent variables, which characterize conventional versus organic farming, and the rate of change in agricultural production in 29 European countries is a linear one.
On the other hand, the negative relationship identified in each model between the annual change in the organic farming area and the annual change in agriculture production has the potential to emphasize the need for finding proper and adequate mechanisms aimed to dampen the temporary negative effects induced by the conversion of conventional farming areas into organic farming areas, according to Ponti et al. [
37]. This study emphasized the fact that organic farming returns from the analysed countries represent, on average, 80% of the average returns from conventional farming.
These regressions were made considering the existence of relationships between the dependent variable AGR_PROD and the selected independent variables. But we may also find some bilateral correlations between the independent variables that confirm the empirical observations from this field d [
46].
Considering the 232 observations of the independent variables (corresponding to the 2009–2016 time frame),
Appendix D depicts the correlations between the variables. In order to obtain significant econometric results, the correlations between the variables should be low [
47]. From
Appendix D, a weak negative correlation is found between the annual change in the production of fertilizers and the annual change in organic farming area (−0.0493), a finding that is convergent with the European Union policy of obtaining sustainable agriculture. At the same time, the annual change of gross fixed capital formation has a positive low intensity relationship with the annual change in the production of fertilizers and soil improvers (0.2383).
These correlations are explained by the evolutions in agriculture, mainly the companies’ orientation towards the use of performing technologies (a factor of intensive farming), but also by the intrinsic relationship between fertilizers and the dynamics of the organic farming areas. The correlations from
Appendix D justify the use of these variables as independent variables in the proposed models and the obtained results.
5. Discussions
Although specific financial instruments to reduce the negative effects of crises affecting the European continent, such as the EU Solidarity Fund and European Globalisation Adjustment Fund (EGF), were developed at the EU level, none offered support for agriculture [
48].
The increased costs of agricultural output have impacts on the whole distribution chain, leading to increased prices. This situation led to the consumers’ dilemma, as it was observed that most consumers prefer conventional products, not those that are certified and more expensive. As such, in emerging economies, the development of organic agriculture is volatile. Despite this, over the medium- and long-term, the organic agriculture field will develop, as it is an adequate solution for the development of emerging countries (even though the allocated funds for agriculture will decrease). Considering the results presented in this article, the impact of organic agriculture on the CAP can be observed.
The European financial framework for agriculture in 2014–2020 leads to a major change in paradigms, including an increase of organic farming’s share compared to conventional farming at the member state level. The member states are grouped in five clusters depending on the importance given to the CAP objective in terms of the sustainability of food production, the sustainable management of natural resources and balanced territorial development (see
Table 5) [
48].
Considering the existence of these clusters at the European Union level that are related to the policies applied to agriculture, future research may include analysis regarding structural changes and productivity in organic agriculture, increased organic farming competitiveness, financial stimulus to foster the development of organic farming, and research and innovation as measures to overcome ecological problems, which together may consolidate European consumers’ trust in organic products.
The conclusions of this study reveal that organic farming should be seen as a technological alternative to conventional farming, regarding their relative performances, to attain food safety of the population. This is due to the characteristics of organic farming that lead to a competitive usage of land, such as the great potential for developing new technologies with lower costs and energy consumption, that are locally available, to produce food, according to Badgley et al. [
45]. Therefore, the main challenge that is raised for organic farming is to have a constant increase of production that satisfies demand, maintaining the consumers’ trust. It is essential that long-term value added is guaranteed [
49].
Investments made in the organic farming sector are still low in some European countries, as our study has shown, as the discrepancies between the analysed countries, in terms of the economic stages of development, persist. This is why European Union member states need to ensure that their business cycles are synchronized to ensure an effective implementation of common policies. However, the level of synchronization is also reduced by market differences between old and new European Union members, given their specific farming practices, according to Da-Rocha and Restuccia [
50].
Considering the favorable aspects for the medium- and long-term global development of organic farming, it is emphasized that the dynamics of organic farming will be positive in the future. This positive evolution is due, mainly, to the increased attention paid by society to healthier and more balanced living [
8]. Moreover, the positive evolution of organic farming compared to conventional farming in each of the European Union member states depends primarily on economic and fiscal conditions, as well as on the supportive measures dedicated to farmers, utilized agricultural areas and the available work force. We may conclude that Europe is the continent where the share of consumption of organic products per capita is significant [
51].
As a paradox, the constraints faced by farmers that try to enter into the organic farming sector are a consequence of the exponential development of this sector, according to Luchs et al. [
52]. These constraints can be mainly on the financial side, such as the difficulty of attracting investments, the limited capacity of contracting agricultural loans, the expenditures associated with the certification process, the lack of governmental support, the level of subsidies received for every hectare, and the lack of capacity to access European funding. Secondly, there can be technical constraints, such as the serious fragmentation of the agricultural area. Thirdly, there also can be administrative constraints, such as excessive bureaucratization, and the lack of a legal framework and professional statutes given to farmers. Lastly, there also can appear some social constraints, such as the lack of adequate sources for final consumers to realize and promote the advantages offered by organic products; this could include an informed analysis of the certificated and non-certificated products from the same area. These constraints harm the development of the organic farming sector. As such, in 2017 the European Commission implemented measures at the European level to support sustainable agriculture:
creating organizations of producers (that enable farmers to collectively sell their products, with an increased influence in the market and in the food supply chain);
implementing new cooperative and associative structures that may lead to a greater advantage in the market for farmers, enhancing profit margins and competitiveness;
launching new types of specialized productive sectors, such as organic farming;
developing contractual relations in the food supply chain;
founding of mutual funds and insurance schemes that help farmers to better tackle market volatility the severe price drops.
These measures are confirmed by the new CAP, which recognizes the importance of organic farming in the overall economy by allocating subsidies for organic conversion and maintenance with a value of EUR 6.3 billion, representing 6.45% of the European Agricultural Fund for Rural Development (FEADR) budget over the 2014–2020 time frame [
20].
Moreover, the fact that some standards are not mandatory for producers led to an increased need for an ecological marketing, aimed to inform and educate consumers regarding the benefits associated with the production and consumption of the organic products, mainly on human health and environment, according to Davis [
53].
When modeling the panel data, we faced some limitations. First of all, we found that the macroeconomic variables that characterize organic farming were not homogeneous across European countries and, as a consequence, the comparability of data is harmed. As such, in the second stage, we tried to make a hierarchy of the selected countries according to their development stage, namely developed, developing and emerging countries. By using panel data models, the obtained R-squared values were close to 1. These limitations were also confirmed by international statistical institutions (such as Eurostat [
41] and the FAO [
6]), that aimed to develop—without relevant success—statistical data on organic farming, demand, sales and prices. Although a relatively small number of countries has succeeded in collecting actual and relevant data, the cross-country comparability of data is still an issue, as every institution and country has developed their own system of data collection and defined their own categories of organic products


