Article

Potential European Emissions Trajectories within the Global Carbon Budget

1
Consorzio Interuniversitario Nazionale per la Scienza e la Tecnologia dei Materiali (INSTM), c/o Dipartimento di Chimica, Università degli Studi di Firenze, Via della Lastruccia 3, 50019 Sesto Fiorentino, Firenze, Italy
2
Global Sustainability Institute, Anglia Ruskin University, East Road, Cambridge CB1-1PT, UK
3
Institute of Marine Sciences (ICM-CSIC), Passeig Marítim de la Barceloneta 27–39, 08003 Barcelona, Spain
*
Author to whom correspondence should be addressed.
Sustainability 2018, 10(11), 4225; https://doi.org/10.3390/su10114225
Submission received: 16 October 2018 / Revised: 8 November 2018 / Accepted: 12 November 2018 / Published: 15 November 2018

Abstract

:
The Paris Agreement, ratified in 2015, pledged to reduce greenhouse gas emissions within a Global Carbon Budget that limits the global temperature increase to less than 2 °C. With the Roadmap 2050 mitigation measures, the European Union has a target to reduce emissions by 80% of their 1990 value by 2050 but without giving an estimation or a maximum ceiling for the total amount of cumulative greenhouse gases emissions over that period. Thus, the impact of the EU regulations on global warming remains unestimated. The aim and the novelty of this study are to develop a set of potential European emissions trajectories, within the Global Carbon Budget and at the same time satisfying the Roadmap 2050 goals. The result of the study highlights the urgency to reinforce mitigation measures for Europe as soon as possible because any delay in policy implementation risks the Roadmap 2050 mitigation package being insufficient to achieve the objectives of the Paris treaty.

1. Introduction

The 21st Conference of the Parties (COP21) [1] highlighted the need for a rapid transition away from fossil fuels in order to maintain the emissions of greenhouse gases (GHG) below a level that would result in a temperature increase of 2 °C above pre-industrial levels. This threshold is sometimes defined as the “tipping point” between ‘dangerous’ and ‘extremely dangerous’ climate change [2].
The remaining cumulative carbon emissions that would keep temperatures below this threshold is commonly termed ‘Carbon Budget’ and it is defined as the total carbon emissions that were (or will be) released by human-driven activities, first and foremost the fossil fuel cycle of extraction and burning. This amount is subject to several sources of uncertainties but a general agreement exists that it should not exceed ca. 1000 Gigatons of Carbon (GtC) [3,4]. According to the Fifth Assessment Report (AR 5) of Intergovernmental Panel on Climate Change (IPCC) [5], 515 GtC had been already emitted by 2011, which leaves us with less than 485 GtC available today. Due to the fact that the prevalent greenhouse forcing in the atmosphere is related to carbon dioxide, this is frequently expressed also in term of carbon dioxide equivalent units [6]. In the present study, we adopted this unit so that 485 GtC becomes 1780 Gigatons of carbon dioxide equivalent (GtCO2eq) [7], and includes the impact of all the greenhouse gases, not only carbon dioxide.
From the available data, it is apparent that if the world’s use of fossil fuels continues along the current path, the remaining carbon budget will be exceeded in a few decades at most [8]. Hence, it is commonly agreed that, to reduce emissions, it is necessary to drive the world’s economy to invest in renewable energy provisioning [9,10,11,12] and in favoring the development of circular economies [13,14,15]. Recent work, such as by Van Vuuren et al. [16] shows that a combination of an increase in resource efficiency, sustainable energy production and investment in human development could lead to a successful transition towards a more renewable energy supply. The physical requirements for a successful transition have been studied by Bardi et al. [17] who found that the transition is possible but it will require considerably larger efforts than is commonly believed. Approaches to mitigate climate change are based on policy options such as a carbon tax [18] that encourage each carbon production sector to cut the emissions. In practice, the details of a plan that would lead to decarbonize the world’s economy are still under development.
In Paris, each country was invited to present plans for “Nationally Determined Contributions” (NDCs) which were not calibrated in terms of the worldwide carbon budget and which turned out to be clearly insufficient to achieve the 2 °C target [19,20]. In addition, a further complication faced in the task to split a global carbon budget into a country’s quota, is that the available historical emissions are aggregated according to the Kyoto Protocol emissions regions [21], in which the set of developed countries are reported as “Annex 1 Countries” whereas the others—“developing” and emerging countries—are reported as “Non-Annex 1” countries. Thus, all the decarbonization scenarios elaborated in this study must start by taking into account this difference: we needed to first assess Annex 1 and Non Annex 1 carbon budgets and, only subsequently, the ones at country levels.
On the basis of these considerations, we investigate here the case of the European Union (EU), which plans a GHG emissions reduction target of 80% below 1990 levels by 2050 [22]. This goal, however, does not consider the cumulative emissions from now to 2050 (with the exception of the plans developed by the United Kingdom [23,24]). There are infinite trajectories that would lead to meeting the 2050 emissions target, but only some of these trajectories are economically feasible, generate cumulative emissions proportional to the EU fraction of Annex-1 carbon budget, and are compatible with the engagements taken with the COP21 Paris treaty.
In the present study, we examined the pathways that the countries defined as the “EU-28” should follow to bring emissions 80% below their 1990 value by 2050 while at the same time limiting the GHG emission compatible with the Paris treaty goal. This evaluation represents the novelty of our study: we assess a carbon budget for EU 28 and a set of stylized emissions trajectories with the aim to analyze the feasibility of current EU-28 GHG reduction objectives, under the goals of the 2015 Paris treaty. This analysis aims to give orientations on the future policies for GHG emissions mitigation in EU-28 to achieve the Paris treaty goals. Moreover, stylized emission pathways have the advantage of representing a simple and versatile input for the use of techno-energy modelling tools that aim to investigate the optimal European energy mix constrained by a cumulative emissions cap [25].

2. Materials and Methods

We start by considering the global remaining carbon budget estimation that can be found in the Climate Action Tracker (CAT) [26]—2 °C consistent scenario, which maintains warming below 2 °C with at least a 66% probability over the whole of the 21st century. The CAT database also includes other scenarios with lower and higher probability of staying below the +2 °C target. Some of these scenarios involve “negative emissions” technologies (NETs) to be deployed during the 2nd half of the 21st century. Unfortunately, these technologies involve high costs, significant uncertainties [27,28] and practical hurdles, and we have not included them in the present analysis. If the decarbonisation target is increased in ambition to achieve the 1.5 °C target, using NETs technologies once they have been proven to be efficient and economically feasible [28] then these targets could be included in this analysis at a later date.
Thus, we select as reference the ‘2 °C consistent’-median scenario that allows 3 GtCO2eq/year residual emissions until the end of the century. That means a total emission allowance is estimated as 1949 GtCO2eq, rather than the 1780 GtCO2eq value that assumes zero residual emissions. In the present paper, we use the past trend in emissions to explore three different scenarios where emissions reductions occur immediately or are delayed to 2020 and 2030. We make no explicit hypothesis on what could be the technological or policy-based actions that generate the assumed emission reduction, and as a first approximation, we assume an exponentially declining shape for the emissions curve, used to evaluate a yearly rate of change of the emissions that meets the carbon budget. This simple approach was chosen in place of more complex trajectories that could be generated by assuming a smooth peak before the start of the decline. Such trajectories have been examined in various studies [29,30] but they introduce new, unknown (or often stochastically modelled), parameters in the model while adding little or nothing to the primary purpose of this study, that is, estimating the decline rate necessary for reaching the goals of the Paris treaty. For this reason, exponentially declining stylized trajectories are commonly used to understand the long-term climate impacts of GHG emissions as, for instance, in the C-ROADS simulator tool [31] or in other Integrated Assessment Models [16,32,33,34,35], as well as in the work of Kuramochi et al. [36]. Kuramochi’s work, in particular, explores several mitigation scenarios evaluating possible carbon budgets values for Japan until 2100. That research has been carried out elaborating linear projections of the national historical GHG emissions data toward intermediate future years. Changing the slope of the curves the authors represent different aspects of economic/social challenges in reaching the massive decarbonization required of Japan, in a framework compatible with the 450 ppm or 550 ppm CO2 stabilized level scenarios reported in the literature. This methodology is similar to the one used in this study, except for the fact that linear extrapolations are not suitable for the Roadmap 2050 intermediate goals. This is why we adopted exponential and power functions curves which allow the inclusion of those goals in the decarbonization routes.
In the AR5 [37] trajectories proposed by IPCC emissions peak in 2011, but more recent data show that emissions are, on average, still increasing from that year (even though a decline has been observed in 2016 in comparison to 2015) [38]. The emission pathways we propose here were developed projecting forward past trends in GHG emissions, assuming that in the absence of substantive policy actions emissions will continue in line with the IPCC scenario AR5—“business as usual” (BAU) scenario report in CAT database as ‘AR5-BAU-high’.
We implemented two models to estimate the shape of the emission curves. One is a simple exponential decay, where emissions in the future year decrease at a rate proportional to their current year values (1), and it is used to estimate 2020 and 2030 scenarios, at world level and the respective residual value of the emissions in 2100.
Yi+1 = Yi − (x·Yi)
where
  • Yi+1 = value of the emissions at the year i+1
  • Yi = value of the emissions at the year i
  • x = constant rate
These residual values are less than 3 GtC because more carbon budget will be burnt between 2011 and 2020 and between 2011 and 2030, in comparison with the results of the CAT curves considered in the same interval. The other assumes a power law according to the following Equation (1), which permits when required, the forcing of the curve toward determined constraints (i.e., the GHG residual values estimated in 2100).
Y = Yi + (Yi − Yf) (1 − x/(Xf − Xi))a,
where
  • Yi = value of the emissions at the start (2020 or 2030 according to the two scenarios examined here);
  • Yf = Value of the emissions at the end (2100);
  • Xf = final year (2100);
  • Xi =initial year (2020 or 2030);
  • x = intermediate years (between 2020–2100 or 2030–2100) at which calculating the emissions;
  • a = is the variable parameter with values >0.
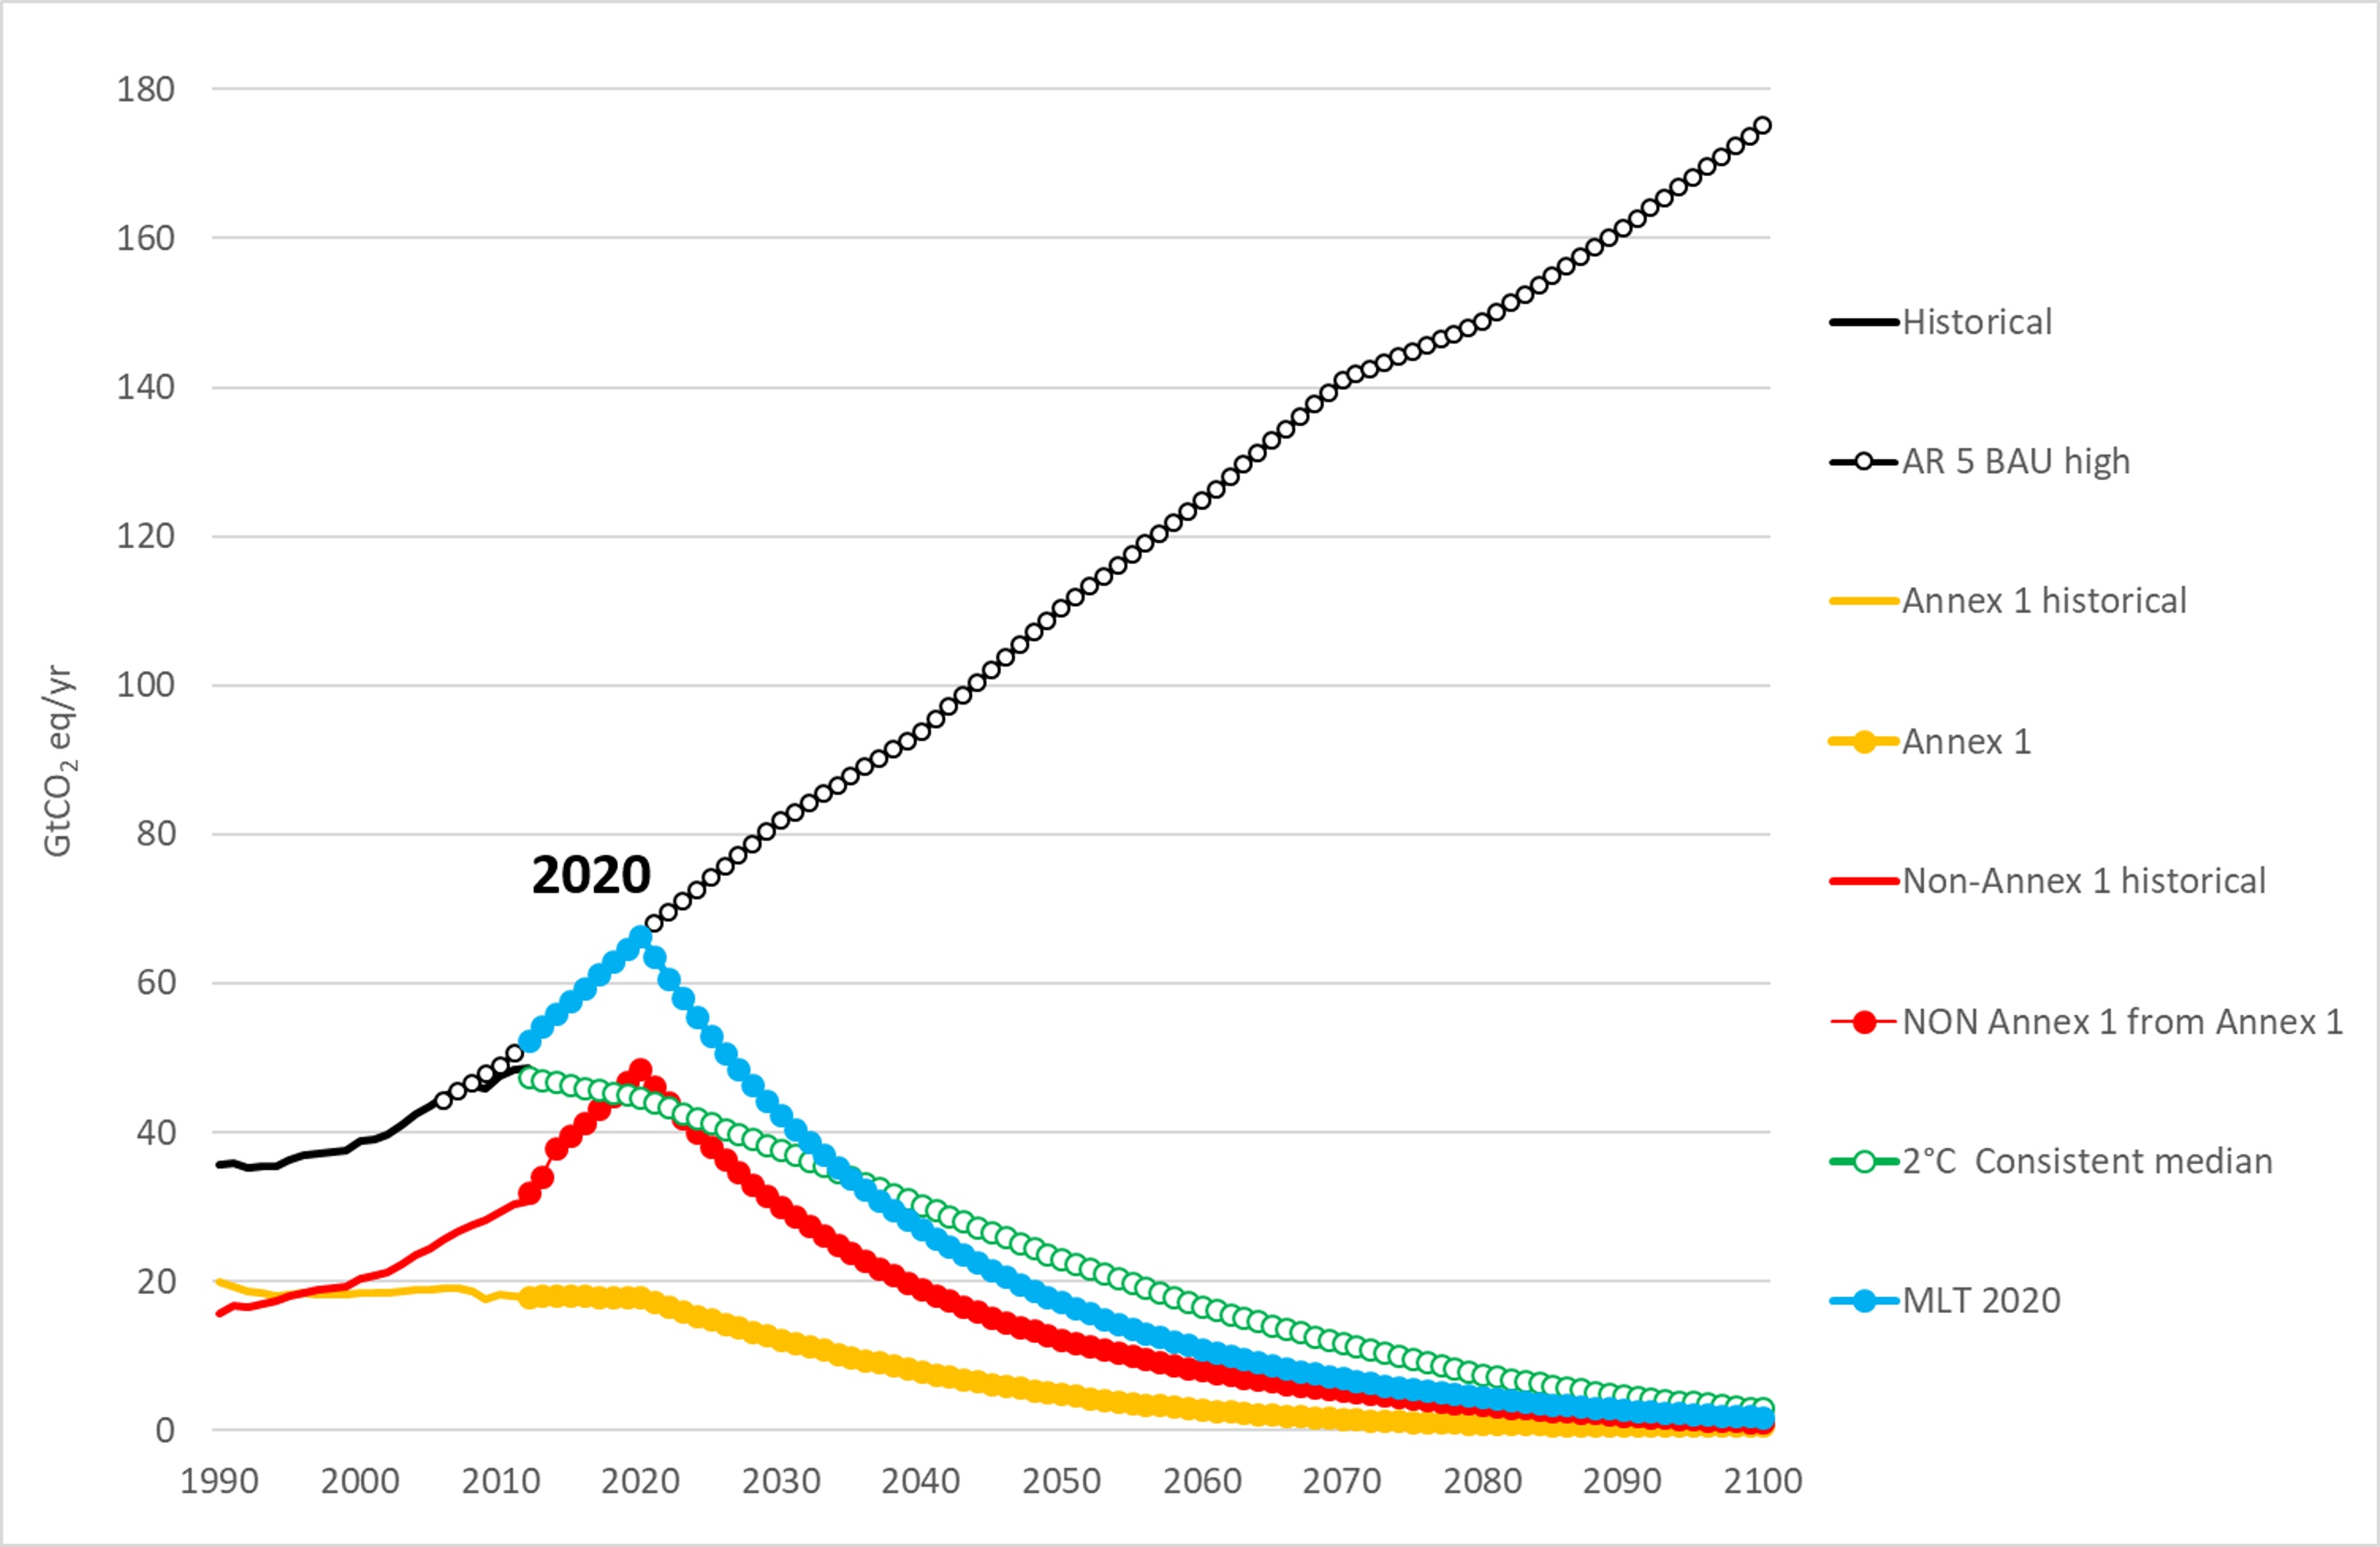
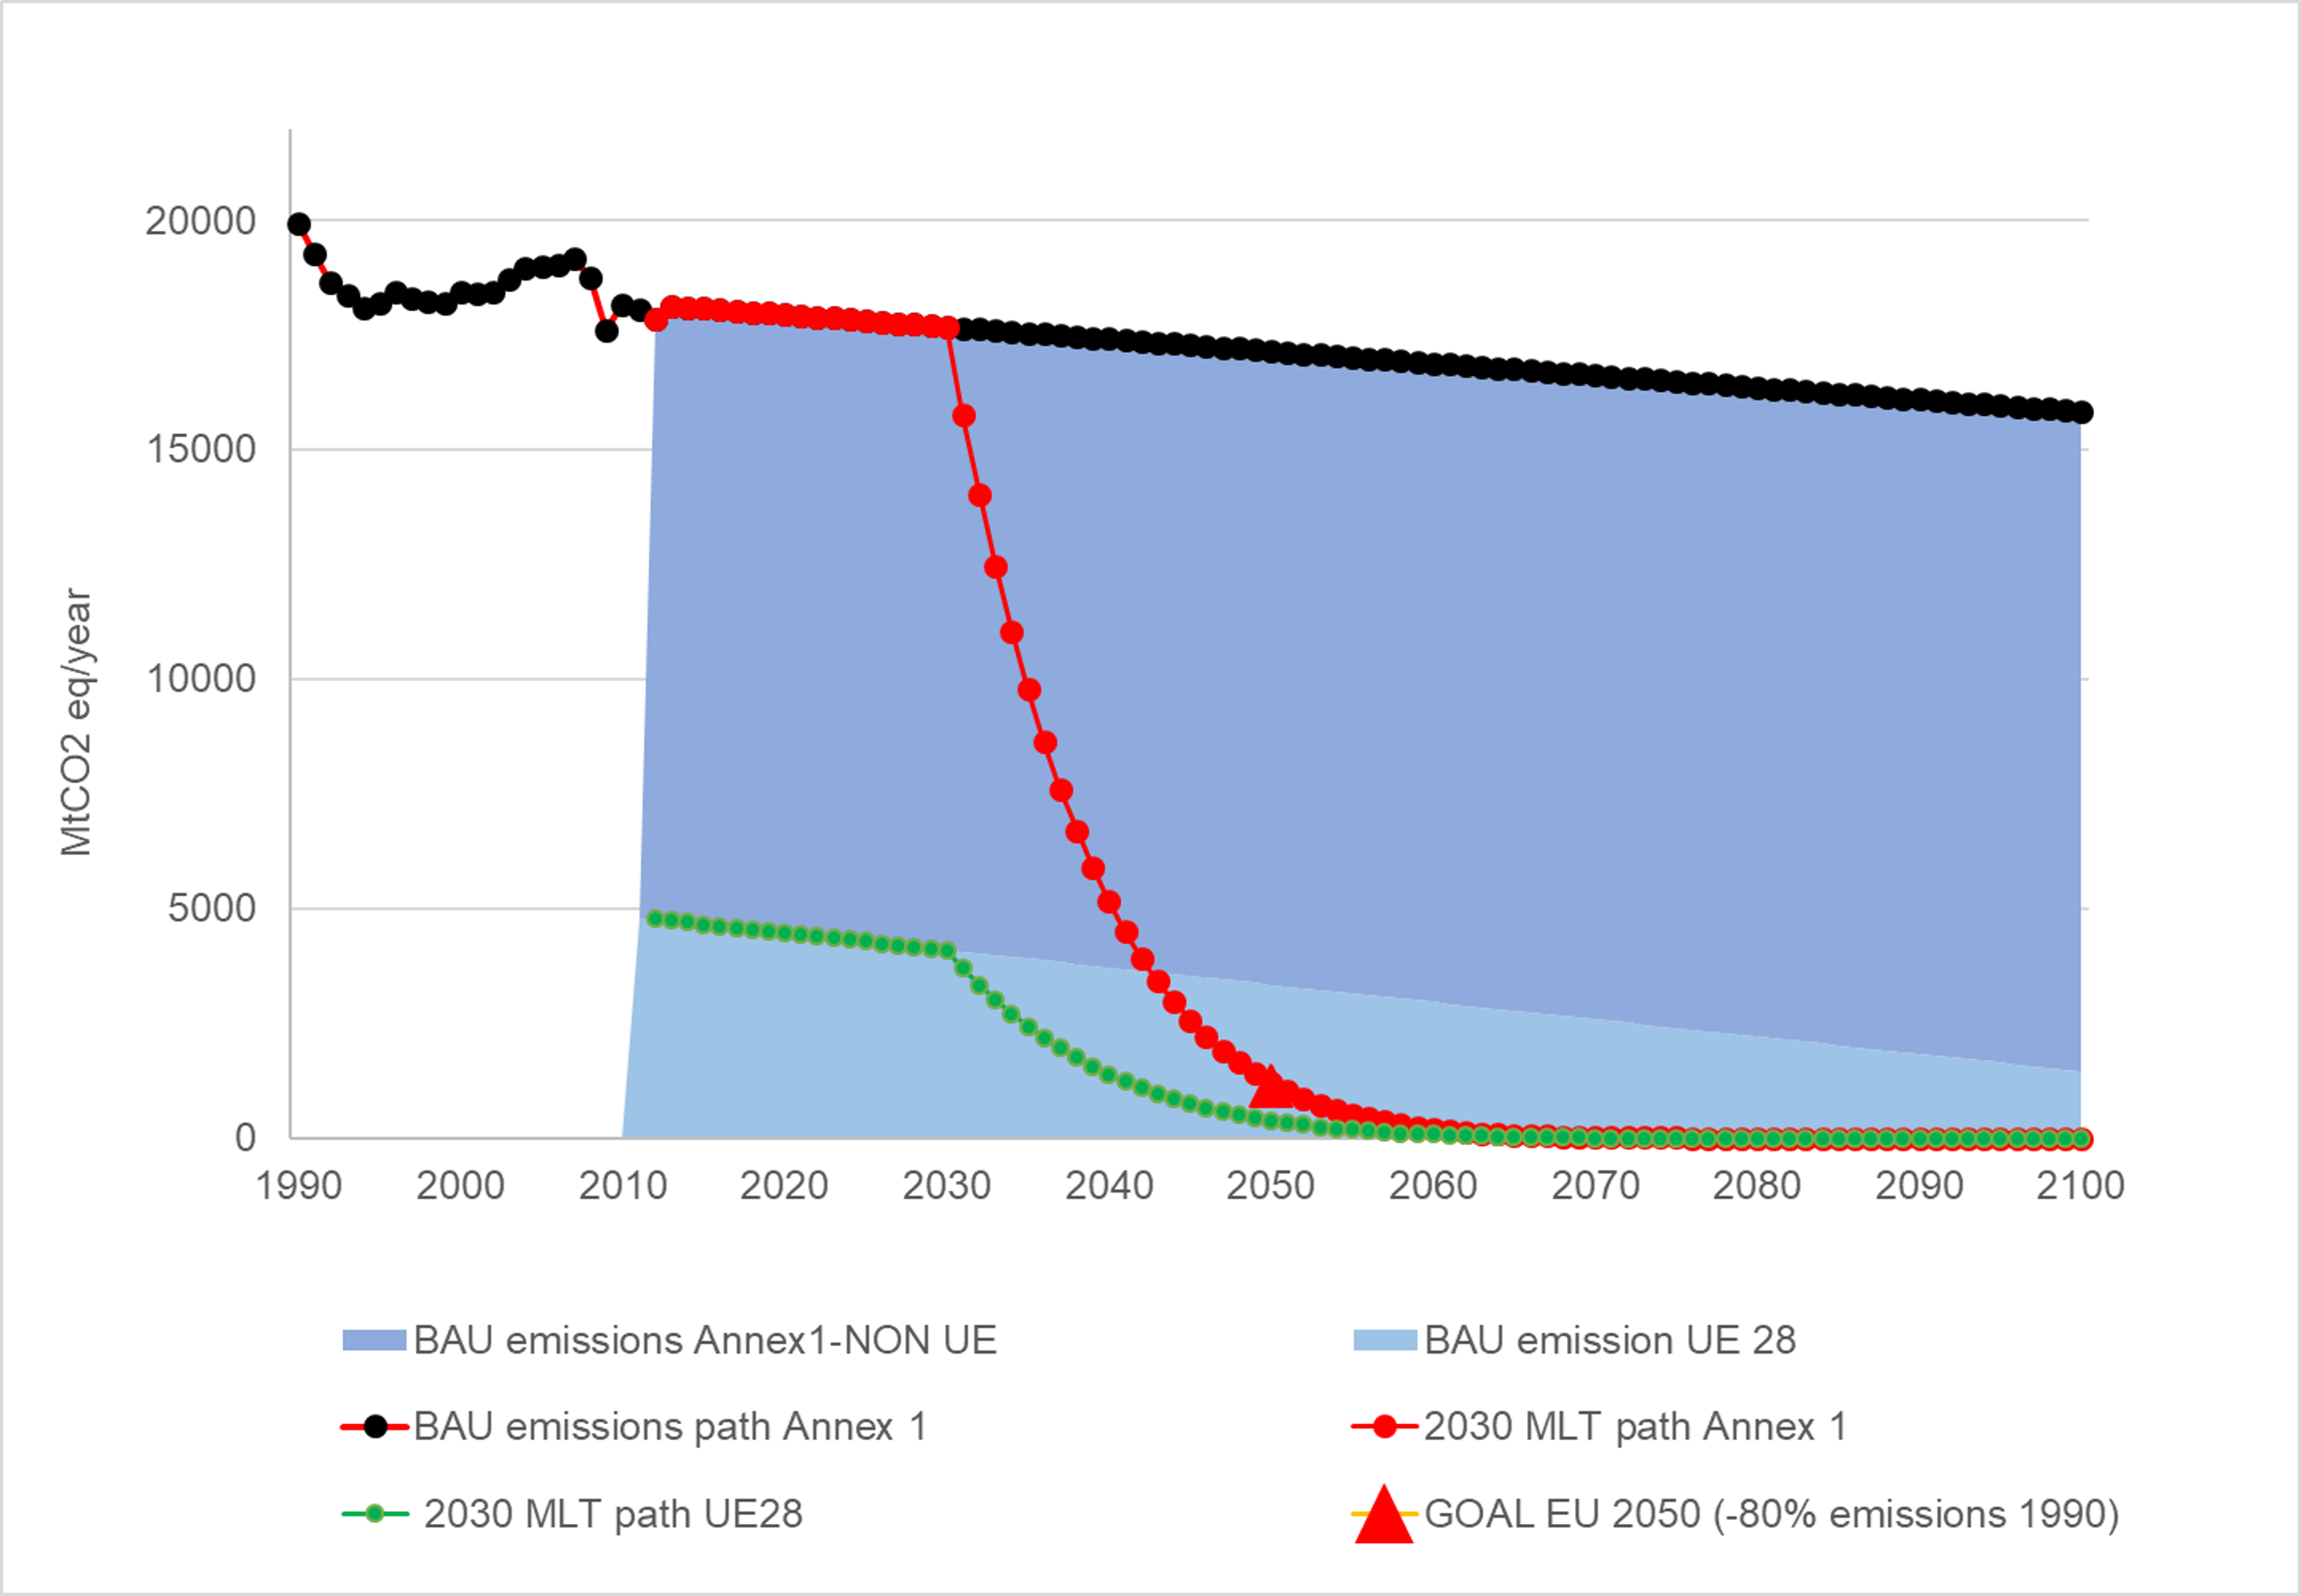
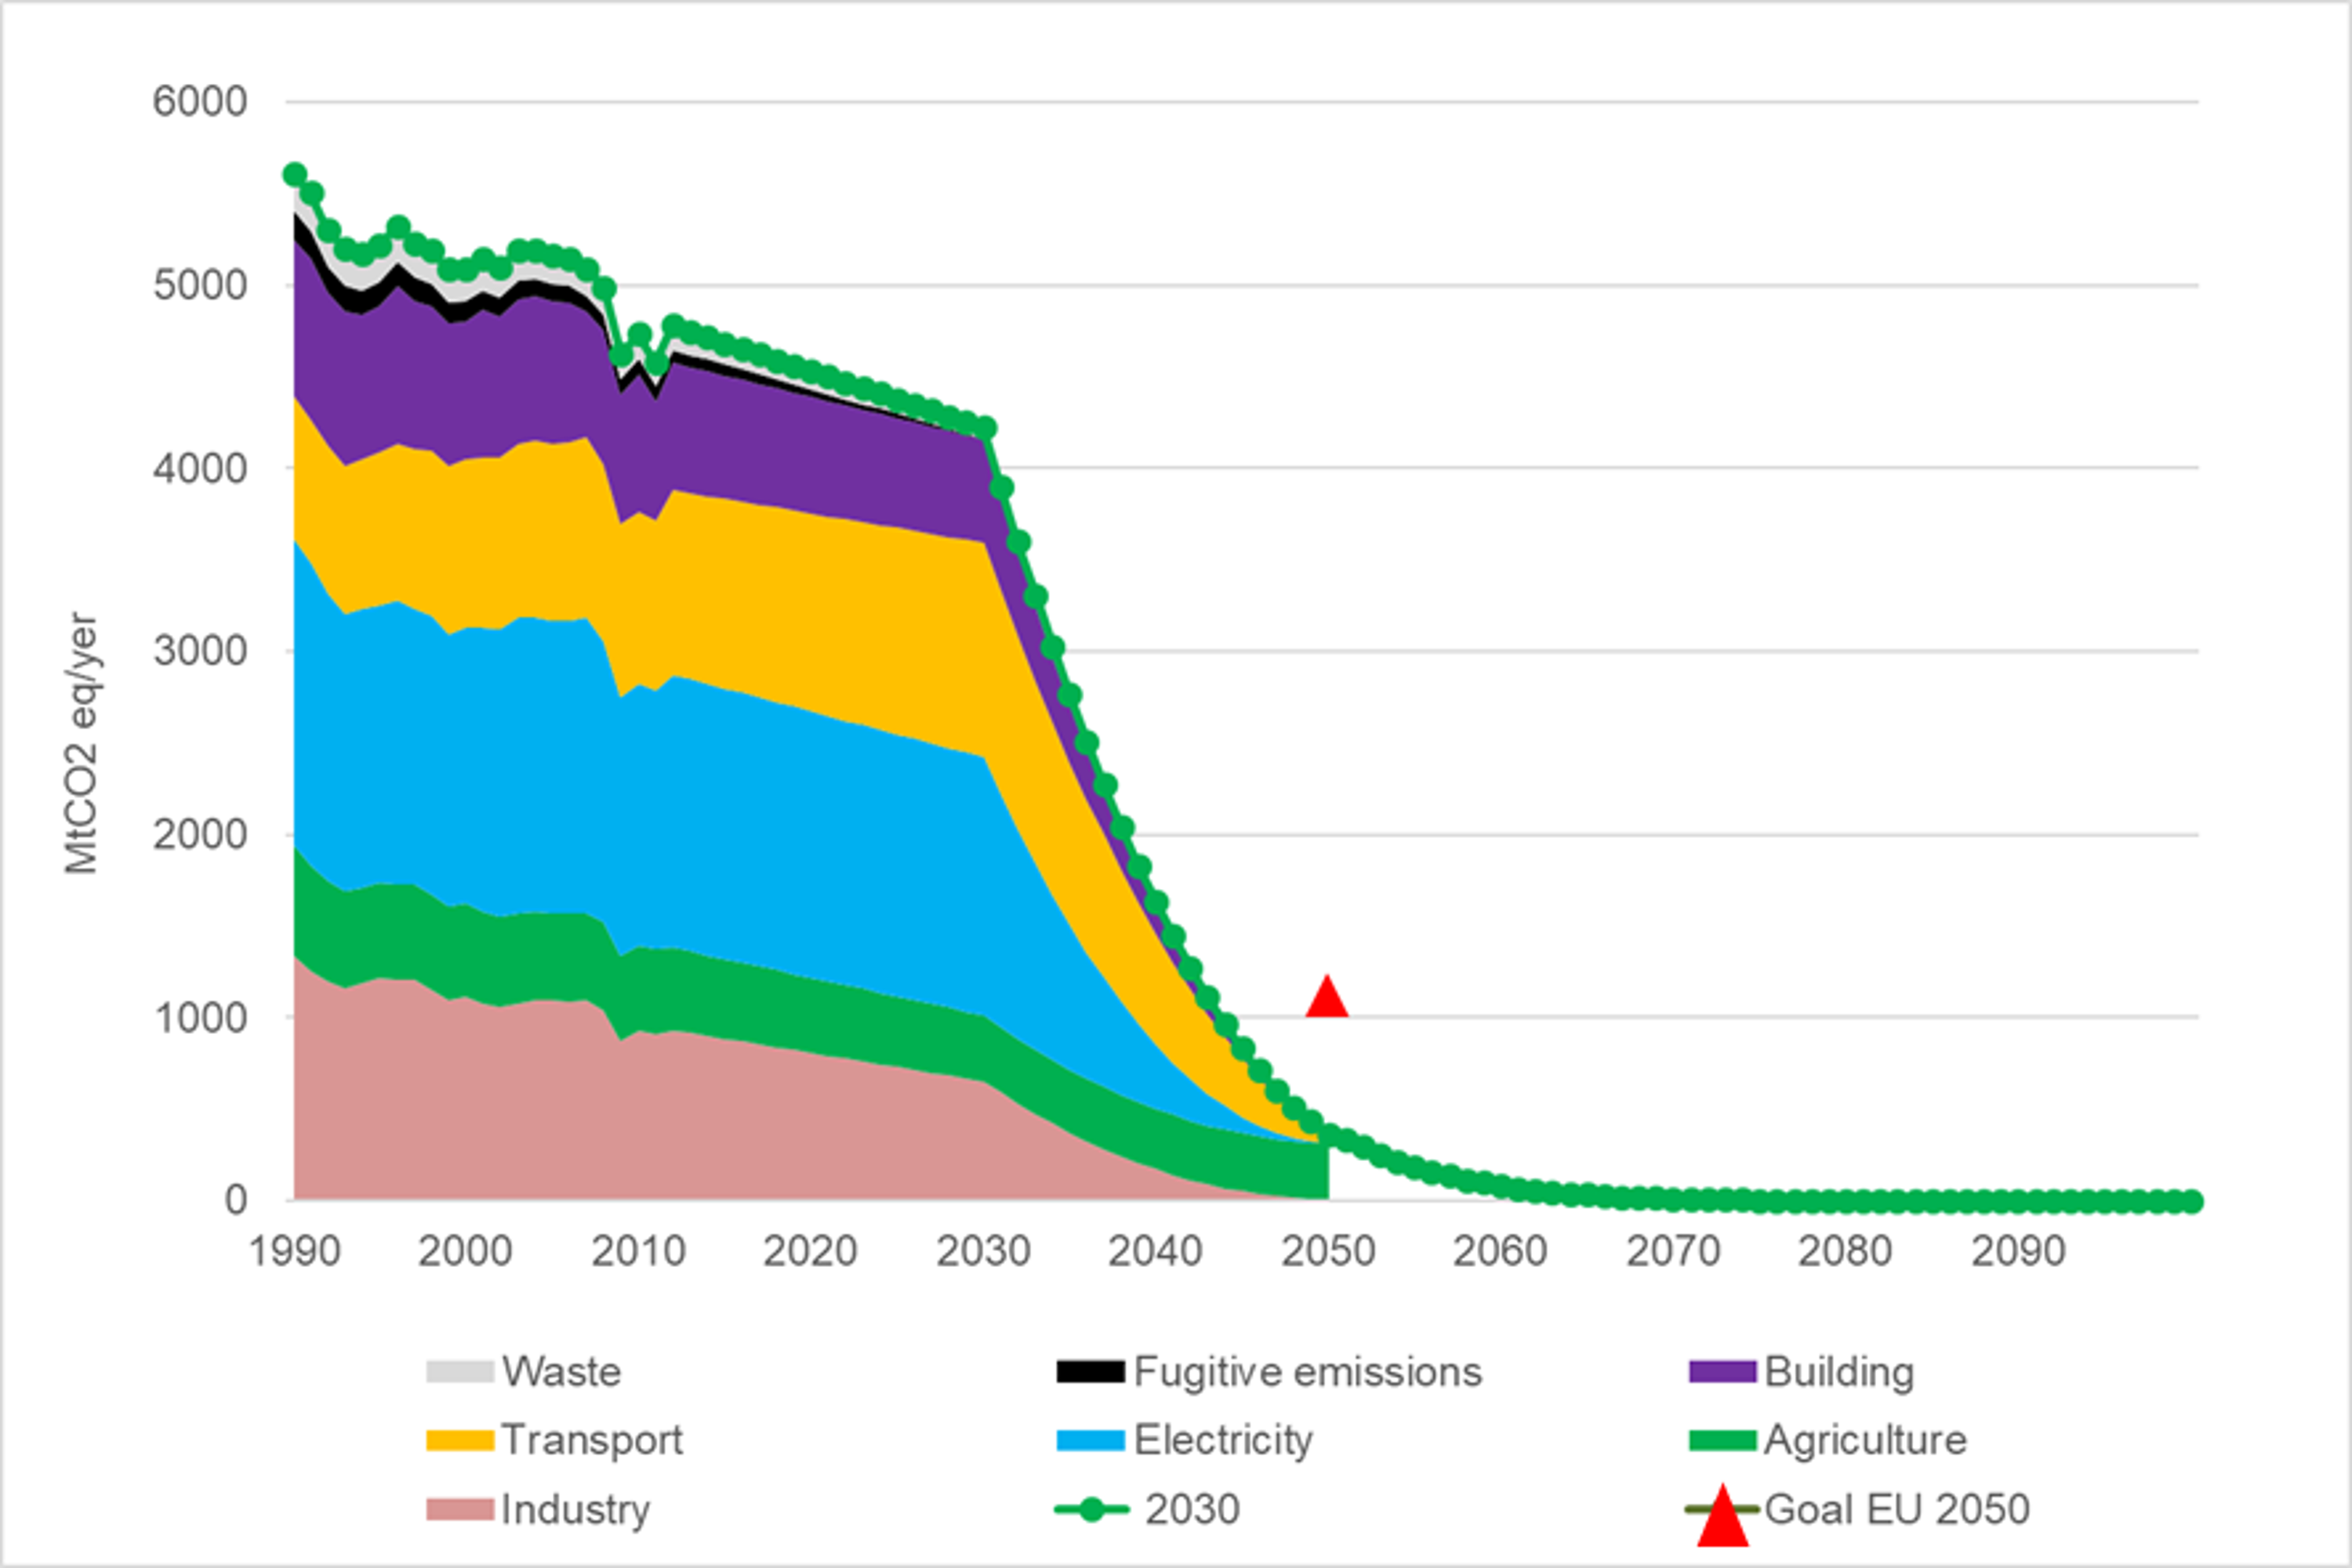
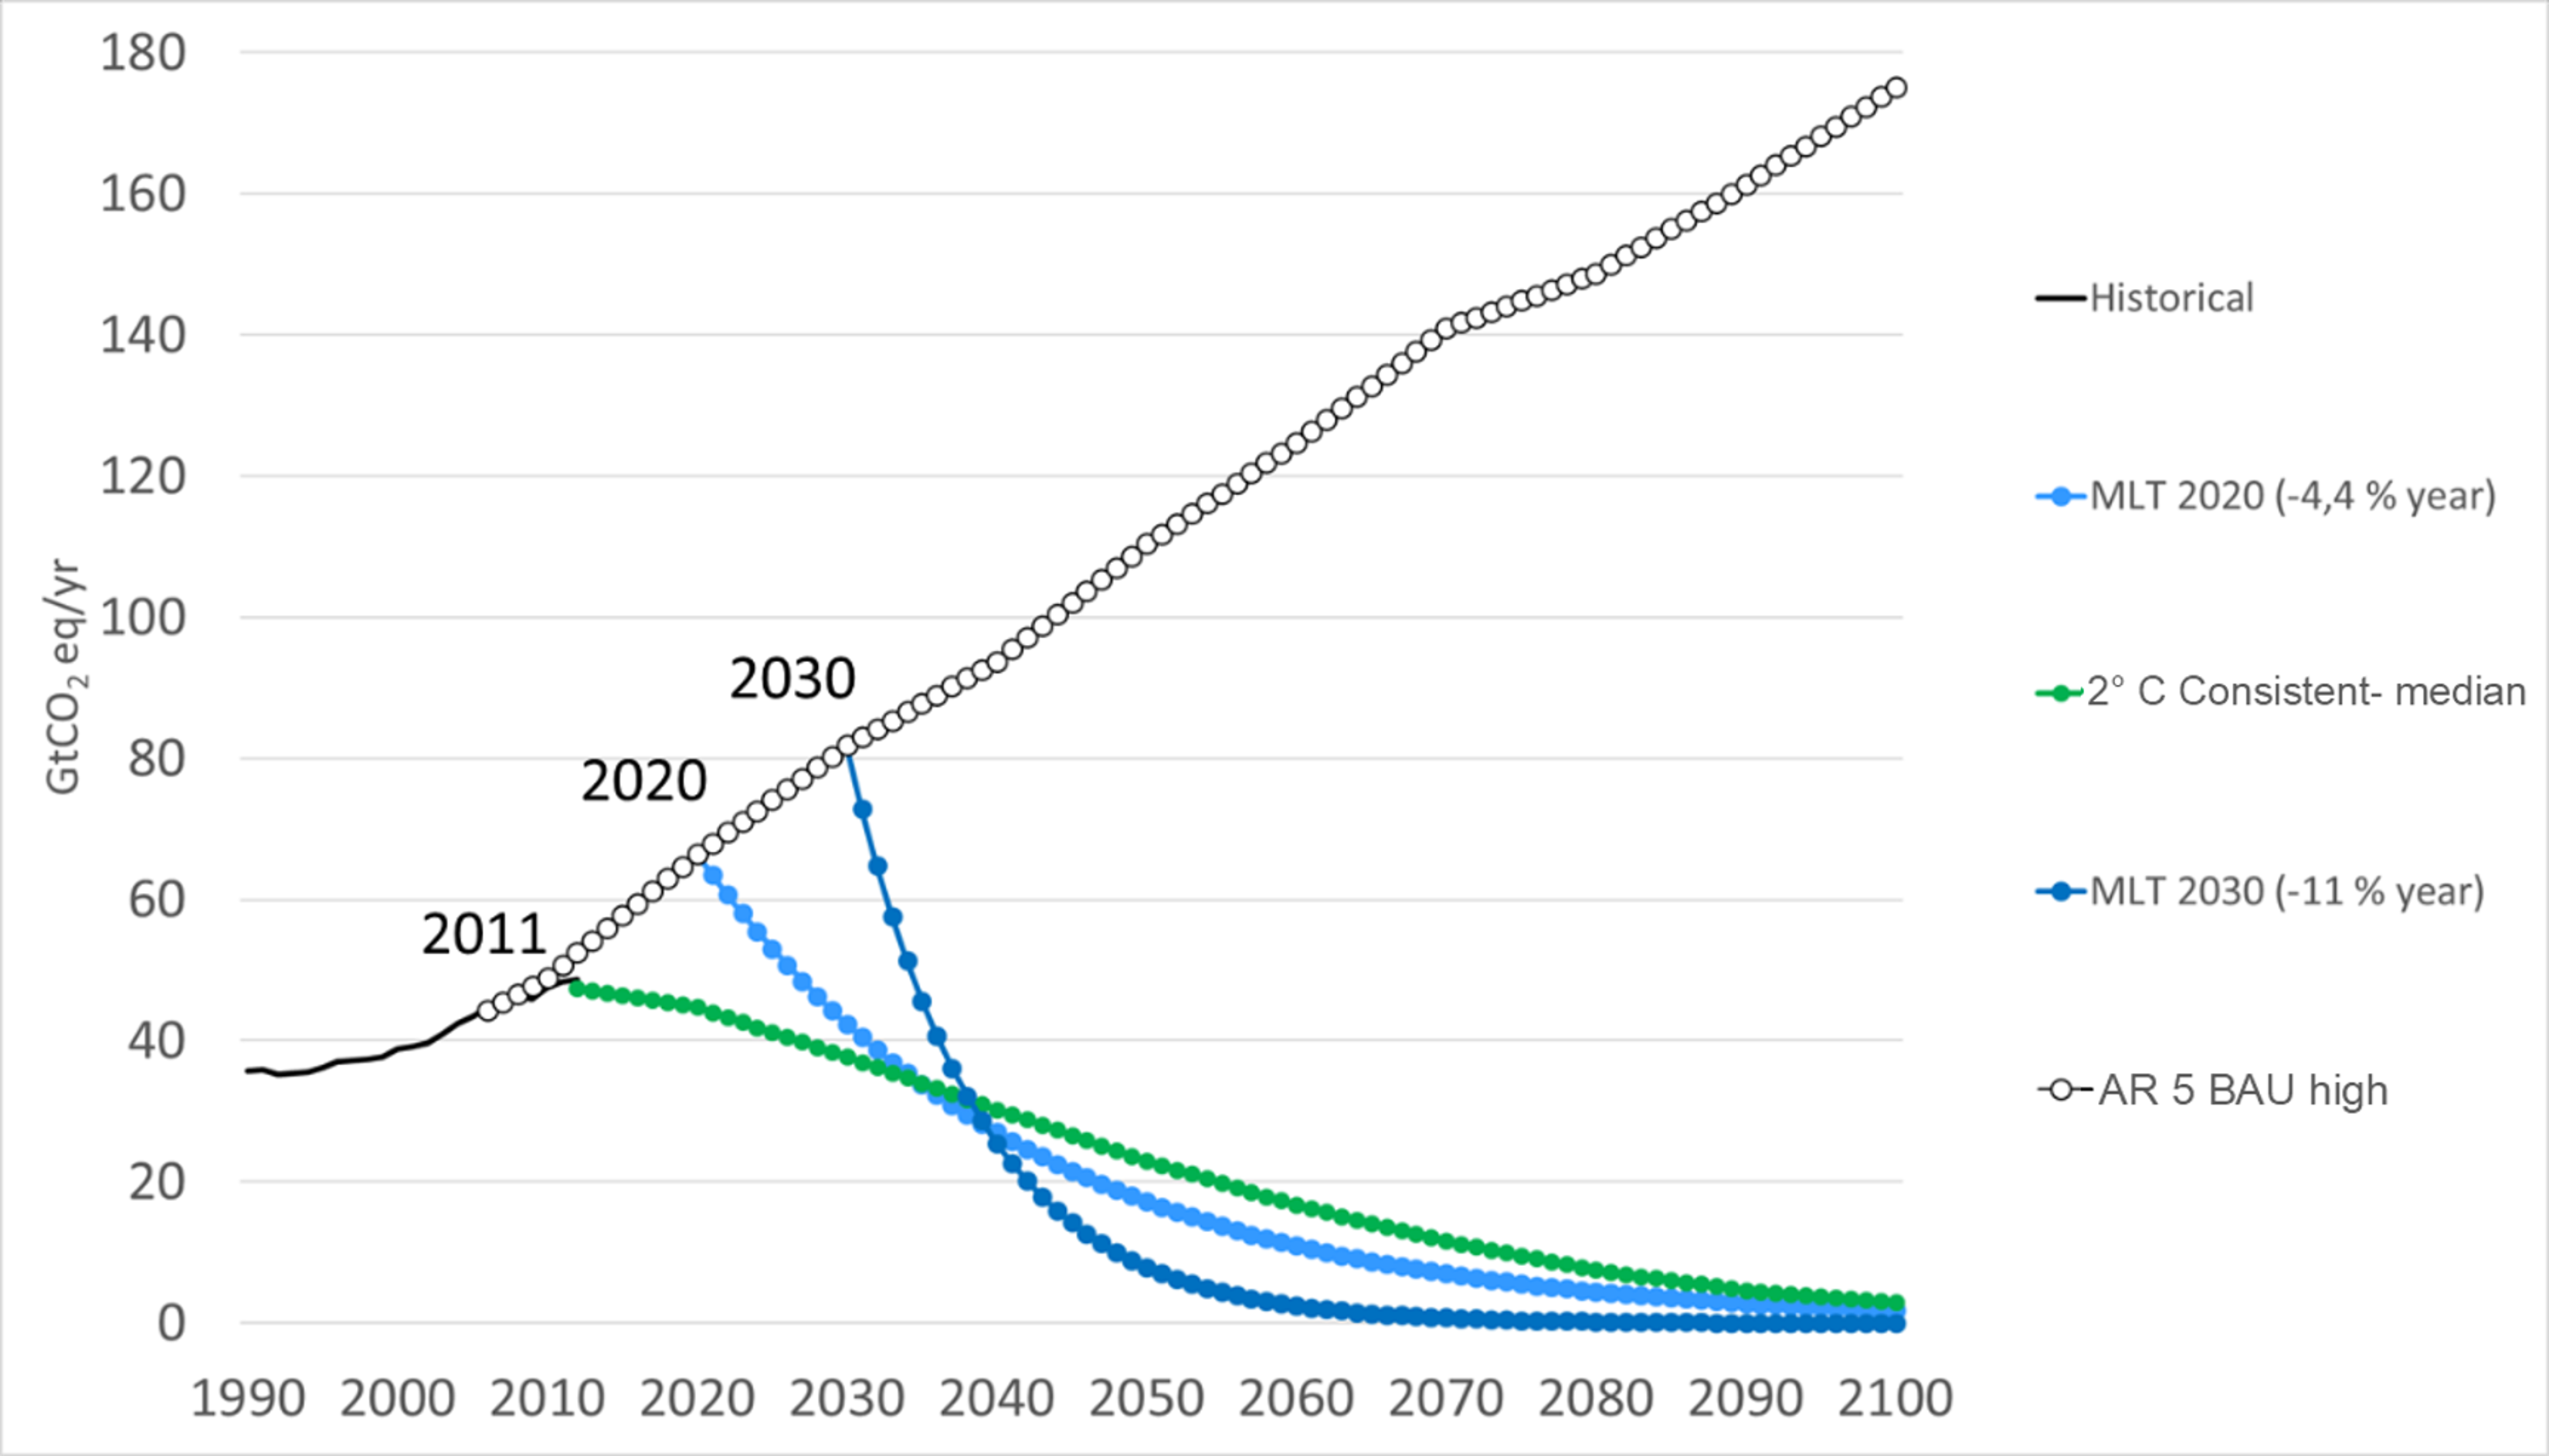
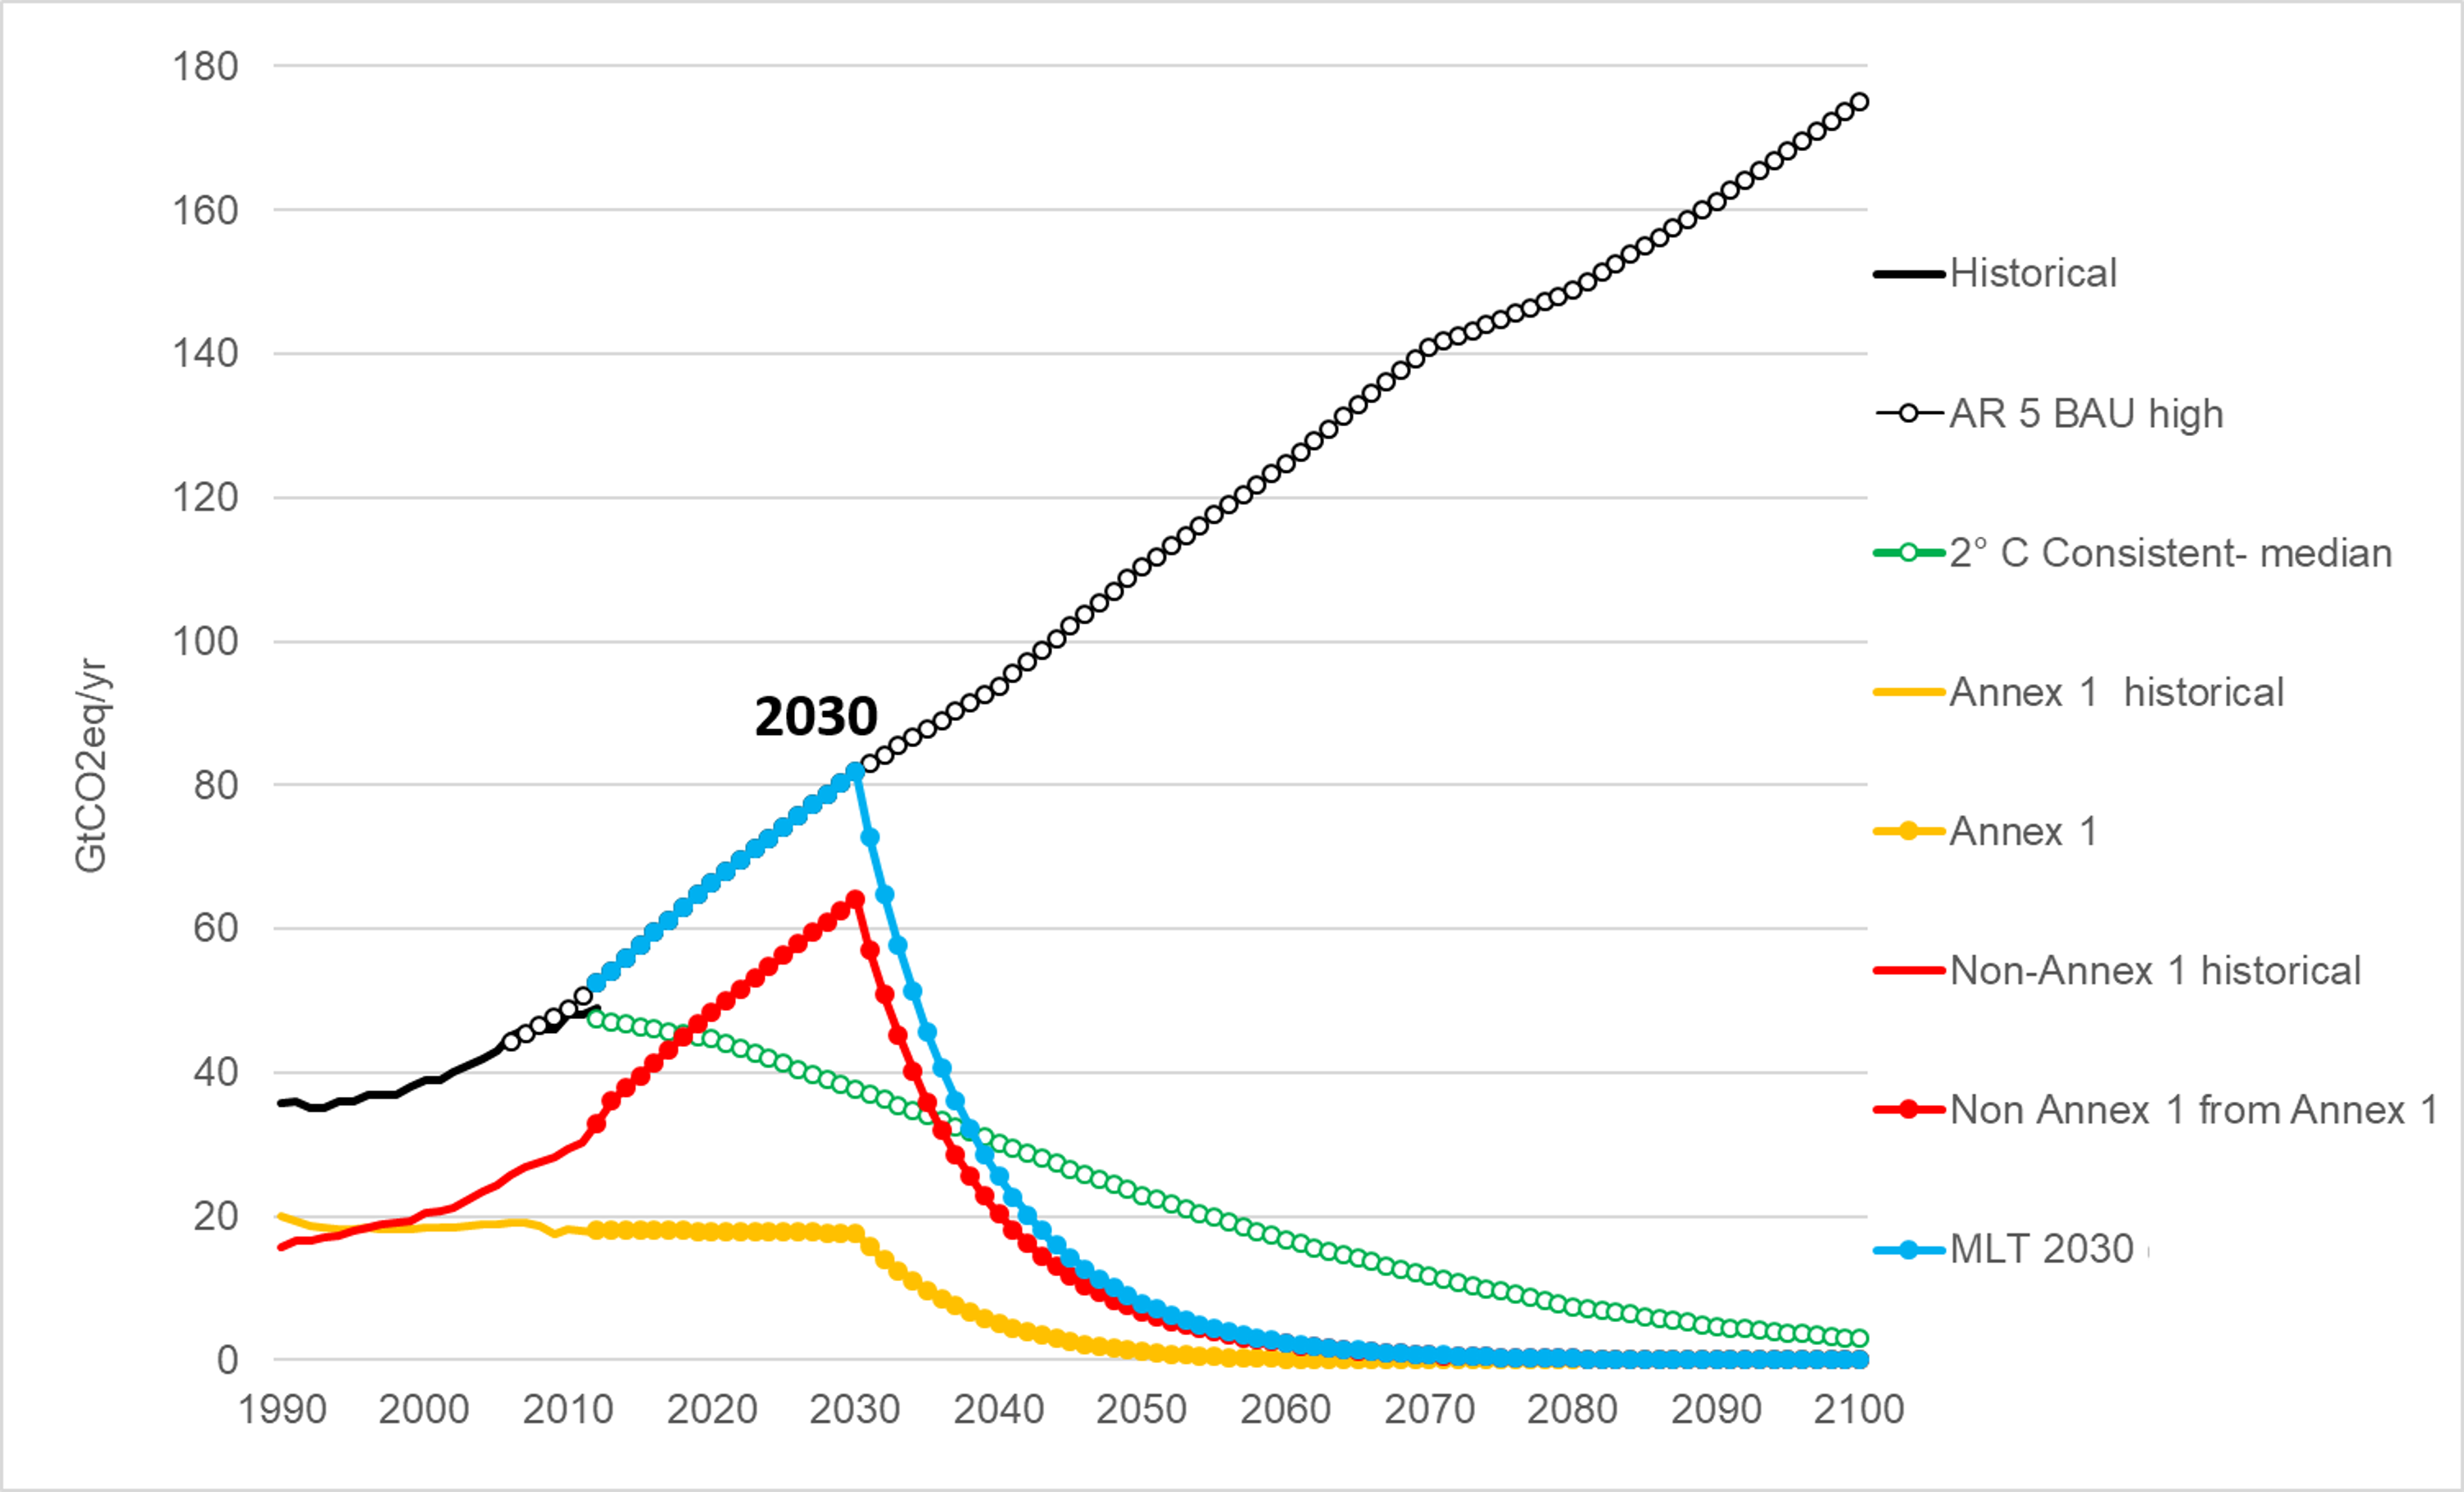
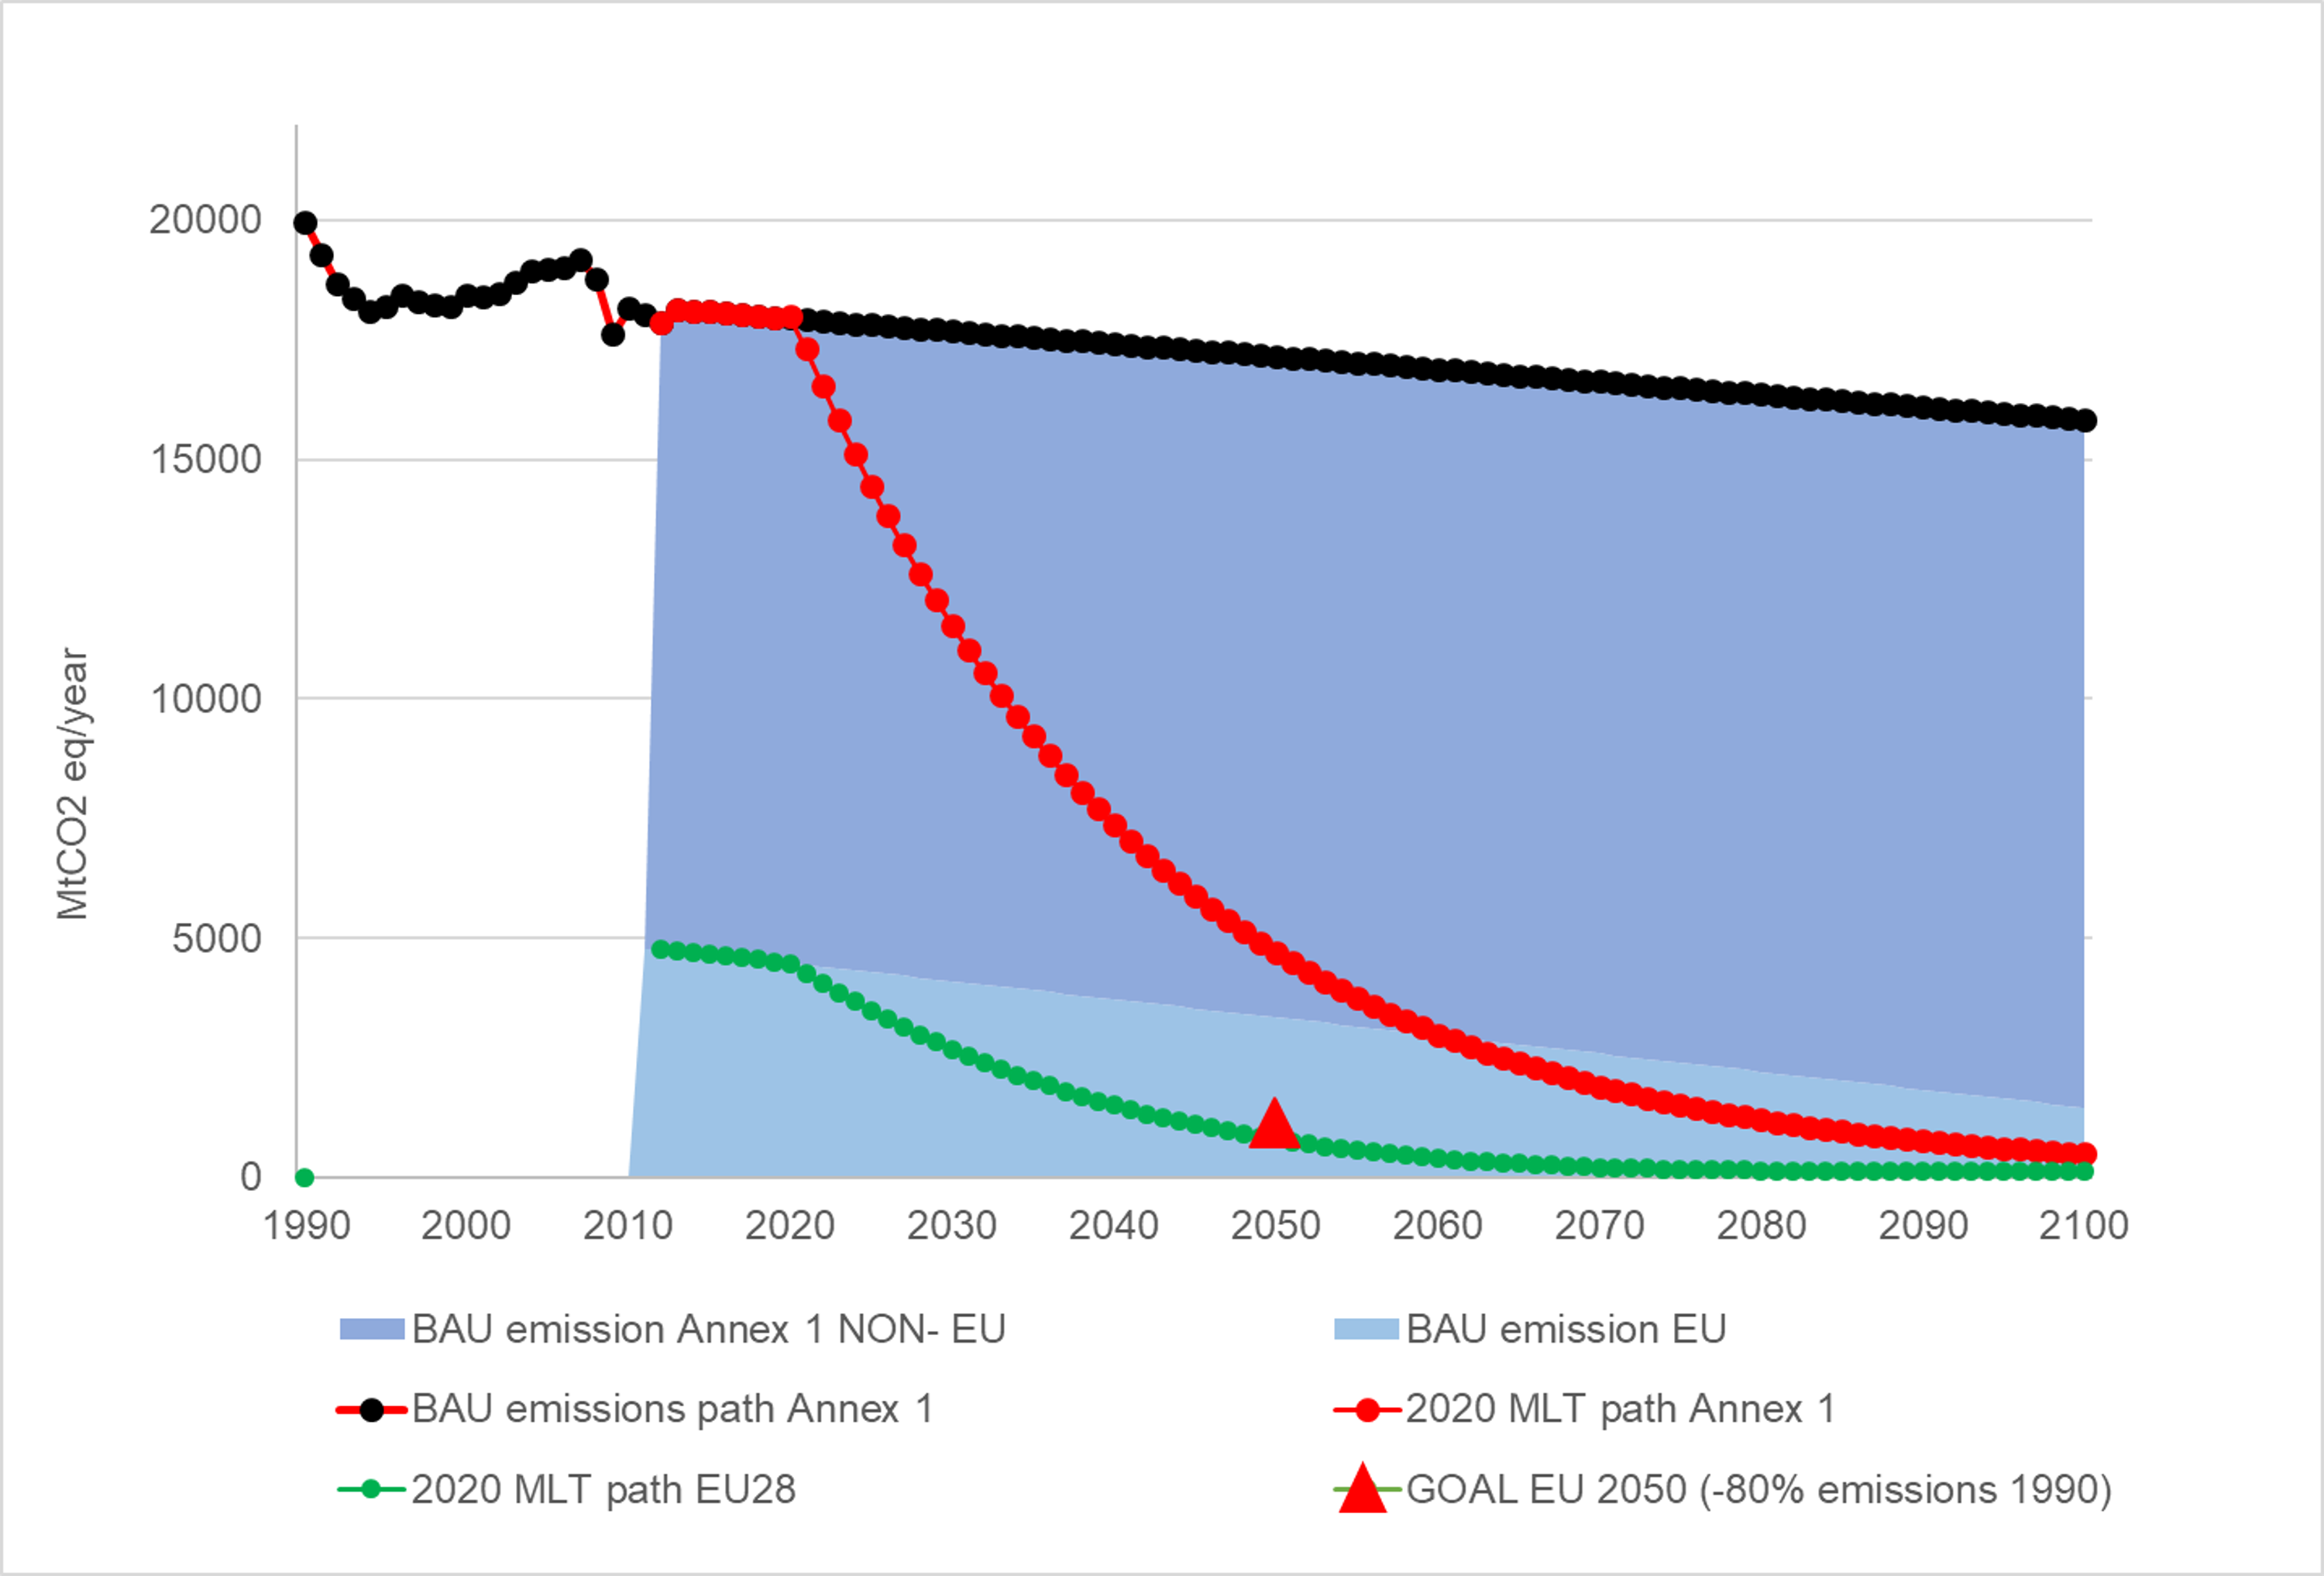
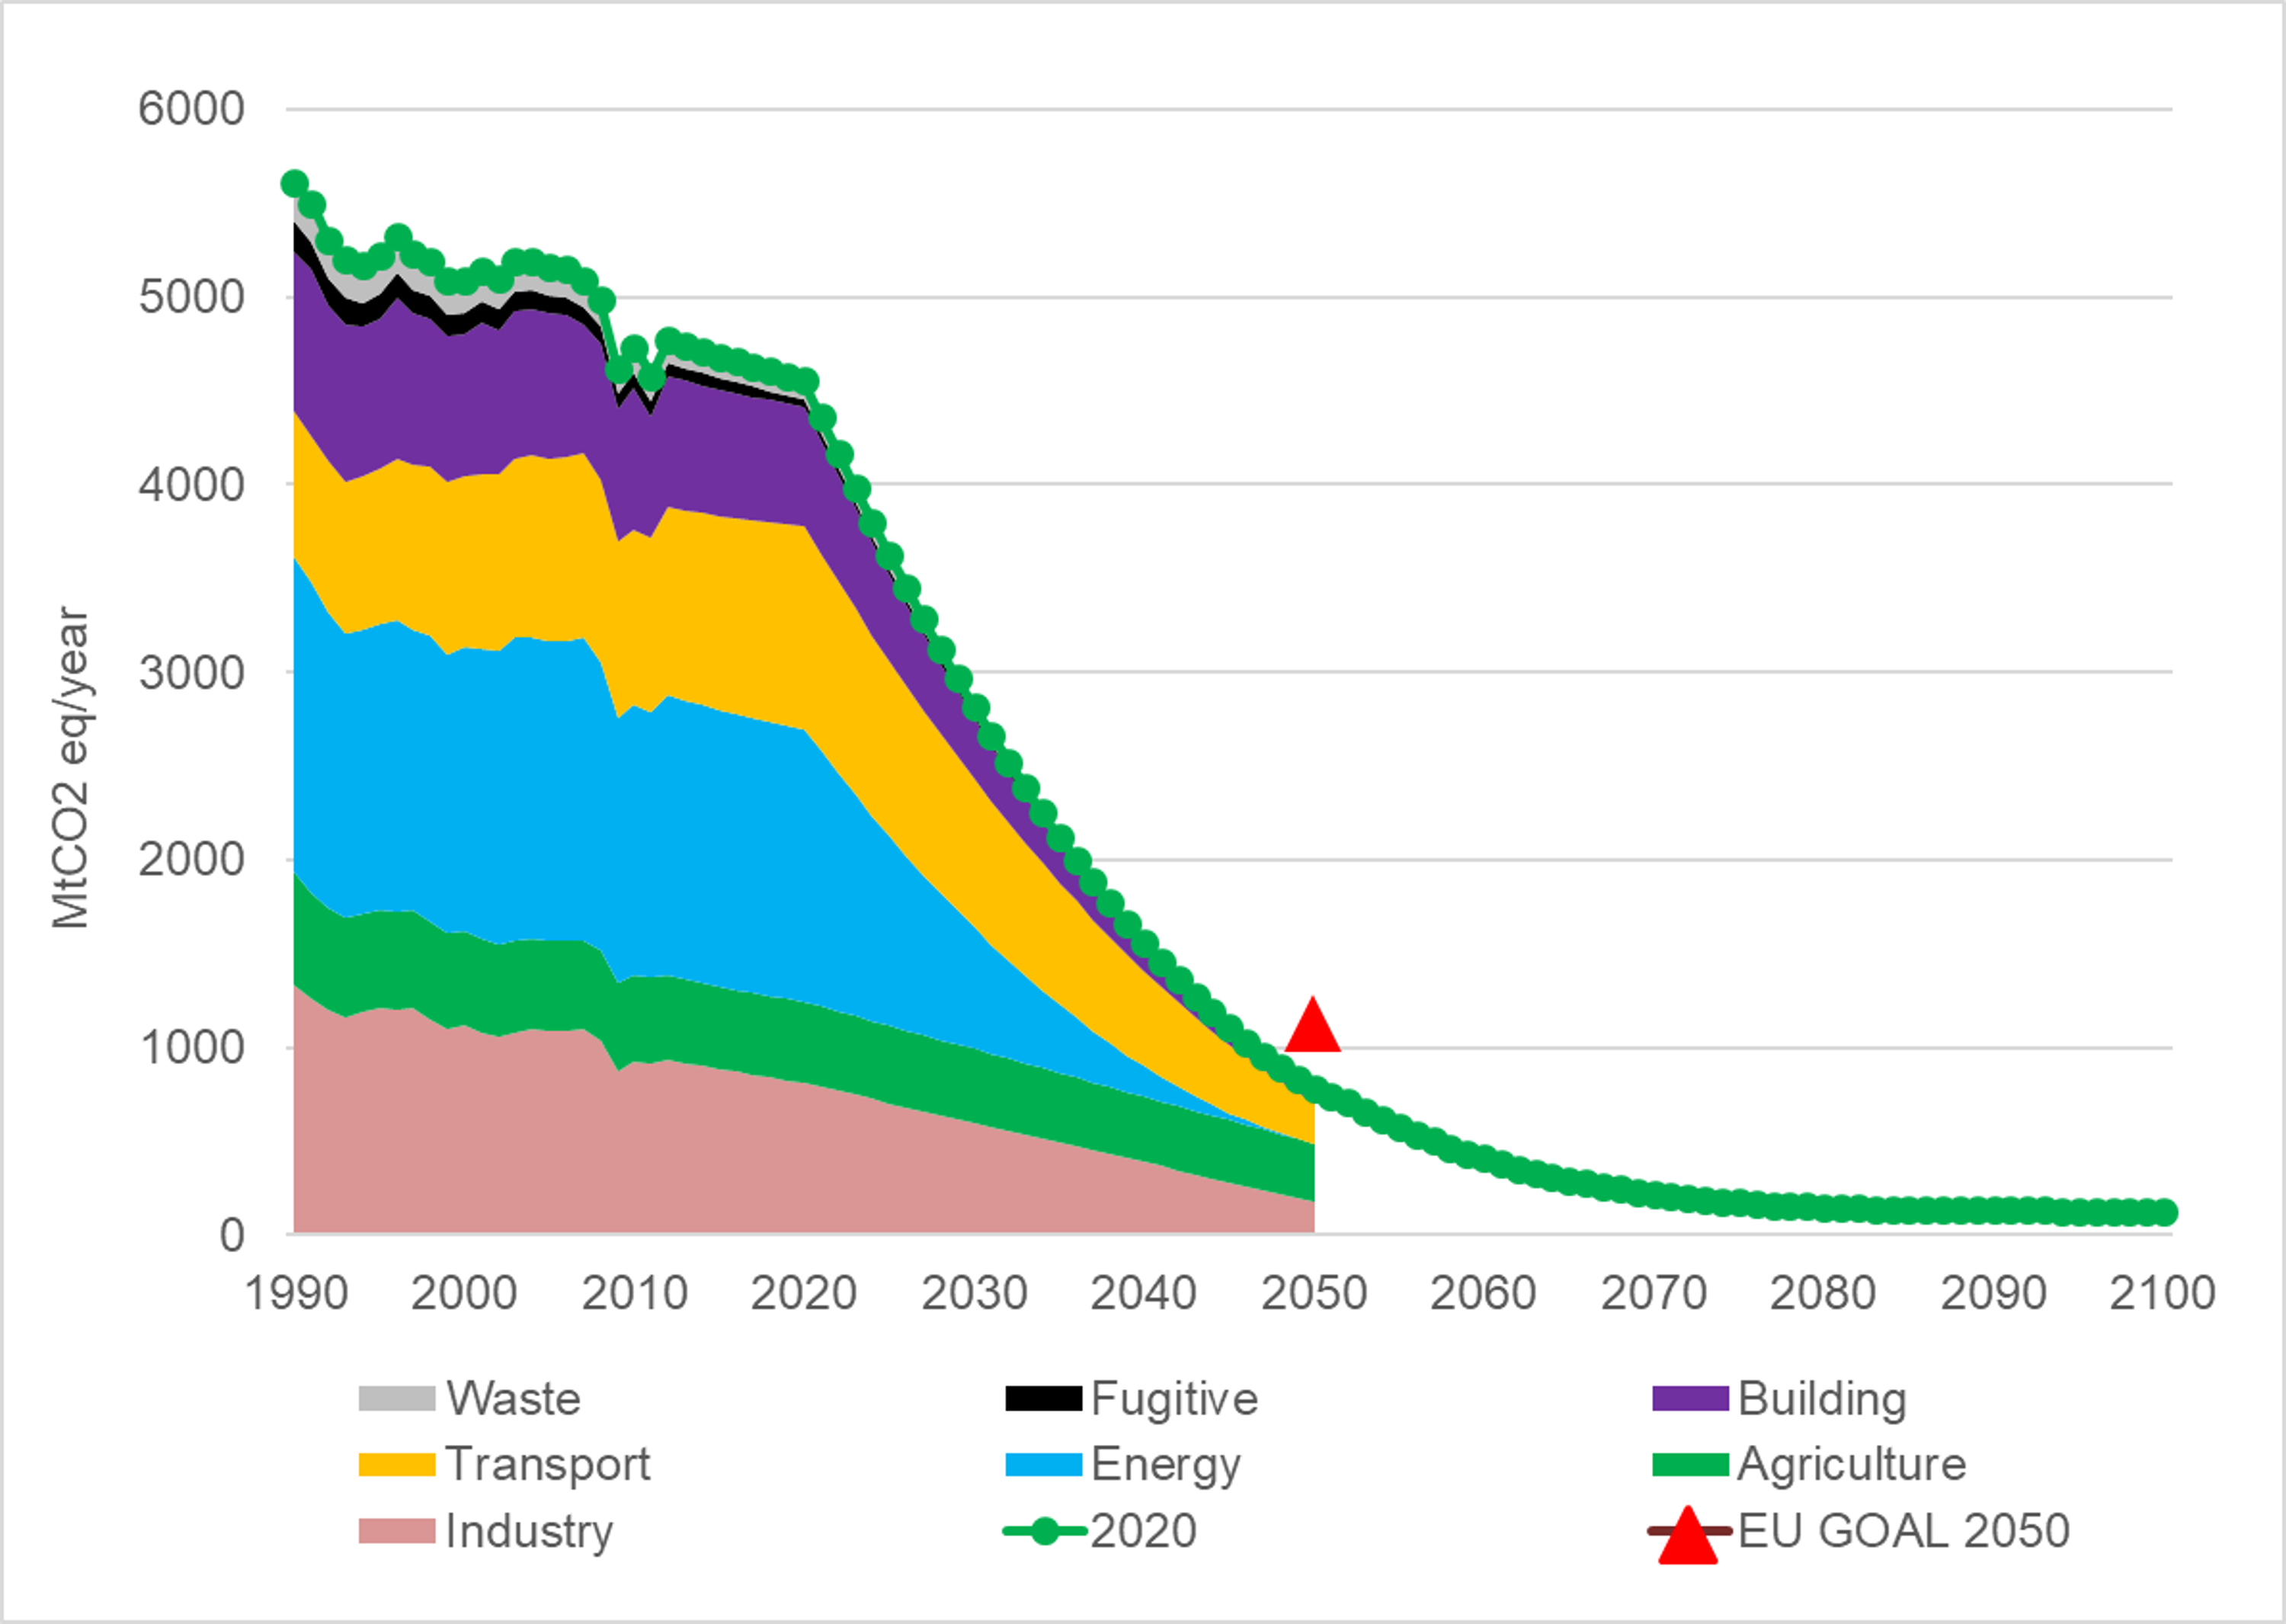
Moreover, due to the fact that we assume 1949 GtCO2eq as initial reference data, the elaborated scenarios in the present study will be affected by the same uncertainty, that is, 66% of probability to maintain warming below 2 °C over the whole of the 21st century.
In the same manner as the EU policy did in establishing an 80% cut in emissions from their 1990 value by 2050, the adoption of these simple methodologies does not claim to be able to capture possible dynamics in terms of economic, technical or physical constraints which each EU-28 country could face whilst move towards this goal. Nevertheless, we believe that, even within the limits of this approach, our results highlight an issue that had not been evidenced before: the presence of an important gap in how to manage the global policy of the Paris treaty toward sub-geographical levels. Although the COP21 is speaking in terms of cutting cumulative emissions, single states have not yet reached a level of planning compatible with the global needs. Thus, we present here a simple method to evaluate carbon budgets that could be useful to shape future national and regional policies (European in particular) within the global framework of climate change mitigation actions.
Figure 1 shows a first set of scenarios developed on the basis of the exponential model outlined in the previous section. These scenarios are compared with the BAU scenario ‘BAU high’-IPCC-AR5, (black dotted line) which assumes a progressive increase of carbon emissions. The figure also shows the ‘2 °C consistent’—median (green dotted line) transition scenario, that assumes the goals of the Paris treaty can be obtained, that is, no more than 1949 GtCO2eq are cumulatively emitted. This scenario is obsolete by now, but it is shown for comparison.
Two scenarios are proposed in the figure, with emissions starting to be cut, respectively, by 2020 and 2030. By cutting emissions from 2020 at a rate of −4.4% per year, the resulting emissions curve (2020 Scenario in Figure 1) is compatible with the 1949 GtCO2eq carbon budget. For the scenario starting in 2030, the same goal requires a decline rate of −11% yearly. Note that the choice of an exponential function to simulate the emission trajectory generates a final emission rate in 2100 lower than the 3 GtCO2eq/year fixed by the 2 °C scenario. With this approach, we found 2100 emission values of 1.8 GtCO2eq/year for the 2020 Scenario and 0.023 GtCO2eq/year for the 2030 Scenario.
The next task in our study was to separate the global emissions into two scenarios that correspond to Annex 1 and Non-Annex 1 countries. We started from the historical cumulative emission ratios calculated with the Climate Analysis Indicator Tool, CAIT [39] from 2000 to 2012. We found that, on average, during this period 40% of emissions came from Annex 1 countries and 60% from Non-Annex 1 countries. We assume that this ratio will be maintained also as yearly emissions rate proportions among the two Annex regions during the transitional phase toward a renewable energy system. Different assumptions are possible, but this is the simplest one. We note also that this is not the same as the principle of Common but Differentiated Responsibility (CBDR) as defined [14]; however for this first analysis it allows us to explore the scale of emissions reductions required while noting that further reductions could be necessary if CBDR requires greater effort from Annex 1 countries.
The further step in this analysis is to split this transition scenario for Annex 1 and Non-Annex 1 countries by extrapolating the previous historical trends respectively to 2020 and to 2030 assuming that the 2100 carbon emissions level will maintain the historical 40/60 ratio between the two sets of countries.
It is impossible to satisfy this set of constraints with a simple curve that simulates an exponential decay. In other words, an exponential function cannot, at the same time, generate a given cumulative value for the emissions and a specific value of the yearly emissions in 2100. Therefore, we used a power law to describe the declining emission trajectory. This function allows us to constrain a curve between an initial and a final point and to vary its curvature by changing the value of the exponent, therefore satisfying both conditions above.

3. Results

Figure 2 and Figure 3 are representations of the Transition scenarios, at global, Annex 1 and Non-Annex geographical levels using the previously introduced power law model.
These curves satisfy the conditions set by the Paris treaty. For the 2020 scenario, we found 558 GtCO2eq total carbon budget for Annex 1 countries and 1391 GtCO2eq for Non-Annex 1 countries. For the 2030 scenario, we found 470 GtCO2eq for Annex 1 countries and 1479 GtCO2eq for Non-Annex 1 countries. Note how the Non-Annex 1 curves have a larger relative carbon budget permitted if mitigation starts later; this is because their emissions have been growing faster than those of the Annex 1 countries and this trend is maintained in the non-mitigated section of the scenarios.
At this point, we focused our attention on different Annex 1 countries and on their carbon budgets. The approach we used to split the emissions between Annex 1 and non-Annex countries, was also implemented to find the carbon budget for the EU-28, i.e., assuming the ratio between emissions of different countries or group of countries as constant [40]. The result is that EU-28 cumulative emissions correspond to 18.3% of the total allowed for Annex 1 countries. We assume that this ratio will be maintained during the transition phase up to 2100. Thus, for the 2020 scenario, the EU threshold in 2100 is 18.3% of 0.72 GtCO2eq/year, that is 0.132 GtCO2eq/year, while for the 2030 scenario, we obtain 0.0017 GtCO2eq/year.
The transition trajectories for the EU-28 countries were obtained first by linearly extrapolating the historical emission trend to 2020 and 2030, respectively, and subsequently linking these to the final emissions in 2100 according to a decaying power-law function with the constraint that the total emissions must not exceed the allowed values (see Figure 4 and Figure 5).
The EU target of −80% GHG emissions by 2050 in comparison to 1990 corresponds to a total emission of 1121 MtCO2/year in 2050. Note this constraint is compatible with the 2020 scenario, but not with the 2030 scenario if we use a power law for emissions reduction. In the latter case, the reduction target needs to be, in 2050, much more stringent to meet the goals of the Paris treaty.
As a further step to highlight the importance of cumulative emissions restriction for EU-28, we report also the splitting of GHG emissions by the main sectors, according to the available historical data of European Environment Agency (EEA) and the EU Roadmap projection for reductions (Table 1). The table shows the constraints in GHG emissions by sector that the EU proposed in order to obtain an 80% reduction in the emissions for 2050.
The percentage of decrease for agriculture sector has been estimated by the authors considering that in 1990 the emissions from EU-28 agriculture was around 604 MtCO2/year (EEA) while in 2014 they decreased to 435 MtCO2/year (−28% of 1990). We decided to keep this value constant up to 2050 because according to the Roadmap 2050 estimations [22], the share of agriculture in the EU’s total emissions will rise to about a third by 2050 as global food demand grows, even though the report also states that reductions are possible. This evaluation implies that, in order to compensate an increase in emissions due to the future biomass fuels/food demand growth, agriculture will need to cut emissions from fertilisers, manure and livestock and/or massively contribute to the storage of CO2 in soils and forests. Changes toward a more healthy diet with more vegetables and less meat can also reduce emissions [41]. For the waste and fugitive emissions reported in the EEA database, there are no assumptions on their possible reductions in the Roadmap 2050, but several regulating actions are ongoing at EU level to reduce these contributions [42,43]. Thus we consider here that the emissions from agriculture could remain the same as they are today with any growth in output compensated for by an increase in efficiency which thereby results in the −28% reduction in emissions since 1990 still holding out to 2050.
Considering the green path for EU-28 reported in Figure 4, that is consistent with the emissions goal in 2050 and corresponds to a carbon budget of 122 GtCO2eq (or 33 GtC), the results for future trends for each sector of EU-28 countries are reported in Figure 6.
Considering the green path for EU-28 reported in Figure 5 for the 2030 scenario, a similar trajectory can be obtained, but more restrictive constraints in the emissions reductions are necessary to achieve in the 2030 scenario the same carbon budget calculated for the 2020 scenario, i.e., 122 GtCO2eq. Thus, in Table 2 we propose a possible combination of emissions decreases by sector for the 2030 scenario estimated by the authors. The estimations are consistent with the presence of very small residual value of emission in 2100, due to the fact that most of the carbon budget, 122 GtCO2eq, will be burnt before 2030.
In this way, as already pointed out in Figure 5, we obtain an EU-28 2030 scenario with a declining curve more similar to a cliff than to a gradual reduction (Figure 7).
In the assignment of emission by sectors reported in Table 2, we assume that the main emissions in 2050 would come from agriculture, with the vision that biomass will be employed on a large scale both as food and fuel, while all the other sectors should accomplish a severe decarbonization. Other combinations of emissions by sectors are possible but, in any case, the necessary emission level in 2050 turns out to be incompatible with the 2050 goal set by the EU-28 states: for the 2030 scenario the emissions in 2050 are around 366 MtCO2eq/year instead of 1121 MtCO2/year, as per the EU policy goal.

4. Discussion

At the global level, the concept of a carbon budget is commonly used and well understood. However, it has not been redistributed among sub-geographical levels (e.g., between continents, developed and developing countries, sectors) and the cumulative GHG emissions are not at the centre of any regional policy discussion in European countries, except in the case of the United Kingdom. This is not due to lack of data [44], considering that GHG emissions historical data, and also projections, are available from different sources (e.g., Intergovernmental Panel Climate Change, International Institute for Applied Systems Analysis, United Nations Framework Convention on Climate Change), at least for developed countries. In particular for EU countries, the European Environment Agency gathers those data with the mission to inform the community and the member countries about their potential contribution to the global increase in temperature. The EEA works closely together with national environment agencies or environment ministries that are committed to monitoring the emissions and periodically report their progress. Nevertheless, European climate targets, as already mentioned, consist only of a cut in emissions to be achieved by a certain point in time (−80% of 1990’s GHG emissions by 2050) [45].
The EU is not alone in its approach, as the NDC recommendations are not formulated to account for the carbon budget limits. Thus, also outside the European context, we found only a few preliminary studies [36,46] that have raised the need to think about mitigation policies in terms of allowed ‘cumulative emissions quotas’ per country or region. In particular one study [46] does estimate the carbon budgets over 10 geographical regions, including Europe, and an estimation of the related average mitigation rates. The carbon budget of 122 GtCO2eq assessed in this study is compatible with the blended emission scenarios of 125 GtCO2eq [46] for a 2 °C target of warming. In fact, the 2020 or 2030 pathways we propose are optimized to match, by means of the estimation of the carbon budgets, the long-term stabilization scenarios of 450 ppm of carbon dioxide [47] (corresponding to a 2 °C of global warming) and, in the case of the EU, to match also the 2050 mitigation objectives. Those trajectories also evidence the urgency to implement decarbonization policy as soon as possible: delaying mitigation measures of ten years—from 2020 to 2030—implies the available carbon budget from 2030 is drastically reduced due to a persistent “business as usual” emissions behaviour; thus, the economic sector decarbonisation goals of the present Roadmap 2050 would require much more stringent thresholds.
Our trajectories are also suitable to be employed in Energy System Optimization Models (ESOMs) modelling (for instance in TIMES Integrated Assessment Model World). This family of modelling tools are designed to quantify the features of an energy system, as technical efficiencies, costs, load structures, and also emissions, but in general, the parameters that are emissions policy related are left as exogenous inputs that must be specified before the analysis can be performed. Thus, we can conclude that our scenarios could instead be used as exogenous inputs to perform ESOMs simulations, which are able, once the policy is framed, to estimate the energy needs and the economic consequences of such decarbonization strategy. In this respect, ESOMs help to overcome the limitations of our simple scenarios that do not directly provide evidence of the energy/economic impacts.

5. Conclusions

The aim of this study is to present a simple method to assess European carbon budget scenarios, by means of highlighting the limitation of the present EU mitigation policy strength, in the view that Europe, as a set of developed countries, should play an active role in accomplishing the Paris treaty agreement. The trajectories proposed here link, for the first time, a regional policy to a global policy by means of the estimation of a regional carbon budget. We also found that active policies to reduce emissions for Europe are urgent and should be implemented as soon as possible in order to limit the European contribution to climate change.
The results shown here can support the estimation of the quantitative evolution of carbon emissions. This is achieved by developing trajectories that give estimations of the yearly rate of emissions reduction to achieve the target set by the Paris COP21 agreements, taking into account the constraints given by final objectives of EU policies. At this stage, our results are limited by the assumption that future global and European emissions reduction will occur exponentially, thus we recognize that the feasibility of the EU decarbonization target by 2050 is explored under this approximation. The improvement of the trajectories represents the future task we are already working on, modeling the renewable energy transition in Europe with the MEDEAS model (H2020 funds; www.medeas.eu). Nevertheless, we believe this work can stand independently by the use of MEDEAS model because the scenarios proposed, thanks to their simplicity, can be used as a reference for any other model which has the purpose of assessing emissions trajectories under an EU carbon budget goal, even evaluated as a first approximation. And most of all, we think the study contains a new important message that invites policymakers to revisit the present EU policy mitigation agenda, linking it more actively and quantitatively to the ‘big-picture’ commitments signed within the Paris treaty.

Author Contributions

Conceptualization, I.P. and U.B.; methodology, I.P.; validation, D.N. and A.J.; formal analysis, I.P., D.N. and A.J.; investigation, I.P. and D.N.; data curation, I.P., M.G. and S.F.; writing—original draft preparation, I.P. and D.N.; writing—review and editing, U.B., A.J. and J.S.; supervision, U.B., A.J. and J.S.; project administration, J.S.; funding acquisition, J.S.

Funding

This work was supported by the MEDEAS project, funded by the European Union’s Horizon 2020 research and innovation program under grant agreement No. 691287. The opinion expressed in the present work are those of the authors’ only and are not to be attributed to any organisation of the European Union.

Conflicts of Interest

The authors declare no conflict of interest.

References

  1. United Nations. The Paris Agreement. 2015. Available online: https://unfccc.int/process-and-meetings/the-paris-agreement/the-paris-agreement: (accessed on 22 October 2018).
  2. Bows, A.; Anderson, K. Beyond ‘dangerous’ climate change: Emission scenarios for a new world. Philos. Trans. R. Soc. Lond. A Math. Phys. Eng. Sci. 2011, 369, 20–44. [Google Scholar] [CrossRef]
  3. Matthews, H.D.; Gillett, N.P.; Stott, P.A.; Zickfeld, K. The proportionality of global warming to cumulative carbon emissions. Nature 2009, 459, 829–832. [Google Scholar] [CrossRef] [PubMed]
  4. Allen, M.R.; Frame, D.J.; Huntingford, C.; Jones, C.D.; Lowe, J.A.; Meinshausen, M.; Meinshausen, N. Warming caused by cumulative carbon emissions towards the trillionth tonne. Nature 2009, 458, 1163–1166. [Google Scholar] [CrossRef] [PubMed]
  5. World Resource Institute. Understanding the IPCC Reports. Available online: http://www.wri.org/ipcc-infographics (accessed on 14 November 2018).
  6. Intergovernmental Panel Climate Change (IPCC). Assessment Reports. Available online: http://www.ipcc.ch/ipccreports/tar/wg3/index.php?idp=477 (accessed on 14 November 2018).
  7. IPCC. IPCC III Working Group-Appendix IV: Units, Conversion Factors, and GDP Deflators; IPCC Third Assessment Report-Mitigation; IPCC: Geneva, Switzerland, 2001. [Google Scholar] [CrossRef]
  8. Levin, K. World’s Carbon Budget to Be Spent in Three Decades. Available online: http://www.wri.org/blog/2013/09/world’s-carbon-budget-be-spent-three-decades (accessed on 14 November 2018).
  9. García-Olivares, A.; Ballabrera-Poy, J.; García-Ladona, E.; Turiel, A. A global renewable mix with proven technologies and common materials. Energy Policy 2012, 41, 561–574. [Google Scholar] [CrossRef] [Green Version]
  10. Garcia-Olivares, A. Substitutability of electricity and renewable materials for fossil fuels in a post-carbon economy. Energies 2015, 8, 13308–13343. [Google Scholar] [CrossRef]
  11. Sen, S.; Ganguly, S. Opportunities, barriers and issues with renewable energy development—A discussion. Renew. Sustain. Energy Rev. 2017, 69, 1170–1181. [Google Scholar] [CrossRef]
  12. Capellán-Pérez, I.; Mediavilla, M.; de Castro, C.; Carpintero, Ó.; Miguel, L.J. Fossil fuel depletion and socio-economic scenarios: An integrated approach. Energy 2014, 77, 641–666. [Google Scholar] [CrossRef]
  13. Walter, R. Stahel Circular Economy. Nature 2015, 6–9. [Google Scholar] [CrossRef]
  14. Bridge, G.; Bouzarovski, S.; Bradshaw, M.; Eyre, N. Geographies of energy transition: Space, place and the low-carbon economy. Energy Policy 2013, 53, 331–340. [Google Scholar] [CrossRef] [Green Version]
  15. Korhonen, J.; Nuur, C.; Feldmann, A.; Birkie, S.E. Circular economy as an essentially contested concept. J. Clean. Prod. 2018, 175, 544–552. [Google Scholar] [CrossRef]
  16. Van Vuuren, D.P.; Stehfest, E.; Gernaat, D.E.; Doelman, J.C.; Van den Berg, M.; Harmsen, M.; de Boer, H.S.; Bouwman, L.F.; Daioglou, V.; Edelenbosch, O.Y.; et al. Energy, land-use and greenhouse gas emissions trajectories under a green growth paradigm. Glob. Environ. Chang. 2017, 42, 237–250. [Google Scholar] [CrossRef]
  17. Bardi, U.; Sgouridis, S.; Csala, D. The sower’s way: Quantifying the narrowing net-energy pathways to a global energy transition. Environ. Res. Lett. 2016, 11. [Google Scholar] [CrossRef]
  18. Rockström, J.; Gaffney, O.; Rogelj, J.; Meinshausen, M.; Nakicenovic, N.; Schellnhuber, H.J. A roadmap for rapid decarbonization. Science 2017, 355, 1269–1271. [Google Scholar] [CrossRef] [PubMed] [Green Version]
  19. Climate Interactive Climate Interactive. Tools for a Thriving Future. Available online: https://www.climateinteractive.org/programs/scoreboard/ (accessed on 14 November 2018).
  20. Rogelj, J.; Den Elzen, M.; Höhne, N.; Fransen, T.; Fekete, H.; Winkler, H.; Schaeffer, R.; Sha, F.; Riahi, K.; Meinshausen, M. Paris Agreement climate proposals need a boost to keep warming well below 2 °C. Nature 2016, 534, 631–639. [Google Scholar] [CrossRef] [PubMed] [Green Version]
  21. United Nations Framework Convenntion on Climate Change The Kyoto Protocol. Available online: http://unfccc.int/kyoto_protocol/items/2830.php (accessed on 14 November 2018).
  22. European Climate Foundation the Roadmap 2050 Project. Available online: http://www.roadmap2050.eu/reports (accessed on 14 November 2018).
  23. Committee on Climate Change. Meeting Carbon Budgets—The Need for a Step Change. Available online: https://www.theccc.org.uk/publication/meeting-carbon-budgets-the-need-for-a-step-change-1st-progress-report/ (accessed on 14 November 2018).
  24. Government of United Kingdom-Department for Business Energy & Industrial Strategy. UK Carbon Budgets. Available online: https://www.gov.uk/guidance/carbon-budgets (accessed on 14 November 2018).
  25. Perissi, I.; Bardi, U.; Natalini, D.; Jones, A.; Solé, J.; Falsini, S.; Kimmich, C.; Kerschner, C.; Černý, M.; Capellán-Pérez, I.; et al. Modelling Sustainable Energy System Development under Environmental and Socioeconomic Constraints. MEDEAS Scenarios D3.1, D3.2, D3.3, D3.4. Available online: https:/www.medeas.eu/deliverables/ (accessed on 14 November 2018).
  26. Climate Action Tracker (CAT). Available online: https://climateactiontracker.org/global/cat-thermometer/ (accessed on 14 November 2018).
  27. Fuss, S.; Canadell, J.G.; Peters, G.P.; Tavoni, M.; Andrew, R.M.; Ciais, P.; Jackson, R.B.; Jones, C.D.; Kraxner, F.; Nakicenovic, N.; et al. Commentary: Betting on negative emissions. Nat. Clim. Chang. 2014, 4, 850–853. [Google Scholar] [CrossRef] [Green Version]
  28. Anderson, K.; Peters, G. The Trouble With Negative Emissions. Clim. Chang. 2016, 354, 182–184. [Google Scholar] [CrossRef]
  29. Mastrandre, M.P.B. High Stakes Dangerous Climate Change; IPPR: London, UK, 2006. [Google Scholar]
  30. Zimmermann, H.; Schellnhuber, H.J. Scenario for the Derivation of Global CO2 Reduction Targets and Implementation Strategies; German Advisory Council on Global Change (WBGU): Bremerhaven, Germany, 1995. [Google Scholar]
  31. Climate Interactive C-ROADS. Available online: https://www.climateinteractive.org/tools/c-roads/ (accessed on 14 November 2018).
  32. Calvin, K.; Bond-Lamberty, B.; Clarke, L.; Edmonds, J.; Eom, J.; Hartin, C.; Kim, S.; Kyle, P.; Link, R.; Moss, R.; et al. The SSP4: A world of deepening inequality. Glob. Environ. Chang. 2017, 42, 284–296. [Google Scholar] [CrossRef]
  33. Fricko, O.; Havlik, P.; Rogelj, J.; Klimont, Z.; Gusti, M.; Johnson, N.; Kolp, P.; Strubegger, M.; Valin, H.; Amann, M.; et al. The marker quantification of the Shared Socioeconomic Pathway 2: A middle-of-the-road scenario for the 21st century. Glob. Environ. Chang. 2017, 42, 251–267. [Google Scholar] [CrossRef] [Green Version]
  34. Fujimori, S.; Hasegawa, T.; Masui, T.; Takahashi, K.; Herran, D.S.; Dai, H.; Hijioka, Y.; Kainuma, M. SSP3: AIM implementation of Shared Socioeconomic Pathways. Glob. Environ. Chang. 2017, 42, 268–283. [Google Scholar] [CrossRef]
  35. Kriegler, E.; Bauer, N.; Popp, A.; Humpenöder, F.; Leimbach, M.; Strefler, J.; Baumstark, L.; Bodirsky, B.L.; Hilaire, J.; Klein, D.; et al. Fossil-fueled development (SSP5): An energy and resource intensive scenario for the 21st century. Glob. Environ. Chang. 2017, 42, 297–315. [Google Scholar] [CrossRef]
  36. Kuramochi, T.; Asuka, J.; Fekete, H.; Tamura, K.; Höhne, N. Comparative assessment of Japan’s long-term carbon budget under different effort-sharing principles. Clim. Policy 2016, 16, 1029–1047. [Google Scholar] [CrossRef]
  37. Clarke, L.; Jiang, K.; Akimoto, K.; Babiker, M.; Blanford, G.; Fisher-Vanden, K.; Hourcade, J.C.; Krey, V.; Kriegler, E.; Löschel, A.; et al. Assessing Transformation Pathways. In Climate Change 2014: Mitigation of Climate Change. IPCC Working Group III Contribution to AR5; Cambridge University Press: Cambridge, UK; New York, NY, USA, 2014. [Google Scholar]
  38. International Energy Agency. IEA Finds CO2 Emissions Flat for Third Straight Year Even as Global Economy Grew in 2016. Available online: https://www.iea.org/newsroom/news/2017/march/iea-finds-co2-emissions-flat-for-third-straight-year-even-as-global-economy-grew.html (accessed on 14 November 2018).
  39. World Resource Institute Climate Analysis Indicator Tools. Available online: http://cait.wri.org/ (accessed on 14 November 2018).
  40. European Environment Agency. GAS Data Viewer. Available online: http://www.eea.europa.eu/data-and-maps/data/data-viewers/greenhouse-gases-viewer) (accessed on 14 November 2018).
  41. Aleksandrowicz, L.; Green, R.; Joy, E.J.M.; Smith, P.; Haines, A. The Impacts of Dietary Change on Greenhouse Gas Emissions, Land Use, Water Use, and Health: A Systematic Review. PLoS ONE 2016, 11, e0165797. [Google Scholar] [CrossRef] [PubMed]
  42. Eurostat Greenhouse Gas Emissions from Waste Disposal. Available online: http://ec.europa.eu/eurostat/statistics-explained/index.php/Archive:Greenhouse_gas_emissions_from_waste_disposal (accessed on 14 November 2018).
  43. European Commision. The VOC Solvents Emissions Directive. Available online: http://ec.europa.eu/environment/archives/air/stationary/solvents/legislation.htm (accessed on 14 November 2018).
  44. Riahi, K.; van Vuuren, D.P.; Kriegler, E.; Edmonds, J.; O’Neill, B.C.; Fujimori, S.; Bauer, N.; Calvin, K.; Dellink, R.; Fricko, O.; et al. The Shared Socioeconomic Pathways and their energy, land use, and greenhouse gas emissions implications: An overview. Glob. Environ. Chang. 2017, 42, 153–168. [Google Scholar] [CrossRef] [Green Version]
  45. European Commission. Communication from the Commision: A Roadmap for Moving to a Competitive Low Carbon Economy in 2050; COM(2011) 112 Final; European Commission: Brussels, Belgium, 2011; Volume 34, pp. 1–34. [Google Scholar]
  46. Raupach, M.R.; Davis, S.J.; Peters, G.P.; Andrew, R.M.; Canadell, J.G.; Ciais, P.; Friedlingstein, P.; Jotzo, F.; Van Vuuren, D.P.; Le Quéré, C. Sharing a quota on cumulative carbon emissions. Nat. Clim. Chang. 2014, 4, 873–879. [Google Scholar] [CrossRef] [Green Version]
  47. IPCC. Climate Change 2014 Synthesis Report Summary Chapter for Policymakers; IPCC: Geneva, Switzerland, 2014; Volume 31. [CrossRef]
Figure 1. Global emission scenarios until 2100. Historic trend (black line), “business as usual” (BAU) from the Fifth Assessment Report (AR 5) by the IPCC (black dotted line) and 2 °C consistent (green dotted line) curves are from Climate Action Tracker database. The area under the green line is equivalent to a world carbon budget, 1949 GtCO2eq. Light blue and blue dotted curves are respectively the 2020 and the 2030 Mid Level Transition (MLT) scenarios obtained with exponential decay at constant rates (−4.4%/year in 2020; −11%/year 2030) with the constraint that the area under of each of those curves is equal to the value of the green one (1949 GtCO2eq).
Sustainability 10 04225 g001
Figure 2. 2020 Global scenario. Emissions trajectories at Global Level: BAU black empty dots, 2 °C consistent, green empty dots, 2020 scenarios (cyan dots, −4.4% year). The 2020 scenario split the residual emissions in 2100 considering, on average, 40% of emissions will come from Annex 1 countries (red dots) and 60% from Non-Annex 1 countries (yellow dots).
Sustainability 10 04225 g002
Figure 3. 2030 Global scenario. Emissions trajectories at Global Level: BAU black empty dots, 2 °C consistent, green empty dots, 2030 scenarios (cyan dots, −11% year). The 2030 scenario split the residual emissions in 2100 considering, on average, 40% of emissions will come from Annex 1 countries (red dots) and 60% from Non-Annex 1 countries (yellow dots).
Sustainability 10 04225 g003
Figure 4. 2020 Annex 1 and EU 28 scenarios. Emissions trajectories and cumulative emissions for Annex 1 (red line) and EU 28 countries (green line).
Sustainability 10 04225 g004
Figure 5. 2030 Annex 1 and EU 28 scenarios. Emissions trajectories and cumulative emissions for Annex 1(red line) and EU 28 countries (green line).
Sustainability 10 04225 g005
Figure 6. 2020 EU economic sector scenario. Possible pathways for EU-28 decarbonization, according to the recommendations from EU 2050 Roadmap and the COP21 constraint on global warming.
Sustainability 10 04225 g006
Figure 7. 2030 EU economic sector scenario. Possible pathways for EU-28 decarbonization, according to the recommendations from EU 2050 Roadmap and the COP21 constraint on global warming.
Sustainability 10 04225 g007
Table 1. EU greenhouse gas (GHG) emissions projections in 2050 by sectors as a percentage of reduction of emission in 1990 (Source [22]).
Power GenerationTransportBuildingIndustryAgriculture
−100%−60%−90%−80%−28% 1
1 Estimated by the authors.
Table 2. EU GHG emissions projections in 2050 by sectors as a percentage of reduction of emission in 1990 for the 2030 scenario. Percentages estimated by the authors.
Power GenerationTransportBuildingIndustryAgriculture
−100%−95%−99%−99%−50%

