Article

A Spatial Evolutionary Study of Technological Innovation Talents’ Sticky Wages and Technological Innovation Efficiency Based on the Perspective of Sustainable Development

School of Economics and Management, China University of Geosciences, Wuhan 430074, China
*
Author to whom correspondence should be addressed.
Sustainability 2018, 10(11), 4201; https://doi.org/10.3390/su10114201
Submission received: 23 October 2018 / Revised: 6 November 2018 / Accepted: 12 November 2018 / Published: 14 November 2018

Abstract

:
In China, with the deepening of the reform of industrial structures, the improvement of technological innovation has become a key issue. This is not only related to whether the strategic development of Chinese science and technology can be achieved, but also whether the Chinese economy and high-quality human capital can develop sustainably. Based on the theoretical boundary of sustainable development—free transfer of information—we see that sticky wages are the embodiment of information dissemination. Under the dual effects of profit-seeking behavior and information barriers, the relationship between the sticky wages of technological innovation talents (TIT), as the most profitable labor force, and technological innovation efficiency (TIE) has become more complex, and so far we still have a limited understanding of it. We explore this issue in an empirical study by using a two-stage chain Data Envelopment Analysis (DEA) of TIE followed by modifying the wages of TIT; finally, we build a collaborative evolution model with spatial effects on a large dataset (from 2007 to 2016). The results show that the overall Chinese TIE is relatively low, and in the central and western regions the TIE has been seriously reversed; there are also divergences in the TIE at different stages in the regions we focus on. As the output of technological innovation, except for initial results (such as patents), the more important value is whether it has an ability to transform the initial results into production, and the core of it is whether it can match the market environment and technology transfer system (for example, market mechanism, transformation incentive mechanism, and institutional mechanism). So, considering these aspects, the central and west of China are obviously insufficient, while the east has obvious advantages; this can also explain the results of spatial diffusion, namely, in the eastern region it is higher than in other areas, but the gap between them is gradually narrowing; lastly, from the perspective of synergy, the wage stickiness of TIT in the central region is larger than that of the eastern and western regions, and the evolutionary relationship in the former is “extruding” while in the latter it is “cooperative.” Mainly due to the popularity of the eastern innovation network and the initial state of the west, the barriers of information transmission are relatively low, while the central part is undergoing economic transformation, so its extreme demand for TIT has pushed up the cost of information transmission.

1. Introduction

The labor force, generally referred to as one of the factors of production, and whether it can keep up with economic fluctuations to self-regulate in a timely manner and ensure that different regions improve their adaptability to match the industry structure to achieve sustainable regional development in the context of existing resource endowments and environmental pressures is reported to be a crucial issue influencing a region’s or even a country’s employed population, social stability, wealth accumulation, enterprise survival and development, especially as the labor marketability level has been increasing with the rapid pace of economic globalization [1].
However, considering the vastness of the Chinese territory and the huge differences in regions’ development, the problems of economic structure revealed by the fluctuations of labor force are more prominent, which restricts the sustainability of the overall Chinese economic development. Specifically, the northern area of China has a strong influence on heavy industry, and the continuous outflow of labor force has fueled industrial structure transformations. Meanwhile, in the west of the country, an important mineral resources source and strategic reserve, there is a simple labor force and the primary energy structure has not changed, which means the allocation of production factors is static, the self-repairing function is inhibited, and the bottom-up transformation of the industrial structure seems to be an unattainable vision. The central region has taken on the role of linking the east with the west; whether the transformation of its industrial structure can be successfully completed has a critical bearing on the other two areas. As a pioneer in economic reform, the rich east, due to its geographical advantages, has been leading the way in technological innovations and economic development [2,3].
It is generally believed that, like for sustainable development, an industrial structure that is too singular or heavily dependent on resource endowments would fail to adjust as economic globalization deepens or labor dividends are lost. For various regions, the rise of science and technology innovation industries will force industry to change to ensure sustained output and contribute to the stability of society. However, with China’s aging population becoming a more and more serious issue and labor costs rising, the TIE structure has become the main direction of human capital adjustment [4,5,6].
However, as the economic development and educational resources of different areas are unequal, the gap between high-quality human resources is more and more intense—involving the obvious siphon effect in the east, the mismatch of labor market in the central, and the severe lack of TIT in the west. Some governments can only hope to use the following path to achieve the goal of retaining TIT and obtaining sustainable development: offer financial incentives—pay high wages to attract talent—and set up subsidies and enterprise and college alliances; as a result, large numbers of high-tech industrial parks have sprung up. However, even though local governments have tried their best, it is particularly difficult to promote gradual technological change, further extend industrial gradients, and optimize industrial chains to exploit economic potential. Synchronization between TIE and wage fluctuation in economically backward areas is not obvious. Then, do endowments in regions have a direct or indirect impact on the TIE and sticky wages of TIT? Does the TIE correlate with the TIT wage? Can the two aspects have an impact on regional economic fluctuations and sustainable economic development? The above questions have become the focus of our study, and are also what current policy makers are most concerned about.
The remainder of our paper proceeds as follows. The second part surveys the literature on wage stickiness, especially on TIT wage stickiness, and the relationship between sustainability and the theme of the paper. An overview of the research setting and methodology is then provided in Section 3, followed by a presentation of the dataset and results in Section 4. In the final section, we conclude and make policy suggestions.

2. TIT Sticky Wages and TIE

In the field of regional economic sustainable development, major theories have accumulated focusing on how to obtain sustainability through technological innovation. After an analysis, we find that, although the relationship between technological innovation and sustainable industrial transformation, is clarified, it is still difficult for us to export and graft the theory and macro policy onto the micro production factor system successfully. Further zooming in on the theme of this paper—TIT sticky wages and TIE—although both Arrow and Coase reveal the innovation, technology, and institutions for economic sustainable development, their inferences imply a rigid presupposition that sustainable development is a system that minimizes the loss of information (the existence of transaction costs), in which the participating elements need to evolve in the context of complete information. If we regard sustainable development as an optimal vision, then internal elements must be adjusted to approach the optimal state [7,8]. On the other hand, this means that it is necessary for all active subjects to obtain the optimal ratio after examining the similarities and differences of development methods, and then to strictly enforce the law operation. In fact, such a requirement is difficult to achieve for TIT sticky wages and existing TIE. At the same time, the most important thing is that we cannot completely restore TIT in the economic system, nor can we explain how TIT sticky wages (related to the basic cost of industrial innovation) change over space and time; we cannot even understand the cause and effect between information and sustainability [9].
Going back to the real-life situation in which the research objects are located in China, if we observe the situation over time, we find that, as a result of the diversification of economy, residents have become rich. However, according to official statistical data, most income is still derived from wages, so it is what directly affects urban middle-class income distribution. Based on data from 2003 to 2016, the Gini coefficient of income was basically stable, ranging from 0.47 to 0.49, reaching a peak of 0.491 in 2008; during 2012‒16, it began to decline, ending at only 0.465. Although income disparity has a downward trend, it is still higher than the international definition of the income gap “warning line”—0.4. Compared with the Japanese Gini coefficient (generally around 0.25), and Germany’s of around 0.3, the Chinese income gap is still large, especially for different labor forces. This will be detrimental to the flow of TIT and the sustainable development of the economy. Given the above phenomena, there must be a multifactor, but this study mainly depends on the two main characteristics of the labor market [10,11].
An obvious feature of the TIT labor market is the widespread existence of wage stickiness [12,13]. According to Say’s law, the core idea of supply economics, it is said that the supply will spontaneously generate demand in the operation of an economic system. Wages, determined by the supply and demand rule, can measure the value of labor [14,15]. When wages equal the product of labor productivity and marginal income, the economy will achieve Pareto optimality, but this scenario requires the market to be fair and transparent [16]. However, in reality, sticky wages point to the fact that these prerequisites cannot be completely satisfied. On the one hand, because there is a certain degree of non-public information, namely commercial secrecy, which industry relies on, information transmission barriers are much higher, which means economic entities cannot obtain timely and correct signals. Influenced by Chinese marketization and employment diversification, the mechanism of sticky wages has become more complicated [17] and imperfect information makes it difficult for demand‒supply to have a “sufficient interaction.” Through long-term observation, researchers have found that wages and labor output as well as population have a staggered adjustment mechanism to some extent because both adapt their actions to maximize benefits. Other studies have considered the perspective of contracts associated with the adjustment cost theory, since most wages are based on long-term effective contracts between employers and employees—that is, without considering the information monopoly, if wage can be self-adjusted in a timely manner, economic operations will incur large adjustment costs. Therefore, contractual mechanisms cause inflation and unemployment to coexist with stagflation at a certain level that rejects the Phillips curve’s theory.
The estimation of wage stickiness has been fruitful. For example, Xu as the first to complete the estimation of the Chinese nominal sticky wage in terms of income, length of service, household registration, and industry. He found that the sticky wage is not high compared with other countries and the downward trend is increasing [18]. Liu has made a more detailed estimation by using two different inventory adjustment models to empirically analyze the major industrial sectors in China [19]. At the same time, a stream of literature has emerged from the trade aspect regarding the influence of sticky wages on the economy. Sun examined it at the national trade level, concluding that it not only affects the fluctuation of price trade conditions, but also the length of the cycle [20].
For another thing, because of continuous investment in education over decades and the improvement of living standards brought about by economic development, China has provided a mass of labor made up of high school graduates and above [21,22]. At the same time, due to industrial restructuring policy and the development of high-tech technology, the proportion of TIT is gradually increasing (up to 8.2 in 2016), which directly promotes the overall improvement of the labor quality in China and induces a change in labor characteristics from demographic dividend to human resources—another obvious feature of the TIT labor market. In general terms, in order to ensure the sustainability of the economic restructuring, the well-organized reserve of TIT is a key link that cannot be ignored. Building on the Heckscher‒Ohlin (H–O) model, we predict that the difference of factor prices will eventually approach zero in a homogeneous economic system including indiscriminate goods, zero transaction costs, and equal technology. However, when technology embedding happens, the labor market will be stratified. For workers with different skills, as we have noted, wages are a relatively rich criterion for distinguishing the value of labor, which coincides with the updating of the price of production factors. Helpman [23] conducted a study on the effects of skilled labor that originates from technological change in terms of wage inequalities. Along this line, the research on the relationship between wage differentiation and technological innovation derives from the import and export trade. This, at least, is the common understanding that can be drawn on, namely through foreign investment and import and export trade; new technologies can be acquired at lower cost and enterprises can increase their stockpile of skilled labor. Meanwhile, wages will increase along with the increased trade intensity, especially for export trade in technology-intensive industries, which causes wage inequalities to be more pronounced [24,25,26,27,28,29].
It is worth noting that the trade density correlates strongly with geographic location and the degree of economic development affects the wage differentiation (especially for high-quality talents). There is still space to conduct a further investigation into the binary relationship between wage and technology. In order to more objectively conform to the complex features of the economic system, Helpman and Itskhoki [30] broke the Heckscher‒Ohlin (H–O) model paradigm and tested the relationship between unemployment, the labor market system, and international trade liberalization by constructing a heterogeneous corporate model that added a search friction. Then Burstein and Vogel and Costinot and Vogel supported the view that when an area brings in new technology, the local labor markets may enhance the skill premium as a way to counter the reduction in payment to the normal labor force that is a consequence of the surge in demand for talent. Likewise, as Xu and Li concluded [31], with the transformation of the economy, the level of skill premiums will continue to rise. On the other hand, the technology industry relies on efficiency, which is different from a traditional industry that relies on human or mineral resources. Thus, an intriguing natural phenomenon has taken place—namely, in certain regions the employment of TIT has increased, but the overall employment has decreased, accompanied by the overall average wage of TIT being higher than the per capita disposable income of local residents. What is the effect of this phenomenon? Some scholars have pointed out that it is responsible for the industry development model—the technology industry cannot give rise to labor to achieve a smooth integration with the original industry [32,33,34,35]. In the meantime, the liquidity of labor derived from the received information is always used to make decisions on future expectations after self-assessment. TIT demands are more complex than those of the general workforce.
Obviously, the superposition of the three stages of the Chinese economy creates a conflict between the Chinese planned economy and the free market that becomes more and more irreconcilable; together with the improvement of the technical level of industry, the demand for and attention given to the TIT will increase exponentially. Given the above discussion, since wages account for the majority of the disposable income of residents, serve as the measurement for TIT value and the catalyst for mobilizing the enthusiasm of TIT, and represent the necessary cost of excess profits for industries and enterprises to invest, therefore, wage volatility is related to the sustainability of economic growth, which requires the TIE to achieve steady improvement or stability from the point of view of industries. Examining such a logical chain, and at the same time considering the strong relationship between TIT and TIE, we easily see that the three items have an inseparable relationship. Additionally, in the critical period of Chinese economic transformation, from the single industrial structure, as a practical manifestation of the planned economy, to the free market, how to leverage wages, as a micro-key element to some extent, to alleviate the dilemma of regional economic sustainable development is undoubtedly a “feasible and simple” method. Building on theory and reality, the volatility of “TIE and wage stickiness of TIT” is much more connected with the sustainability of economic growth and social stability than it was before. In this article, we define wage stickiness narrowly as industrial information asymmetry and labor efficiency’s difference.
From this logical deduction, the heterogeneity and scarcity of TIT straightaway determine the efficiency; meanwhile, in view of the information barrier as well as the time lag effect, TIE and wage stickiness are interdependent. By examining the pre-scenario, it becomes evident that the wage stickiness of TIT and TIE does not develop linearly, but through a continuous, complex interaction. Therefore, labor with these characteristics must have strong bargaining power in the labor market. The scarcity is also related to the workplace [36,37,38,39]. So, when considering the wages of TIT, it is necessary to attach importance to their preference for certain geographical areas [40,41,42], which means that the wage must also be tailored to the region. Through the above analysis, studies on wage stickiness and branches of highly qualified labor have accumulated a deep foundation and extensive applications, most of which focus on the relationship between technical and wage differentiation and labor employment, or between wage stickiness and monetary policy fluctuations. However, in the literature, no consensus can be found in terms of the combination of wage level, information asymmetry, technological innovation efficiency, and spatial factors; these inadequacies mean the study is still in a “black box” state. Thus, we expand on these previous contributions and adopt a comprehensive view of the wages of TIT, encompassing both an information and a spatial diffusion dimension.
Based on reasonable assumptions, the paper focuses on the research into the spatial co-evolution of TIE and TIT’s wages. The contribution of this paper is mainly embodied in: (1) decomposing the overall TIE into two stages, that is, the R&D stage and the practical or commercialization stage; we delved into the output efficiency of different stages in different regions to judge whether there was a waste of resources; (2) by combining the regional entropy and gravitational models, we can optimize the impact that the regional geographic location, economic capabilities, and related agglomeration have on wage and efficiency, so the model in the paper is more reliable; (3) we construct a two-agent cooperative evolution model including the spatial diffusion behavior, which gives the established model a certain universality.

3. Methodology

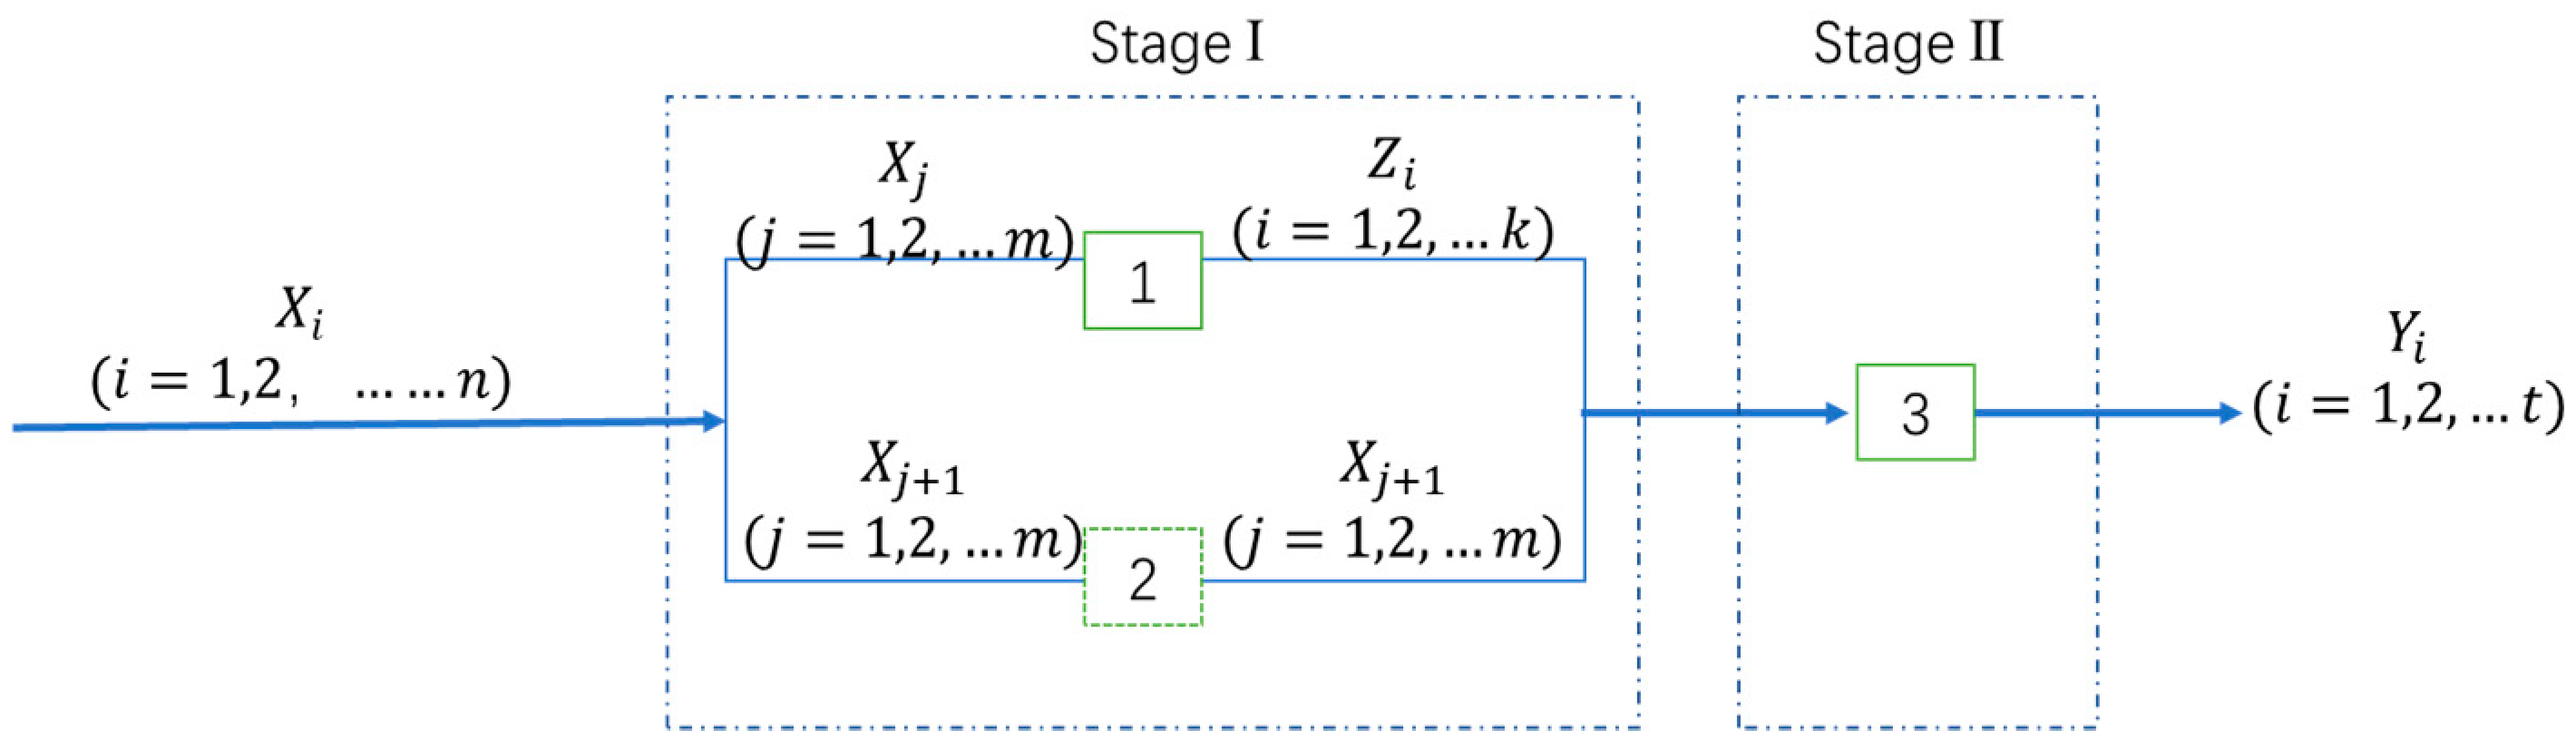
3.1. Two-Stage Chain DEA Model

The main theme of this paper is the interaction between labor and wages, or more precisely TIT remuneration and regional TIE. First of all, one problem we must address is how to accurately measure efficiency. The computation of innovation efficiency has built up some relatively mature methods, most of which are based on the DEA model and improved DEA. Fare and Grosskopf proposed the network DEA method, which calculates every production process separately so as to estimate the effect of each input unit on the final output [43]. However, under this calculation framework, the model cannot calculate the relationship between the subsystems and the whole system. Subsequently, many scholars put forward a two-stage DEA model to overcome the disadvantage that the traditional DEA model cannot conduct a staged calculation. Afterward, Kao made further contributions to the two-stage DEA model, putting additional inputs in the second stage so as to decompose the overall network model into a series or parallel course as shown in Figure 1 [44]. The entire innovation output system is composed of two stages with a series relationship, which reflects the continuity and relevance of each stage. Stage 1 consists of two parts with parallel relationships—the initial innovation inputs ( X j ( j = 1 , 2 , m ) ) yield intermediate outputs ( Z i ( i = 1 , 2 , k ) ) , while another part is the virtual inputs ( X j + 1 ( j = 1 , 2 , m ) ) without any outputs in Stage 1, then going into Stage 2 together with Z i and eventually translating into economic outputs as a whole.
Therefore, technological investment as a type of production factor must have its own particularity—namely, it takes multiple rounds of experiments to obtain actual outputs, and the input‒output in different experimental phases has a chain-like correlation. This network characteristic results in the evaluation of technological innovation output requiring a multi-stage measurement model. This is the advantage of the two-stage DEA, but is a disadvantage of the traditional DEA model. However, the two-stage DEA still has its imperfections. First, in order to ensure the relevance of the two-stage process, the weight of the intermediate stage is not unique, which may bring about moderate differences; secondly, because of the phases, there is a requirement for ensuring the lag period of the different input stages. However, there is no uniform standard between the input and output of the high-tech industry. Therefore, whether the lag period is valid, and whether the intermediate outputs of the technology industry are completely converted within the preset lag period, requires much more complex verification. It is now common practice to set the lag period to 1.
In response to Kao’s method, we decomposed the investigated innovation system into two stages—the R&D stage and the practical or commercialization stage. The input of the second stage equals the initial output and other additional input. Supposing that there are n units of D M U , the intermediate and final output is Z i j ( i , j = 1 , 2 ) and Y i j ( i , j = 1 , 2 ) , respectively, while the input is X i j ( i , j = 1 , 2 , n ) , so the output efficiency can be expressed as:
m i n i n v i X i k
s . t . r 2 u r Y r k = 1
i = 1 n 1 v i X i j p = 1 n 1 w p Z p j 0
i = n 1 n 2 v i X i j + p = 1 n 1 w p Z p j r = 1 2 u r Y r j 0
v i , u r , w p ε .

3.2. Logistical Model of Spatial Diffusion

Technology as a factor in economic fluctuations can be traced back to the 1910s, when Schumpeter first described it as an exogenous variable. Since then it has received much interest from economists conducting research into the effects of technology. How to use simple and appropriate mathematical models to describe technology as a variable has become an important research field within academic circles. The embedding of technology has changed the essence of the economic system by altering technology from an exogenous variable to an endogenous variable. In recent years, there has been more discussion about evolutionary economics and the trend of the evolution of non-linear economic systems has been more and more intense [45,46]. At the same time, along with the maturation and practical application of nonlinear theory, scholars have new ideas for studying the interaction of technological elements and economic systems. The core idea of those systems is that the behavior of each individual is so complex that they should not be considered independently of other dimensions but rather understood as strengthening each other in a form of a feedback loop [47].
According to these premises, we attempt to construct a co-evolutionary model of TIT compensation and TIE.

3.2.1. Co-Evolution Model

Consider a classical logistical equation, as shown in Equation (6):
d N d t = α N ( 1 N K ) ,
where N , α , and K represent, respectively, the population, the intrinsic growth rate of the population, and the maximum population in a given environment.
This model is the simplest way to consider biological survival with a basic assumption that all species live in a homogeneous environment, and all activity are relationships carried out in a constant environment. However, in fact, most populations distributed in space have a certain relationship with their adjacent populations. Therefore, it is necessary to introduce a spatial structure to further investigate the development of the populations.
The description of spatial structure is mainly divided into intuitional spatiotemporal type and implicit spatiotemporal type, because the reaction‒diffusion model in the former has more abundant behavioral solutions (traveling wave solution, self-organized spatial pattern, etc.), so we draw on it to simulate the continuous change of a population in space. In mathematics, the Laplace operator is generally used to express the diffusion behavior [48,49]. In particular, it is shown as 2 N ( x , t ) x 2 for one-dimensional, where x stands for the space transfer direction. Therefore, the logistical model including spatial diffusion is:
d N d t = α N ( 1 N K ) + 2 N ( x , t ) x 2 .
Then we can construct a two-agent cooperative evolution model:
d N 1 d t = f 1 ( N 1 , N 2 ) = Y 1 = α 1 N 1 ( 1 N 1 K 1 β 21 N 2 ) + 2 N 1 ( x , t ) x 2
d N 2 d t = f 2 ( N 1 , N 2 ) = Y 2 = α 2 N 2 ( 1 N 2 K 2 β 12 N 1 ) + 2 N 2 ( x , t ) x 2 .
In a single subsystem N 1 , N 2 , we can elucidate the properties by α 1 , α 2 and the results of their interaction with the internal environment by K 1 , K 2 . It can be seen that the parameter β i j ( i , j = 1 , 2 ) is native to the ecological circle of the biological population that is used to represent the endogenous relationship by the function of N 1 , N 2 . The detailed explanation is that in long-term co-evolution, when β i j > 0 , the j system and the i system have succeeded in embedding into each other’s ecosystem and forming a competitive relationship; the opposite situation would be a synergistic relationship; when β i j = 0 , these two systems are only exchanging information instead of embedding into each other. This change of endogenous effect and unpredictable perturbation will affect the final stability of the system.

3.2.2. Co-Evolution Model of the Monod‒Haldane Function

For a regional economic system, how to extract key relationships and simulate them is the most difficult issue. The construction of Equations (8) and (9) is based on the assumption that all actions are directly internalized with no regard for the external and peripheral relations. For our agents, this model cannot reflect the wage stickiness that stemmed from the external information barrier. Therefore, these formulas appear to be too arbitrary to develop universality, which is why they should be revised to indicate the possible exogenous disturbances (stickiness).
By appending the classic Monod‒Haldane function to the traditional logistical model, we demonstrate the influence of exogenous and transient disturbance, which has enough influence to derail the entire system from the normal state [50]. This transient state emphasizes the relative quantitative control and reflects the mutual restraint and game behavior of the evolutionary participants. This behavior is due to the time-lag effect of the information barrier, so we can use a simpler mathematical equation to help us better characterize the nature of the changes in the collaborative system [51].
The synergetic evolution model of the composite system is established as shown below:
d N 1 d t = f 1 ( N 1 , N 2 ) = Y 1 = α 1 N 1 ( 1 N 1 K 1 β 21 N 2 ) + N 1 N 2 γ 1 + N 1 2 + 2 N 1 ( x , t ) x 2
d N 2 d t = f 2 ( N 1 , N 2 ) = Y 2 = α 2 N 2 ( 1 N 2 K 2 β 12 N 1 ) + N 1 N 2 γ 2 + N 2 2 + 2 N 2 ( x , t ) x 2 .
As we have seen, N 1 , N 2 represents subsystem 1, 2, namely TIT wage and TIE, respectively; γ 1 and γ 2 represent perturbation parameters.

3.3. Indicator and Dataset Source

Indicator Selection

(1)
The dataset source is the China Statistical Yearbook on Science and Technology from 2007 to 2016. The study targets are the three major regions: eastern (Beijing, Tianjin, Hebei, Shanghai, Jiangsu, Zhejiang, Fujian, Shandong, Guangdong, and Hainan Provinces), central (Shanxi, Anhui, Jiangxi, Henan, Hubei, and Hunan Provinces), western (Inner Mongolia, Guangxi, Chongqing, Sichuan, Guizhou, Yunnan, Tibet, Shaanxi, Gansu, Qinghai, Ningxia and Xinjiang 12 provinces and municipalities).
For the first phase, which is the process of initial innovation, the process is one of putting the existing production factors related to technological innovation into production. So it reflects the relationship between technological innovation outputs and R&D resource inputs. From the Douglas production function, there are two latitudes—human resources and funds [52,53]. At the same time, considering that most industries in China still organize technological innovation activities into two categories, self-development and technology introduction, the investment of funds should be divided into two parts. Specifically, this study considers the following indexes (see Table 1): R&D Personnel ( X 1 ), R&D capital inputs (including Intramural Expenditure on R&D ( X 2 ) and external inputs—Expenditure for Purchase of Domestic Technology ( X 3 ), and Expenditure for Acquisition of Foreign Technology ( X 4 )) as the inputs to the first phase. The output indicators at this stage mainly test the transformation of science and technology inputs with no economic benefits. According to this, we consider that it is safer to select the Inventions in Force ( Z 1 ) and Patent Applications ( Z 2 ). The former reflects the patents that have a production ability, while the latter reflects the degree of effort of the company in the process of technological innovation, and also reflects the potential to become an effective patent [54]. This output is also one of the inputs in the second phase.
The second stage is the process of transformation. It can be seen that the improvement of technology and the coupling between technology and enterprise are the key directions. Therefore, on the basis of patents, two additional indicators—Expenditure for Acquisition of Foreign Technology ( X 5 ) and Expenditure for Technical Renovation ( X 6 )—are selected. For measuring the economic benefits, which include competitiveness and profitability, we use the Exports of New Product export value ( Y 2 ) and the Sales Revenue of New Products ( Y 1 ) to reflect the market value of innovation results and the actual income for a company. In addition, technological innovation will also promote the overall output. Therefore, the Enterprise Income ( Y 3 ) is selected [55].
There are several stages in technological industry output, which indicates that each input‒output phase (intermediate output, final output) has a periodicity. Therefore, the effect of R&D activities is not only on the current period, but also on the future. So, for the sake of the robustness of the data, we use the data of t 1 period for X 1 ~ X 4 , the t period for X 5 ~ X 6 and Z 1 ~ Z 2 , and the t + 1 period for Y 1 , Y 2 . For example, the technological innovation output in 2016 corresponds to the input in 2015 and also to the relevant investment in 2014.
According to the two-stage chain DEA model, we have determined the number of indicators in each stage, so our study has a further deduction as shown in the equations: E k 1 , E k 2 are the efficiency of Stages 1 and 2. v 1 * , , v 6 * , w 1 * , w 2 * , u 1 * , u 2 * are the optimal weight from the original model.
E k 1 = ( w 1 * Z 1 k + w 2 * Z 2 k + v 5 * X 5 k + v 6 * X 6 k ) i = 1 6 v i * X i j
E k 2 = ( u 1 * Y 1 k + u 2 * Y 2 k ) w 1 * Z 1 k + w 2 * Z 2 k + v 5 * X 5 k + v 6 * X 6 k
(2)
Estimation of labor remuneration based on geospatial region
With a view to the way TIT are officially counted, so as to unify the caliber and availability of data—mainly the wage—we define them as R&D practitioners. On the other hand, the explanation of X 2 in the China Statistical Yearbook on Science and Technology contains the service fee that is mainly for R&D labor expenditure. Therefore, the average wage of sci-tech talents is derived from the quotient of the total R&D service fee and the number of R&D employees.
The location entropy proposed by Haggett is an important index to figure out the specialization of a particular area, and is often used to analyze the concentration of a specific production department or the role of an area played. Hence, by referring to these current practices, we can effectively express the spatial distribution and position of the average wage of TIT in the whole country, so in this preprocessing, our targets would be endowed with geographical color. The location entropy index based on the labor compensation structure is expressed as in Equation (14), in which Q w i , w i denote the wage in i region and the regional residents’ disposable income, and Q w and w denote the corresponding indicators in China.
Q i = ( Q w i w i ) ( Q w w )
It is undeniable that, although the location entropy can accurately express the spatial agglomeration, in essence it is just a relative value between regions. Nevertheless, the TIT average wage has a strong connection with the regional economic development and the talent structure (mainly the reserve of high-quality talents), and TIE is also directly related to the industrial structure transformation and economics. If these aspects are neglected, we cannot gain any further explanation of the relationship we focus on, resulting in errors. Taking the foregoing factors into consideration, we need to bring in a regional spatial weight matrix to further correct the research data.
(3)
Construction of spatial weighting matrix
The existing spatial weight matrix is mostly combined with spatial econometrics, mainly involving adjacency matrix (0–1 matrix), public boundary distance weight matrix, geographical distance spatial weight matrix, and economic distance spatial weight matrix, which belongs to different perspectives of the spatial relationships (e.g., bordering relations and numbers, spatial distances, and economic relations respectively). Currently in China, it becomes even more difficult when most regions are undergoing an economic transformation, whereby the reserve of TIT is of high importance. This is why many regional governments have launched a “snatching talents” war. Furthermore, the spatial correlation between economic regions must link with active flows of production factors, so the fundamental spatial weight matrix cannot inspect the internal relationship among R&D employees, wage, and spatial distance from a dynamic perspective.
After continuous exploration by domestic and foreign scholars, it has been found that the gravity model in physics can better analyze the spatial correlation effect as making up for the pre-deficiency [56]. Therefore, the paper draws on this model to construct the space weight matrix of TIT wage. The specific mathematical expressions are as follows:
φ i j 1 = K L i L j D i j 2
K i j 1 = φ i j 1 i = 1 j φ i j 1 .
In Equations (15) and (16), φ i j 1 is the correlation degree between TIT of the i and j region, L i is the TIT of i area, D i j is the field bordering length of i and j , K i j 1 is the spatial weight of area i , i = 1 j φ i j 1 is the sum of the correlation of the i and all other regions. According to research experience, K = 1 .
Similarly, the construction of TIE of the spatial weight matrix is in Equations (17) and (18):
φ i j 2 = K G D P i G D P j D i j 2
K i j 2 = φ i j 2 i = 1 j φ i j 2 .
(4)
Net diffusion of the per capita wage space of innovative talents
After the spatial weighting matrix, we estimate the spatial net diffusion degree of the per capita wage and efficiency [57], namely the 2 N ( x , t ) x 2 in the formulas. The exact expressions are as in Equations (19) and (20):
i 2 Q i ( x , t ) i x 2 = j n Δ Q i j K i j 1
i 2 E i ( x , t ) i x 2 = j n Δ E i j K i j 2 .

4. Results and Analysis

4.1. TIE

(1) The efficiency of regional TIT is volatile in the period. Table 2 shows that, no matter the regions or the stages, TIE has large fluctuation, meaning a stable TIE has not yet been formed. The national mean value is around 0.5, indicating that the relative investment in technological innovation is insufficient to support economic development and also reflecting that Chinese economic development model is still at a middle or low technological level. In fact, Chinese R&D investment in tech industries has been increasing year by year. For instance, the average growth rate in the eastern region remained at 23%. If integrated with secondary R&D investment, such as technology import and technological improvement, the growth rate remains at 10%.
(2) The central region resembles the west in terms of the fluctuation trend of TIE, but there is a sharp contrast in the east. Judging by the trend, there is a marked polarization from 2010 (the cutoff point) to 2013; the central and western regions have been significantly synchronized (even in specific years, TIE is basically the same, especially in the second phase), while the east formed an “occlusion” relationship with the central region. We suppose the reason is that a number of sci-tech innovation variables took part in space migration, resulting in a chain reaction, and the terminal TIE formed a regional difference-complementary circumstance.
(3) There is a great diversity in the equilibrium of TIE at different stages. Table 2 further shows another clear result: there is not enough connectivity between the stages, or sometimes even a decline, which directly leads to the low overall TIE. Especially for the central and western regions, the TIE of the first and second stages is in line with the “high to low” style—namely, if the TIE of the first stage is high, then that of the second stage is low and vice versa, which shows that the structure of the staged investment in these two regions is not reasonable. The final TIE needs to be coordinated to gain higher efficiency instead of just counting on a single stage; in this respect, the eastern region has performed slightly better, mainly benefiting from the early economic growth dividend and the accumulative experience of economic reform and high-tech industry cluster in the last decade.

4.2. Spatial Diffusion

(1) The spatial diffusion of TIT in the central and western regions is relatively low, lagging behind that in the east. From Table 3, in the period of 2007 to 2016, the net spatial diffusion was examined by referring to the relevant theories and calculation methods of location entropy and gravitational model. The value of the central and west is similar, around 0.1, showing that both of them diffused insufficiently. Although it is not obvious, their proliferation is gradually increasing. On the other hand, the diffusion value in the east is much higher (by almost 20-fold), indicating that the wages of TIT in the east are more variable.
The values in the eastern region gradually decreased from 3.72 in 2007 to 2.15 in 2016, a decrease of about 42%. The disparity between the west/central and east has tended to shrink, which indicates that, during the study period, the flow of TIT among the three regions increased so steadily that it generated a spatial proliferation of wages.
(2) The capacity of space diffusion of TIE is increasing. Based on the absolute value in Table 3, the spatial diffusion of TIE in the east is superior to that of the others by two orders of magnitude. This indicates that the TIE of the east is not only higher, but can also validly diffuse within the regions, and then bring more agents to participate in the innovation process. Meanwhile, this result also echoes the two-stage DEA empirical research—the eastern region can reasonably allocate innovation resources in Stages 1 and 2 to achieve a virtuous circle—spatial diffusion capacity and TIE continues to strengthen. While the space diffusion of TIE in the central and western regions is relatively low, mainly related to their economic stage and the incomplete industrial chain, it is gratifying that this capacity has also entered the phase of improvement without space barrier.
An interesting phenomenon is that, no matter if we focus on the TIT wage or the TIE, the central region has values slightly smaller than the western region, while it is clear that the economic development of the former is stronger than that of the latter—these two facts seem to contradict each other. However, if we draw on complexity science, we see that the contradiction reveals the spatial complexity of the process of embedding the technological reconstruction into sustainable economic development. Although the economic gap between the central and eastern regions is slightly smaller than that between the west and the east, the TIT in the west must be more willing to leave their positions; additionally, the investment in innovation resources in the central region is the highest, but the redundancy inevitably increases. The overwhelming superiority of the east forces the central region’s innovation competitiveness into a dilemma and the liquidity reduces accordingly.
From the results of the spatial diffusion, we see that a gap between regions exists, which is consistent with the macroscopic phenomenon, but as for the spatial diffusion explaining the spillovers of technological behavior and the ability of the flow of TIT to some extent, namely through the free flow of TIT, the barriers achieving optimal allocation will be reduced; through the diffusion of innovation, the gap between regions is narrowed. According to the regional innovation system theory, such a cyclical process will encourage regional sustainable development. Thus it is generally believed that these two capabilities can result in a change of the development mode of the system—the evolution of the system itself and the free and rational configuration according to the information of the internal elements [58,59]. From the above optimal goal and the results above, it is not difficult to find out that the spatial flow of TIT has not been fully exerted, which further affects the TIE. In addition, we know that the cost of introducing TIT is often several times or even dozens of times that of the general labor force for enterprises, so when the TIE is not improved, from a long-term perspective, it will inhibit the continuous investment of TIT [60,61]. Similarly, from macro to micro, the spatial diffusion capability of TIE measures the influence of regional TIE and the market profitability of innovative products of companies, which is also the cornerstone of continued survival. Therefore, if the TIE diffusion is not sufficient, the allocation of innovation elements will not be reasonable, and the outputs and inputs of innovation will not be directly proportional. Accordingly, both aspects have far-reaching implications for the sustainable accumulation of regional innovation capabilities.

4.3. Co-Evolution

4.3.1. Parameter Estimation

From Equations (10) and (11), we need to solve six key parameters, namely, α 1 , α 2 , β 21 , β 12 , γ 1 , γ 2 . They describe the maximum growth rate in their surroundings, endogenous disturbances and exogenous effects due to interaction with the others in the study period. The solution of the parameters belongs to a constrained nonlinear solution field. In consequence, based on this characteristic, we draw on the equation construction and the optimization solution of operational research. First, we calculated the actual values of Y 1 , Y 2 by the Difference Method, followed by constructing the minimum difference function, and finally we acquired the parameters by the constrained genetic algorithm.
{ Φ = t = 1 10 m i n f ( X ) 2 f ( X ) = Y i α i N i ( 1 N i K i β j i N j ) + N i N j γ i + N i 2 + 2 N i ( x , t ) x 2 s t . i = 1 , j = 2 , X ϵ S S = { α 1 , α 2 , β 21 , β 12 , γ 1 , γ 2 }

4.3.2. Parametric Results and Analysis

The results of α 1 , α 2 , β 21 , β 12 , γ 1 , γ 2 are summarized in Table 4 in order to further verify whether the results are in accordance with the assumptions of the equation construction (the spatial diffusion correlation between the wage and efficiency). We substitute the values of γ 1 , γ 2 into the equation N 1 N 2 γ 1 + N 1 2 , N 1 N 2 γ 2 + N 2 2 to obtain the specific time series, and then inspect the Pearson correlation coefficient, which is widely recognized by academics.
(1) The intrinsic growth rate between regions varies greatly. Regardless of the wages or the efficiency, the east over the central and western regions. The eastern region has a comparative advantage in terms of its economic foundation and its heavy industry having gradually shifted to other regions—especially the coastal belt forming tertiary industry. The eastern region’s endowment in innovation is far higher than the others so as to has sustainable growth potential. Benefiting from a geographic advantages, the central region has a slightly higher growth potential in terms of efficiency than the western region (0.3412), while in terms of wages, the central region has a growth rate of only 0.001; the west’s is even lower (−0.001). We believe the reason why the central and western regions are still in the initial stage of industrial restructuring is that most enterprises still conduct their R&D activity based on the existing industrial structure. Therefore, the wages of TIT cannot be changed significantly at the moment, as the relevant industrial chain of innovation has not been formed yet. The central and western regions both perform poorly in commercialization so enterprises cannot obtain large profits, making it difficult for TIT to have heterogeneity, agglomeration, and bargaining power. Therefore, the space for wage growth is bound to be limited, which complements our previous conclusion on TIE.
(2) There are synergistic differences between wages and efficiency in various regions. First of all, from the parameters β 21 , β 12 , the east and west are the same, opposite to the central region. Based on the relevant parameters of the co-evolutionary model above, the following preliminary conclusions can be drawn: wages and efficiency are positively correlated with each other in the east and west, while in the central region they have an inverse relationship. Secondly, the cooperative evolution of the west is stronger than the east because, compared with the developed east, the west has more urgent demand for innovation. In recent years, the western government has continuously introduced preferential policies to attract TIT and industries [62], particularly limited innovative resources; unlike the east, the west has a process of changing from scratch.
(3) The wage stickiness of TIT tends to be stable, and the correlation between the wage and the efficiency has been verified. Our paper calculates the exogenous correlation term (viscosity property), namely the Monod‒Haldane function (because of the limitation of the length of the article, the results of the viscous part have not been listed). Regarding the wage, except for one individual year (2014), the stickiness in the three major regions fluctuates steadily. Specifically, the stickiness in the eastern region is the lowest, while that in the central region is the highest. The reason may be that the eastern regional TIT and industries can make the relevant information flow faster. At the same time, because the TIE is high overall and the innovative resources are abundant, labor contracts tend to be short-term. This situation accelerates the flow of TIT in the east so that the stickiness is low; the western region often attracts TIT through high wages, but because it lacks a related industry chain, the government is often unable to retain TIT and local wage stickiness is low; the central region has taken over most of the manufacturing industries from the east, and some eastern TIT have returned to the central region due to the high living costs and chance of home ownership [63,64]. What distinguishes the returnees is that they have partially escaped the assumption of the completely rational person hypothesis and have turned to the pursuit of maximum combinative (e.g., stable jobs and matching wages) utility. Therefore, regardless of the stage of the economic industry or the form of the work contract, it (wage of TIT) will produce some time lag and greater wage stickiness. We have verified that wage is highly correlated with efficiency, which indicates that the theoretical basis and the research model in the paper are all effective; on the other hand.
Through the above empirical results, it can be seen that whether we consider innovation efficiency, spatial diffusion of TIE and TIT, or the synergy between TIE and the sticky wages of TIT, there are clear differences between the regions. First of all, the main factors behind the phenomenon of diversification are the level of economic development, the distribution of educational resources, and the coupling of labor quality and industrial demand. In addition, due to the relaxation of labor restrictions in China, the mobility of labor has been intensified, which further exacerbates disparities in this industrial transformation stage [42,65]. Therefore, according to the previous theoretical review, the inequality of human capital is an important reason for the income gap, and the expansion of it is obviously not conducive to the sustainable development of society [66], so we have reason to believe that China will experience continued inequality and cannot reasonably expect an increase in harmony (if the gap is widening further). For another, innovation and the mobility of production factors may drive the adjustment of China’s industrial layout and accelerate the pace of urbanization, especially in economically backward regions, to form complementary industry and TIT structures [40]. Therefore, how to improve the mobility of TIT and perfect the wage formation mechanism are the research questions that need to be focused on.

5. Conclusions and Suggestions for Future Research

We draw on the idea of a two-stage DEA, and decompose the traditional calculation of TIE into a two-stage chain system—the R&D stage and the practical or commercialization stage—followed by the two-agent collaborative evolution model with spatial diffusion behavior and information lag behavior. Finally, using regional entropy and gravity models, we examined the relationship between TIT wages and TIE in different regions (east, central, west) in the period 2007–2016. The main research results show that:
(1)
From the perspective of efficiency, overall Chinese TIE is not too high to reach the optimal status of resource utilization and promotion of economic restructuring. Secondly, the central and western regions are similar in their high output efficiency. For some years, the efficiency in the east has shown a pattern of rising and falling. We speculate that one reason is that, with the development of the eastern industrial technology, the transfer of surplus industry, namely to the central and western regions, may have increased. Finally, due to the reasonable allocation of resources in the early stage of innovation and commercialization in the eastern part of China, the output efficiency of these phases is not too different. We think this will be a positive development trend in the future. The central and western regions have an extremely high TIE in Stage 1 while Stage 2 is low, which suggests that they were blindly pursuing sci-tech innovation output, namely patents, most of which have failed to transfer to Stage 2. That is essentially a huge waste of R&D resources. Regardless of the society or the economic system, the related resources for scientific and technological research are very valuable in terms of acquisition costs and the training period. Therefore, inefficient allocation will not contribute to a virtuous cycle in an economic system. According to the profit-seeking motive, the waste of resources means there maybe little possibility of excess profit, which further affects the adjustment and upgrading of the economic system.
(2)
From the perspective of spatial diffusion capacity, we examine wages and efficiency. As a result, the relevant indicators in the central and western regions are lower than those in the eastern region, but these regions are gradually intensifying their technology import so the gap is shrinking. With the reinforcement of spatial diffusion capacity in the central and western regions, the information cost of innovation will be reduced. To a certain extent, the regions will be forced to eliminate backward production and induce resource-dependent or labor-intensive industries to carry out technology industry transformation. Especially for the resource-based industries that exist in the vast areas of western China, the single, high-pollution, high-energy-consuming industrial structure has severely constrained long-term sustainability. In these areas, the friction between environment, resources, and population has reached a crisis point, so the strategic adjustment of sustainability and TIT/TIE is particularly important.
(3)
The cooperative evolution model has produced more comprehensive results. First of all, it is obvious that the accumulation of wages of TIT in the central and western regions is slow, which means that in these two regions, the instability of TIT is huge, coupled with the fact that the original industrial layout does not match some talents. There may be “suspended” risks that further aggravate the inefficient implementation of relevant policies and greatly restrict regional talent reserves. Secondly, the relationship between wages and TIE in the east and west is cooperative and evolutionary, but in the central region it is “extrusive,” which shows that the adaptation problem of TIT sticky wages and TIE is more serious. The central region serves as a bridge linking east and west; its development status provides a powerful reference for the economic transformation of the west, and also affects whether part of the tech industry in the east implements transfer decisions. In this way, the coordinated relationship between TIT sticky wages and TIE in the central region is not only related to sustainable development itself, but also to the feasibility of Chinese regional step-based transformation and development microscopically [67]. We cannot help but ponder the orientation of the central region—are the industries it introduces reasonable and adequately adapted to local talents?
Based on the sticky wages in some foreign countries and the main research conclusions of this paper, we can put forward some issues that should be given attention, namely how different regions in China can better retain talent and thus form the ladder-shaped layout of China’s industry through the introduction of TIT:
(1)
For the marketization of industrial innovation, we must improve the transforming market environment for industrial innovation achievements and then form an innovative technology trading market according to local characteristics. At the same time, we must strengthen resource investment in the R&D phase and perform sufficient assessment of projects to avoid the emergence of “the only patent” doctrine and waste [68].
(2)
In terms of labor contract management, most Western countries promote enterprises adopting various forms of employment, contributing to the timely and positive response of wages to labor market fluctuations. At the same time, because the wage negotiation process often takes a long time, the labor sector in Western countries requires a lot of participation to achieve rational coordination of the labor force and guarantee fairness of information between every party. As for some Chinese enterprises, the labor contract period is much longer, which intensifies the inflexibility of wages. While the demand for TIT in China is large, the gap between supply and demand is actually not clear, especially when subdivided into industry category scales. Therefore, the disclosure of information is not only conducive to the rapid seeking of suitable positions for TIT to promote TIE, but is also conducive to the formulation and implementation of regional TIT training programs to guarantee regional and sustainable industrial development [69].
(3)
We should pay more attention to the impact of wage flexibility. For the special situation of China, that is, the wage system has been transformed from a rigid “all-inclusive” system in the “planned economy” era to a “salary-linked” one in the “reform and opening-up” era, the wage system is mostly used as an incentive, especially for TIT. In addition, in this process, unemployment often results, so governments should be careful to reduce wage rigidity [70].
(4)
Western countries have observed the advantages of “insiders” negotiating, and often use skills training of internal personnel to increase the transparency of competition. Chinese companies have also experienced the same phenomenon, coupled with the prevalence of social networks, but wages may have been unable to adapt to personnel capabilities. Therefore, enterprises need to gradually improve the staff assessment system and make efforts to retain innovative talent in the system [71].
(5)
Intensifying cross-regional cooperation between different regions, canceling the employment restrictions of the registered permanent residence management system on TIT gradually, thereby lowering information barriers, increasing information transparency, and deepening the space diffusion ability of TIT will win more time and space for the development of industrial sci-tech innovation. In particular, for the central and western regions, more attention must be paid to the spatial allocation of wages of TIT. Through the chain of industry and the integration of TIT package introduction, the regions may be able to retain them. Improving the willingness of TIT to migrate internally may also provide more support for a region to seek a path more suitable to its own development.

Author Contributions

The initial idea for the paper came from X.D. and she did the main job including Literature collection, the research design, data collection, calculated the results and writing the article. J.W. gave many suggestions on the conclusion parts and L.Y. gave a lot of support to guide discussion and revision.

Funding

The authors gratefully acknowledge the support from the National Natural Science Foundation of China (Grant No. 71273246) and the crucial project of philosophical and social science study of the ministry of education in China (Grant No. 12JZD034).

Conflicts of Interest

The authors declare no conflicts of interest.

References

  1. Ciccone, A.; Papaioannou, E. Human Capital, the Structure of Production, and Growth. Rev. Econ. Stat. 2009, 91, 66–82. [Google Scholar] [CrossRef] [Green Version]
  2. An, W.U. Analysis on Reverse Flowing of China’s Industry and Labor. China Ind. Econ. 2004. Available online: http://en.cnki.com.cn/Article_en/CJFDTotal-GGYY200412001.htm (accessed on 14 November 2018).
  3. Sheng-Bing, H.E.; Liu, Y.J.; Zhou, H.R. Why Is It Difficult for the Coastal Industries to Transfer to the Central and Western Regions: An Analysis Based on Regional Salary Differences as Revealed in Recruitment Ads. China Soft Sci. 2012, 1, 229–236. [Google Scholar]
  4. Zhang, S.L.; Lin, Y.; Jiu, E.K. Path dependence, market entry and transformation of resources-based city. Econ. Theory Bus. Manag. 2016, 36, 14–27. [Google Scholar]
  5. Wei, Z.; Hao, R. The role of human capital in china’s total factor productivity growth: A cross-province analysis. Dev. Econ. 2011, 49, 1–35. [Google Scholar] [CrossRef]
  6. Yi, S.; An, X.L. Application of threshold regression analysis to study the impact of regional technological innovation level on sustainable development. Renew. Sustain. Energy Rev. 2018, 89, 27–32. [Google Scholar] [CrossRef]
  7. Arrow, K.J. Social Choice and Individual Values; Yale University Press: New Haven, CT, USA, 2012. [Google Scholar]
  8. Coase, R.H. Lighthouse in Economics. J. Law Econ. 1974, 17, 357–376. [Google Scholar] [CrossRef]
  9. Anadon, L.D.; Chan, G.; Harley, A.G.; Kira, M.; Suerie, M.; Sharmila, L.M.; William, C.C. Making technological innovation work for sustainable development. Proc. Natl. Acad. Sci. USA 2015, 113, 9682. [Google Scholar] [CrossRef] [PubMed]
  10. Fang, X.; Han, X. The Adjustment of Employment and Industrial Structure under the Situation of Transformation of Supply and Demand of Labor Force. Pop. J. 2013, 35, 60–70. [Google Scholar]
  11. Research on Employment under the New Normal of Economy; China Academic Journal Electronic Publishing House: Beijing, China, 2016.
  12. Li, X.; Wang, X. Wage Stickiness, Economic Fluctuation and Monetary Policy Simulation in China Based on a DESG Analysis. J. Quant. Tech. Econ. 2011, 28, 22–33. [Google Scholar]
  13. Erceg, C.J.; Henderson, D.W.; Levin, A.T. Optimal monetary policy with staggered wage and price contracts. Int. Financ. Discuss. Pap. 2000, 46, 281–313. [Google Scholar]
  14. Edge, R.M.; Rudd, J.B. Taxation and the Taylor principle. J. Monet. Econ. 2007, 54, 2554–2567. [Google Scholar] [CrossRef] [Green Version]
  15. Carlsson, M.; Westermark, A. Monetary Policy and Staggered Wage Bargaining When Prices Are Sticky; Working Paper; SSRN: Rochester, NY, USA, 2006. [Google Scholar] [CrossRef]
  16. Christiano, L.J.; Eichenbaum, M. Current Real Business Cycle Theories and Aggregate Labor Market Fluctuations; Federal Reserve Bank of Minneapolis: Minneapolis, MN, USA, 2001; Volume 82, pp. 430–450. [Google Scholar]
  17. Ning, G. Wage Forming Mechanism in the Market Transition Process of China: Evidence from the Panel Data. J. Financ. Econ. 2007, 2, 119–131. [Google Scholar]
  18. Xu, J.; Ji, Y.; Chen, B. An Estimate of the Degree of Nominal Wage Rigidity in China. Econ. Res. J. 2012, 47, 64–76. [Google Scholar]
  19. Liu, P.; Song, Z. Wage Stickiness: A comparative Study of Different Industries in China. J. Econ. Rev. 2002, 5, 47–50. [Google Scholar]
  20. Sun, W.; Ding, X.; Wu, X. Wage Stickiness, Monetary Shocks and Price Terms of Trade. Econ. Res. J. 2013, 48, 81–89. [Google Scholar]
  21. Chi, W.; Freeman, R.; Li, H. Adjusting to Really Big Changes: The Labor Market in China, 1989–2009 the Chinese Economy; Palgrave Macmillan: Basingstoke, UK, 2012. [Google Scholar]
  22. Cai, F. Approaching a neoclassical scenario: The labor market in China after the Lewis turning point. China Financ. Econ. Rev. 2013, 1, 1–15. [Google Scholar] [CrossRef]
  23. Krugman, P.R. Market Structure and Foreign Trade; MIT Press: Cambridge, MA, USA, 1985. [Google Scholar]
  24. Felbermayr, G.J.; Kohler, W. Exploring the Intensive and Extensive Margins of World Trade. Rev. World Econ. 2006, 142, 642–674. [Google Scholar] [CrossRef] [Green Version]
  25. Broda, C.; Limão, N.; Weinstein, D.E. Optimal Tariffs and Market Power: The Evidence. Am. Econ. Rev. 2008, 98, 2032–2065. [Google Scholar] [CrossRef]
  26. Dani, R. What’s So Special about China’s Exports? China World Econ. 2006, 14, 1–19. [Google Scholar]
  27. Appleton, S.; Song, L.; Xia, Q. Has China crossed the river? The evolution of wage structure in urban China during reform and retrenchment. J. Comp. Econ. 2006, 33, 644–663. [Google Scholar] [CrossRef]
  28. Bao, Q.; Shao, M. Export Trade and Wage Growth in China: An Empirical Analysis. J. Manag. World 2010, 9, 55–66. [Google Scholar]
  29. Shao, M.; Liu, Z. Export Bias of Technological Change and Wage Inequality in China. J. Econ. Rev. 2010, 73, 81–89. [Google Scholar]
  30. Helpman, E.; Itskhoki, O. Labor Market Rigidities, Trade and Unemployment. Rev. Econ. Stud. 2010, 77, 1100–1137. [Google Scholar] [CrossRef]
  31. Bin, X.; Li, W. Trade, Technology, and China’s Rising Skill Demand. Econ. Trans. 2008, 16, 59–84. [Google Scholar]
  32. Allen, S.G. Technology and the Wage Structure. J. Lab. Econ. 2001, 19, 440–483. [Google Scholar] [CrossRef] [Green Version]
  33. Huang, Z. An Analysis of Technology ane Labor Supply Effect on China’s Economic Fluctuation—An Empirical Study Based on a Divisible Labor RBC Model. J. Financ. Econ. 2006, 32, 99–110. [Google Scholar]
  34. Shi, W. Consumption Bandwagon, Labor Adjustment Cost and the Business Cycle in China. Financ. Econ. 2012, 12, 13. [Google Scholar]
  35. Yao, X.; Zhou, L.; Lai, J. Technology Change, Demand for Skill and Employment Structure: An Empirical Test on the Skill-biased Technology Change Hypothesis Based on Micro-data of Manufacturing Sector. Chin. J. Pop. Sci. 2005, 47–53, 95–96. [Google Scholar]
  36. Glaeser, E.L.; Mare, D.C. Cities and Skills. J. Lab. Econ. 2001, 19, 316–342. [Google Scholar] [CrossRef]
  37. Rosenthal, S.S.; Strange, W.C. The attenuation of human capital spillovers. J. Urban Econ. 2008, 64, 373–389. [Google Scholar] [CrossRef]
  38. Doms, M.; Lewis, E.; Robb, A. Local labor force education, new business characteristics, and firm performance. J. Urban Econ. 2010, 67, 61–77. [Google Scholar] [CrossRef]
  39. Bacolod, M.; Blum, B.S.; Strange, W.C. Skills in the city. J. Urban Econ. 2009, 65, 136–153. [Google Scholar] [CrossRef]
  40. Chen, Q.; Liang, Q. Technology Comparative Advantage, Labor Knowledge Spillover and Urbanization in Transition Economies. Manag. World 2014, 11, 47–59. [Google Scholar]
  41. Lazzeretti, L.; Capone, F.; Boix, R. Reasons for clustering of creative industries in Italy and Spain. J. Econ. Geogr. 2011, 87, 371–392. [Google Scholar] [CrossRef]
  42. Peng, G. The Matching of Skills to Tasks, Labor Migration and Chinese Regional Income Disparity. Econ. Res. J. 2015, 50, 99–110. [Google Scholar]
  43. Fare, R.; Grosskopf, S. Network DEA. J. Socio-Econ. Plan. Sci. 2000, 34, 35–49. [Google Scholar] [CrossRef]
  44. Chiang, K. Efficiency Decomposition in the Network Data Envelopment Analysis: A Relational Model. Eur. J. Oper. Res. 2009, 192, 949–962. [Google Scholar]
  45. Aghion, P.; Harris, C.; Howitt, P.; John, V. Competition, Imitation and Growth with Step-by-Step Innovation. Rev. Econ. Stud. 2010, 68, 467–492. [Google Scholar] [CrossRef]
  46. Romer, P.M. Endogenous Technological Change. Nber Work. Pap. 1989, 98, 71–102. [Google Scholar]
  47. Wang, Z.L.; Tan, Q.M.; Xu, X.D. The Evolution Model and Empirical Studies of Enterprises Cluster Symbiosis. Chin. J. Manag. Sci. 2006, 14, 141–143. [Google Scholar]
  48. Dalmazzone, S.; Giaccaria, S. Economic drivers of biological invasions: A worldwide, bio-geographic analysis. Ecol. Econ. 2014, 105, 154–165. [Google Scholar] [CrossRef]
  49. Mistro, D.C.; Rodrigues, L.A.D.; Petrovskii, S. Spatiotemporal complexity of biological invasion in a space- and time-discrete predator–prey system with the strong Allee effect. Ecol. Complex. 2012, 9, 16–32. [Google Scholar] [CrossRef]
  50. Raw, S.N.; Mishra, P.; Kumar, R.; Thakur, S. Complex Behavior of Prey-predator System Exhibiting Group Defense: A Mathematical Modeling Study. J. Chaos Solitons Fractals 2017, 100, 74–90. [Google Scholar] [CrossRef]
  51. Feng, X.Z.; Wu, J.H. Longtime behavior for a prey-predator model with predator saturation and competition. J. Wuhan Univ. Nat. Sci. 2009, 4, 381–385. [Google Scholar]
  52. Guan, J.; Chen, K. Modeling macro-R&D production frontier performance: An application to Chinese province-level R&D. Scientometrics 2010, 82, 165–173. [Google Scholar]
  53. Guan, J.; Chen, K. Measuring the innovation production process: A cross-region empirical study of China’s high-tech innovations. Technovation 2010, 30, 348–358. [Google Scholar] [CrossRef]
  54. Florjański, J.; Kłósek, A.; Zalewski, J. Innovation capabilities of European nations: Cross-national analyses of patents and sales of product innovations. Res. Policy 2004, 33, 193–207. [Google Scholar]
  55. Edquist. Systems of Innovation: Perspectives and Challenges. In The Oxford handbook of Innovation; Oxford University Press: Oxford, UK, 2006. [Google Scholar]
  56. Luo, L.; Luo, Y.; Liu, C.; Saileshsingh, G. The Re-Derivation of Bilateral International Trade Test Based on Gravity Model. J. World Econ. 2014, 37, 67–94. [Google Scholar]
  57. Qin, C.; Xiong, X. The Analysis of Dynamic Evolution and Characteristics of Manufacture Transfer in China—Based on the Measure of Relative Net Flow Index. J. Ind. Econ. Res. 2013, 1, 12–21. [Google Scholar]
  58. Wang, H. Sustainable development and technological innovation. In Proceedings of the International Conference on Electronics, Communications and Control, Ningbo, China, 9–11 September 2011; pp. 3969–3972. [Google Scholar]
  59. Anker, L.V. Absorptive Capacity and Innovative Performance: A Human Capital Approach. Econ. Innov. New Technol. 2006, 15, 507–517. [Google Scholar]
  60. Gomes, C.M.; Kruglianskas, I.; Scherer, F.L.; Junior, F.H. Technological innovation management for sustainable development and competitiveness in the internationalisation context. Int. J. Sustain. Soc. 2011, 3, 312–326. [Google Scholar] [CrossRef]
  61. Jia, X.X.; Zhang, Y. Study on the Relationships among Strategic Transform Resource, Risk and Transform Process of Medium and Small Manufacture Enterprise. Econ. Manag. J. 2012. Available online: http://en.cnki.com.cn/Article_en/CJFDTotal-JJGU201208012.htm (accessed on 14 November 2018).
  62. Zeng, X. Analysis on the risk and countermeasures of talent introduction in developed areas. Hum. Resour. Manag. 2016, 2, 163–164. [Google Scholar]
  63. Gong, Y.; Hu, J.; Boelhouwer, P.J. Spatial interrelations of Chinese housing markets: Spatial causality, convergence and diffusion. Reg. Sci. Urban Econ. 2016, 59, 103–117. [Google Scholar] [CrossRef]
  64. Wang, S.; Xu, Y.; Wei, S. Under the background of flee “BSGS”: The ripple effects of first-tier cities’ house price. Syst. Eng. Theory Prac. 2017, 37, 339–352. [Google Scholar]
  65. Arnaud, C.; Jonathan, V. Beyond Ricardo: Assignment Models in International Trade. Economics 2015, 7, 31–62. [Google Scholar]
  66. Zhang, X.; Qiao, K. Regional Economic Interactions in China: Knowledge Spillover or Technological Diffusion? China Econ. Q. 2016, 15, 1629–1652. [Google Scholar]
  67. Feng, H. Research on FDI and regional industrial structure transformation and upgrading—Based on the transfer of industries from the central region to the eastern region. Foreign Econ. Relat. Trade 2011, 12, 82–84. [Google Scholar]
  68. Zhao, J.; Mao, M.-F. Canadian Scientific and Technological Innovation in Environment and Sustainable Development and Its Inspiration. China Pop. Resour. Environ. 2009. Available online: https://www.researchgate.net/publication/294136557_Canadian_scientific_and_technological_innovation_in_environment_and_sustainable_development_and_its_inspiration (accessed on 14 November 2018).
  69. Mosher, J.S.; Trubek, D.M. Alternative Approaches to Governance in the EU: EU Social Policy and the European Employment Strategy. JCMS 2010, 41, 63–88. [Google Scholar] [CrossRef]
  70. Lingens, J. Union Wage Bargaining and Economic Growth; Springer: Berlin/Heidelberg, Germany, 2004. [Google Scholar]
  71. Chu, A.C.; Kou, Z.; Liu, X. Labor union and the wealth-income ratio. Econ. Lett. 2018, 167, 29–35. [Google Scholar] [CrossRef] [Green Version]
Figure 1. Two-stage DEA calculation theory diagram.
Sustainability 10 04201 g001
Table 1. Indicator explanation.
Indicator NameUnitExplanation
R&D Personnel ( X 1 )personThe inputs of the first stage
Intramural Expenditure on R&D ( X 2 )10,000 yuan
Expenditure for Purchase of Domestic Technology ( X 3 )10,000 yuan
Expenditure for Acquisition of Foreign Technology ( X 4 )10,000 yuan
Inventions in Force ( Z 1 )unitThe outputs of the first stage and the inputs of the final stage
Patent Applications ( Z 2 )unit
Expenditure for Acquisition of Foreign Technology ( X 5 )10,000 yuanThe inputs of the final stage
Expenditure for Technical Renovation ( X 6 )10,000 yuan
Exports of New Product export value ( Y 2 )10,000 yuanThe outputs of the final stage
Sales Revenue of New Products ( Y 1 )10,000 yuan
Enterprise Income ( Y 3 )10,000 yuan
Table 2. Regional sci-tech innovation efficiency.
RegionEastCentralWest
Stage 1Stage 2OverallStage 1Stage 2OverallStage 1Stage 2Overall
20070.66600.02430.01620.23830.70320.16760.34960.09520.0333
20080.62820.14370.09030.31210.76930.24010.50480.19090.0964
20091.05540.01790.01891.00200.27780.27830.49110.24890.1222
20100.76110.53600.40791.18310.05580.06601.01880.00000.0000
20110.64101.38220.88601.57870.24130.38091.02490.00000.0000
20120.79012.28651.80671.17020.00000.00001.20250.00000.0000
20131.38770.29280.40630.50172.77271.39090.94951.36641.2973
20140.80021.05060.84080.62412.21191.38050.50152.23081.1187
20150.90400.73860.66771.81290.10170.18431.72640.00000.0000
20160.92801.11611.03571.37640.50350.69311.39110.76981.0709
Mean value0.85620.72140.61770.97990.48800.47820.91600.40820.3739
Table 3. Spatial diffusion.
RegionEastCentralWestEastCentralWest
2 N 1 ( x , t ) x 2 2 N 2 ( x , t ) x 2
20073.72680.06690.1425225,769,313.88975,473,111.801714,696,663.3960
20083.05060.07320.0732279,411,496.00855,813,946.39965,814,121.4550
20093.35470.08000.1619364,969,514.998410,705,969.390025,642,195.0721
20102.36720.08700.1517374,440,995.312018,260,935.301134,464,007.8546
20112.51630.04950.1103514,224,468.069618,997,035.368740,300,694.1853
20122.06190.09330.1371712,528,509.857232,385,132.911662,312,455.5753
20132.05210.33530.3262764,223,665.016733,486,331.324165,778,264.8461
20142.53170.03480.1100894,223,669.262548,760,555.494086,587,110.6389
20152.39400.04620.1321991,599,371.511854,308,840.872697,580,706.4495
20162.15490.12710.20651,044,061,061.79959,203,790.4493106,200,351.8032
Table 4. The result of coefficient solution.
Parameter α 1 α 2 β 21 β 12 γ 1 γ 2 Correlation Coefficient
East0.09680.7185−0.6891−0.4663−0.9589−0.33140.8332
Central0.00100.47610.15541.2170−0.6657−0.6813−0.8642
West−0.00100.3412−1.9560−2.2199−0.6598−0.4213−0.9185

