Article

Decoupling Analysis of CO2 Emissions in Transportation Sector from Economic Growth during 1995–2015 for Six Cities in Hebei, China

1
School of Economics, Minzu University of China, Beijing 100081, China
2
Institute of Geographic Sciences and Natural Resources Research, Chinese Academy of Sciences, Beijing 100101, China
3
University of Chinese Academy of Sciences, Beijing 100049, China
*
Author to whom correspondence should be addressed.
Sustainability 2018, 10(11), 4149; https://doi.org/10.3390/su10114149
Submission received: 18 October 2018 / Revised: 1 November 2018 / Accepted: 8 November 2018 / Published: 12 November 2018

Abstract

:
The transport sector is one of the most important and potential sectors to achieve low-carbon development in China. As economic growth is desirable, but high-level traffic CO2 emissions are not. This paper estimated the on-road traffic CO2 emissions and investigated the decoupling states of traffic CO2 emissions from economic growth for six cities in Hebei province from 1995 to 2015. In 2015, the on-road traffic CO2 emissions were ranked, as follows: Tangshan (4.75 Mt) > Handan (3.38 Mt) > Baoding (1.38 Mt) > Zhangjiakou (1.05 Mt) > Langfang (1.01 Mt) > Chengde (0.46 Mt). Two turning points of traffic CO2 emissions during the study period were found. From 2008 to 2013, the traffic CO2 emissions increased more rapidly than before. After 2013, the traffic CO2 emissions of three cities (Baoding, Handan and Chengde) began to decrease, and the traffic CO2 emissions’ growth rates of the other three cities (Zhangjiakou, Langfang and Tangshan) became lower than before. The decoupling states during 1996–2015 can be divided into four phases: decoupling-coupling concurrence stage (1996–2000), decoupling dominant stage (2001–2008), coupling dominant stage (2009–2013), and improvement stage (2014–2015). Chengde and Baoding were identified due to their good local practice on decoupling CO2 emissions in transport sector from economic growth. These results will enrich the greenhouse gas inventory of China at city level and provide scientific support to achieve the mitigation of CO2 emissions in the transport sector.

1. Introduction

Since 2005, China has taken place of the United States as the largest CO2 emission country. In the Paris Agreement, China has made commitment that it would peak carbon emissions around 2030. The transportation sector is one of the most important and potential sectors to achieve this commitment and low-carbon development in China [1,2]. As CO2 emissions in transport sector can be not completely contingent on similar growth in economic growth, which is seen as desirable especially for developing countries [3], the relationship between economic growth and carbon emissions has attracted more attention form researchers and governors in the field of economy, energy and environment.
A large number of researches use various methods to study the relationship between economic growth and carbon emissions, such as autoregressive distributed lag model (ARDL), input-output method (I-O), regression model, Franger causality test, environmental Kuznets curve (EKC), and decoupling method, etc. The ARDL model can test the long-term relationship between variables with or without the same order of variables, but it is necessary to determine the presence of long-term relationships in the first step before using [4,5]. Since the I-O model is refined to various departments, the data are updated once every five years, and only the national level data are available [6,7]. The regression model is also used in the previous researches, including the simple multiple regressions [8,9] and quantile regression approach [10,11]. When the purpose of the study is to find the causal relationship between the variables in economic activity and carbon emissions, the Granger causality test will be used [12,13]. However, it is dedicated to the driving forces of CO2 emissions, including but not limited to economic growth. The EKC is also a commonly used analytical method, and it can predict the relationship between the CO2 emissions and economic development [14,15,16,17]. However, the EKC model can’t decompose the CO2 emissions from economic growth. The decoupling analysis is helpful in investigating the relationship between CO2 emissions and economic growth and to give scientific support to realize low-carbon development [18]. Compared to the above methods, the decoupling method is easier to calculate, and it can effectively identify places where have good local experiences to achieve decarbonization.
The concept of decoupling was originated from physics and firstly introduced by Zhang [19] into environmental research. Since OECD (Organization for Economic Cooperation and Development, OECD) presented a decoupling indicator in 2002 [20], the decoupling method has gradually become a popular way to explore the relationship between CO2 emissions and economic growth, especially in the transport sector. Then, it was improved and formed three main decoupling models, namely OECD decoupling factor, IPAT based model [21,22], and Tapio elastic model [23]. Tapio’s elastic decoupling model can distinguish the “absolute decoupling” state between economic growth and economic recession by dividing the decoupling state into eight categories, which the first two models cannot discriminate.
From the perspective of spatial scale, the previous research on the decoupling relationship between traffic CO2 emission and economic growth mainly applied the decoupling model at the national level, and some focused on one or several provinces. Loo and Banister [3] explored the transport decoupling in 15 major countries, including the United States, China, Russia, and Brazil, etc., from 1990 to 2012 through an extended Tapio’s decoupling model, which detailed absolute and relative decoupling in strong and weak version, covering the economic, environmental, and social dimensions. Positive trends in decoupling traffic CO2 emissions from economic growth was observed, but the absolute decoupling is still harder to achieve in transport sector. Timilsina and Shrestha [24] found that economic growth was one of the principal factors driving traffic CO2 emissions in Argentina, Brazil, Peru, Uruguay and some other Latin American and Caribbean countries. They also proposed that decoupling the CO2 emissions from economic growth through policies, such as promoting fuel switching and reducing transportation energy intensity, was necessary. From the perspective of fuel types, Wu et al. [25] analyzed the decoupling states between traffic CO2 emissions and transport development. They suggested that the transport sector in China was far from decoupling state. As for provincial decoupling analysis in China, the economically developed southeast coastal provinces received most attention. The decoupling analysis between transport output and carbon emissions of the transport sector in Guangdong, the most populated and richest province in China, was investigated during 1995–2012. Five-year periodic pattern of fluctuations of decoupling state highlighted the important effects of the National Five-Year Plan on Guangdong’s decoupling effort. An obvious periodical characteristic of decoupling state was also found by Wang et al. [26] in the Jiangsu province from 1995 to 2012. The CO2 emissions of transportation caused by electricity power was also be estimated in their research, and the results showed that the CO2 emissions in transportation sector caused by electricity power made no obvious difference on decoupling states in the case study. In addition, the decoupling indicators were introduced to analyze the delinking relationship between transport growth and environmental pressures in Xinjiang by Dong et al. [27]. Zhu and Li [28] combined decomposition model and decoupling elasticity index to identify the influencing factors’ impact on carbon emissions in transportation sector in the Beijing-Tianjin-Hebei area. The results indicated that economic growth and population size played positive roles in the increment of transportation-related CO2 emissions, while the energy intensity and industrial structure played negative roles. However, the decoupling analysis of the economic growth and traffic CO2 emissions are deficiency at the city level. With the 13th Five-Year Plan to Control Greenhouse Gas Emissions proposing that conduct accurate management of carbon emissions in urban areas, and the 13th Five-Year Plan for Development of Modern Integrated Transportation System proposing that transport sector is a significant field to establish low-carbon city. There is an urgent demand for city, an important administrative unit for implementing the national carbon reduction target in China, to explore the decoupling of CO2 emissions in transport sector from economic growth.
According to the China Statistical Yearbook, the gross domestic product, the possession of civil vehicles, and the possession of vehicles for business transport in Hebei province remained the top 10, top five, and top three in China during 2000–2016, respectively. As a province with high environment pollution and greenhouse gas emissions due to high level of economic activities, in addition to the geographical proximity of Beijing and Tianjin, Hebei attracted more attention from national government in recent years. In 2014, President Xi Jinping proposed that “the coordinated development of Beijing-Tianjin-Hebei is of great significance and it should be raised to the national strategic level”. The Beijing-Tianjin-Hebei Collaborative Development Plan, issued in 2015, proposed to break through key areas, including transportation, industrial upgrading, and environmental protection. After that, the 13th Five-Year Plan proposed that Beijing-Tianjin-Hebei coordinated development should optimize urban spatial layout and industrial structure, orderly dismantle Beijing’s non-capital functions, promote transportation integration, and expand environmental capacity and ecological space. In 2016, the Ministry of Environmental Protection of the People’s Republic of China issued the Beijing-Tianjin-Hebei Collaborative Development Ecological Environmental Protection Plan. This plan clarified the Beijing-Tianjin-Hebei energy conservation and emission reduction targets. At the same year, the 13th Five-Year Development Plan for Transportation, Energy Conservation and Environmental Protection, issued by the Ministry of Transport of the People’s Republic of China, viewed Beijing-Tianjin-Hebei integrated green transportation as a major strategy, and proposed to construct green transportation cities in the Hebei Province. Clarifying the decoupling state of CO2 emissions in transportation sector from economic growth is an important prerequisite for the local government to formulate traffic CO2 mitigation policies.
By addressing the above referenced deficiencies, this study explored the decoupling relationship between traffic CO2 emissions and economic growth at the city level covering a long period for the first time. Six cities, including Tangshan, Handan, Baoding, Zhangjiakou, Langfang, and Chengde, in Hebei province, China were selected. Cities, which have good local practice to mitigate traffic CO2 emissions when strive for economic growth, were identified. The estimation results of the on-road traffic CO2 emissions for the six cities during 1995–2015 period will enrich the cities’ inventory of CO2 emissions. The decoupling analysis results are expected to provide scientific support for the establishment of low-carbon city, especially in the field of transportation. The remainder structures of this study are as follows. In Section 2, the data collection and methodology were introduced. The results were shown in Section 3. Section 4 proposed the discussion. The conclusions were summarized in Section 5.

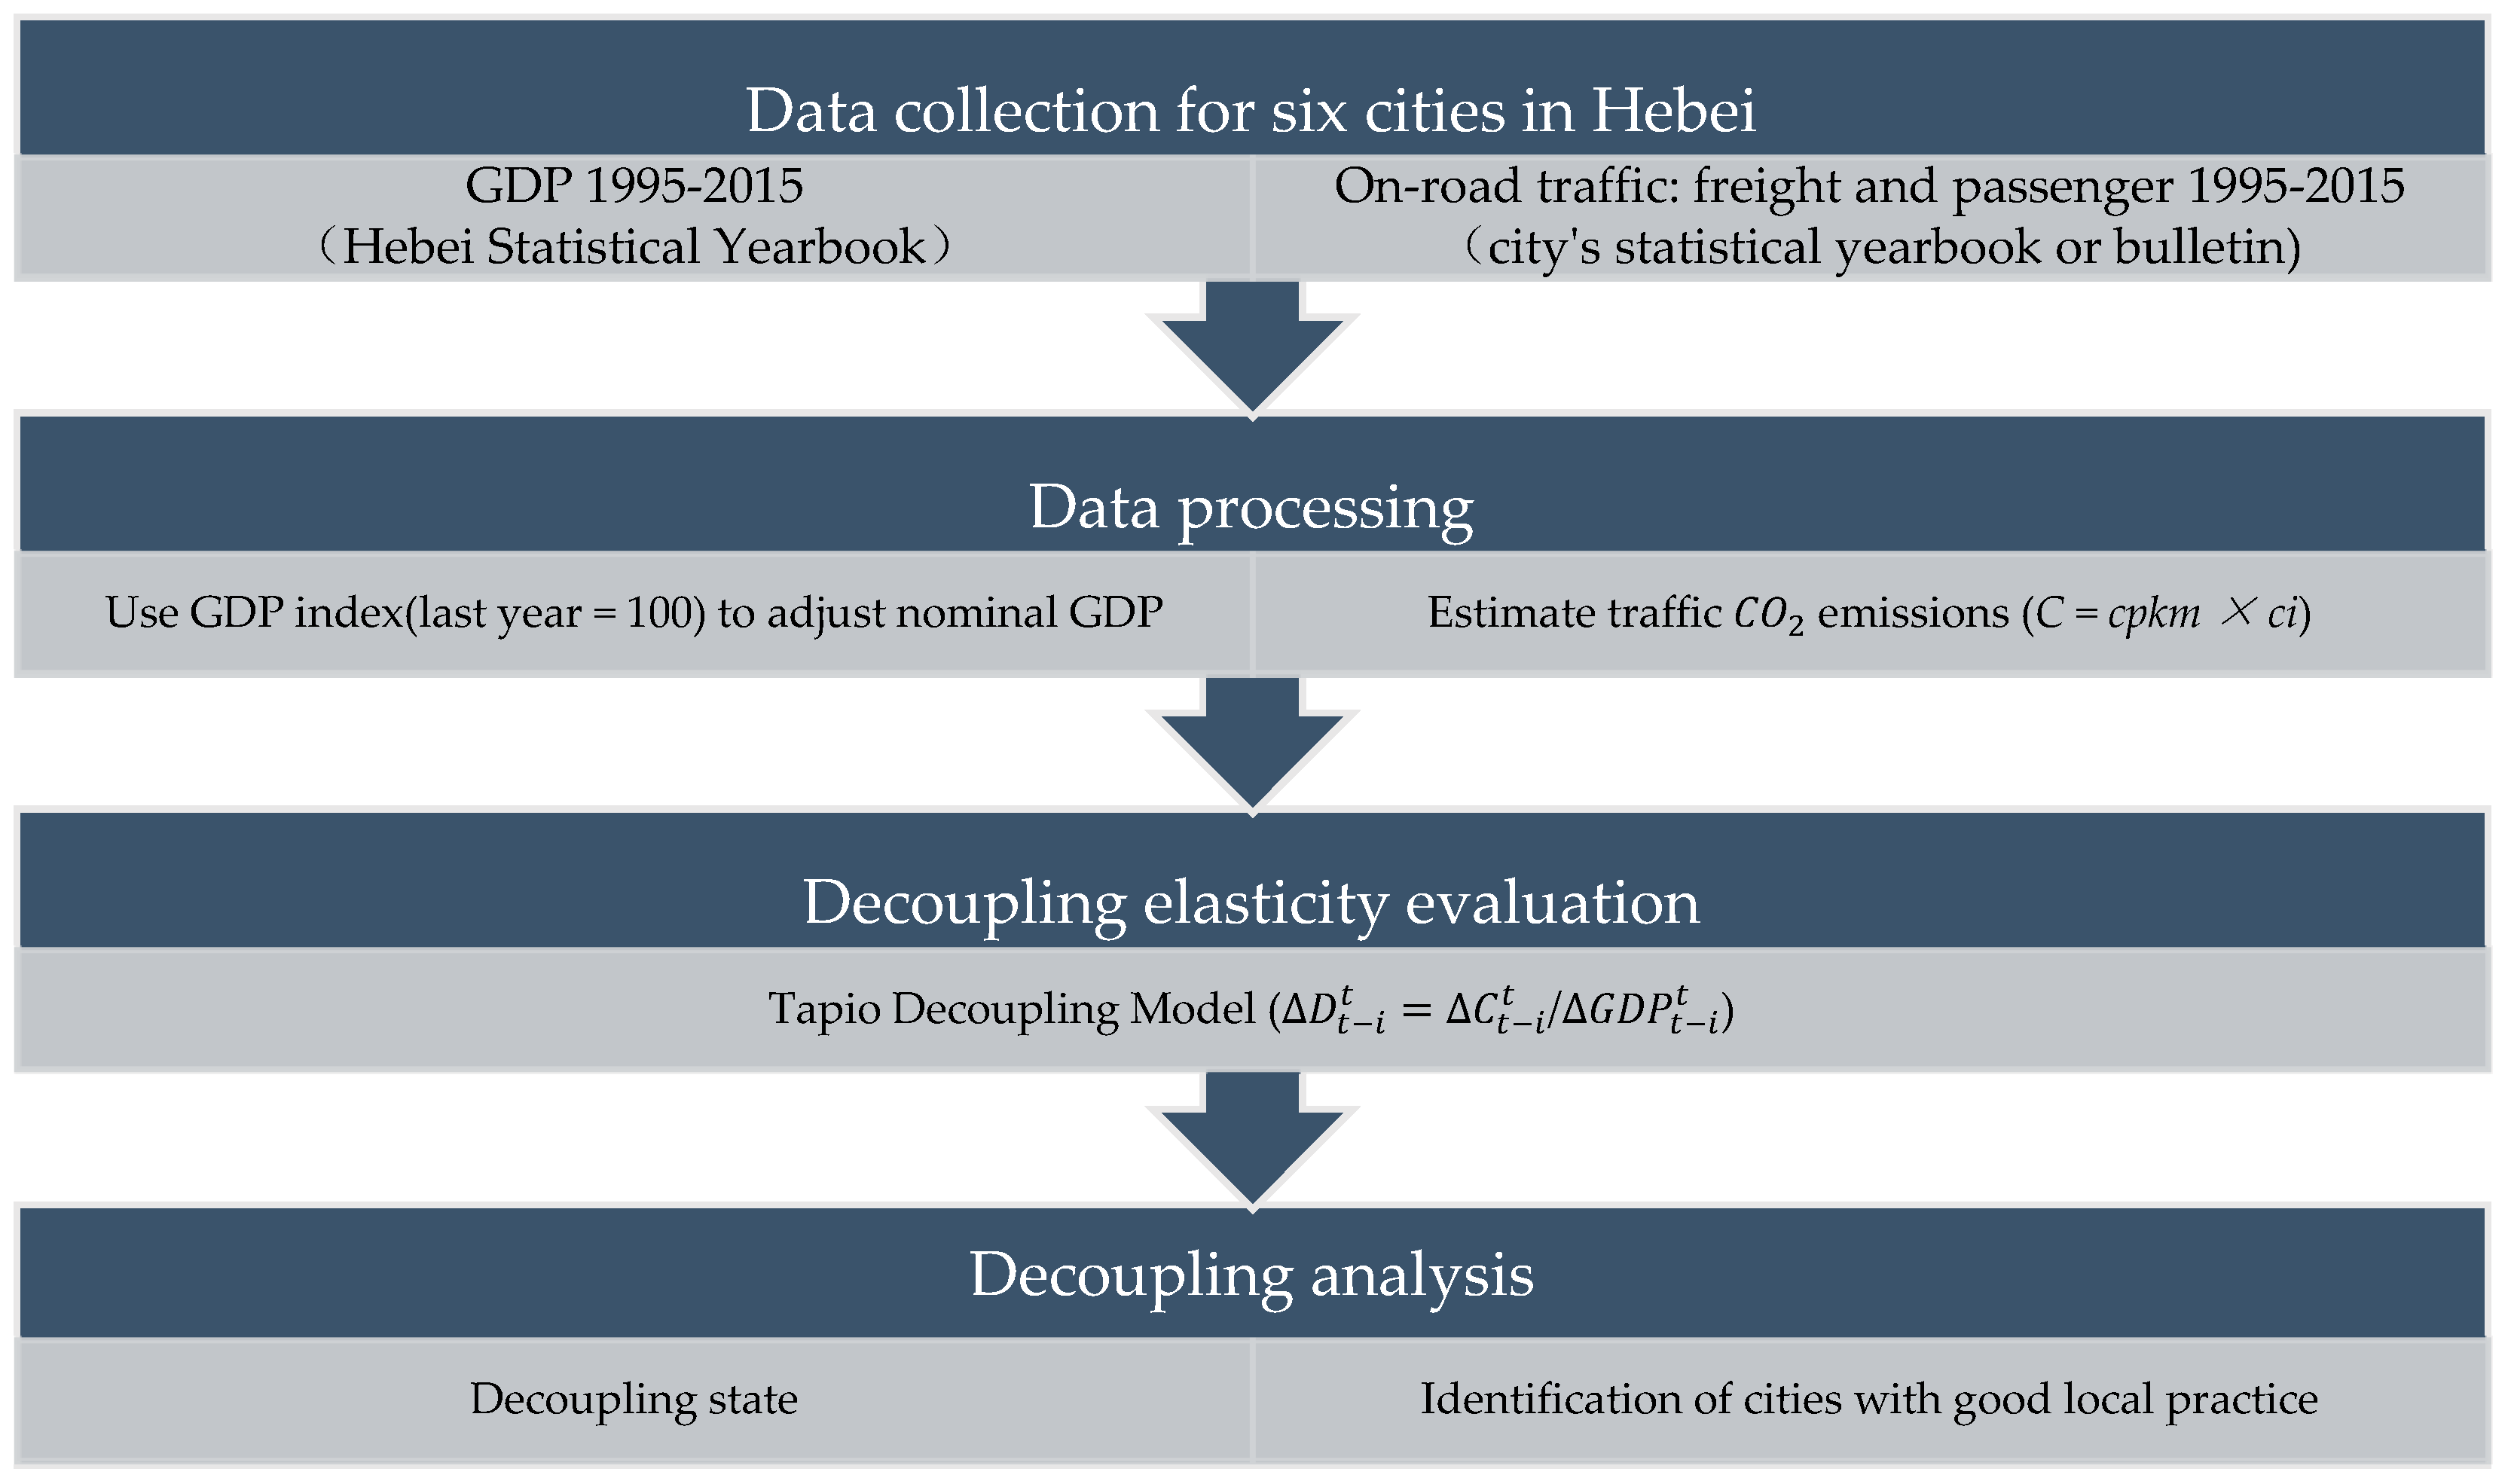
2. Materials and Methods

Figure 1 showed the flowchart of this study, which generally contained four major parts, as follows: (i) collecting the gross domestic production and on-road traffic data; (ii) estimating of on-road traffic CO2 emissions by “bottom-up” approach and adjusting the GDP according to the constant price of 1995; (iii) evaluating the decoupling elasticity through Tapio Decoupling Model; and, (iv) conducting decoupling analysis, which includes the decoupling status analysis and identifying cities with good local practice to mitigate traffic CO2 emissions. The details of each part were described in the subsection.

2.1. Calculation of the CO2 Emissions in Transport Sector

According to the IPCC (Intergovernmental Panel of Climate Change, IPCC) “bottom-up” method, the traffic CO2 emissions can be calculated, as follows:
C = cpkm × ci
where C represents on-road traffic CO2 emissions, and the right side of the equation consists of two parts, as follows: (1) cpkm represents the amount of road transport turnover. Taking into consideration the differences between passenger and freight transport, raw data record passenger traffic and freight traffic separately. However, in order to obtain the CO2 emissions generated by the entire road transport, we convert the freight turnover into passenger turnover according to the formula of 1 tkm = 10 pkm, which is from the Future of Transport Report from European Commission [29]. On this basis, we calculate the whole converted pkm (cpkm), which is the sum of the converted tkm and pkm. (2) The amount of road traffic that has been converted above is multiplied by the traffic carbon emission intensity factor (ci), which is shown in Table 1.

2.2. Tapio Decoupling Model

The Tapio’s decoupling elasticity model are widely applied in the transport sector to explore the relationship between economic growth and CO2 emissions. The decoupling index can be expressed, as follows:
D t i t = C t i t G D P t i t
where D t i t denotes the decoupling index from year ti to year t, Δ C t i t and Δ G D P t i t refer to the percentage changes of traffic CO2 emissions and economic development, respectively. The formulas for Δ C t i t and Δ G D P t i t are as follows:
C t i t = ( C t     C t i ) C t i  
G D P t i t = ( G D P t     G D P t i ) G D P t i  
The state of decoupling between CO2 emissions in transport sector and economic growth can be divided into eight categories according to the typology that is proposed by Tapio [23]. The typology is shown in Table 2.

2.3. Data Description

The data of GDP (Gross Domestic Product, GDP) and GDP index from 1995 to 2015 comes from the Statistical Yearbook of Hebei Province from 1996 to 2016. The cities’ road traffic data are collected from the city’s statistical yearbooks and the cities’ statistical bulletin. The details are shown in Appendix Table A1. GDP index is used to adjust the nominal GDP of each city according to the constant price of 1995, so as to exclude the impact of price changes. Six cities in Hebei province are introduced into this research. The six cities include industrial city (Tangshan, Handan, and Baoding), tourism city (Chengde) and high-tech industrial city (Langfang), and industrial transformation city (Zhangjiakou, transformation from industry to tourism). Geographically, it also distributes the northern, central, and southern areas of Hebei Province.

3. Results

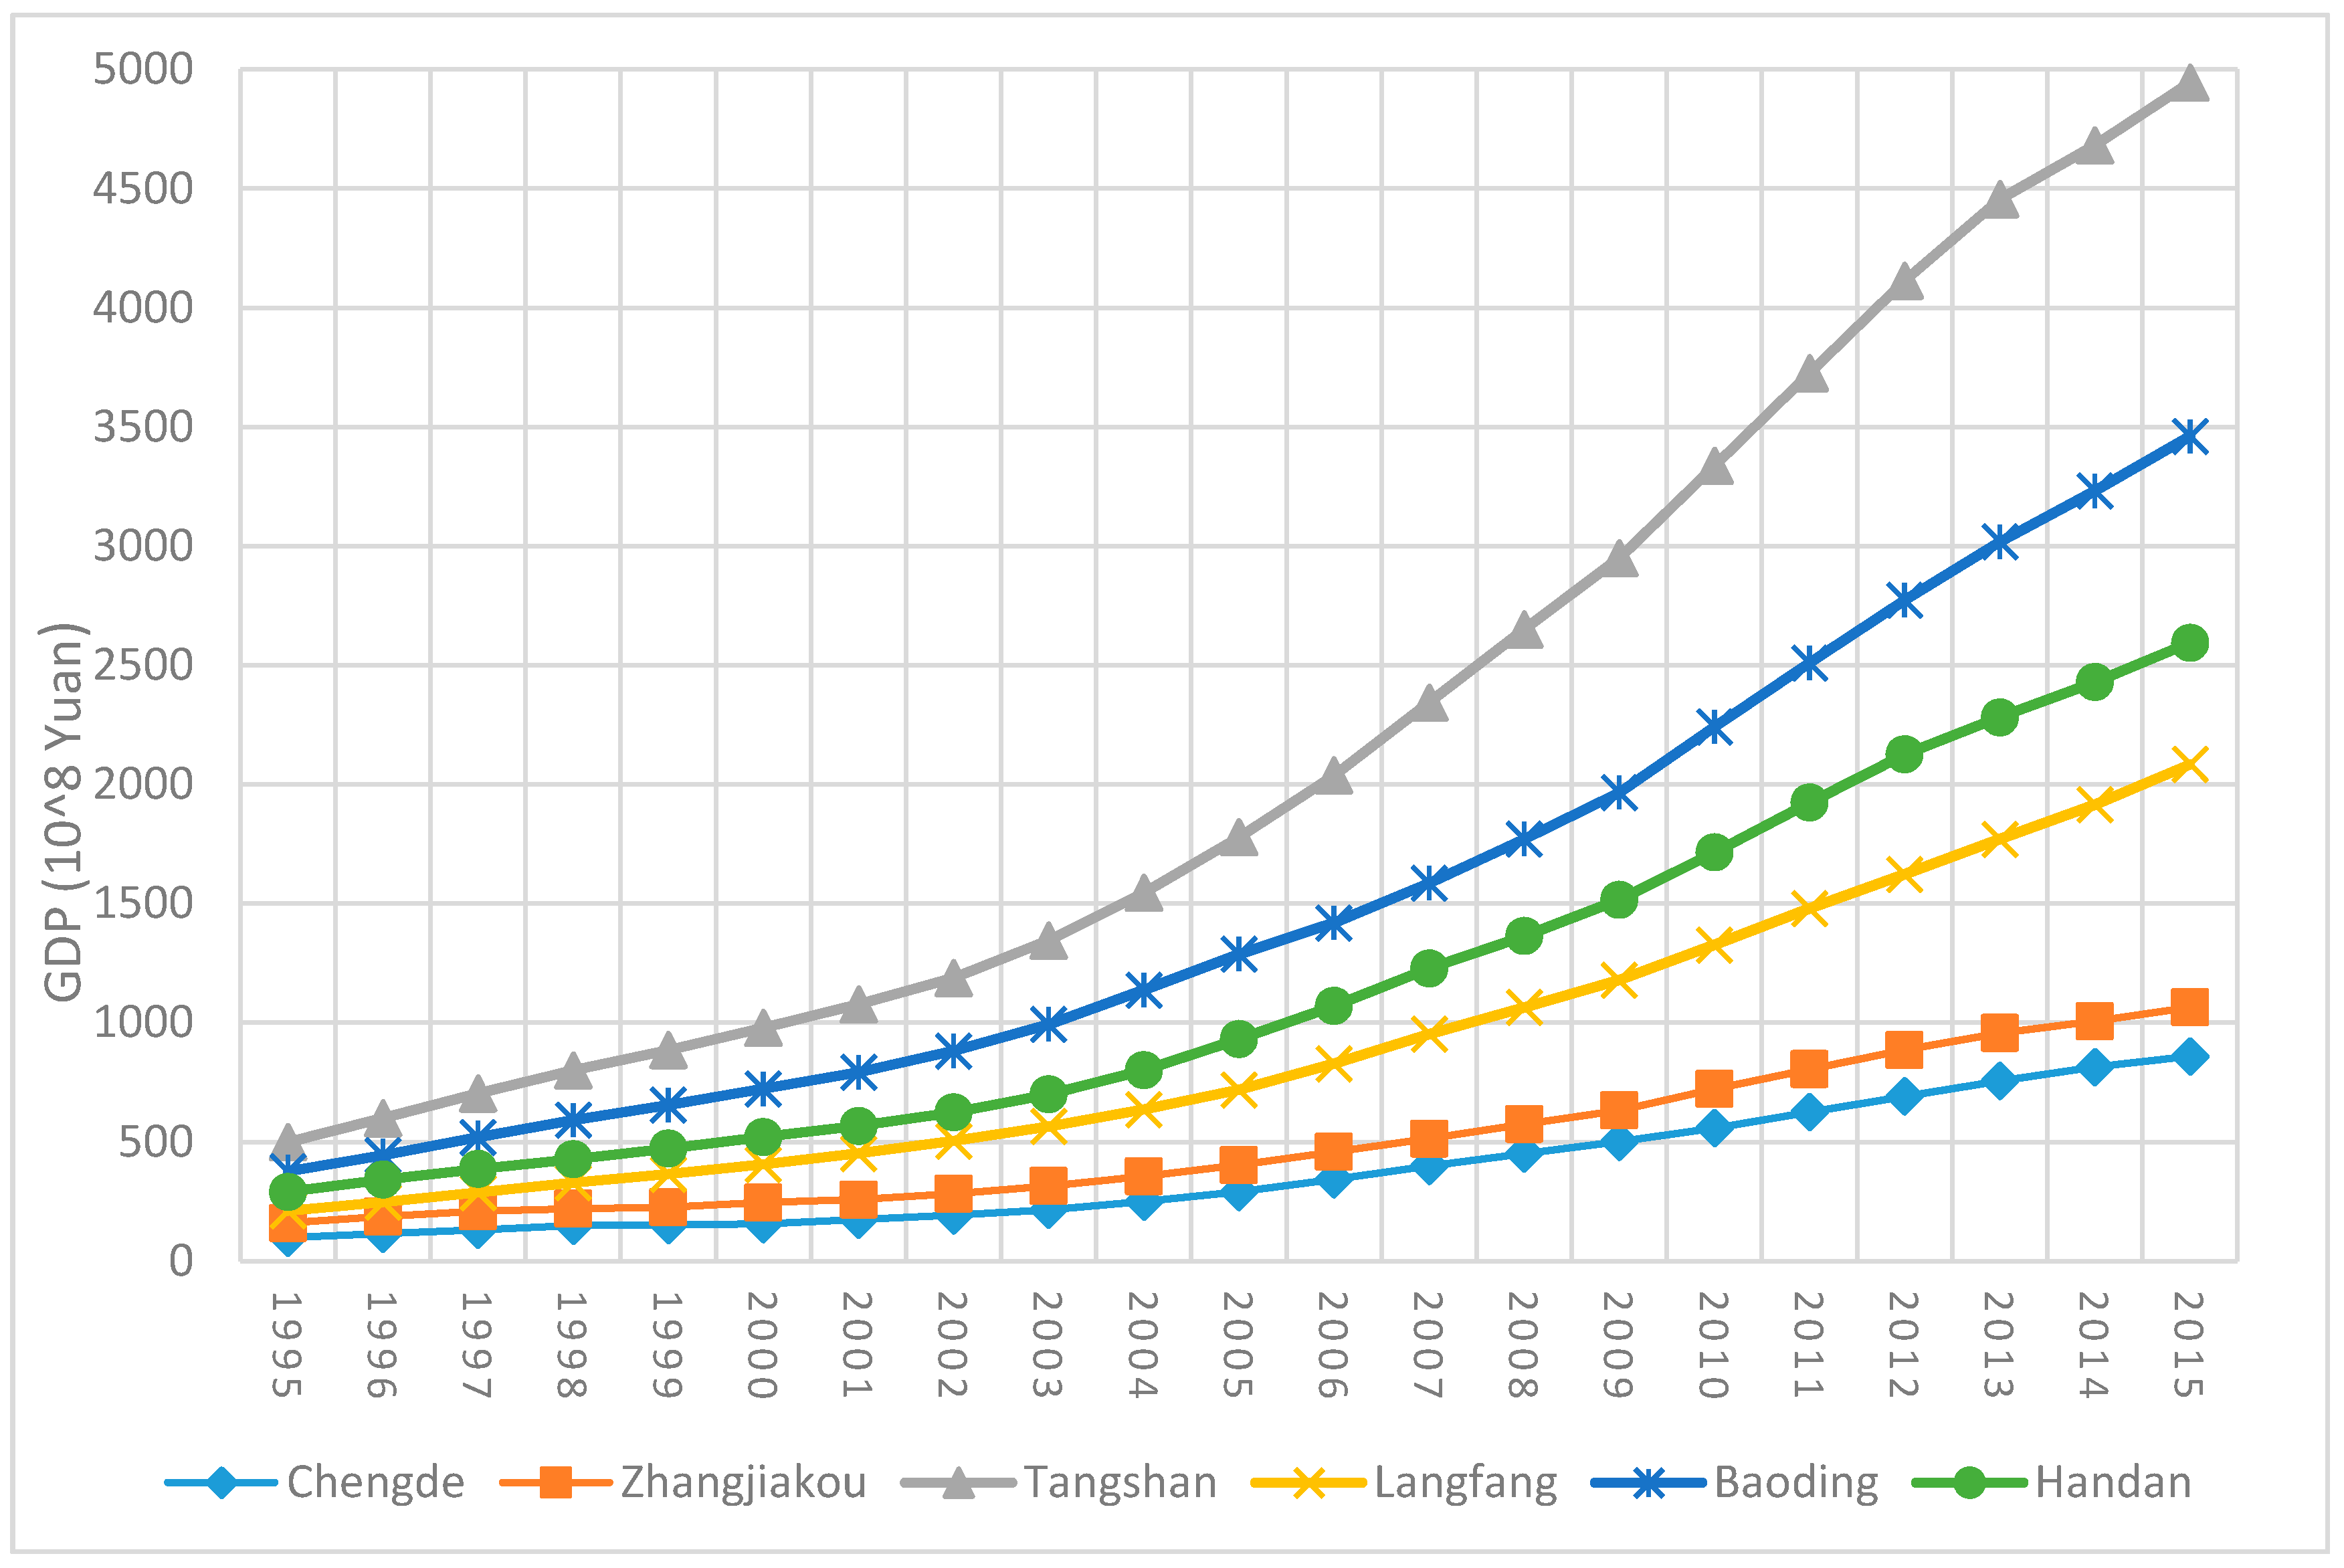
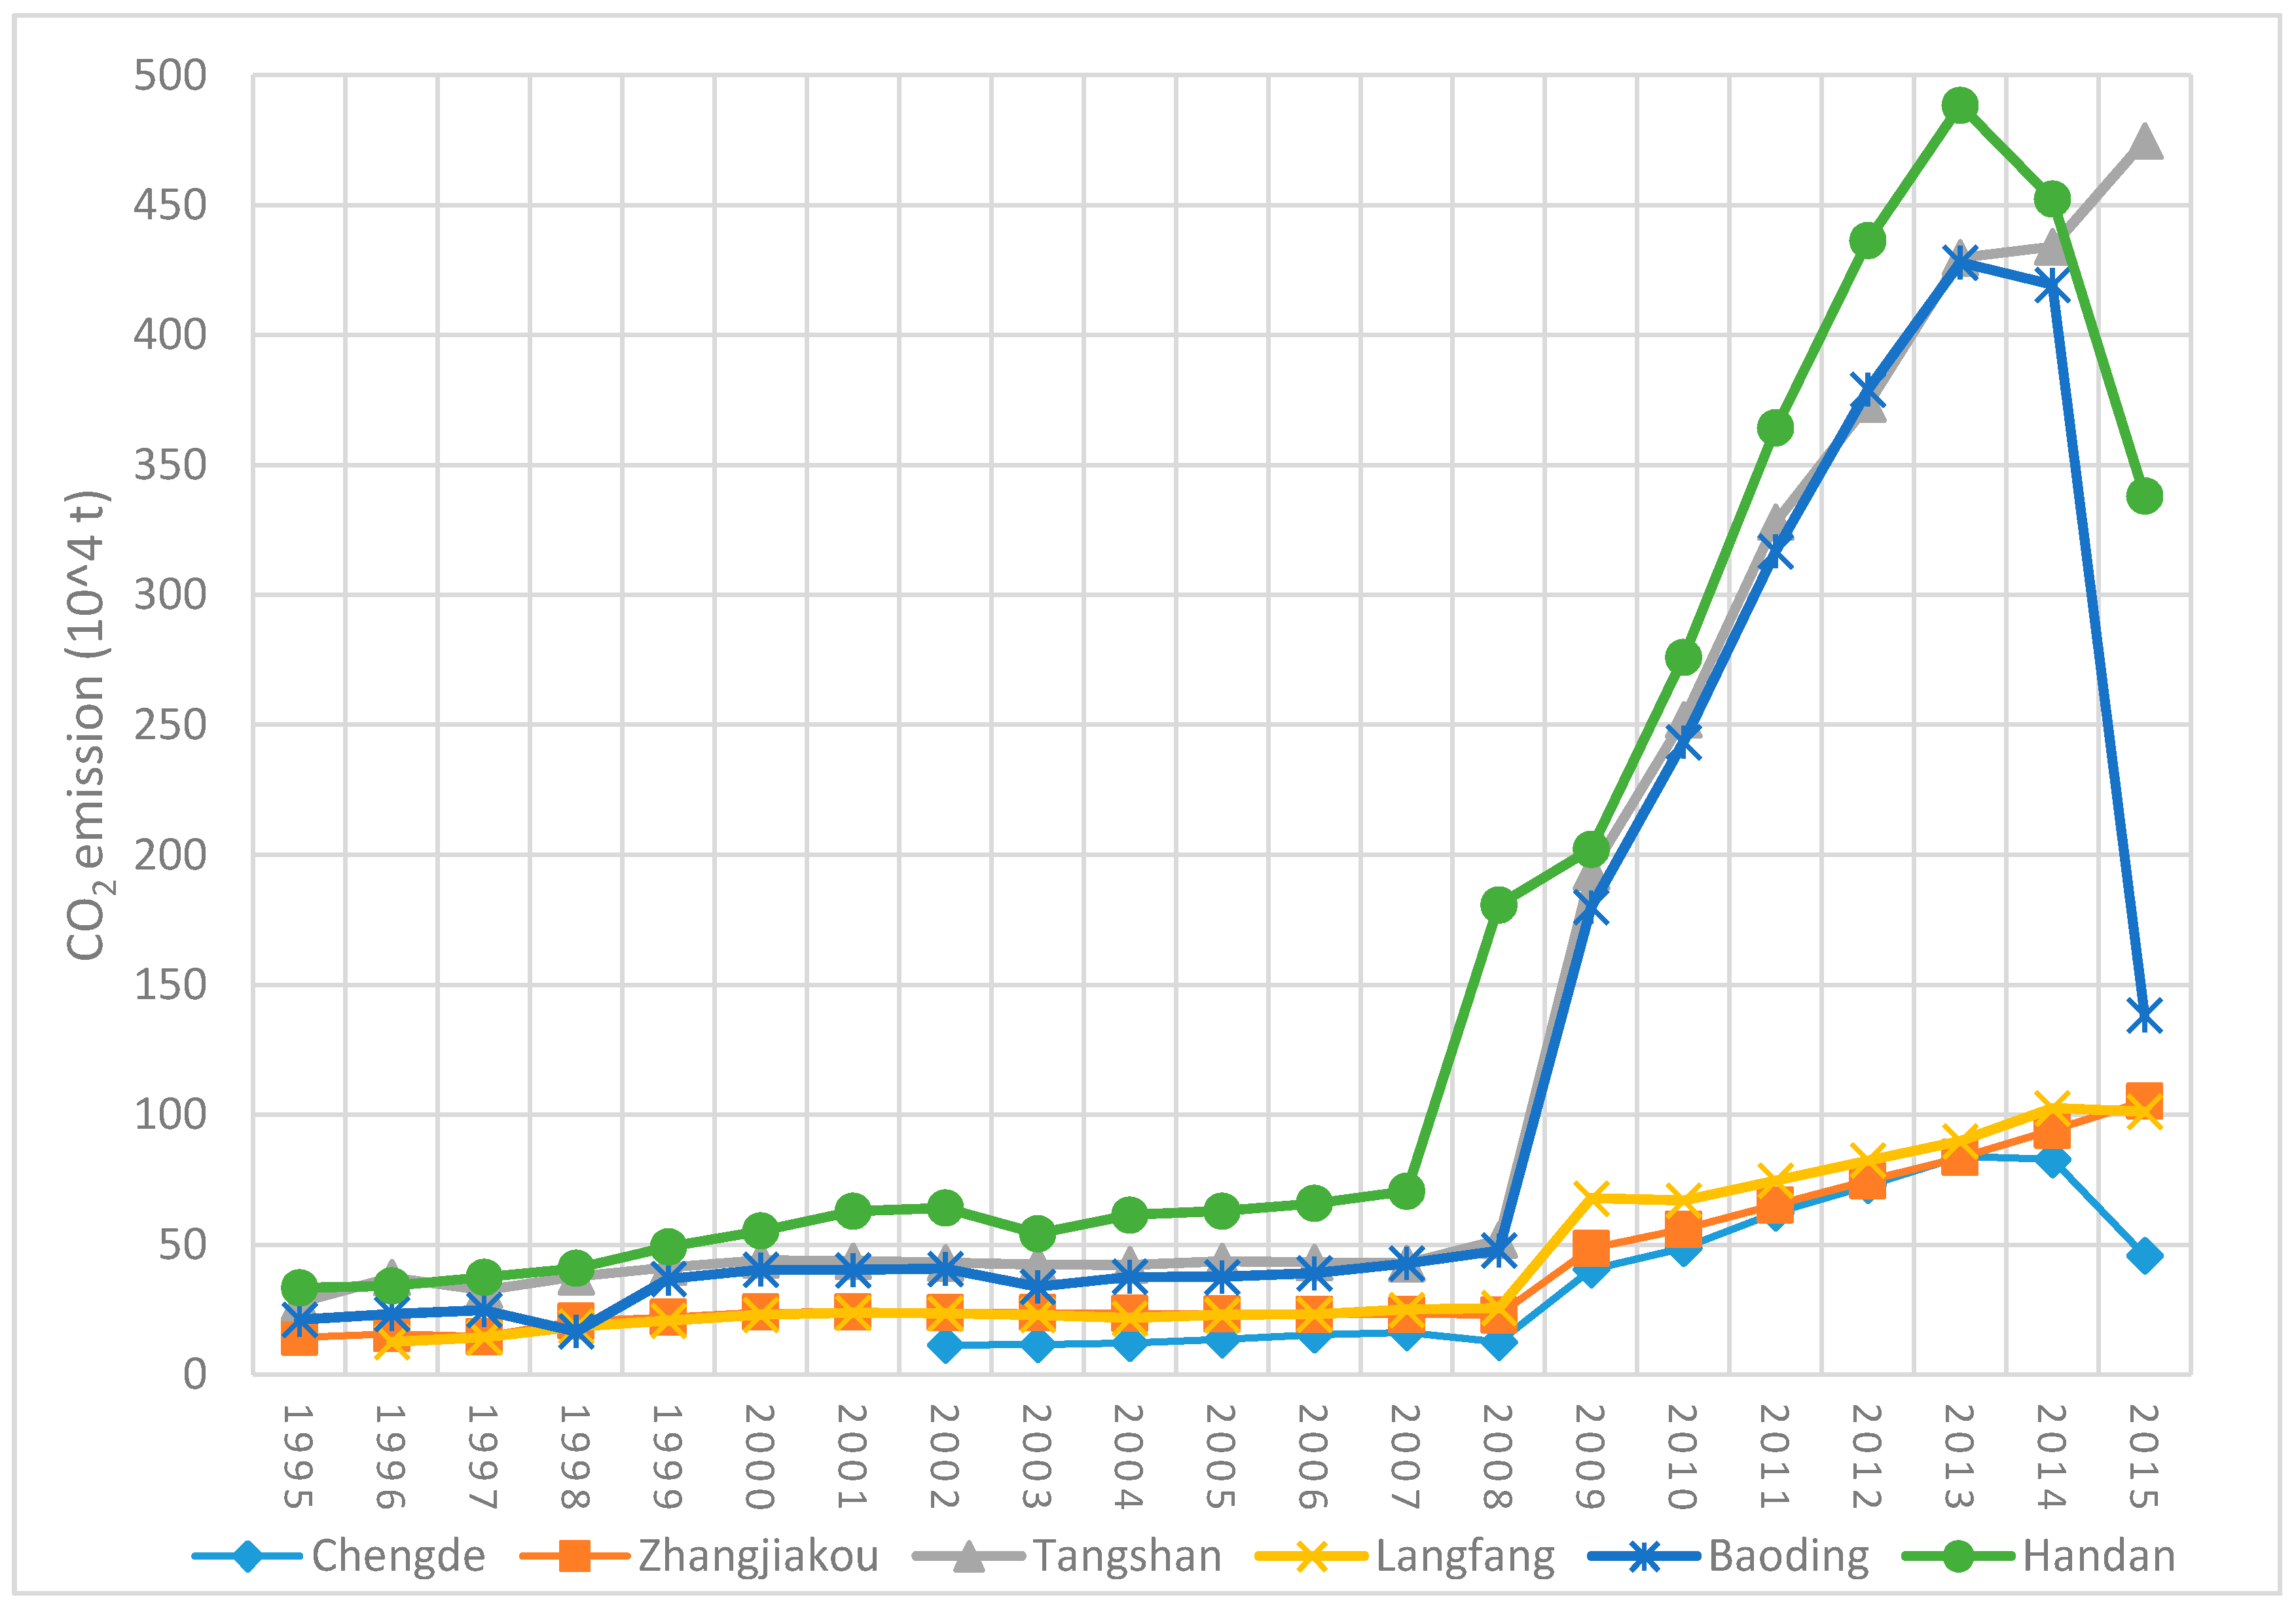
3.1. Economic Growth and Traffic CO2 Emissions

During 1995–2015 period, the GDP in all the six cities of Hebei province kept steady growth (shown in Figure 2). The order of the annual average growth rates of the six cities in Hebei province are as follows: Tangshan (12.15%) > Langfang (12.14%) > Baoding (11.75%) > Handan (11.48%) > Chengde (11.48%) > Zhangjiakou (9.96%). In 2015, the GDP of Tangshan was the most in the six cities in Hebei province taken into account in this study, with 494.38 billion yuan, followed by Baoding (436.03 billion yuan), Handan (259.38 billion yuan), Langfang (208.36 billion yuan), Zhangjiakou (106.41 billion yuan), and Chengde (85.87 billion yuan). The GDP growth in the six cities all have an obvious five-year phased characteristic. From 1995 to 2000, the annual growth rate of the GDP in the six cities all kept decreasing. The annual average growth rate of GDP during 1995–2000 were as follows: Tangshan (14.42%) > Baoding (14.00%) > Langfang (13.97%) > Handan (12.40%) > Tangshan (9.68%) > Chengde (9.68%). During the period 2000–2005, the annual growth rate of GDP of most cities decreased, except tourism cities (Chengde and Zhangjiakou), and the order were as follows: Chengde (13.35%) > Tangshan (12.70%) > Handan (12.35%) > Baoding (12.25%) > Langfang (12.14%) > Zhangjiakou (10.40%). From 2005 to 2010, the six cities almost had an increasing trend on the GDP growth rate, except Baoding. The order of the annual average growth rate during 2005–2010 are as follows: Chengde (13.95%) > Tangshan (13.41%) > Langfang (13.05%) > Handan (12.99%) > Zhangjiakou (12.41%) > Baoding (11.71%). After 2010, the growth rate of GDP decreased rapidly for all the six cities in Hebei province. The annual average growth rate of the six cities during 2010–2015 were as follows: Langfang (9.45%) > Baoding (9.08%) > Chengde (9.02%) > Handan (8.64%) > Tangshan (8.19%) > Zhangjiakou (8.07%). 2005 was an obvious turning point when the growth rate started to decrease.
The total amount of CO2 emissions in on-road transport sector for the six cities in Hebei province during 1995–2015 are shown in Figure 3. During the study period, 2008 and 2013 were two important turning point. From 1995 to 2008, the on-road traffic CO2 emissions in all six cities kept a stable increasing trend, with annual average growth rate of 1.61% in Chengde, 3.69% in Zhangjiakou, 4.90% in Tangshan, 6.07% in Langfang, and 6.17% in Baoding. In addition, the first turning point for Handan appeared in 2007, and the annual average growth rate in Handan was 1.09% before 2007. The period 2008–2013 was a traffic CO2 emission rapidly growing stage. During this period, the annual average growth rate of the on-road traffic CO2 emissions were as follows: 46.33% in Chengde, 29.45% in Zhangjiakou, 52.70% in Tangshan, 28.57% in Langfang, 55.05% in Baoding and 38.04% in Handan. Since 2013, the amount of on-road traffic CO2 emissions in Baoding, Handan, and Chengde started to decrease. Although the traffic CO2 emissions in Zhangjiakou, Tangshan, and Langfang still kept an increasing trend, the increment rate from 2013 to 2015 were significantly lower than the rate during rapidly growing period (2008–2013). In 2015, the traffic CO2 emissions were ranked as follows: Tangshan, Handan, Baoding, Zhangjiakou, Langfang, and Chengde. They were 4.75 million tons (Mt), 3.38 Mt, 1.38 Mt, 1.51 Mt, 1.01 Mt and 0.46 Mt, respectively. Although the gap of the traffic CO2 emissions in these six cities has become less in the past two years, polarization phenomenon has happened since 2008. The on-road CO2 emissions of Handan, Tangshan and Baoding are great higher than the other three cities. It is due to the higher level of economic development, more frequent economic activities, and more demand for freight derived from the higher percentage of the industry.

3.2. The Decoupling Analysis

According to the Tapio’s elastic decoupling method mentioned in the Section 2, the annual decoupling states and decoupling index values of the CO2 emissions in on-road transport sector from economic growth for Chengde, Zhangjiakou, Tangshan, Langfang, Baoding, and Handan from 1996 to 2005 were identified and calculated (shown in Table 3 and Table 4). During the study period, the GDP of the six cities in Hebei province kept increasing. Therefore, the four decoupling states in the right column in Table 3 did not occur. In general, both decoupling and negative decoupling (or coupling) states existed during the past two decades. The decoupling states during 1996–2015 in the six cities can be divided into four phases: decoupling-coupling concurrence stage (1996–2000), decoupling dominant stage (2001–2008), coupling dominant stage (2009–2013), and improvement stage (2014–2015).
From 1996 to 2000, the decoupling states are various in the six cities. Except for Langfang and Handan, all four decoupling states appeared. This phase is the initial stage of economic development, and industrial enterprises in these cities began to develop with CO2 emission pressures following. At the end of this stage, expansive negative decoupling appeared, especially in Zhangjiakou, having many steel companies during that period, and Handan, which is famous for its steel industry.
During the following 2001–2008 period, the six cities were dominated by the ideal decoupling states, including strong decoupling state and weak decoupling state. This improvement can be mainly attributed to the environmental protection and energy saving related policies at the national level. In 2003, Chairman Hu proposed the “scientific outlook on development”, and the entire country, including Hebei province, started to pay attention to environmental protection, energy conservation and emission reduction. The enforcement of the Kyoto Protocol in 2005 also contributed to the development of a low-carbon economy in Hebei Province. The Ministry of Science and Technology of the People’s Republic of China issued the Outline of Medium and Long-Term Scientific and Technological Development Plans (2006–2020), which pointed out that major breakthroughs must be made in key technologies for resource conservation and environmental protection in transport sector, and that developing energy saving and new-energy automotive technologies, and intelligent traffic management system to improve the operational efficiency of the traffic system are in urgent need. In addition, some particular events had influence on the short-term decoupling state. For example, the SARS epidemic, which happened during 2003–2004, hindered the natural flow of people and goods in the Hebei province, which surrounds Beijing with stringent restrictions of the people and goods flow. In 2008, Hebei took temporary pollution reduction measures to implement comprehensive environmental managements to guarantee good environmental quality during the Beijing Olympic Games. The 29th Beijing Olympics Air Quality Assurance Measures took the on-road transport sector as an important sector and made motor vehicle emission control as one of the main control targets.
However, Tangshan City and Handan City experienced an expansive negative decoupling in 2008. In 2008, Tangshan Iron and Steel Group and Handan Iron and Steel Group jointly formed Hebei Iron and Steel Group, with a revenue of 167 billion yuan, ranking 375th among the world’s top 500 enterprises. At the same time, the increase in production and income of the Hebei Iron and Steel Group also brought about an increase in freight volume, which led to a relatively rapid increase in CO2 emissions and an undesirable negative decoupling state.
The 2009–2013 period, namely the coupling dominant stage, was basically covered by expansive negative decoupling, the worst decoupling state during the study period happened in the six cities. In particular, in 2009, the decoupling index values of Chengde, Zhangjiakou, Tangshan, Langfang, and Baoding peaked the highest during 1996–2015, and the values were 20.27, 11.15, 24.22, 15.72, and 25.16, respectively. In addition, Handan peaked the decoupling index value in 2008, one year earlier than the other five cities, with the decoupling index value 14.06. In order to create a favorable environment for the 2008 Beijing Olympic Games, Beijing shifted some of its heavy industries outward. Hebei province is an important destination of the Beijing’s heavy industries. For example, the Capital Steel Cooperation was relocated to Caofeidian in Tangshan city, Hebei province. These enterprises resumed normal operations after the Beijing Olympic Games. They demanded more freights and produced more CO2 emissions in the transport sector. In addition, global financial crisis occurred in 2008. As an open country, the economy in China was influenced by the crisis to an extent. Compared with 2007, the annual GDP growth rates of Chengde, Zhangjiakou, Tangshan, Langfang, Baoding, and Handan decreased by 5.9%, 2.2%, 4.6%, 5.3%, 4.2%, and 1.2%, respectively. However, due to the asymmetry of market information in the initial period, the supply of products was not reduced, and the amount of freight did not decline. Therefore, the peak value of the decoupling index appeared in 2009. Subsequently, the Four Trillion Yuan Plan implemented in November 2008 focused economic growth, especially on infrastructure and industrial development. This economic stimulus plan needed more freight transport. Therefore, during the period 2009–2013, almost all six cities belonged to the negative decoupling state.
However, the decoupling status of Langfang was different from the other five cities from 2009 to 2013. Expansive coupling covered most of the period. The long-term high-quality environment in Langfang City is not only related to its high-tech industry, but it also benefited from the effective management of the Environmental Protection Bureaus. In 2006, Langfang was rated as the first national model city for environmental protection in Hebei province. Since then, Langfang has continuously improved its environmental standards, and it was rated twice as an advanced collective of environmental protection in Hebei Province in 2006 and 2010.
As the governors and the public gradually realized the importance of energy saving and environmental protection, Hebei province has also made many efforts. In 2013, the Hebei government implemented the Measures for the Prevention and Control of Vehicle Exhaust Pollution in Hebei Province, and carried out road traffic reduction work. The first step is to eliminate the vehicles that fail to meet the No. 1 standard for exhaust emissions, the gasoline vehicles registered before the end of 2000, and the diesel vehicles registered before the end of 2007 by 2015. In 2013, the Environmental Protection Bureau of Hebei Province issued a notice on the implementation of exhaust gas detection methods for the simple conditions of motor vehicles to ensure regular inspections of motor vehicles. Transportation sector of Hebei Province has also taken many measures to reduce emissions, such as public transport incentives (partial time bus free ride). These policies and measures have mitigated the CO2 emissions in transport sector in Hebei province, and promote the decoupling of traffic CO2 emissions from economic growth in 2014–2015, namely the improvement stage.
During the recent two years of the study period, Chengde and Baoding were identified due to their good local practice on decoupling CO2 emissions in transport sector from economic growth. Chengde formulated the Detailed Rules for the Implementation of the Action Plan for the Prevention and Control of Atmospheric Pollution in Chengde City (2013–2017) and proposed an annual plan to mitigate emissions. Handan City not only enabled the testing agencies to cover the city’s East, Central, and West Regions to facilitate the public’s active detection, but it also strived to achieve a national assessment standard for the automatic monitoring of data sources for pollution sources. Baoding City proposed financial subsidies for the elimination of the vehicles that fail to meet the No. 1 standard for exhaust emissions in advance. In addition, Baoding issued a new regulation for heavy pollution weather emergency plans with more detailed and reasonable restrictions in 2014. In 2015, Baoding implemented free bus rides to guide the public to develop public transport habits. However, we should also note that expansive negative decoupling still existed in Zhangjiakou and Tangshan in 2015. Tangshan City, as a heavy industry dominant city, has difficulty to achieve strong decoupling state in short-time period. The undesirable negative decoupling in Zhangjiakou is due to the sudden explosion of the tourism market.

4. Discussion

This study evaluated the decoupling status of six cities in Hebei, whose province is of great importance in national development planning, by Tapio’s decoupling model during the recent two decades. The previous research results about the decoupling relationship between CO2 emissions in transportation and economic growth in China were selected to compare with the results of this study. Wang et al. [18] estimated the decoupling state between the development of transportation and carbon emissions in China from 2000 to 2015, and analyzed the influencing factors of traffic carbon emissions. Focused on Beijing, Tianjin and Hebei, Zhu and Li [28] identified the impact of the factors influencing the CO2 emissions in the transportation sector during the 2005 to 2013 period, and found that traffic CO2 emissions and economic growth were not always synchronized. The comparison of results between previous research and this study was shown in Table 5.
As shown in Table 5, the decoupling state between CO2 emissions in transportation sector and economic growth at national, provincial and city level presented obvious stages variety characteristics. The decoupling states of traffic CO2 emissions from economic growth of China can be divided into three phases: decoupling-coupling concurrence stage (2001–2004), decoupling dominant stage (2005–2009), and coupling dominant stage (2010–2012). In general, the variation characteristics of the decoupling status were consistent with the results of this study. However, the decoupling dominant stage started four years earlier in the six cities in Hebei province than the whole country. The decoupling status between CO2 emissions in transportation sector and economic increment in Hebei at provincial level can be divided into two phases: improvement stage (2005–2008) and retreat stage (2009–2012). 2009 was the turning point when the decoupling state started a bad change for both the six cities in Hebei and the whole province. In addition, the decoupling states of the six cities changed greater than the whole province.
Due to the limitation of data at city level, we only completed the decoupling analysis between CO2 emissions in transportation sector and economic growth of six cities in Hebei province. Moreover, the conversion factor that we use to calculate the CO2 emissions from the transport volume is at the national level, but there are differences of the conversion factors of each city due to the structure of vehicles. Further decoupling analysis research at the city level in China and other countries are in urgent need for responding to the global climate change.

5. Conclusions

This research estimated the on-road traffic CO2 emissions for six cities, including Chengde, Zhangjiakou, Tangshan, Langfang, Baoding, and Handan, in Hebei province from 1995 to 2015. These results will enrich the greenhouse gas inventory of China at city level. We also investigated the decoupling states of the six cities during 1995–2015, and identified cities that have good local practice to mitigate CO2 emissions in transport sector. It is of great importance to provide scientific support for governors to formulate and implement low-carbon transportation policies in China and other developing countries.
In 2015, the on-road traffic CO2 emissions of the six cities in Hebei, China were ranked as follows: Tangshan (4.75 Mt) > Handan (3.38 Mt) > Baoding (1.38 Mt) > Zhangjiakou (1.05 Mt) > Langfang (1.01 Mt) > Chengde (0.46 Mt). The results indicated that the cities dominated by traditional industries emitted more CO2 in transportation sector than the industrial transformation cities. The high-tech and tourism dominated cities had the relatively lower level of on-road traffic CO2 emissions. According to this results, further adjusting the industrial structure is proposed to achieve the reduction of CO2 emissions in the transportation sector when strive for the economic development in these six cities in Hebei. Tangshan and Langfang, with far higher traffic CO2 emissions than other cities, should be paid more attention. According to the research results from Zhu and Li [28], the accumulative effect of industrial structure had prominent influence on decreasing the transportation-related carbon emissions in Beijing-Tianjin-Hebei Area, China during the period 2005 to 2013. Thus, the traditional industry dominated cities should continue to optimize their industrial structure by introducing new and high technology and developing industrial tourism, etc.
During the study period, there were two obvious turning points, 2008 and 2013. From 2008 to 2013, the traffic CO2 emissions increased more rapidly than before. After 2013, the traffic CO2 emissions of three cities (Baoding, Handan, and Chengde) began to decrease, and the traffic CO2 emissions’ growth rates of the other three cities (Zhangjiakou, Langfang and Tangshan) became lower than before. In 2010, National Development and Reform Commission of the People’s Republic of China issued Notice on Developing Pilot Work on Low-Carbon Province and Low-Carbon City, and listed Baoding in Hebei province as one of the eight pilots of China. After that, in 2011, Ministry of Transport of the People’s Republic of China proposed Pilot Work Plan and Guidance for Establishing Low-Carbon Transportation System, which was implied in Baoding, Hebei. The turning point 2013 partly illustrated that the national level policies played an important role on the mitigation of CO2 emissions in the transportation sector.
The decoupling states during 1996–2015 can be divided into four phases: decoupling-coupling concurrence stage (1996–2000), decoupling dominant stage (2001–2008), coupling dominant stage (2009–2013) and improvement stage (2014–2015). In general, the decoupling status in the six cities in Hebei province showed an improving trend in the recent years. Chengde and Baoding were identified due to their good local practice on decoupling CO2 emissions in transport sector from economic growth. However, there are still some issues that need attention and solutions in the study area. The on-road traffic CO2 emissions in Zhangjiakou and Tangshan are still growing, which reminds us that strong decoupling has not been realized yet. In addition, Handan ranked third in the six cities on GDP during 1999–2014, but CO2 emissions in the transport sector have always been the most. To achieve the most desirable strong decoupling state, there is still a long way to go. On the one hand, more targeted traffic CO2 emissions reduction policies at city level should be paid more attention by the local governments. In addition, each city should implement different policies and measures on the basis of its own decoupling state and economic development stage. We suggest that Baoding, Handan, and Chengde continue to maintain their current decoupling status. Zhangjiakou should develop low-carbon technologies with the opportunity to build a low-carbon winter Olympics. Tangshan should focus on improving energy efficiency and the use of new energy in the transport sector. Langfang City should make good use of the opportunities of its geographical proximity to Beijing and Tianjin, and introduce the intelligent transportation management system into Langfang to enhance the efficiency of the transport system in Langfang. On the other hand, the technology development of electric vehicle and new energy vehicle should be raised to further decouple the on-road traffic CO2 emissions from economic growth.

Author Contributions

L.Z., J.Z. and Y.L. designed the research scheme; J.Z. and C.K. collected the data; L.Z., J.Z. and C.K. carried out the analysis; L.Z., J.Z., C.K. and Y.L. wrote the manuscript.

Funding

This research was funded by National Social Science Found of China grand number [16AMZ009] and National Natural Science Foundation of China grant number [41771182].

Conflicts of Interest

The authors declare no conflict of interest.

Appendix A

Table A1. Detailed source of road traffic data for the study area.
City’s Statistical Yearbooks City’s Statistical Bulletin
Chengde City2013–20152002–2012
Zhangjiakou City1995–2015-
Tangshan City1995–2015-
Langfang City1996–2003, 2005, 2013–20142004, 2006–2012
Baoding City1995–20022003–2015
Handan City1998–20151995–1997
Note: 1. The content of each row represents the year in which the corresponding city data is derived from the statistical yearbook or statistical bulletin. 2. The data of Handan City in 1997 was about 10 times smaller than that in 1996, but the statistical bulletin indicates that the road transportation industry has achieved great development, so it is considered a data error. In order not to affect the analysis results, this paper assigns the average of the 1995 and 1997 data to 1996.

References

  1. Yan, X.; Crookes, R.J. Reduction potentials of energy demand and GHG emissions in China’s road transport sector. Energy Policy 2009, 37, 658–668. [Google Scholar] [CrossRef]
  2. Li, Y.; Zheng, J.; Dong, S.; Wen, X.; Jin, X.; Zhang, L.; Peng, X. Temporal variation of local traffic CO2 emissions and its relationship with CO2 flux in Beijing, China. Transport. Res. D-TRE 2018. accepted. [Google Scholar]
  3. Loo, B.P.Y.; Banister, D. Decoupling transport from economic growth: Extending the debate to include environmental and social externalities. J. Transp. Geogr. 2016, 57, 134–144. [Google Scholar] [CrossRef]
  4. Baloch, M.A.; Suad, S. Modeling the impact of transport energy consumption on CO2 emission in Pakistan: Evidence from ARDL approach. Environ. Sci. Pollut. Res. 2018, 25, 9461–9473. [Google Scholar] [CrossRef]
  5. Yoke-Kee, E.; Chin-Yoong, W. Tapered US carbon emissions during good times: What’s old, what’s new? Environ. Sci. Pollut. Res. 2017, 24, 25047–25060. [Google Scholar] [CrossRef]
  6. Guo, J.; Zhang, Y.J. The key sectors for energy conservation and carbon emissions reduction in China: Evidence from the input-output method. J. Clean. Prod. 2018, 179, 180–190. [Google Scholar] [CrossRef]
  7. Tian, X.; Chang, M. Decoding the effect of socioeconomic transitions on carbon dioxide emissions: Analysis framework and application in megacity Chongqing from inland China. J. Clean. Prod. 2017, 142, 2114–2124. [Google Scholar] [CrossRef]
  8. Salahuddin, M.; Alam, K.; Ozturk, I. The effects of Internet usage and economic growth on CO2 emissions in OECD countries: A panel investigation. Renew. Sustain. Energy Rev. 2016, 56, 988–998. [Google Scholar] [CrossRef]
  9. Limin, D.U.; Wei, C.; Cai, S.H. Economic development and carbon dioxide emissions in China: Provincial panel data analysis. China. Econ. Rev. 2012, 23, 371–384. [Google Scholar] [CrossRef]
  10. Xu, B.; Lin, B.Q. Investigating the differences in CO2 emissions in the transport sector across Chinese provinces: Evidence from a quantile regression model. Renew. Sustain. Energy Rev. 2016, 56, 988–998. [Google Scholar] [CrossRef]
  11. Lin, B.Q.; Benjamin, N.I. Influencing factors on carbon emissions in China transport industry. A new evidence from quantile regression analysis. J. Clean. Prod. 2017, 150, 175–187. [Google Scholar] [CrossRef]
  12. Meng, X.; Ji, H. Roads, economy, population density, and CO2: A city-scaled causality analysis. Resour. Conserv. Recyl. 2018, 128, 508–515. [Google Scholar] [CrossRef]
  13. Arvin, M.B.; Pradhan, R.P.; Norman, N.R. Transportation intensity, urbanization, economic growth, and CO2 emissions in the G-20 countries. Util. Policy 2015, 35, 50–66. [Google Scholar] [CrossRef]
  14. Besma, T. CO2 emissions reduction in road transport sector in Tunisia. Renew. Sustain. Energy Rev. 2016, 56, 988–998. [Google Scholar] [CrossRef]
  15. Alshehry, A.S.; Belloumi, M. Study of the environmental Kuznets curve for transport carbon dioxide emissions in Saudi Arabia. Renew. Sustain. Energy Rev. 2017, 75, 1339–1347. [Google Scholar] [CrossRef]
  16. Sousa, C.; Roseta-Palma, C.; Martins, L.F. Economic growth and transport: On the road to sustainability. Nat. Resour. Forum 2015, 39, 3–14. [Google Scholar] [CrossRef]
  17. Azlina, A.A.; Law, S.H.; Mustapha, N.H.N. Dynamic linkages among transport energy consumption, income and CO2 emission in Malaysia. Energy Policy 2014, 73, 598–606. [Google Scholar] [CrossRef]
  18. Wang, Y.; Zhou, Y.; Zhu, L.; Zhang, F.; Zhang, Y. Influencing factors and decoupling elasticity of China’s transportation carbon emissions. Energies 2018, 11, 1157. [Google Scholar] [CrossRef]
  19. Zhang, Z. Decoupling China’s carbon emissions increase from economic growth: An economic analysis and policy implications. World Dev. 2000, 28, 739–752. [Google Scholar] [CrossRef]
  20. Organization for Economic Cooperation and Development (OECD). Indicators to Measure Decoupling of Environmental Pressure from Economic Growth; Organization for Economic Cooperation: Paris, France, 2002. [Google Scholar]
  21. Brizga, J.; Feng, K.; Hubacek, K. Drivers of CO2 emissions in the former Soviet Union: A country level IPAT analysis from 1990 to 2010. Energy 2013, 59, 743–753. [Google Scholar] [CrossRef]
  22. York, R.; Rosa, E.A.; Dietz, T. STIRPAT, IPAT and ImPACT: Analytic tools for unpacking the driving forces of environmental impacts. Ecol. Econ. 2003, 46, 351–365. [Google Scholar] [CrossRef]
  23. Tapio, P. Towards a theory of decoupling: Degrees of decoupling in the EU and the case of road traffic in Finland between 1970 and 2001. Transp. Policy 2005, 12, 137–151. [Google Scholar] [CrossRef]
  24. Timilsina, G.R.; Shrestha, A. Factors affecting transport sector CO2 emissions growth in Latin American and Caribbean countries: An LMDI decomposition analysis. Int. J. Energy Res. 2009, 33, 396–414. [Google Scholar] [CrossRef]
  25. Wu, D.; Yuan, C.W.; Liu, H.C. The decoupling states of CO2 emissions in the Chinese transport sector from 1994 to 2012: A perspective on fuel types. Energy Environ. 2018, 29, 591–612. [Google Scholar] [CrossRef]
  26. Wang, Y.H.; Xie, T.Y.; Yang, S.L. Carbon emission and its decoupling research of transportation in Jiangsu Province. J. Clean. Prod. 2017, 142, 907–914. [Google Scholar] [CrossRef]
  27. Dong, J.F.; Huang, J.Y.; Wu, R.W.; Deng, C. Delinking indicators on transport output and carbon emissions in Xinjiang, China. Pol. J. Environ. Stud. 2017, 26, 1045–1056. [Google Scholar] [CrossRef]
  28. Zhu, X.P.; Li, R.R. An analysis of decoupling and influencing factors of carbon emissions from the transportation sector in the Beijing-Tianjin-Hebei Area, China. Sustainability 2016, 9, 722. [Google Scholar] [CrossRef]
  29. European Commission. The Future of Transport, Focus Groups’ Report, 20th February 2009. Available online: https://ec.europa.eu/transport/themes/strategies/2009_future_of_transport_en (accessed on 10 November 2018).
Figure 1. Flowchart of this study.
Sustainability 10 04149 g001
Figure 2. GDP change trend from 1995 to 2015.
Sustainability 10 04149 g002
Figure 3. Total CO2 Emissions from On-road Transport Sector from 1995 to 2015.
Sustainability 10 04149 g003
Table 1. Carbon intensity of transport (t CO 2 per 10 million cpkm).
YearciYearciYearciYearci
199646.25200159.28200650.00201143.80
199750.00200257.34200748.42201243.74
199853.74200355.39200846.88201343.74
199957.48200453.45200945.34201443.74
200061.23200551.50201043.80201543.74
Noting: The coefficients of carbon intensity of transport in 1995, 2000, 2005, 2010 and 2012 refer to the results of Loo and Banister [3]. The carbon intensity coefficients in other years are subsided by interpolation, and the coefficients in 2013, 2014 and 2015 are referenced to the value in 2012.
Table 2. The general Tapio decoupling model.
Δ G D P t i t
IncreaseDecrease
Δ C t i t IncreaseSlower rateWeak decoupling
D t i t ∈ (0, 0.8]
Strong negative decoupling
D t i t ∈ (−∞, 0]
Approximately same rateExpansive coupling
D t i t ∈ (0.8, 1.2]
Faster rateExpansive negative decoupling
D t i t ∈ (1.2, +∞]
DecreaseSlower rateStrong decoupling
D t i t ∈ (−∞, 0]
Weak negative decoupling
D t i t ∈ (0, 0.8]
Approximately same rateRecessive coupling
D t i t ∈ (0.8, 1.2]
Faster rateRecessive decoupling
D t i t ∈ (1.2, +∞]
Table 3. The decoupling states.
Δ G D P t i t
IncreaseDecrease
  Δ C t i t IncreaseSlower rateWeak decoupling
Chengde: 2003–2006
Zhangjiakou: 1996, 2001
Tangshan: 2000, 2005, 2014
Langfang: 2003, 2005–2008
Baoding: 1996, 1997, 2002, 2004, 2006
Handan: 2002, 2005–2007
Strong negative decoupling
none
Approximately same rateExpansive coupling
Chengde: 2007
Zhangjiakou: 2000, 2010
Tangshan: 1998–1999
Langfang: 1997, 1999, 2000, 2011–2013
Baoding: 2000, 2007, 2008
Handan: 2004, 2009
Faster rateExpansive negative decoupling
Chengde: 2009–2013
Zhangjiakou: 1998, 1999, 2009, 2011–2015
Tangshan: 1996, 2008–2013, 2015
Langfang: 1998, 2009, 2014
Baoding: 1999, 2009–2013
Handan: 1996, 1999–2001, 2008, 2010–2013
DecreaseSlower rateStrong decoupling
Chengde: 2008, 2014, 2015
Zhangjiakou: 1997, 2002–2008
Tangshan: 1997, 2001–2004, 2006, 2007
Langfang: 2001, 2002, 2004, 2010, 2015
Baoding: 1998, 2001, 2003, 2005, 2014, 2015
Handan: 1997, 1998, 2003, 2014, 2015
Weak negative decoupling
none
Approximately same rateRecessive coupling
none
Faster rateRecessive decoupling
none
Table 4. The decoupling values.
ChengdeZhangjiakouTangshanLangfangBaodingHandan
1996-0.57 1.72 -0.58 0.13
1997-−0.58 −0.76 0.82 0.39 0.75
1998-7.91 1.20 2.07 −2.37 0.88
1999-2.28 0.89 1.09 11.50 1.91
2000-1.05 0.63 0.98 0.93 1.21
2001-0.14 −0.10 0.30 −0.04 1.52
2002-−0.10 −0.14 −0.08 0.10 0.20
20030.13 −0.08 −0.12 −0.21 −1.34 −1.27
20040.34 −0.06 −0.02 −0.41 0.79 0.91
20050.67 −0.10 0.21 0.43 −0.02 0.15
20060.75 −0.01 −0.06 0.03 0.36 0.32
20070.35 −0.04 −0.06 0.55 0.85 0.49
2008−1.77 −0.06 1.60 0.20 0.98 14.06
200920.27 11.15 24.22 15.27 25.16 1.06
20101.79 1.08 2.31 −0.09 2.52 2.79
20112.31 1.45 2.58 1.00 2.52 2.63
20121.61 1.42 1.33 1.07 1.87 1.89
20131.65 1.49 1.81 1.00 1.47 1.63
2014−0.17 2.42 0.20 1.71 −0.28 −1.13
2015−8.13 2.05 1.67 −0.14 −9.44 −3.72
Table 5. Comparative analysis on the decoupling status results between the previous research and this study.
YearDecoupling State
Comparative LiteratureThis Research
ChinaHebeiChengdeZhangjiakouTangshanLangfangBaodingHandan
1996---Weak decouplingExpansive negative decoupling-Weak decouplingWeak decoupling
1997---Strong decouplingStrong decouplingExpansive couplingWeak decouplingWeak decoupling
1998---Expansive negative decouplingExpansive couplingExpansive negative decouplingStrong decouplingExpansive coupling
1999---Expansive negative decouplingExpansive couplingExpansive couplingExpansive negative decouplingExpansive negative decoupling
2000---Expansive couplingWeak decouplingExpansive couplingExpansive couplingExpansive negative decoupling
2001Weak decoupling--Weak decouplingStrong decouplingWeak decouplingStrong decouplingExpansive negative decoupling
2002Expansive coupling--Strong decouplingStrong decouplingStrong decouplingWeak decouplingWeak decoupling
2003Expansive negative decoupling-Weak decouplingStrong decouplingStrong decouplingStrong decouplingStrong decouplingStrong decoupling
2004Expansive negative decoupling-Weak decouplingStrong decouplingStrong decouplingStrong decouplingWeak decouplingExpansive coupling
2005Weak decouplingWeak decouplingWeak decouplingStrong decouplingWeak decouplingWeak decouplingStrong decouplingWeak decoupling
2006Expansive couplingWeak decouplingWeak decouplingStrong decouplingStrong decouplingWeak decouplingWeak decouplingWeak decoupling
2007Weak decouplingStrong decouplingWeak decouplingStrong decouplingStrong decouplingWeak decouplingExpansive couplingWeak decoupling
2008Weak decouplingStrong decouplingStrong decouplingStrong decouplingWeak decouplingWeak decouplingExpansive couplingExpansive negative decoupling
2009Weak decouplingWeak decouplingExpansive negative decouplingExpansive negative decouplingExpansive negative decouplingExpansive negative decouplingExpansive negative decouplingExpansive coupling
2010Expansive couplingWeak decouplingExpansive negative decouplingExpansive couplingExpansive negative decouplingStrong decouplingExpansive negative decouplingExpansive negative decoupling
2011Expansive couplingWeak decouplingExpansive negative decouplingExpansive negative decouplingExpansive negative decouplingExpansive couplingExpansive negative decouplingExpansive negative decoupling
2012Expansive negative decouplingWeak decouplingExpansive negative decouplingExpansive negative decouplingExpansive negative decouplingExpansive couplingExpansive negative decouplingExpansive negative decoupling
2013--Expansive negative decouplingExpansive negative decouplingExpansive negative decouplingExpansive couplingExpansive negative decouplingExpansive negative decoupling
2014--Strong decouplingExpansive negative decouplingWeak decouplingExpansive negative decouplingStrong decouplingStrong decoupling
2015--Strong decouplingExpansive negative decouplingExpansive negative decouplingStrong decouplingStrong decouplingStrong decoupling

