Article

Ecosystem Services and Their Relationships in the Grain-for-Green Programme—A Case Study of Duolun County in Inner Mongolia, China

1
Faculty of Geographical Science, Beijing Normal University, Beijing 100875, China
2
State Key Laboratory of Earth Surface Processes and Resource Ecology, Beijing Normal University, Beijing 100875, China
*
Author to whom correspondence should be addressed.
Sustainability 2018, 10(11), 4036; https://doi.org/10.3390/su10114036
Submission received: 5 October 2018 / Revised: 27 October 2018 / Accepted: 30 October 2018 / Published: 3 November 2018

Abstract

:
Grassland restoration projects are currently being implemented to mitigate human disturbance to the natural environment and reduce grassland degradation. China’s Grain-for-Green Programme (GFGP), including one project implemented in Duolun County, China, in 2000, has significantly improved the overall ecological health of this region. Using a modeling approach, this study quantified changes in four ecosystem services (ESs), including Net Primary Production (NPP), soil conservation (SC), water yield (WY), and sandstorm prevention (SP), in Duolun County between 2000 and 2016. We found the total NPP, water yield, and soil conservation increased by 80.44%, 248.2%, and 12.2%, respectively, during this period, while the sandstorm prevention decreased by 55.9%. Unlike other areas of GFGP implementation, the improvement of the ecological environment in Duolun County is largely attributed to the increased of vegetation coverage (88%) instead of land use circulation (12%). We found the grassland is a factor that reduces the trade-off while this effect was related with the grassland coverage. Future policies should be based on the mechanisms of vegetation underlying the ESs change and the relationships of ESs in order to achieve sustainable provision of ESs.

1. Introduction

Ecosystem products and services, collectively referred to as ecosystem services (ESs), are the direct and indirect benefits that ecosystem functions provide for humans [1,2]. Grassland is the largest terrestrial ecosystem in China, with about 78% concentrated in arid and semi-arid regions. Grasslands influence regional climate and promote biodiversity, ESs, and socio-economic development [3,4]. However, some grasslands have become severely degraded due to long-term overgrazing, farmland expansion, overexploitation, and climate change [5,6,7]. Grassland degradation has resulted in increased sandstorms, desertification, and the migration of ecological refugees, all of which directly jeopardize animal husbandry, ecological security, and sustainable development in China [8,9]. Therefore, Grassland restoration projects are currently being implemented to reduce grassland degradation. In this context, the study of ESs and their interactions can reveal the benefits of different ecological policies and can provide scientific support for future ecological restoration projects.
China’s Grain-for-Green Programme (GFGP) has become one of the world’s largest ecological restoration projects and made huge contributions to ecosystem functions both in China and globally [10,11]. The policies implemented in the GFGP include grazing bans, and returning farmland to grassland. The implementation of these projects has improved Net Primary Production (NPP) and carbon storage services [12,13,14], as well as regulatory services, including sandstorm prevention and soil conservation [15,16].
However, some researchers have found that the returning of farmland to grassland may cause declines in the water yield [14,17]. Managers often implement the policies that are used to maximize only one or a few ESs, but ESs are not independent of each other. Instead, they share highly nonlinear relationships [18], in that an increase in one service may cause changes in other services [19,20]. Therefore, the relationships among ESs should not be ignored when making management decisions [21]. In fact, the relationships among ESs have been studied in several regions where GFGP has been implemented. For example, projects implemented in the Loess Plateau region showed trade-offs between water yield and carbon storage or NPP [22,23,24]. Meanwhile, the NPP and soil conservation showed a synergistic relationship [22].
Recently a few studies quantified the relationships between ESs. Yang et al. [25] used a production possibility frontier (PPF) curve to quantify the trade-offs between the coastal wetland ESs at the mouth of the Yellow River to assess the potential impacts of different future development patterns. Feng et al. [26] quantified the strength of trade-offs using the root-mean-square error (RMSE) method and found that the strength of trade-offs between carbon storage and soil moisture were different for different vegetation populations in the Loess Plateau region. Wu et al. [27] also used the RMSE method and found the strength of trade-offs between ESs be weakest in the grasslands of the Loess Plateau region. Therefore, the analysis of ecological restoration projects from the perspective of trade-off strength could reveal patterns that may guidance for future restoration projects.
Currently, temporal and spatial assessments of GFGP using ESs as evaluation indicators mostly focus on the Loess Plateau, and few assessments have been carried out in agro-pastoral transitional zones. Besides, many studies about the relationships among ESs in GFGP only focused on qualitative research, and failed to analyze the strengths of trade-offs. Duolun County is located in the agro-pastoral transitional zone of northern China. As a typical semi-agricultural and semi-pastoral region, Duolun County is extremely sensitive to climate change and exhibits a weak ecological balance [28]. Since 2000, county-wide GFGP has been implemented, resulting in increased vegetation coverage and great improvements in the overall ecological health of the region [29]. In our study, Duolun County was selected to quantitatively assess changes in several important ESs before and after the implementation of the GFGP and we analyzed how GFGP changed the ESs. In addition, we quantified the relative effects of climate change and GFGP policies on Duolun County. The impacts of vegetation on ES trade-offs were then analyzed with quantitative strengths of trade-offs. Finally, we discussed our findings in the context of planning future restoration projects. The flow chart of our study was shown in the Figure 1 and some common abbreviations in study were shown in the Table 1.

2. Materials and Methods

2.1. Study Area

Duolun County is located in the central part of Inner Mongolia at the southeastern end of Xilingol (Figure 2). Duolun County lies in a typical agricultural-pastoral ecotone in northern China. The total area of the county is approximately 3950 square kilometers. The climate is mid-eastern monsoon and terrestrial grassland climate that belongs to the transition from a semi-arid to semi-humid. The average annual temperature is 3.2 °C, the average annual wind speed is 3 m · s 1 and the average annual precipitation is 367.1 mm. The altitude is 1150–1800 m above sea level, with an average of 1350 m. Low altitudes lie primarily in the central portion of the county. High altitudes are found primarily in southern and northern parts of the county. The county contains five main landforms: Low mountains, hills, river basin valleys, piedmont sloping plains and high platforms, and stacked sand dunes.

2.2. Data Sources

Land use data for the year 2000 were derived from the Environmental and Ecological Science Data Center for West China (http://westdc.westgis.ac.cn) at the National Natural Science Foundation of China. These were vector data with a resolution of 1:10 million. Land use data for the year 2016 were from the Data Center for Resources and Environmental Sciences, Chinese Academy of Sciences (RESDC) (http://www.resdc.cn/). These were raster data with a 100 m resolution. The two sets of land use data were each divided into 6 primary categories (farmland; forest; grassland; water area; construction land, and unused land) and 31 secondary categories. Meteorological data were from the data sharing platform of the China Meteorological Data Service Center (http://data.cma.cn/). 9 meteorological stations around Duolun County were chosen to estimate the meteorological data. The Digital Elevation Model (DEM) were derived from ASTER satellite data and were obtained from a geospatial data cloud (http://www.gscloud.cn/). These data had a resolution of 30 m. Snow cover data were also from the Environmental and Ecological Science Data Center for West China (http://westdc.westgis.ac.cn); the spatial resolution was 1 km and the temporal scale was daily [30,31]. Soil data included soil organic matter and particle size ratio data collected by field-work in Duolun County in 2017 and 2018, as well as from the Chinese portion of the Harmonized World Soil Database (HWSD) (1:1 million). Normalized Difference Vegetation Index (NDVI) data were derived from MODIS satellite data (https://glovis.usgs.gov/), with a spatial resolution of 250 m and a period of 16 days.

2.3. Quantification of Ecosystem Services

In this study, we compared four ESs in Duolun County between 2000 and 2016. The four ESs included two supporting services (Net primary production and water yield) and two regulating services (soil conservation and sandstorm prevention).

2.3.1. NPP

The Carnegie-Ames-Stanford Approach (CASA) model [32] has been widely used for NPP estimation. The calculation method is as follows:
N P P = A P A R × ε ,
A P A R = S O L × F P A R × 0.5 ,
where, NPP is Net Primary Production ( gC · m 2 ) , APAR is absorbed photosynthetically active radiation ( MJ · m 2 ) , ε is the actual light energy utilization rate ( gC · MJ 1 ) , SOL is total solar radiation ( MJ · m 2 ) . For model estimation, total solar radiation was calculated by carrying out Kriging interpolation of the total solar radiation data, which were obtained from weather stations around Duolun County according to the calculations of Ma et al. [33]. Precipitation and temperature data were obtained by carrying out ANUSPLIN interpolations of weather station data. The values for maximum light energy utilization rate were from Zhu et al. [34,35].

2.3.2. Potential NPP

The difference between potential NPP and actual NPP reflects the NPP impacted by human activities [36,37]. The equation for potential NPP is similar to that for actual NPP, except the fraction of the incoming photosynthetically active radiatio (FPAR) for the vegetation layer is calculated differently in the two equations. In the potential NPP equation, FPAR is based on empirical values related to climate parameters and vegetation types. The latter is calculated as follows:
F P A R = m i n ( 1 e k · L A I , 0.95 ) ,
where, k = 0.5 and L A I is the leaf area index, calculated as follows:
L A I = L A I m i n + f s w × f s t × ( L A I m a x L A I m i n ) ,
where, L A I m a x and L A I m i n are maximum and minimum leaf area index values, which are determined by vegetation type. In this study, we used relevant global vegetation parameters as defined by the Biosphere-Atmosphere Transfer Scheme (BATS). fsw and fst represent restrictions imposed on vegetation growth by soil moisture and soil temperature, respectively. The equations for calculating fsw and fst are as follows:
f s w = m i n ( 1 , m a x ( 0 , ( W m a x / W m a x ) / W c r i t ) ) ,
f s t = m i n ( 1 , m a x ( 0 , 1 0.0016 × ( 298.0 T ) 2 ) ) ,
where, W s o i l and W m a x represent soil water content and maximum soil water content ( m 3 · m 3 ) , respectively. These equations are based on the soil moisture sub-model in the CASA model. W c r i t is a constant and is equal to 0.25. T represents the soil temperature ( K ) at a depth of 20 cm. Soil moisture data were based on observations recorded in Duolun County from 2013 to 2014. Soil moisture data for 2000 and 2016 were calculated using the soil moisture sub-model. A regression equation was established using 2013 temperature data from meteorological stations and an EM50 instrument to measure soil temperature at a depth of 20 cm. The regression equation calculated the data of soil moisture for 2000 and 2016. We followed these steps and incorporated monthly FPAR values and the monthly light energy utilization rate calculated by the CASA model to then determine potential NPP for 2000 and 2016.

2.3.3. Soil Conservation

In this study, Revised Universal Soil Loss Equation (RUSLE) model [38], which is widely used in related research, was used to characterize soil conservation services based on the amount of soil conservation achieved. In the RUSLE model, potential soil erosion ( A p ) is the amount of soil erosion that would occur in the absence of measures designed to conserve vegetation cover, soil, and water; it is calculated without regard to surface cover (C = 1) and soil conservation activities (P = 1). Under these conditions, the formula for the RUSLE model is as follows:
A p = R × K × L S ,
Actual soil erosion ( A r ) considers vegetation cover and soil conservation, and the equation is as follows:
A r = R × K × L S × C × P ,
A p is potential soil erosion ( t · hm 2 · a ); R is rainfall-runoff erosivity, which is calculated from precipitation data using the monthly-scale equations proposed by Wischmeier and Smith [39]; K is soil erodibility, which is spatialized using the estimation method established by Sharpley and Williams [40]; and LS is slope length and steepness extracted from the DEM data using the model developed by Fu et al. [41]. A r is actual soil erosion ( t · hm 2 · a ); C is vegetation cover and management calculated using NDVI; and P represents soil conservation activities with values assigned based on relevant research [42,43]. Soil conservation was calculated as follows:
A c = A p A r
where, A c is soil conservation ( t · hm 2 · a ) .

2.3.4. Water Yield

Water yield was estimated by the Integrated Valuation of Ecosystem Services and Tradeoffs (InVEST) model. This model uses the principle of water balance to calculate regional water yield, which is the difference between actual precipitation and actual evapotranspiration. The calculation is as follows:
Y ( x ) = ( 1 A E T ( x ) / P ( x ) ) × P ( x ) ,
where Y ( x ) is the annual water yield ( mm ) of grid x; A E T ( x ) is the annual actual evapotranspiration ( mm ) of grid x; and P ( x ) is the average annual precipitation (mm) of grid x. The model inputs included watershed and sub-watershed data, which were extracted from DEM data using the ArcSWAT module. Annual precipitation was derived from weather station data. Annual potential evapotranspiration was calculated using the Modified Hargreaves model, where the astronomical radiation was interpolated based on previously calculated radiation values. Soil depth data were obtained from HWSD. The values for all other parameters were assigned based on previous research [42,43].

2.3.5. Sandstorm Prevention

Sandstorm prevention was calculated as the amount of potential wind erosion ( S L P o t e n t i a l ) minus the amount of actual wind erosion ( S L ). These values were obtained using the Revised Wind Erosion Equation (RWEQ) model and the following equations:
Q m a x = 109.8 × ( W F × E F × S C F × K × C ) ,
S = 150.71 × W F × E F × S C F × K × C 0.3711 ,
S L = 2 × ( z / S 2 ) × Q m a x · e ( z / s ) 2 ,
S P = S L P o t e n t i a l S L ,
R K = S P / S L P o t e n t i a l ,
where Qmax is the maximum amount of sand that can be transported downwind ( t · m 1 ); WF is the weather factor; EF is the soil erodible factor; SCF is the soil crusting factor; K′ is the soil roughness factor; C is vegetation factor; S is the critical field length (m); z is the maximum wind erosion range (m); S L is the amount of actual wind erosion with vegetation cover ( t · km 2 · a ); S L P o t e n t i a l is the amount of potential wind erosion without vegetation cover ( t · km 2 · a ); SP is sandstorm prevention ( t · km 2 · a ); and RK is the rate of sandstorm prevention. Climate, soil, and topographic factors greatly influence wind erosion; these factors exert a larger impact on wind erosion than does vegetation factors [44]. Therefore, when studying the relationship between the vegetation or NPP and sandstorm prevention, RK is used to instead SP.
Ideally, the parameter of wind speed used in the RWEQ model should be an average over 1 to 2 min. However, the meteorological data available for the region only contained daily averages. Therefore, we followed the research of Guo [45] about revised model in north of China. First, the Elliot method was used to convert the daily wind speed data to 2 m wind speed values, as required by the model. Subsequently, the converted data were used to obtain values for wind speed throughout a 24-h period. Finally, a wind factor ( W f - d a i l y ) was generated from the 24-h wind speed data, as follows:
W f - d a i l y = ( i = 1 N W S i ( W S i W S t ) 2 × ρ × N d ) / g .
W f - d a i l y is the wind factor value corresponding to average daily wind speed, W S i is wind speed measured at 2 m above the ground,   W S t is the critical wind speed at 2 m above the ground (the default value is 5   m · s 1 ), ρ is air density, g is the gravity acceleration constant, and N d is the number of wind speed data points obtained during the observation period (24 were obtained in this study). Using the wind factor conversion equation proposed by Guo [45], W f - 1 m i n was calculated for different wind speeds:
W f - 1 m i n = 0.3005 × W f - d a i l y .
While the data of snow cover, wind speed, and soil moisture were all at a daily scale, the NDVI data were at a 16-days scale. Therefore, the final calculation was carried out at the 16-days scale.

2.4. Relationships among ESs

2.4.1. Identification of ES Trade-Offs and Synergies

The Spearman analysis method was used to correlate four ESs in Duolun County in 2016 using data at a 250 m × 250 m resolution. Correlation analysis was performed on each pair of ESs in R statistical software. A positive correlation coefficient between a pair of ESs indicated a synergistic relationship, while a negative correlation coefficient indicated a trade-off relationship.

2.4.2. Statistical Analyses

A multivariate analysis was performed to explore the influence of the environment factors (slope gradients; clay (<0.002 mm), silt (0.002–0.02 mm), and sand (>0.02 mm) contents; soil organic matter content; vegetation coverage; precipitation) on the pairwise ESs. Considering the largest detrended correspondence analysis (DCA) gradient length values were all shorter than 3.0; we used redundancy analysis (RDA), and Monte Carlo permutation test based on 499 random permutations was conducted to rank the importance of common factors through Canoco’s forward selection function.

2.4.3. Quantification of ES Tradeoff Strengths

(1) PPF curves represent an economic concept in which combinations of various commodities produce different maximum outputs depending on resource inputs and technical constraints. Two different ESs can also produce a PPF curve, called trade-off efficiency curve [25,46,47]. The PPF curve of two ESs were plotted using the maximum values of combined services. The shortest distance between the point, which represents the mean values of the two ESs, and the PPF curve was used to quantify the strength of the trade-off. A long distance indicated stronger trade-off resulting in a state far from equilibrium, while a smaller distance indicated weaker trade-off [25].
(2) RMSE is a simple and effective method for quantifying the trade-offs among ESs. An RMSE value represents the distance between pairwise ESs and the 1:1 line in the coordinate system. The larger the RMSE value, the greater the tradeoff between the ESs [48,49].

3. Results

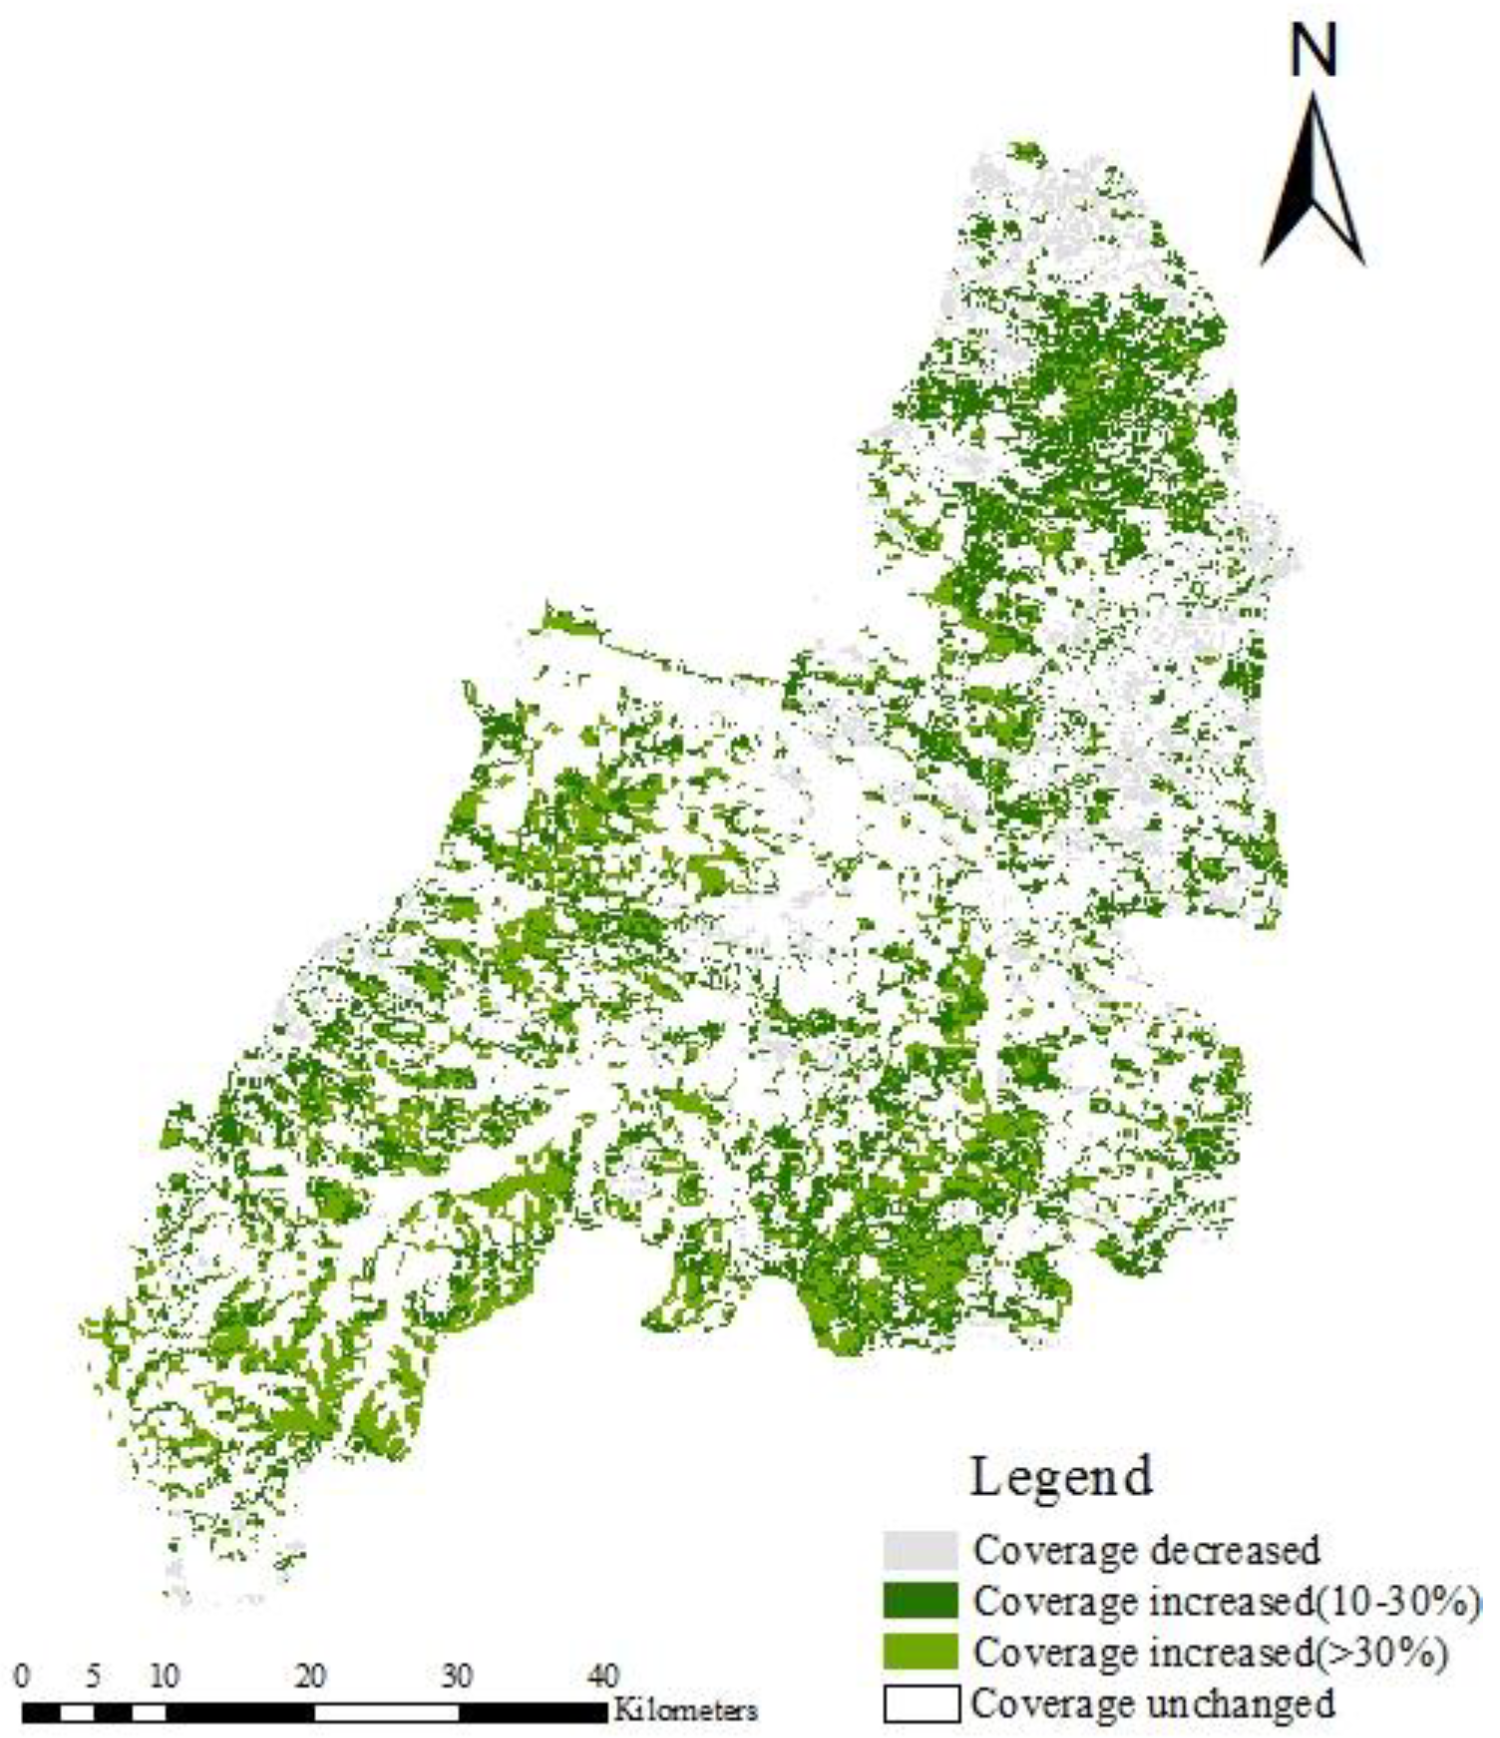
3.1. Changes in Land use and Vegetation Coverage

3.1.1. Changes in Land use

Figure 3a,b show land use in Duolun County in 2000 and 2016, respectively. Figure 3c shows land use changes between the two years. The region of unused land that was located in the middle of the county in 2000 had been converted to grassland by 2016. Over the same time period, farmland was converted to grassland and the area of construction land increased. A land use conversion matrix (Table 2) was created using land use data for the two years. Under the GFGP, about 210 km2 of unused land were converted to other land use types, which accounted for 36.3% of the unused land in 2000 and included the strip sand land in the middle of Duolun County. At the same time, 193 km2 of farmland, or 18% of the available farmland in 2000, were converted into other types. The largest areas of converted land were unused land to grassland (181.8 km2) and farmland to grassland (159.2 km2). Figure 3c shows that most grassland restoration was concentrated in the middle of Duolun County and accounted for 8.7% of the county’s total area.

3.1.2. Changes in Vegetation Coverage

Implementation of the GFGP drastically increased the vegetation coverage. The NDVI data for the growing seasons of 2000 and 2016 were selected to calculate the vegetation coverage. Figure 4 shows the changes in grassland and forest coverage between 2000 and 2016, and changes in vegetation coverage within a range of ± 10 % were considered not significant [50]. The vegetation coverage of the total 1353.2 km2 increased by more than 10%, accounting for 57.24% of the total vegetation area. Overall, average vegetation coverage increased by 15% between 2000 and 2016.

3.2. Changes in ESs

Total NPP, water yield, and soil conservation increased by 80.44%, 248.2%, and 12.2%, respectively, between 2000 and 2016, while the sandstorm prevention decreased by 55.9%. The increased vegetation coverage in 2016 resulted in a higher sandstorm prevention rate than in 2000. However, the average wind speed in 2000 was higher than in 2016, the amount of wind erosion in 2000 was higher than in 2016, and therefore the sandstorm prevention in 2016 was lower than in 2000. Similarly, calculations revealed a 27.1% increase in actual evapotranspiration, between 2000 and 2016, due to the increase in vegetation coverage. While the precipitation in 2016 was higher than in 2000, so a higher water yield estimated in 2016. The four ESs in Duolun County between 2000 and 2016 are shown in Figure 5.
NPP of Duolun County (Figure 5a) generally increased between 2000 and 2016. NPP was higher in the northeast than in other regions, due to the higher vegetation coverage in the northeast. Water yield was low in the south and high in the north in 2000 (Figure 5c), whereas an opposite trend was observed in 2016. Due to evapotranspiration was mainly affected by radiation [51] and showed a zonal distribution pattern that was low in the north and high in the south. Therefore, in 2000, water yield was low in the south and high in the north. While in 2016, Duolun County experienced abundant precipitation, which decreased from the south to the north and resulted in water yield that were high in the south and low in the north. In both 2000 and 2016 (Figure 5d), sandstorm prevention was lower in the south than in the north. Due to the terrain in the south is more hilly than in the north. Li et al. [52] found that relief amplitude is an important factor affecting wind erosion, which explains why sandstorm prevention was lower in the south than in the north of Duolun County. Table 3 shows the ratio of services provided by grasslands to the services provided by all vegetation was higher in 2016 than in 2000, whereas the proportion of services provided by farmland decreased between 2000 and 2016.

3.3. Correlation Coefficients between ESs in Duolun County

The trade-offs exhibited between ESs are a key issue in policy development. If management only focuses on one ES, it can lead to a loss in other ESs [53,54]. Therefore, a clear understanding of the trade-offs and synergies between ESs is necessary for effective policy development. Based on the four ESs in 2016, the following correlation analysis was performed on each pair of ecosystem services in R statistical software (Figure 6).
Combined Duolun’s ESs (Figure 5) and the correlation analysis between ESs (Figure 6), we found that:
(1) NPP was positively correlated with soil conservation. Because the increase in vegetation area and coverage not only increased NPP, but also increased the interception and infiltration of rainwater, thus reducing soil erosion and strengthening the soil conservation. As a result, NPP and the soil conservation showed a synergistic relationship. Figure 5 shows that the two services shared a certain degree of similarity in their spatial distribution;
(2) NPP was positively correlated with water yield. Although the increase in vegetation coverage simultaneous increase in regional evapotranspiration, which decreases water yield, the precipitation factor is more important to both services in this area. As a result, NPP and the water yield service showed a synergistic relationship;
(3) NPP negatively correlated with the sandstorm prevention. While Gong et al. [16] found the climate, soil, and topographic factors greatly influence wind erosion, these factors exert a larger impact on wind erosion than does vegetation factors. Therefore, we analyzed the sandstorm prevention rate and NPP, and the correlation coefficients is 0.788. Hence, the NPP and sandstorm prevention services actually showed a synergistic relationship;
(4) Soil conservation was positively correlated with water yield. Figure 5 shows that both services exhibited a decreasing trend from south to north in Duolun County. As illustrated in Table 4, we found that the precipitation is the most important factor for the trade-off of soil conservation and water yield. Therefore, because of precipitation showed a pattern of zonal differentiation and decreased gradually from south to north, the soil conservation and water yield showed a synergistic spatial relationship;
(5) The soil conservation service negatively correlated with sandstorm prevention. Figure 4 shows that soil conservation service was higher in the south than in the north due to a higher relief amplitude in the south than in the north, whereas sandstorm prevention showed an opposite trend. This was because relief amplitude is an important factor to both soil erosion and wind erosion [52], and soil erosion mainly occurred in areas with high relief amplitude, while areas with low relief amplitude were associated with a higher potential for wind erosion [55]. Therefore, the sandstorm prevention and soil conservation services showed a clear spatial trade-off relationship;
(6) Water yield negatively correlated with sandstorm prevention. As illustrated in Table 5, we found that the vegetation coverage and soil particles are the most important common factors for soil conservation and water yield. Therefore, an increase in vegetation coverage will reduce water yield and increase sandstorm prevention simultaneously. At the same time, some studies have found that the severity of wind erosion is lower in areas with large soil particles than in areas with smaller particles, due to the greater surface roughness of the soil [56]. On the other hand, when soil particles are small, the water retention and nutrient preserving capabilities of the soil are higher than in soils with larger particles [57]. Due to the differences in the effects of soil and vegetation factors on the two services, the water yield and sandstorm prevention services showed a spatial trade-off relationship.

3.4. NPP of Duolun County

Figure 7 shows the relative contributions of human activities and climate change to changes in total NPP in Duolun County grasslands [36]. The NPP in 2000 ( N P P 2000 ) included the NPP of unchanged grassland ( N P P u c h 00 ) (i.e., land cover was always grassland from 2000 to 2016), as well as the NPP of changed grassland ( N P P l o s s ) (i.e., grassland was converted to other land use types after the year 2000). Similarly, the NPP in 2016 ( N P P 2016 ) included the NPP of both unchanged grassland ( N P P u c h 16 ) and newly generated grassland NPP ( N P P n e w ):
N P P 2000 = N P P u c h 00 + N P P l o s s ,
N P P 2016 = N P P u c h 16 + N P P n e w .
The net increase in NPP between 2000 and 2016 ( N P P i n c ) was due to the impacts of human activities and climate change, and is represented by N P P h u m and N P P c l i , respectively. N P P h u m consists two parts: The change in NPP generated by land use circulation ( N P P l u c ) and the change in NPP generated by grassland management measures ( N P P m a ). Specifically, N P P l u c is equal to N P P n e w minus the sum of N P P l o s s and N P P c n e w , which is the impact of climate change on the NPP of newly generated grassland. N P P m a is equal to N P P u c h 16 minus the sum of N P P u c h 00 and N P P c u c h , which is the impact of climate change on the NPP of unchanged grassland:
N P P l c = N P P n e w N P P l o s s N P P c n e w ,
N P P m a = N P P u c h 16 N P P u c h 00 N P P c u c h .

4. Discussion

4.1. Impact of the GFGP on ESs

The GFGP changed the land use in Duolun County and increased the coverage of vegetation, thus affecting the generation and provisioning of ESs. Climate change and human activities jointly promote changes in ESs [58,59]. All County were impacted by climate change between 2000 and 2016, but only the regions in which the GFGP was implemented were affected by human activity. In order to focus on the impacts of the GFGP on ESs: (1) We analyzed changes in ESs caused by changing land use by comparing ESs in restored areas to unrestored areas in 2016 [14]; (2) We analyzed the effects of increased vegetation coverage on ESs by correlating ESs with vegetation coverage.

4.1.1. Differences in ESs between Restored Grasslands and Unrestored Areas

We used two non-parametric algorithms (the independent samples Mann-Whitney U test and the Kolmogorov-Smimov Z test) to evaluate differences in the four ESs between farmland and restored grassland in 2016. Average soil conservation was 253.43   t · hm 2 · a in the restored grassland and 212.13   t · hm 2 · a in the farmland. Average water yield was 23.43   mm in restored grassland and 21.89   mm in farmland. Both ESs by farmland were significantly lower than by restored grassland. In contrast, the NPP and sandstorm prevention of farmland were higher than restored grassland. Hypothesizing that this phenomenon is due to the short growing period of the restored grassland, which prevented it from improving higher sandstorm prevention and NPP than farmland. This assumption was further verified using the following two-step analysis:
(1)
Comparison of the ESs provided by restored grasslands and high-coverage grasslands with a steepness less than 5 degrees;
(2)
Comparison of the ESs provided by farmland and high-coverage grasslands with a steepness less than 5 degrees;
We chose high-coverage grasslands with a steepness less than 5 degrees to avoid the influence of steepness on sandstorm prevention, and we found that the high-coverage grasslands exhibited higher NPP and sandstorm prevention than restored grasslands and slightly higher NPP and sandstorm prevention than farmland. Specifically, the average NPP provided by restored grassland, farmland, and high-coverage grassland were 453.08   gC · m 2 , 515.60   gC · m 2 and respectively. The NPP of restored grassland was 87.87 % of farmland. Average sandstorm prevention in the restored grassland, farmland, and high-coverage grassland were 18.64   t · km 2 · a ,   21.24   t · km 2 · a , and 22.31   t · km 2 · a respectively. Sandstorm prevention in the restored grassland was 87.76 % of farmland. These results demonstrate that after the restored grassland has grown for a sufficient period of time, it could provide higher ESs than farmland, indicating that the GFGP could achieve increasing ecological benefits in the future.

4.1.2. Correlation Analysis between Vegetation Coverage and ESs

The Spearman analysis was used to analyze correlations between grassland coverage and ESs in 2016. As shown in Table 6, grassland coverage was positively correlated with NPP, soil conservation, and the sandstorm prevention rate. Specifically, the correlation coefficients of grassland coverage-NPP and grassland coverage-sandstorm prevention were high, whereas no significant relationship was observed between grassland coverage-water yield. These results demonstrate that the increase in grassland coverage could increase NPP, soil conservation, and sandstorm prevention. However, water yield did not increase significantly, due to enhanced evapotranspiration.
In general, compared with farmland, restored grassland can provide better soil conservation and water yield services. With the increase in grassland coverage, the provision of NPP, soil conservation, and sandstorm prevention would also increase. When grassland coverage reaches a certain threshold, it could provide higher NPP and sandstorm prevention than farmland. Therefore, by converting farmland into grassland and applying grassland management measures to increase grassland coverage at the same time, the GFGP does have helped to improve the ESs in Duolun County.

4.2. The Relative Effects of Climate Change and GFGP Policies

Temperature and precipitation, two important climate factors, have risen steadily in Duolun County from 2000 to 2016. Meanwhile, the implementation of GFGP has changed land use and increased vegetation cover in this region. Climate changes and human activities are the two most important driving forces for ecosystems and ecosystem services [58,59], and both affect the biophysical characteristics of ecosystem, so it is difficult to separate the impacts of human activities and climate change on ESs [60]. In order to analyze the relative impacts of climate change and the GFGP on ESs in Duolun County, we selected the grassland NPP for discussion.
Ecologically, ecosystem functions (such as biodiversity and primary production) is the basis of all other ESs and play a crucial role in their yields [61]. Some researchers have found that NPP is highly correlated with the total of all ESs [1,62,63]. Benis et al. [63] have designed quantitative assessment models of ESs based on NPP and obtained good results when such models are used to quantify ESs [64]. These studies suggest that NPP not only forms the material basis of ESs, but also can be used as a key indicator of other ESs. Therefore, we analyzed the relative effects of climate change and GFGP policies by comparing actual NPP and potential NPP in unchanged grassland and restored grassland in 2000 and 2016.
As shown in Figure 7, between 2000 and 2016, grassland NPP experienced a net increase of 527.35 GgC. Human activities increased NPP by 528.82 GgC; grassland management measures contributed to 463.09 GgC of this increase, accounting 87.82%, and land use circulation contributed to 65.73 GgC of the increase, accounting 12.46%. Meanwhile, climate change decreased NPP by 1.47 GgC. Using unchanged grassland as an example, although the temperature and precipitation in Duolun County increased since 1999, the precipitation during the 2016 growing season (92.4 mm) was lower than the precipitation during the 2000 growing season (109.93 mm). As a result, the potential NPP of unchanged grassland dropped from 1079.07 GgC in 2000 to 1024.34 GgC in 2016, indicating that the climatic conditions of 2016 in Duolun County decreased the NPP of unchanged grassland by 54.73 GgC. In contrast, grassland management measures increased the NPP of this region by 463.09 GgC between 2000 and 2016. These results suggest that the majority of the increase in Duolun County’s NPP was due to the GFGP policies, including reductions in grazing intensity and adjustments to grassland utilization patterns.
NPP serves as the material basis for ESs, and the driving forces underlying the formation of NPP distribution patterns simultaneously act on other ESs [65]. Therefore, the improvement of the ecological environment in Duolun County can be largely attributed to the implementation of the GFGP. Besides, we found the change in NPP generated by grassland management measures ( N P P m a ) is far higher than the change in NPP generated by land use circulation ( N P P l u c ). That is different from other areas of GFGP implementation, like Yunnan province and the Loess Plateau, where’s changes of ESs mainly caused by land use circulation [14,22,24]. While the GFGP in Duolun County has also improved the environment efficiently, which provides experience for the future ecological restoration policy in the agricultural-pastoral ecotone

4.3. Impacts of Vegetation on ES Tradeoffs

ES trade-offs and synergies are formed by complex mechanisms, which are affected by a wide range of factors [66]. While compared to other factors, the factors can be directly changed by policy are not much, like vegetation type, vegetation coverage. Therefore, understanding the mechanisms of influencing factors especially vegetation factors underlying the relationships of ESs could further reduce trade-offs effect and inform effective land management decisions on ecological restoration area.
Some researchers have found that vegetation factors can influence the strength of trade-offs between ESs in ecological restoration areas [26,27,67]. While the GFGP changed the proportion of grassland and vegetation coverage. In order to analyze the relationship between ESs and the vegetation factors, include vegetation types and vegetation coverage, we used soil conservation and sandstorm prevention as examples to carry out the following investigations:
(1)
According to the division of sub-watersheds in Duolun County (Figure 8-Left), four sub-watersheds occupied by different proportions of vegetation types were selected to compare trade-off strengths using the PPF curve method;
(2)
Using the RMSE method, we quantified the strength of ESs trade-offs in farmland versus grassland with different vegetation coverage.

4.3.1. Effect of Different Vegetation Types on the Strength of ES Trade-Offs

The trade-off efficiency curves for sub-watersheds 1, 2, 3, and 4 in Duolun County in 2016 are shown in Figure 9. The shortest distances between the dots and the curves of corresponding color represent the strength of ES trade-offs in the sub-watersheds. Combining with the proportion of different vegetation type (Figure 8-right), we found that a higher proportion of grassland correlated with a lower trade-off between the soil conservation and sandstorm prevention services (sub-watershed 2 < sub-watershed 1 < sub-watershed 3) at the sub-watershed scale. While the proportion of grassland in sub-watershed 4 was lower than in sub-watershed 1, the trade-off strength in sub-watershed 4 was smaller than in sub-watershed 1. This might be because the proportion of forested land in sub-watershed 4 was higher than in sub-watershed 1.

4.3.2. Effect of Different Vegetation Coverage on the Strength of ES Trade-Offs

To assess the effects of vegetation type and coverage on the trade-off strengths between ESs, we calculated the RMSE values of ESs for grassland and farmland in 2016 (Figure 10). The results showed that the RMSE for grassland was less than that for farmland, which indicates that the trade-off between soil conservation and sandstorm prevention services was weaker in grassland than in farmland, and that, at the sub-watershed scale, the higher proportion of grasslands produce a lower trade-off strength between the soil conservation and sandstorm prevention services.
Next, we calculated the RMSE values of ESs for grassland with different coverage (Figure 11). The results showed that, as the percentage of grassland coverage increases, the RMSE values decline at first and then increase. If the coverage of grassland is below 10%, such area is defined as bare land. It can be considered that grassland is a factor that reduces the trade-off between soil conservation and sandstorm prevention. However, when grassland coverage is higher than 80%, this weakening effect gradually decreases. In contrast, farmland strengthens the trade-off between the soil conservation and sandstorm prevention services.
In terms of soil conservation and sandstorm prevention, the four sub-watersheds in Duolun County occupied by different proportions of vegetation types displayed different trade-off strengths, due to the different strengths of trade-offs in grassland and farmland. In addition, grasslands with different percentages of coverage also showed different trade-off strengths. The GFGP improved soil conservation and sandstorm prevention in the region, at the same time, the trade-off strength between the two ESs has been weakened.

4.4. Advices for Future Policies

The trade-offs among ESs makes it difficult for all ESs to increase at the same time [14]. An ES benefit and conflict framework should be designed based on the accurate identification of the relationships between ESs, and used to identify winners and losers in different ES trade-offs. At the same time, appropriate policies should be formulated in conjunction with the objectives of the GFGP [68].
The eventual purpose of the GFGP is to restore the regional ecosystem, but food security is also an important consideration [5]. GFGP policies are typically implemented in areas experiencing ecological and economic poverty. The implementation of the restoration project in Duolun County reduced the area of farmable land and the grazing ban affected the livestock industry, thus affecting the economic and living standards of local people [69]. When the ratio of restored grassland to farmland exceeded a certain threshold, the economic resilience of farmers’ households deteriorated, and local farmers may experience reclaim farmland to reduce food shortages [70,71], which poses a threat to grassland restoration projects. Therefore, to avoid potential negative consequences of the GFGP policies, policy-makers must ensure adequate access to farmland for local populations.

5. Conclusions

This study quantitatively assessed changes in four ESs and the relationships among ESs in areas of Duolun County undergoing GFGP efforts between 2000 and 2016. Significant changes were detected in all four ESs in the restored grassland areas, but especially NPP. We found the GFGP changed the ESs in Duolun County by changing the land use and increasing the grassland coverage. Our study shows that human activities in the form of grassland restoration play an important role in the improvement of ESs in Duolun County, primarily by improving vegetation cover. We found that no matter in the unchanged or restored grassland, coverage of vegetation is closely related to ecosystem services, so the scientific management of grasslands in Duolun County will improve the county’s ESs effectively and continue to enhance ES benefits in the future.
In addition, different trade-offs/synergies exist between ESs. We found that higher proportion of grassland was associated with a lower trade-off strength between the soil conservation and sandstorm prevention, which is because the trade-off strength in grassland was lower than in farmland. Besides, grassland reduced the trade-off strength between soil conservation and sandstorm prevention and this effect was related with the grassland coverage.

Author Contributions

Conceptualization, D.D., X.L, S.L. and H.D.; Data curation and formal analysis, D.D.; Funding acquisition, X.L.; Methodology, D.D., S.L. and H.D.; Resources, X.L.; Software, S.L.; Visualization, D.D.; Writing—original draft, D.D.; Writing—review and editing, X.L.

Funding

This research was funded by the National key R&D key projects (grant no. 2016YFC0500502), the Natural Science Foundation of China (grant no. 31570451), the Cheung Kong Scholars Program, and the Innovative Research and Training Program (grant no. IRT_15R06).

Acknowledgments

This study was funded by the National key R&D key projects (grant no. 2016YFC0500502), the Natural Science Foundation of China (grant no. 31570451), the Cheung Kong Scholars Program, and the Innovative Research and Training Program (grant no. IRT_15R06).

Conflicts of Interest

The authors declare no conflict of interest.

References

  1. Costanza, R. The value of the world’s ecosystem services and nature capital. Nature 1997, 387, 253–260. [Google Scholar] [CrossRef]
  2. Daily, G.C. Nature’s services: Societal dependence on natural ecosystems. Pac. Conserv. Biol. 1997, 6, 220–221. [Google Scholar]
  3. Dai, E.; Wang, X.; Zhu, J.; Zhao, D. Ecosystem service Tradeoffs: Methods, Models and Research Framework. Geogr. Res. 2016, 35, 1005–1016. [Google Scholar]
  4. Ren, Y.; Lü, Y.; Fu, B. Quantifying the impacts of grassland restoration on biodiversity and ecosystem services in China: A meta-analysis. Ecol. Eng. 2016, 95, 542–550. [Google Scholar] [CrossRef] [Green Version]
  5. Lu, Q.; Xu, B.; Liang, F.; Gao, Z.; Ning, J. Influences of the Grain-for-Green project on grain security in southern China. Ecol. Indic. 2013, 34, 616–622. [Google Scholar] [CrossRef] [Green Version]
  6. Mu, S.; Zhu, C.; Zhou, K.; Li, J. Study on the countermeasures for grassland degradation and carbon increase in Inner Mongolia. Acta Acad. Sin. 2017, 25, 217–225. [Google Scholar]
  7. Zeng, Z.; Bi, J.; Li, S.; Chen, S.; Pike, D.; Gao, Y.; Du, W. Effects of habitat alteration on lizard community and food web structure in a desert steppe ecosystem. Biol. Conserv. 2014, 179, 86–92. [Google Scholar] [CrossRef]
  8. Jiang, G.; Han, X.; Wu, J. Restoration and management of the Inner Mongolia grassland require a sustainable strategy. Ambio 2006, 35, 269. [Google Scholar] [CrossRef] [PubMed]
  9. Unkovich, M.; Nan, Z. Problems and prospects of grassland agroecosystems in western China. Agric. Ecosyst. Environ. 2008, 124, 1–2. [Google Scholar] [CrossRef]
  10. Liu, J.; Diamond, J. China’s environment in a globalizing world. Nature 2005, 435, 1179. [Google Scholar] [CrossRef] [PubMed]
  11. Liu, J.; Li, S.; Ouyang, Z.; Tam, C.; Chen, X. Ecological and socioeconomic effects of China’s policies for ecosystem services. Proc. Natl. Acad. Sci. USA 2008, 105, 9477. [Google Scholar] [CrossRef] [PubMed]
  12. Deng, L.; Liu, S.; Kim, D.; Peng, C.; Sweeney, S.; Shangguan, Z. Past and future carbon sequestration benefits of China’s grain for green program. Glob. Environ. Chang. 2017, 47, 13–20. [Google Scholar] [CrossRef]
  13. Feng, X.; Fu, B.; Lu, N.; Zeng, Y.; Wu, B. How ecological restoration alters ecosystem services: An analysis of carbon sequestration in China’s Loess Plateau. Sci. Rep. 2013, 3 Pt 1, 2846. [Google Scholar] [CrossRef]
  14. Wang, J.; Peng, J.; Zhao, M.; Liu, Y.; Chen, Y. Significant trade-off for the impact of Grain-for-Green Programme on ecosystem services in North-western Yunnan, China. Sci. Total Environ. 2017, 574, 57–64. [Google Scholar] [CrossRef] [PubMed]
  15. Deng, L.; Shangguan, Z.; Li, R. Effects of the grain-for-green program on soil erosion in China. International J. Sediment Res. 2012, 27, 120–127. [Google Scholar] [CrossRef]
  16. Gong, G.; Liu, J.; Shao, Q. RWEQ-based research on wind erosion of soil in Xilin Hot of Inner Mongolia since the 1990s. Adv. Geogr. 2014, 33, 825–834. [Google Scholar]
  17. Cao, S.; Tian, T.; Chen, L.; Dong, X.; Yu, X.; Wang, G. Damage Caused to the Environment by Reforestation Policies in Arid and Semi-Arid Areas of China. Ambio 2010, 39, 279–283. [Google Scholar] [CrossRef] [PubMed] [Green Version]
  18. Rodríguez, J.; Beard, T.; Bennett, E.; Cumming, G.; Cork, S.; Agard, J.; Dobson, A.; Peterson, G. Trade-offs across Space, Time, and Ecosystem Services. Ecol. Soc. 2006, 11, 709–723. [Google Scholar] [CrossRef]
  19. D’Amato, A.; Bradford, J.; Fraver, S.; Palik, B. Forest management for mitigation and adaptation to climate change: Insights from long-term silviculture experiments. Forest Ecol. Manag. 2011, 262, 803–816. [Google Scholar] [CrossRef]
  20. Dickie, I.A.; Yeates, G.W.; St. John, M.G.; Stevenson, B.A.; Scott, J.T.; Pillig, M.C.; Peltzer, D.A.; Orwin, K.H.; Kirschbaum, M.U.F.; Hunt, J.E.; et al. Ecosystem service and biodiversity trade-offs in two woody successions. J. Appl. Ecol. 2011, 48, 926–934. [Google Scholar] [CrossRef] [Green Version]
  21. Zheng, H.; Li, Y.; Ouyang, Z.; Luo, Y. Research progress on the management of ecosystem service functions. Chin. J. Ecol. 2013, 33, 702–710. [Google Scholar]
  22. Jia, X.; Fu, B.; Feng, X.; Hou, G.; Liu, Y.; Wang, X. The tradeoff and synergy between ecosystem services in the Grain-for-Green areas in Northern Shaanxi, China. Ecol. Indic. 2014, 43, 103–113. [Google Scholar] [CrossRef] [Green Version]
  23. Lü, Y.; Fu, B.; Feng, X.; Zeng, Y.; Liu, Y.; Chang, R.; Sun, G.; Wu, B. A policy-driven large scale ecological restoration: Quantifying ecosystem services changes in the Loess Plateau of China. PLoS ONE 2012, 7, e31782. [Google Scholar] [CrossRef] [PubMed]
  24. Su, C.; Fu, B. Evolution of ecosystem services in the Chinese Loess Plateau under climatic and landuse changes. Glob. Planet. Chang. 2013, 101, 119–128. [Google Scholar] [CrossRef]
  25. Yang, W.; Jin, Y.; Sun, T.; Yang, Z.; Cai, Y.; Yi, Y. Trade-offs among ecosystem services in coastal wetlands under the effects of reclamation activities. Ecol. Indic. 2017, 92, 354–366. [Google Scholar] [CrossRef]
  26. Feng, Q.; Zhao, W.; Fu, B.; Ding, J.; Wang, S. Ecosystem service trade-offs and their influencing factors: A case study in the Loess Plateau of China. Sci. Total Environ. 2017, 607, 1250–1263. [Google Scholar] [CrossRef] [PubMed]
  27. Wu, X.; Wang, S.; Fu, B.; Liu, Y.; Zhu, Y. Landuse optimization based on ecosystem service assessment: A case study in the Yanhe watershed. Landuse Policy 2018, 72, 303–312. [Google Scholar] [CrossRef]
  28. He, Y.; Zhao, M.; Wang, J.; Zhang, H. Response of prairie productivity to climatic factors in the farming-pastoral ecotone of Inner Mongolia: A case study in Duolun County. J. Arid Meteorol. 2008, 26, 84–89. [Google Scholar]
  29. Jiang, G.; Liu, M.; Niu, S.; Li, Y.; Peng, Y.; Li, G.; Su, B. Review and prospect of ecological restoration in Hunshandake Sandy Land over 10 years. Sci. Technol. Rev. 2011, 29, 19–25. [Google Scholar]
  30. Dai, L.; Che, T.; Wang, J.; Zhang, P. Snow depth and snow water equivalent estimation from AMSR-E data based on a priori snow characteristics in Xinjiang, China (EI). Remote Sens. Environ. 2012, 127, 14–29. [Google Scholar] [CrossRef]
  31. Che, T.; Li, X. Retrieval of snow depth in China using passive microwave remote sensing data and relevant accuracy evaluation. Remote Sens. Technol. Appl. 2004, 19, 301–306. [Google Scholar]
  32. Potter, C.S.; Randerson, J.T.; Field, C.B.; Matson, P.A.; Vitousek, P.M.; Mooney, H.A.; Klooster, S.A. Terrestrial ecosystem production: A process model based on global satellite and surface data. Glob. Biogeochem. Cycles 1993, 7, 811–841. [Google Scholar] [CrossRef]
  33. Ma, Y.; Li, X.; Song, J.; Gao, C.; Zhao, D.; Shen, Y. Climatology calculation of total solar radiation and its temporal and spatial distribution in the Inner Mongolia Autonomous Region of China. J. Meteorol. Environ. 2013, 29, 102–109. [Google Scholar]
  34. Zhu, W.; Pan, Y.; Zhang, J. Remote sensing estimation of net primary production of terrestrial vegetation in China. Chin. J. Plant Ecol. 2007, 31, 413–424. [Google Scholar]
  35. Zhu, W.; Pan, Y.; Long, Z.; Chen, Y.; Li, J.; Hu, H. NPP estimation of regional terrestrial vegetation based on GIS and RS: A case study of Inner Mongolia, China. J. Remote Sens. 2005, 9, 300–307. [Google Scholar]
  36. Mu, S.; Zhou, S.; Chen, Y.; Li, J.; Ju, W.; Odeh, I.O.A. Assessing the impact of restoration-induced land conversion and management alternatives on net primary productivity in Inner Mongolian grassland, China. Glob. Planet. Chang. 2013, 108, 29–41. [Google Scholar] [CrossRef]
  37. Xu, D. Quantitative Study of the Relative Role of Climate Change and Human Activities in the Process of Desertification; Nanjing Agricultural University: Nanjing, China, 2009. [Google Scholar]
  38. Kenneth, G.R.; George, R.F.; Glenn, A.W.; Jeffrey, P.P. RUSLE: Revised universal soil loss equation. J. Soil Water Conserv. 1991, 46, 30–33. [Google Scholar]
  39. Wischmerie, W.H.; Smith, D.D. Predicting Rainfall-Erosion Losses from Cropland East of the Rocky Mountains: A Guide to Conservation Planning; Agricultural Research Service, US Department of Agriculture: Washington, DC, USA, 1965.
  40. Sharpley, A.N.; Williams, J.R. EPIC-erosion/Productivity Impact Calculator: 2. User Manual; Technical Bulletin; United States Department of Agriculture: Washington, DC, USA, 1990; Volume 4, pp. 206–207. [Google Scholar]
  41. Fu, S.; Liu, B.; Zhou, G. Calculation tools for slope length and slope steepness factors. Sci. Soil Water Conserv. 2015, 5, 105–110. [Google Scholar]
  42. Zhang, X.; Niu, J.; Zhang, Q.; Huang, J.; Zhang, J. Soil conservation functions and their spatial distribution in the grassland ecosystem of Xilin watershed, Inner Mongolia. J. Pratacult. Sin. 2015, 24, 12–20. [Google Scholar]
  43. Zhang, X. Spatio-Temporal Dynamics and Prediction of Grassland Landscape Services: A Case Study of the Xilin River Basin in Inner Mongolia, China; Inner Mongolia University: Hohhot, China, 2017. [Google Scholar]
  44. Gong, G. Characteristics of Spatial-Temporal Variations in the Wind Erosion of soil in Northern China and the Analysis of Underlying Factors; University of Chinese Academy of Science: Beijing, China, 2014. [Google Scholar]
  45. Guo, Z. Parameter Revision of RWEQ Model and Its Application in Northern China; Beijing Normal University: Beijing, China, 2012. [Google Scholar]
  46. Ager, A.A.; Day, M.A.; Vogler, K. Production possibility frontiers and socioecological tradeoffs for restoration of fire adapted forests. J. Environ. Manag. 2016, 176, 157–168. [Google Scholar] [CrossRef] [PubMed] [Green Version]
  47. King, E.; Cavender-Bares, J.; Balvanera, P.; Mwampamba, T.H.; Polasky, S. Trade-offs in ecosystem services and varying stakeholder preferences: Evaluating conflicts, obstacles, and opportunities. Ecol. Soc. 2015, 20, 25. [Google Scholar] [CrossRef]
  48. Bradford, J.B.; D’Amato, A.W. Recognizing trade-offs in multi-objective land management. Front. Ecol. Environ. 2012, 10, 210–216. [Google Scholar] [CrossRef]
  49. Lu, N.; Fu, B.; Jin, T.; Chang, R. Trade-off analyses of multiple ecosystem services by plantations along a precipitation gradient across Loess Plateau landscapes. Landsc. Ecol. 2014, 29, 1697–1708. [Google Scholar] [CrossRef] [Green Version]
  50. Wu, Z.; Li, F.; Zhang, L.; Zhang, J.; Du, J. Extraction of grassland reference coverage and grassland degradation study in the Sanjiangyuan region. J. Nat. Disasters 2014, 23, 94–102. [Google Scholar]
  51. Wen, S.; Jiang, T.; Li, X.; Wang, T.; Wang, Y.; Thomas, F. Changes of Actual Evapotranspiration over the Songhua River Basin from 1961 to 2010. Progressus Inquisitiones Mut. Clim. 2014, 10, 79–86. [Google Scholar]
  52. Li, X.; Ni, J. Spatial correlation analysis of soil erosion and its influencing factors. Adv. Geogr. 2009, 28, 161–166. [Google Scholar]
  53. Bennett, E.M.; Peterson, G.D.; Gordon, L.J. Understanding relationships among multiple ecosystem services. Ecol. Lett. 2009, 12, 1394–1404. [Google Scholar] [CrossRef] [PubMed] [Green Version]
  54. Fu, B.; Zhang, L.; Xu, Z.; Zhao, Y.; Wei, Y.; Skinner, D.S. Ecosystem services in changing landuse. J. Soils Sediments 2015, 15, 833–843. [Google Scholar] [CrossRef]
  55. Du, H.; Dou, S.; Deng, X.; Xue, X.; Wang, T. Assessment of wind and water erosion risk in the watershed of the Ningxia-Inner Mongolia Reach of the Yellow River, China. Ecol. Indic. 2016, 67, 117–131. [Google Scholar] [CrossRef]
  56. Zamani, S.; Mahmoodabadi, M. Effect of particle-size distribution on wind erosion rate and soil erodibility. Arch. Agron. Soil Sci. 2013, 59, 1743–1753. [Google Scholar] [CrossRef]
  57. Shui, W.; Bai, J.; Jian, X.; Qi, X.; Su, Z.; Chen, Y.; Cai, Y. Soil characteristics and water conservation functions in the restoration process of grassland desertification on Ruoergai plateau. Chin. J. Ecol. 2017, 37, 277–285. [Google Scholar]
  58. Nelson, E.J.; Kareiva, P.; Ruckelshaus, M.; Arkema, K.; Geller, G.; Girvetz, E.; Goodrich, D.; Matzek, V.; Pinsky, M.; Reid, W.; et al. Climatechange’s impact on key ecosystem services and the human well-being they support in the US. Front. Ecol. Environ. 2013, 11, 483–493. [Google Scholar] [CrossRef]
  59. Millennium Ecosystem Assessment. Ecosystem and Human Well-Being: Synthesis; Island Press: Washington, DC, USA, 2005. [Google Scholar]
  60. Zhang, Y.; Song, C.; Zhang, K.; Cheng, X.; Band, L.E.; Zhang, Q. Effects of landuse/land cover and climate changes on terrestrial net primary productivity in the Yangtze River Basin, China, from 2001 to 2010. J. Geophys. Res. Biogeosci. 2014, 119, 1092–1109. [Google Scholar] [CrossRef]
  61. Costanza, R.; Groot, R.D.; Braat, L.; Kubiszewski, I.; Fioramonti, L.; Sutton, P.; Farber, S.; Grasso, M. Twenty years of ecosystem services: How far have we come and how far do we still need to go? Ecosyst. Serv. 2017, 28, 1–16. [Google Scholar] [CrossRef]
  62. Shi, Q.S.; Wang, Z.; Wu, Y.; Gao, W.; Shi, Q.D. Value estimation of ecosystem services in Xinjiang and their correlation with NPP. J. Arid Land Geogr. 2010, 33, 427–433. [Google Scholar]
  63. Benis, E.; Belinda, R.; Mathieu, R.; Richardson, D.M.; Le Maitre, D.C.; Van Jaarsveld, A.S. Mapping ecosystem services for planning and management. Agric. Ecosyst. Environ. 2008, 127, 135–140. [Google Scholar]
  64. Barral, M.P.; Oscar, M.N. Land-use planning based on ecosystem service assessment: A case study in the Southeast Pampas of Argentina. Agric. Ecosyst. Environ. 2012, 154, 34–43. [Google Scholar] [CrossRef]
  65. Zhang, K.; Lü, Y.; Fu, B. Evolution of ecosystem services in ecological restoration: Trends, processes, and assessments. Chin. J. Ecol. 2016, 36, 6337–6344. [Google Scholar]
  66. Dai, E.; Wang, X.; Zhu, J.; Gao, J. Progress and trend of study on trade-offs/synergies between ecosystem services. Adv. Earth Sci. 2015, 30, 1250–1259. [Google Scholar]
  67. Chritina, M.K.; Peter, L.H.; Daniela, A.M.; Leandro, B.; Kei, S.; Marcelo, M.; Jeffrey, S.E.; Stephen, P.; Perrine, H.; Emerson, M.V.; et al. Optimizing landuse decision-making to sustain Brazilian agricultural profits, biodiversity and ecosystem services. Biol. Conserv. 2016, 204, 221–230. [Google Scholar]
  68. Kovács, E.; Kelemen, E.; Kalóczkai, A.; Margoczi, K.; Pataki, G.; Gebert, J.; Malovics, G.; Balaza, B.; Roboz, A.; Kovacs, E.K.; et al. Understanding the links between ecosystem service trade-offs and conflicts in protected areas. Ecosyst. Serv. 2015, 12, 117–127. [Google Scholar] [CrossRef]
  69. Zhang, X. Effect of Rational Grazing in the Loess Plateau on Soil Respiration and Erosion of Reclaimed Grasslands; Chinese Academy of Agricultural Sciences: Beijing, China, 2016. [Google Scholar]
  70. Li, Q.; Amjath-Babu, T.S.; Zander, P. Role of capitals and capabilities in ensuring economic resilience of land conservation efforts: A case study of the grain for green project in China’s Loess Hills. Ecol. Indic. 2016, 71, 636–644. [Google Scholar] [CrossRef]
  71. Liu, C.; Liu, J. The impact of the forest reclamation of farmland policy on food security in China. J. Beijing For. Univ. (Soc. Sci.) 2007, 6, 42–47. [Google Scholar]
Figure 1. The flow chart of this study.
Sustainability 10 04036 g001
Figure 2. Geographic location of Duolun County.
Sustainability 10 04036 g002
Figure 3. Land use maps for Duolun County in 2000 (a) and 2016 (b) and land use changes between the two years (c).
Sustainability 10 04036 g003
Figure 4. Changes of vegetation coverage in Duolun County between 2000 and 2016.
Sustainability 10 04036 g004
Figure 5. ESs in Duolun County between 2000 and 2016.
Sustainability 10 04036 g005
Figure 6. Correlation analysis between ESs in Duolun County in 2016. *** Indicates a significant correlation at a confidence level (bilateral) of 0.001.
Sustainability 10 04036 g006
Figure 7. The effects of human activities and climate change on NPP in Duolun County grasslands in 2000 and 2016.
Sustainability 10 04036 g007
Figure 8. Sub-watershed delineations in Duolun County (left) and the proportion of different vegetation types (right).
Sustainability 10 04036 g008
Figure 9. Trade-off strength between soil conservation and sandstorm prevention services in sub-watersheds 1, 2, 3, and 4 in 2016.
Sustainability 10 04036 g009
Figure 10. RMSE values for different land use types.
Sustainability 10 04036 g010
Figure 11. RMSE values for different proportion of grassland coverage in Duolun County.
Sustainability 10 04036 g011
Table 1. Abbreviations.
AbbreviationDescription
ESEcosystem Service
GFGPGrain-for-Green Programme
NPPNet Primary Productivity
PPFProduction Possibility Frontier
RKRate of sandstorm prevention
RMSERoot-Mean-Square Error
SCSoil Conservation
SPSandstorm Prevention
WYWater Yield
Table 2. Land use conversion matrix in Duolun County between 2000 and 2016 ( km 2 ).
2016FarmlandForestGrasslandWater AreaConstruction LandUnused Land
2000
Farmland893.364.23159.190.6612.8816.30
Forest2.7175.3716.080.070.201.43
Grassland129.7215.521890.862.3414.1866.53
Water area0.700.093.2517.320.030.67
Construction land5.770.276.950.0830.640.93
Unused land24.260.40181.821.102.53368.34
Table 3. ESs provided by different vegetation types in Duolun County between 2000 and 2016.
YearGrasslandRatio (%)ForestRatio (%)FarmlandRatio (%)Total
NPP (GgC)2000604.2163.1929.993.14322.0433.68952.81
20161131.5665.6150.082.90543.0931.491719.24
SC (Mt)200046.5769.815.628.4214.5221.7666.71
201655.5573.165.757.5714.6319.2775.92
WY (Mt)2000101.2869.671.591.0942.5029.24145.37
2016358.9070.476.481.27143.9428.26509.32
SP ( 10 3 t )200085.2062.422.451.7948.8435.78136.48
201640.5663.550.891.4022.3735.0563.82
Table 4. Marginal and conditional effects from the summary of forward selection for SC-WY trade-offs.
Environment FactorsMarginal Effects (%)Conditional Effects (%)
Precipitation1010
Clay content6-
Sand content4-
Silt content46
“-” Indicates that the marginal or conditional effect is not significant.
Table 5. Marginal and conditional effects from the summary of forward selection for SP-WY trade-offs.
Environment FactorsMarginal Effects (%)Conditional Effects (%)
Soil organic matter content76
Vegetation coverage43
Clay content22
Table 6. Relationships between vegetation coverage and ESs in Duolun County in 2016.
NPPSCWYRK
Grassland coverage0.651 *0.057 *-0.666 *
* Indicates a significant correlation at a confidence level (bilateral) of 0.01. “-” Indicates that the marginal or conditional effect is not significant.

