Abstract
Tourism has rapidly developed into one of the world’s largest industries, and represents a new growth point for stimulating a region’s economic and social development. Therefore, a clear understanding of the interactive relationship between the tourism industry, the economy and the environment, as well as the potential mechanisms involved, can play an important role in improving the coordination between these three elements and forming a sustainable development policy. By utilizing quantitative analysis methods and models, this study uses Qingyang City, Gansu Province, as a case study, and tests the relationship between the development of the tourism industry, the economy and the environment. This study makes a number of important conclusions: (1) a mutually promoting relationship does not exist between the development of the tourism industry and economic growth; instead, a unidirectional relationship is found between the two elements. Similarly, a mutually promoting relationship does not exist between the development of the tourism industry and environmental quality; rather, a unidirectional relationship is found between the two elements. (2) The “curse effect” on economic growth imposed by the development of the tourism industry is found to exist. The development of the tourism industry not only exerts a direct negative influence on economic growth, but also adversely affects it in an indirect way through its influence over some transmission factors. Additionally, the curse effect on the environment imposed by the development of the tourism industry is also found to exist. The development of the tourism industry not only imposes a direct negative influence on the environment, but also adversely affects it in an indirect way through its influence over some transmission factors. (3) During the process of regional development, the relationship between the tourism industry, the economy and the environment needs to be correctly addressed. Through effective policies, it should be possible to realize the coordination of and sustainable development between the tourism industry, the economy and the environment.
1. Introduction
Tourism is a new industry that developed rapidly after World War II. It is increasingly developing, and has become one of the largest industries in the world [1]. Meanwhile, China’s tourism industry is developing at a high speed, and has become a brand new way of stimulating the country’s social and economic development. With rapid development, many consider that the tourism industry promotes economic growth, but damages the environment. However, whether in China or other countries, the relationship between the tourism industry, the economy and the environment is very complicated. For example, the tourism industry can promote economic growth and the environmental quality, but also might restrain them simultaneously [2]. Furthermore, the quality of the development of the tourism industry is closely related to cultural and environmental protection of tourist destinations [3].
The development of regional tourism industries is interactive with the economy and the environment. They develop together and combine mutual benefit and reciprocity. If any element is ignored, there will be errors and biases when we study the relationship between regional tourism industries, the economy and the environment. An important question is whether the relationship between the tourism industry, the economy and the environment mutually promote each other well. Therefore, the relationship between the two should be explored and tested deeply, which is the purpose of this study. The specific goal of this study is to integrate the tourism industry, the economy and the environment into a unified framework to analyze the relationship between the three by selecting their representative indices and using the Vector Auto Regression(VAR) coupling model and the econometric regression model.
In the present study, Qingyang City, Gansu Province is used as the case study area [4]. The VAR coupling model was established to study the coupling relationship between the tourism industry, the economy and the environment, and a quantitative analysis model was built to study the “curse effect” on the economy and the environment caused by the development of the tourism industry, as well as the mechanisms involved. Based on these analyses, relevant conclusions are drawn, with some countermeasures and suggestions proposed. Therefore, the present study compensates for some of the shortcomings of existing research, and thus has great theoretical and practical significance. This study could provide a reference for the further development of the regional tourism industry; offer a valuable reference for the design and development of any local government policy that aims to coordinate the relationship between the tourism industry, the economy and the environment; and promote their development in a sustainable manner.
2. Literature Review
Studies on the relationship between the development of the tourism industry and the economy and environment often start from two basic aspects: the relationship between the tourism industry and the economy, and the relationship between the tourism industry and the environment.
A large number of studies have investigated the relationship between the tourism industry and the economy from different perspectives. For instance, theoretical analyses and simple statistical analyses, such as the input–output model and the theory of tourism multipliers, have commonly been used to study such a relationship in the early stages of research into the connection between tourism and the economy. For example, by using 109 countries as case studies, Du et al. [5] found that the tourism industry played the most effective role in promoting long-term economic growth. Moreover, Mathieson [6] developed the theory of tourism multipliers to quantify the impact of the tourism industry on the economy. Based on the index of per capita gross domestic product (GDP) and the total number of tourists, Rizal and Asokan [7] discovered that the development of the tourism industry in Sikkim State of India could promote economic growth. More recently, relevant studies have mainly focused on testing the relationship between tourism and the economy by utilizing time series data or panel data, with the co-integration test and the Granger causality test representing some commonly used quantitative analysis methods. Balaguer and Cantavella-Jorda [8] first applied co-integration theory to the study of the relationship between the tourism industry and the economy, finding a long-term equilibrium relationship between the development of the former and regional economic growth in Spain. The Granger causality test further revealed that the development of the Spanish tourism industry promoted the country’s overall economic growth in a unidirectional way. By using data from between 1980 and 2013 in Kenya, Akama [9] found the local tourism industry could promote economic development. Overall, whether the studies are based on early qualitative theories and a simple statistical analysis, or on more recent sophisticated time series analysis, the main conclusions can be divided into three categories. The first category is that the development of the tourism industry promotes economic growth in a unidirectional way. Some supporting evidence is as follows. By using the input–output model, Khoshkhoo et al. [10] demonstrated that the tourism industry could promote local economic development in Iran. Additionally, based on panel data collected from 19 island countries between 1990 and 2007, Seetanah [11] found that the development of the tourism industry played a significant role in promoting economic growth. Furthermore, based on panel data collected from 34 Organization for Economic Cooperation and Development (OECD) countries between 1997 and 2012, Govdeli and Direkci [12] came to a similar conclusion. The second category of main conclusions is that the development of the tourism industry and economic growth could mutually facilitate each other with a bidirectional causal relationship. For example, Ongan and Demiroz [13] analyzed data collected between 1980 and 2004 in Turkey, and ascertained that there was a bidirectional causal relationship between the tourism industry and economic growth. Additionally, by using the Granger causality test, Roudi et al. [14] reached a similar conclusion for small island developing states. Furthermore, Besel and Uygun [15] also analyzed the relationship between economic growth and tourism development in Turkey by Fourier cointegration analysis and time varying causality analysis, and ascertained that there was a bidirectional causal relationship between them. The third category of main conclusions is that the development of the tourism industry does not promote economic growth in a unidirectional way. For instance, Arslanturk et al. [16] used the Vector Error Correction Model(VECM) to analyze data collected between 1963 and 2006 in Turkey, with the results showing that there was no Granger causality between tourism earnings and GDP, indicating that the assumption of tourism-led growth (TLG) is not always valid for each case study. Additionally, Kokotovic [17] analyzed the relationship between the tourism industry and economic growth in Croatia and the Czech Republic, and found that tourism would not promote economic growth in a unidirectional way. Moreover, based on data from between 1990 and 2015 of 10 top global tourism destinations, Shahbaz et al. [18] reached a similar conclusion.
The tourism industry is highly dependent on the environment, as the latter is its developmental basis. International research on the relationship between the tourism industry and the environment focuses on two major aspects, namely: the impact of the tourism industry on the environment, and the impact and consequence of environmental changes on the development of the tourism industry. Studies on the impact of the development of the tourism industry on the regional environment began in the 1930s, with a focus on the negative impact tourism activities had imposed on the ecological environment (e.g., Lutz [19]). Wall and Wright [20] first started to explore the mechanisms that might explain the impact of the tourism industry on the environment, and the work of authors such as Wall [21] led to wide debates about this issue. In the 1990s, Wackernagel [22] developed the ecological footprint evaluation method, which has been widely used to study the relationship between the tourism industry and the environment. In the 21st century, this field has been further expanded and deepened. Overall, there are two contrasting viewpoints. The first is that the development of the tourism industry imposes a negative impact on the environment. Most researchers reached similar conclusions. Stefanica [23] found that transportation in the tourism industry had the most serious impact on the environment. Additionally, Rizal and Asokan [24] discovered that the environmental impact of tourism is different for each region, and concluded that a detailed study on environmental impact assessment is needed for sustainable management and environmental protection. Furthermore, Stanciu et al. [25], using the Romanian Black Sea Coast as a case study, found that the tourism industry had a significant negative impact on sustainable development. Moreover, Jafari [26] studied the relationship between tourism and ecological protection and sustainable development in villages, and found that tourism had a positive impact on ecological protection and sustainable development in the early stage, but had a negative impact in the late stage. The second contrasting viewpoint is that the development of the tourism industry can have a positive impact, or negligible negative impact, on the environment, although the number of such studies is quite limited. A few studies supported this viewpoint. Gossling et al. [27] believed that the development of the tourism industry was highly likely to lead to an increase in water consumption, but pointed out that it was not the main cause. Additionally, Smith [28] felt that the development of the tourism industry had two contrasting impacts on the ecological environment; both negative and positive impacts could be found. Researchers are also beginning to test the impact of the ecological environment on the tourism industry. For example, Hein et al. [29] conducted an empirical study in Spain, and discovered that the climate and weather could, to some extent, affect the development of tourism activities. Additionally, taking South-East Asian countries as examples, Brahmasrene and Lee [30] discovered that the tourism industry could inhibit carbon emissions, and that ecotourism was effective. Furthermore, Chin et al. [31] studied the impact of the environment on the development of tourism in Malaysia, and found that a quality ecological environment would promote the competitiveness of rural tourism destinations effectively.
Chinese scholars began to study the relationship between the tourism industry and the economy relatively late, and their findings can be categorized as follows. Firstly, the tourism industry can promote the economy in a unidirectional way. For example, Zhang et al. [32] analyzed the relationship between tourism and economic growth in 11 cities in Shanxi Province, and found that tourism had a clear pulling effect on the economy. Secondly, the tourism industry and the economy can facilitate and promote each other in a bidirectional way. For example, based on data between 2000 and 2016, Chen and Gao [33] found that there was a long-term stable and coordinated relationship between the tourism industry and the economy in Guangxi Province, by using VAR and the Granger causality test model; however, the role of tourism in promoting economic growth was not as significant as the contribution of economic growth to the development of the tourism industry. Additionally, Sui and Liu [34] analyzed the relationship between the development of tourism and macroeconomic growth in China using a non-linear Markov switching causality (MSC) model, and found that there was bidirectional causality between the two. Moreover, Yang [35] found that there was a long-term and stable relationship between economic growth and the tourism industry based on data from Guilin from the past 10 years. The third category of findings are those that suggest the development of the tourism industry will not promote economic development. For example, based on data from between 2000 and 2015 for 11 cities in Zhejiang, Xu et al. [36] found that when tourism dependence reached a certain level, the negative externality of tourism became obvious, which was unfavorable to economic growth.
In the 1980s, Chinese scholars began to study the relationship between the development of the tourism industry and environmental quality. Specifically, they studied the impact of the development of the tourism industry on the ecological environment, as well as the impact of the ecological environment on the development of the tourism industry. For the former, consistent conclusions were drawn, which were similar to the findings of international experts, that the development of the tourism industry would damage the ecological environment. For instance, Fan and Yang [37] confirmed that the unreasonable use of tourism resources would cause serious damage to the local ecological environment. In contrast, studies on the impact of the environment on the tourism industry are quite limited. Some scholars have applied either the ecological footprint or environmental capacity method in this area. For example, Liu and Wang [38] used the ecological footprint theory and the ecological capacity theory to analyze the ecological capacity of tourism in the Nanji wetlands.
The relationship between the tourism industry, the economy and the environment in different countries and regions has become a widely discussed issue in the field of tourism research in recent years. Both international and domestic studies have expounded the relationship between the tourism industry and the economy, and the relationship between the tourism industry and the environment, from different perspectives. To date, research has made some important breakthroughs; however, problems and deficiencies still exist. Firstly, from the perspective of sustainable development, studies that establish a unified framework to systematically study the relationship between the tourism industry, the economy and the environment are still very limited. Secondly, studies that test the interactive relationship between the tourism industry, the economy and the environment, as well as the potential mechanisms involved, are lacking and inconclusive. Therefore, this study aims to address these shortcomings.
3. Materials and Methods
3.1. The study Area
Qingyang City is a provincial city in Gansu Province, which lies in eastern Gansu province, and the juncture of Shanxi, Gansu and Ningxia Provinces. It is located in the south-west of the Ordos Basin and the Loess Plateau Gullys Region of the middle reaches of the Yellow River. The total land area of the city is 27,119 km2. As of 2016, Qingyang City governs one district and seven counties, which are Xifeng District and Qingcheng, Huachi, Ning, Zhenyuan, Heshui, Zhengning and Huan County (Figure 1). The total population is 2.2419 million. Qingyang City is one of the most significant historical and cultural locations in western China, and has unique tourism resources and distinct regional characteristics. In 2016, the total number of domestic tourists in Qingyang City was 8.789 million, and the earnings from domestic tourism were 4.18 billion RMB [39].

Figure 1.
Administrative map of Qingyang City.
In 2016, the GDP of Qingyang City was 59.783 billion RMB, and the proportional contributions of three industries in the economic structure were 14.3%, 47.75% and 37.95%, respectively. Additionally, the environmental pressure of Qingyang City increases day by day due to an increase in environmental pollutant emissions in recent years, and to the relatively fragile ecological environment [40].
3.2. The Selection of Indices
Based on existing research results and the current situation of Qingyang City, indices have been selected and determined [9,41]. For the tourism industry indices, this study mainly drew from the research results of Feng et al. [42] and Xu et al. [43], and selected representative indices. For the economic indices, this study mainly drew from the research results of Xue et al. [44], Sun et al. [45] and Wang et al. [46], and selected representative indices; for the environmental indices, this study mainly drew from the research results of Xue et al. [47], Zhang et al. [48] and Zhou et al. [49], and selected representative indices. Specific indices are shown in Table 1. The studied period was from 1990 to 2017, with all index data collected from the Qingyang City Statistical Yearbook [50], the Qingyang City Environmental Quality Bulletin [51], China’s Tourism Statistical Yearbook [52], the Statistical Yearbook of Gansu Province [40], the Statistical Bulletin of National Economic and Social Development of Qingyang City [39], China’s Environment Statistical Yearbook [53] and data provided by the Department of Statistics, the Department of Tourism, the Department of Environmental Protection and other government sectors of Qingyang City and Gansu Province.

Table 1.
Definitions of the relevant indices.
3.3. The Vector Auto Regression(VAR)-Based Coupling Model
VAR models are non-structural models which combine multiple equations [54]. The function of endogenous variables is to regress all lagged values of endogenous variables in the system.
The typical structure of the VAR(p) model is:
where is a m-dimension vector of endogenous variables, is a d-dimension vector of exogenous variables, , …, and , …, is the parameter matrix with variables to be regressed, where endogenous variables have a p-order lag, and the exogenous variables have r-order lag, and represents the effects of random variation, without self-correlation within the same period.
A generalized impulse response function is applied to study the long-term dynamic relationship between the development of the tourism industry and economic growth, and the development of the tourism industry and environmental quality [55,56]. Many scholars have used this model to carry out related research [57,58]. The following equation is used for this purpose:
The impulse of causes the response function of as: . Herein, .
During the period t, the model quantifies the influence of the variation of the variable j when it increases by one unit (the variation for the other periods is a constant) on the variable i in period t + q. It can be seen from Equation (2) that the influence of the variation of the variable j on during the entire period can be calculated and totaled.
A variance decomposition analysis is used to further examine the dynamic characteristics of the model that is utilized in the present study. In order to determine the contribution of each variable to , the relative variance contribution rate (RVC) is calculated using the following equation:
where , is the standard deviation of the variable j. The larger the value of , the larger the influence of the variable j on the variable i, and vice versa. By using this method, the dynamic coupling relationship between the development of the tourism industry, the economy and the environment can be analyzed.
An impulse response curve between the two elements is shown. The horizontal axis shows the lag periods of the impact action, and the vertical axis represents the degree of impact imposed by one variable on the other. The solid line represents the impulse response function curve, which is the trajectory that shows how one variable affects another during the entire response period, and how the variation of one variable might affect another. In the figure, the upper and lower two dashed lines represent the deviation bands with confidence limits equal to twice the standard deviation, which reflect the degree of deviation. The range of selected lag periods of the present study is between 0 and 10. According to the principle of variance decomposition analysis, the mean standard error of per capita GDP, which is influenced by the development of the tourism industry factor, is decomposed into the contribution proportion of each individual variable related to the development of the tourism industry, and the relative importance of each variable, or its proportion contribution, is quantified. The results of the variance decomposition analysis are given in tables, which show the results of relative variance contribution between two elements.
3.4. The Econometric Model Based on the Curse Effect
Many scholars have used the econometric model to carry out related research [59,60,61,62].
3.4.1. The Development of the Tourism Industry and Economic Growth
The so-called Dutch Disease phenomenon of Corden and Neary [63] is utilized, and in particular the economic implications of the theory, with some modifications made to the basic regression equation of the Dutch Disease phenomenon model developed by Xu and Wang [64]. The modified econometric model is as follows:
where is the per capita GDP growth rate, is the proportion of domestic tourism earnings; is a vector set consisting of several new added control variables, t is the year, is a constant vector, and are the coefficient vectors and is the random variation. The coefficient vector reflects the extent and influence of the development of the tourism industry on economic growth. If is negative in a statistically significant manner, it suggests the existence of the curse effect in the study region. If its value is positive, it suggests the absence of the curse effect. The coefficient vector reflects the influence of other index variables on economic growth. The results of the econometric regression model, including regression coefficients and test parameters, are given in tables.
3.4.2. The Development of the Tourism Industry and Environmental Quality
The regression model is as follows:
where is the discharge of domestic garbage, is the growth rate of domestic tourism earnings, is a vector set consisting of several new added control variables, t is the year, is a constant vector, and are the coefficient vectors and is the random variation. The coefficient vector reflects the extent and influence of the development of the tourism industry on environmental quality. If is negative in a statistically significant manner, it suggests the absence of the curse effect in the study region. If its value is positive, it suggests the existence of the curse effect. The coefficient vector reflects the influence of other index variables on environmental quality. The results of the econometric regression model, including regression coefficients and test parameters, are given in tables.
4. Results and Discussion
4.1. The Coupling Relationship between the Tourism Industry, the Economy and the Environment
4.1.1. The Coupling Relationship between the Tourism Industry and the Economy
A generalized impulse response method was applied to study the impact and response between the two elements. In Figure 2, the horizontal axis shows the lag periods of the impact action and the vertical axis represents the degree of impact imposed by one variable on the other. The solid line represents the impulse response function curve, which is the trajectory that shows how one variable affects another during the entire response period, and how the variation of one variable might affect another. In Figure 2, the upper and lower two dashed lines represent the deviation bands with confidence limits equal to twice the standard deviation, which reflect the degree of deviation. The range of selected lag periods of the present study is between 0 and 10. According to the principle of variance decomposition analysis, the mean standard error of per capita GDP, which is influenced by the development of the tourism industry factor, was decomposed into the contribution proportion of each individual variable related to the development of the tourism industry, and the relative importance of each variable, or its proportional contribution, was quantified.
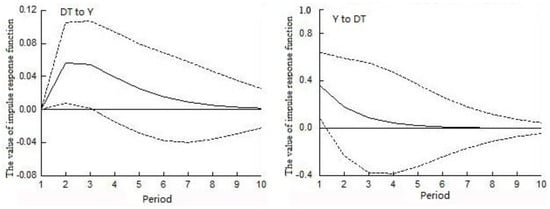
Figure 2.
Impulse response curves between domestic tourism earnings and economic growth. (a) Impact of domestic tourism earnings on per capita GDP. (b) Impact of per capita GDP on domestic tourism earnings.
When the impact of domestic tourism earnings on per capita GDP was studied, the current response value was positive. The maximum value occured in the second period, and decreased thereafter with a rapid and persistent declining trend. Throughout the entire response period, the overall impact of domestic tourism earnings on per capita GDP displays a declining trend, with a positive cumulative overall response value. This suggests that as the economy keeps growing, domestic tourism earnings also increase, although this positive influence exhibits a rapid declining trend. On the other hand, when the impact of per capita GDP on domestic tourism earnings was studied, the current response value of per capita GDP was positive. Throughout the entire response period, the overall impact of per capita GDP on domestic tourism earnings displays a continuous declining trend from the first to the tenth period, until it eventually comes close to zero. Although the cumulative overall response value was positive, it can be seen that the positive impact of domestic tourism earnings on economic growth was relatively weak, and keeps diminishing. Therefore, the development of the tourism industry fails to promote economic growth in a satisfactory way (Figure 2). The contribution rate of per capita GDP to domestic tourism earnings increased gradually, and the rate at the end of the period reaches 59.1%, suggesting that economic growth has played a positive role in promoting domestic tourism earnings (Table 2). In contrast, the contribution rate of domestic tourism earnings to per capita GDP decreased gradually, suggesting that the promoting effect imposed by domestic tourism earnings on economic growth decreases gradually. Therefore, our findings reveal a lack of a good coupling and facilitative relationship between domestic tourism earnings and economic growth. Instead, economic growth was found to effectively promote domestic tourism earnings, although the latter was found not to significantly promote the former.
Table 2.
Forecast variance decomposition of domestic tourism earnings (DT) and per capita GDP (Y).
When the impact of the number of domestic tourists on per capita GDP was studied, the current response value was zero. The minimum value occurred in the second period, and all other values fluctuated around zero but remained positive. The maximum value occurred in the ninth period. Throughout the entire response period, the cumulative overall response value was positive, suggesting that economic growth has increased the number of domestic tourists to some extent. When the impact of per capita GDP on the number of domestic tourists was studied, the response values in the first three periods are all positive. The current response value was also positive, and represents the maximum value. In contrast, the response values between the fourth and the tenth periods remain negative, with the minimum value occurring in the fifth period. Throughout the entire response period, the cumulative overall response value that quantifies the impact of per capita GDP on the number of domestic tourists was negative, suggesting that an increase in the number of domestic tourists imposes a negative impact on economic growth (Figure 3). The contribution rate of per capita GDP to the number of domestic tourists gradually increased throughout the entire response period, reaching 42.12% at the end of the period, suggesting that economic growth has played a positive role in promoting the number of domestic tourists (Table 3). The contribution rate of the number of domestic tourists to per capita GDP decreased from 5.26% to 1.71%, suggesting that the impact of the number of domestic tourists on economic growth gradually decreases, and there was a lack of a good coupling and facilitative relationship between the two. Thus, economic growth has effectively promoted the number of domestic tourists, although the latter has not significantly promoted the former.

Figure 3.
Impulse response curves between the number of domestic tourists and economic growth. (a) Impact of the number of domestic tourists on per capita GDP. (b) Impact of per capita GDP on the number of domestic tourists.
Table 3.
Forecast variance decomposition of number of domestic tourists (TR) and per capita GDP (Y).
When the impact of the number of travel agencies on per capita GDP was studied, the current response value was positive. Furthermore, the response values fluctuate around zero throughout the entire response period. The minimum value occurred in the third period, whereas the maximum value occurred in the tenth period. Throughout the entire response period, the cumulative overall response value that quantifies the impact of the number of travel agencies on per capita GDP was positive, suggesting that the number of travel agencies increases with economic growth. When the impact of per capita GDP on the number of travel agencies was studied, a fluctuating declining trend was found throughout the entire response period, with the minimum value found in the tenth period. Moreover, throughout the entire response period, the cumulative overall response value that quantifies the impact of per capita GDP on the number of travel agencies was negative, suggesting that the number of travel agencies has played a negative role in affecting economic growth (Figure 4). The contribution rate of per capita GDP to the number of travel agencies increased from 1.72% to 3.21%, whereas the contribution rate of the number of travel agencies to per capita GDP decreased from 0% to −504.3%, suggesting that economic growth has played an important role in promoting the number of travel agencies, but the latter has negatively affected the former (Table 4).
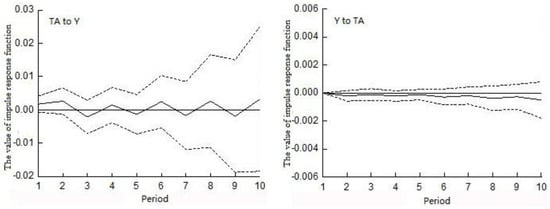
Figure 4.
Impulse response curves between the number of travel agencies and economic growth. (a) Impact of the number of travel agencies on per capita GDP. (b) Impact of per capita GDP on the number of travel agencies.
Table 4.
Forecast variance decomposition of number of travel agencies (TA) and per capita GDP (Y).
This study found that economic growth significantly promotes the tourism industry. However, the tourism industry does not promote economic growth. Other scholars also have carried out some relevant research and come to similar conclusions. For example, Shao et al. [65] found that economic growth could promote the tourism industry. However, the tourism industry has a weak side effect on economic growth in China. Additionally, based on 10 countries in transition, Ming [66] studied the relationship between the tourism industry and economic growth, and found that there were differences in different countries and the tourism industry did not promote economic growth in some countries. By contrast, some researchers have reached different conclusions to those of this paper. For instance, Shin et al. [67] found that in South Korea, the rural tourism industry could promote local economic growth. Similarly, Anansiriprapha and Wu [68] discovered that the development of the tourism industry could promote local economic development. Furthermore, some studies indicated that the development of the tourism industry and economic growth could mutually facilitate each other with a bidirectional causal relationship. The representative example is that Dogru and Bulut [69] found there is a bidirectional causal relationship between growth in tourism receipts and economic growth, based on 7 European countries.
4.1.2. The Coupling Relationship between the Tourism Industry and the Environment
When the impact of domestic tourism earnings on the discharge of domestic sewage was studied, the current response value was zero. Throughout the entire response period, all measured values are positive except for the negative value found in the second period. The overall trend keeps gradually increasing from the second period onwards, with the maximum value occurring at the end of the period. Furthermore, the cumulative overall response value was positive. Therefore, if the discharge of domestic sewage increases, domestic tourism earnings also increase, although the impact of the latter on the former was negligible. When the impact of the discharge of domestic sewage on domestic tourism earnings was studied, its response trajectory was found to be quite similar to that which reflects the impact of domestic tourism earnings on the discharge of domestic sewage. Throughout the entire response period, the only negative value was found in the second period, and from that point onwards the overall trend gradually increased. The maximum value occurred at the end of the period, and the cumulative overall response value was positive. Therefore, domestic tourism earnings have played an important role in promoting the discharge of domestic sewage, and have thus caused damage to environmental quality (Figure 5). The contribution rate of the discharge of domestic sewage to domestic tourism earnings increased from 0% to 1.83%, suggesting that the discharge of domestic sewage has promoted domestic tourism earnings, even though such a promotion effect was not very strong. In contrast, the contribution rate of domestic tourism earnings to the discharge of domestic sewage increased from 73.34% to 97.24%, indicating that domestic tourism earnings have played a significant role in promoting the discharge of domestic sewage, which also imposes a negative influence on environmental quality (Table 5).

Figure 5.
Impulse response curves between domestic tourism earnings and discharge of domestic sewage. (a) Impact of domestic tourism earnings on the discharge of domestic sewage. (b) Impact of the discharge of domestic sewage on domestic tourism earnings.
Table 5.
Forecast variance decomposition of domestic tourism earnings (DT) and discharge of domestic sewage (DS).
When the impact of domestic tourism earnings on the discharge of domestic garbage was studied, the current response value was zero. The response values fluctuate around zero throughout the entire response period, and the value at the end of the period is only 0.019. This suggests that as the discharge of domestic garbage keeps increasing, domestic tourism earnings to date have not increased significantly. When the impact of the discharge of domestic garbage on domestic tourism earnings was studied, the response trajectory maintained an increasing trend, with the maximum value occurring at the end of the period. The cumulative overall response value was positive. Therefore, domestic tourism earnings have played an important role in promoting the discharge of domestic garbage at the cost of increasing environmental pollution (Figure 6). The contribution rate of the discharge of domestic garbage to domestic tourism earnings decreased from 0.77% to 0.36%, suggesting that the discharge of domestic garbage has not played a significant role in promoting domestic tourism earnings. In contrast, the contribution rate of domestic tourism earnings to the discharge of domestic garbage increased from 47.36% to 98.33%, suggesting that domestic tourism earnings have played a significant role in promoting the discharge of domestic garbage, and thus have imposed a certain level of negative influence on environmental quality (Table 6).
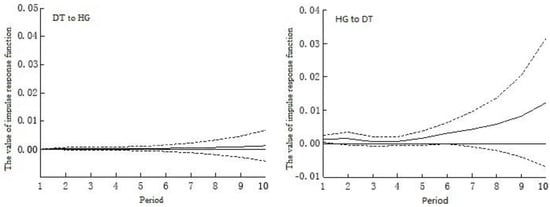
Figure 6.
Impulse response curves between domestic tourism earnings and discharge of domestic garbage. (a) Impact of domestic tourism earnings on the discharge of domestic garbage. (b) Impact of the discharge of domestic garbage on domestic tourism earnings.
Table 6.
Forecast variance decomposition of domestic tourism earnings (DT) and discharge of domestic garbage (HG).
When the impact of the number of domestic tourists on the discharge of domestic sewage was studied, the current response value was zero. The value is negative in the second period, and the impact response values throughout the entire response period are small, suggesting that the number of domestic tourists has not increased rapidly as the discharge of domestic sewage has increased. When the impact of the discharge of domestic sewage on the number of domestic tourists was studied, all values throughout the entire response period were found to be positive, and the response trajectory displayed a gradually increasing trend, with the maximum values occurring at the end of the period. Therefore, the number of domestic tourists is found to have played an important role in promoting the discharge of domestic sewage, causing environmental pollution problems (Figure 7). The contribution rate of the discharge of domestic sewage to the number of domestic tourists increased from 0% to 0.39%, suggesting that the discharge of domestic sewage has played a weak role in affecting the number of domestic tourists. In contrast, the contribution rate of the number of domestic tourists to the discharge of domestic sewage increased from 43.61% to 99.61%, reflecting the fact that the number of domestic tourists has played a significant role in promoting the discharge of domestic sewage, and thus has imposed a certain level of negative influence on environmental quality (Table 7).
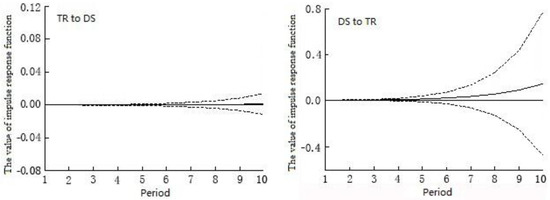
Figure 7.
Impulse response curves between the number of domestic tourists and discharge of domestic sewage. (a) Impact of the number of domestic tourists on the discharge of domestic sewage. (b) Impact of the discharge of domestic sewage on the number of domestic tourists.
Table 7.
Forecast variance decomposition of number of domestic tourists (TR) and discharge of domestic sewage (DS).
When the impact of the number of domestic tourists on the discharge of domestic garbage is studied, the response values fluctuate around zero throughout the entire response period with little deviation. This suggests that, as the discharge of domestic garbage keeps increasing, the number of domestic tourists to date has not increased significantly. In other words, the discharge of domestic garbage has played a relatively weak role in affecting the number of domestic tourists. When the impact of the discharge of domestic garbage on the number of domestic tourists is studied, all response values are positive throughout the entire response, and the response trajectory displays a gradual increasing trend, with the maximum value occurring at the end of the period. This suggests that the number of domestic tourists has played a significant role in promoting the discharge of domestic garbage at the cost of increasing environmental pollution (Figure 8). The contribution rate of the discharge of domestic garbage to the number of domestic tourists increased from 0% to 1.04%, suggesting that the discharge of domestic garbage has played a weak role in affecting the number of domestic tourists. In contrast, the contribution rate of the number of domestic tourists to the discharge of domestic garbage increased from 10.52% to 96.44%, suggesting that the number of domestic tourists has played a significant role in promoting the discharge of domestic garbage, and thus imposed a certain level of negative influence on environmental quality (Table 8).
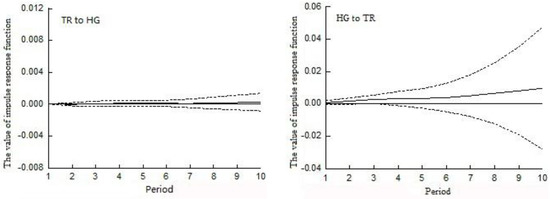
Figure 8.
Impulse response curves between the number of domestic tourists and discharge of domestic garbage. (a) Impact of the number of domestic tourists on the discharge of domestic garbage. (b) Impact of the discharge of domestic garbage on the number of domestic tourists.
Table 8.
Forecast variance decomposition of number of domestic tourists (TR) and discharge of domestic garbage (HG).
This study found that the tourism industry has a significant effect on the environment. However, the spread of environmental pollution does not promote the development of the tourism industry. Some scholars also have carried out relevant researches and made similar conclusions. For example, based on the impulse response curve and forecast variance decomposition, Cui [70] studied the relationship between the tourism industry and the environment in Lijiang River Basin. The results showed that the development of the tourism industry could cause destruction of the environment, and improvement of the tourism industry is needed. Additionally, For Turkey, Vita et al. [71] found that the tourist growth exerts a positive and significant impact on CO2 emissions in the long run. However, some researchers have reached different conclusions to those of this paper. The representative example is Zhang’s research. Zhang [72] took Hubei Province in China as an example and found that the development of the tourism industry could promote the awareness of local civilization, create a good image of the city, and then reduce the emissions of waste gas, waste water, and industrial solid waste.
4.2. The Curse Effect of the Development of the Tourism Industry and Its Transmission Mechanism
4.2.1. The Curse Effect of the Tourism Industry on the Regional Economy
The so-called curse effect of the tourism industry on the regional economy refers to the fact that the development of the tourism industry does not lead to rapid economic growth, but rather imposes a negative influence on the economy. In the language of econometrics, it is a test of the sign (i.e., positive or negative) of the TGR (proportion of domestic tourism earnings) variable coefficient, , of the established regression model. By adding different control variables and transmission mechanism variables, the results showed that the coefficient of the TGR variable is always negative with statistical significance, and the results obtained should be relatively stable (Table 9). Therefore, there is a significantly negative correlation between the development of the tourism industry and economic growth. In other words, the curse effect does exist, and studies that test this effect’s role in affecting the relationship between tourism and the economy deserve more attention.
Table 9.
The analytical results of the curse effect (on the economy).
During the process of tourism industry development, levels of influence on the economy can differ through alterations in the aspects of price levels, technology innovation, human capital and openness levels. The present study mainly focuses on several typical factors related to the transmission mechanism, including price levels (CPI), technology innovation (TP), human capital (EDU) and openness levels (OPEN). One important mechanism that explains the occurrence of the curse effect is the so-called Dutch Disease phenomenon. In other words, when the development of the tourism industry is related to non-tradable goods with high prices, it could adversely affect the manufacturing sector, resulting in the decline of other sectors, which would further affect economic growth. It can be seen from the regression results shown in Table 9 that during the development process of the tourism industry, the inhibitory impact imposed by a variable CPI on economic growth is relatively significant, suggesting that the development of the tourism industry is related to high price levels. As the development of the tourism industry promotes the prices of non-tradable goods, it could also slow down the development of the manufacturing sector and adversely affect economic growth. Therefore, the conclusion could be drawn that development of the tourism industry might also lead to the Dutch Disease phenomenon, and such an inhibitory effect is realized through the increasing prices of non-tradable goods. This is because during the development process of the tourism industry the increasing price of non-tradable goods would lead to the competitive outsourcing of the manufacturing sector, which is beneficial for long-term economic growth, and thus impose a negative influence over economic growth. This is probably associated with the regional industrial structure, which is heavily dependent on the manufacturing sector, and thus regional economic growth increases due to manufacturing. As the development of the tourism industry leads to the competitive outsourcing of some manufacturing organizations, the development of the manufacturing sector begins to reduce, which further negatively affects a region’s economic growth. Moreover, technology innovation, human capital and openness levels have imposed different levels of influence on regional economic growth. Specifically, the development of the tourism industry fails to promote technological innovation, and thus does not play an active role in promoting economic growth in this area. However, the development of the tourism industry does bring about a positive impact on human capital by enhancing its level. This process leads to the promotion of economic growth, albeit in a relatively weak manner. Additionally, the development of the tourism industry also fails to enhance the level of regional openness, and thus does not play an active role in promoting economic growth in this area. Therefore, it can be seen that the development of the tourism industry could have both positive and negative impacts on regional economic growth, and the negative feedback effect is far larger than that of the positive feedback effect. Consequently, the overall impact of the development of the tourism industry on a regional economy should be negative. In summary, the development of the tourism industry in the study region failed to promote economic growth effectively in a sustainable manner during the study period. Instead, the development of the tourism industry could constrain economic growth to a certain extent. In other words, the long-term curse effect on economic growth imposed by the development of the tourism industry does exist in the study region.
Other scholars also have carried out some relevant researches. The representative example is Sun’s research. Taking the nine provinces along the Silk Road economic belt as an example, Sun [73] found that the effect of the tourism industry on economic growth are not the same in different regions. For example, in Gansu Province, the development of the tourism industry could constrain economic growth obviously. Instead, a number of researchers carried out the similar test and made opposite conclusions. For example, based on the data of 188 cities between 2003 and 2013 in China, Cao and Guo [74] proposed that the development of the tourism industry could promote economic growth in most cities of China. Moreover, the development of the tourism industry can promote a higher level of fixed capital, human capital and openness to create a positive mediating effect on the economic growth. Furthermore, Veeck et al. [75] studied the economic contribution of agricultural tourism in Michigan, and found that the economic impact of agricultural tourism is significant and growing.
4.2.2. The Curse Effect of the Tourism Industry on the Regional Environment
The so-called curse effect of the tourism industry on the regional environment refers to the fact that the development of the tourism industry has led to the emission of environmental pollutants and increased environmental pressure, and has thus had a negative influence on the benign development of the environment. In the language of econometrics, it is a test of the sign (i.e., positive or negative) of the TRG variable coefficient, , of the established regression model. By adding different control and transmission mechanism variables, the results showed that the development of the tourism industry and environmental pollution are positively and significantly correlated (Table 10). Therefore, the development of the tourism industry in the study region does lead to the emission of environmental pollutants and increase environmental pressure. In other words, the development of the tourism industry has imposed a negative influence on the benign development of the environment, and the curse effect does exist. Studies that test the role of the curse effect in affecting the relationship between tourism and the environment deserve greater attention.
Table 10.
The analytical results of curse effect (on the environment).
Whilst the tourism industry is in the process of developing, it can impose different levels of influence on the environment by altering the aspects of human capital, technology innovation, marketability level, and environmental policy. The present study mainly focuses on several possible factors related to the transmission mechanism, including environmental policy (HB), technology innovation (TP), human capital (EDU) and marketability level (MKZ). After four possible transmission mechanism variables are added, the coefficient of the TRG variable is always positive, and the results obtained should be relatively stable. Therefore, the development of the tourism industry does lead to regional environmental pollution. Although an environmental improvement policy has some positive effects when the treatment of environmental pollutants is taken into account, and environmental quality could be improved to a certain extent, such effects are quite limited. Therefore, viewpoints that put too much emphasis on tourism output but neglect the protection of the ecological environment and overlook the overall planning process could lead to the accumulation of multiple contradictions and problems during the development process of the tourism industry. It can be seen from the regression results related to the aspects of technology innovation, human capital and marketability level that for all of these variables, the relevant coefficients are positive, and the coefficients that quantify the level of tourism industry development gradually increase. This suggests that all these factors have positively promoted the emission of environmental pollutants during the development process of the regional tourism industry and, therefore, have adversely affected regional environmental quality. Therefore, the development of the tourism industry in the study region could impose both positive and negative impacts on regional environmental quality, and the negative feedback effect is far larger than that of the positive feedback effect. Consequently, the overall impact of the development of the regional tourism industry on the regional environment should be negative. In summary, the development of the tourism industry in our study region failed to improve regional environmental quality effectively in a sustainable manner during the study period. Instead, the development of the tourism industry has imposed a negative influence on regional environmental quality. In other words, the long-term curse effect on the regional environment imposed by the development of the tourism industry does exist in the study region.
Some scholars also have carried out similar research. For example, Azam et al. [76] studied the impact of the tourism industry on the environmental pollution of three South-East Asian countries, and discovered that the tourism industry degrades the environment by augmenting environmental pollution in Malaysia. At the same time, it is found that the tourism industry improves the environment by reducing environmental pollution in Singapore and Thailand, which was different to this paper. Additionally, Thomas [77] made a serious effort to evaluate the challenges posed by the tourism industry on the environment, and discussed the various mitigation measures to reduce the negative impacts on the environment.
5. Conclusions
By utilizing a quantitative analysis method and relevant models, the present study uses Qingyang City, Gansu Province, as a case study, and tests the relationship between the development of the tourism industry, the economy and the environment in that region. The main conclusions are as follows:
A mutually promoting relationship does not exist between the development of the tourism industry and economic growth; instead, a unidirectional relationship is found between the two elements. Specifically, economic growth significantly increases the development of the tourism industry, although the latter fails to effectively promote the former as it has imposed a negative influence on economic growth. Similarly, a mutually promoting relationship does not exist between the development of the tourism industry and environmental quality; instead, a unidirectional relationship is found between the two elements. Specifically, the development of the tourism industry significantly increases environmental pollution by accelerating the emissions of environmental pollutants. However, as expected, the spread of environmental pollution has not significantly promoted the development of the tourism industry.
This study found that, in our study area, the development of the tourism industry fails to effectively stimulate and increase economic growth, and additionally that the curse effect on economic growth imposed by the development of the tourism industry does exist. The development of the tourism industry not only imposes a direct negative influence on economic growth, but also adversely affects it in an indirect way through its influence over some transmission factors such as price levels, technology innovation, human capital and openness levels. Furthermore, the development of the tourism industry fails to effectively improve environmental quality; instead, it promotes the emissions of environmental pollutants and exacerbates environmental pollution. Therefore, the curse effect on the environment imposed by the development of the tourism industry does exist. The development of the tourism industry not only imposes a direct negative influence on the environment, but also adversely affects it in an indirect way through its influence over some transmission factors such as environmental policy, human capital, technology innovation, and level of marketability.
During the process of regional development, the relationship between the tourism industry, the economy and the environment needs to be correctly addressed. By optimizing the industrial structure, improving the economic benefits of the tourism industry, stressing the importance of building a brand, expanding the tourism market, strengthening tourism education, encouraging personnel training, promoting technology innovation, forming intelligence support systems for tourism development, taking effective measures to promote environmental protection, and changing the manner of development in the tourism industry, it should be possible to realize the coordination of and sustainable development between the tourism industry, the economy and the environment.
Author Contributions
C.L. designed the study and wrote the paper. M.P. analyzed the data. J.Y. and D.W. contributed to data collection and processing. All authors read and approved the manuscript.
Funding
This research was funded by [National Natural Science Foundation of China] grant number [41561110], [41261112], [41771130]; by [Science and Research Program in colleges and universities of Gansu Province] grant number [2018F-05]; by [Science and Technology Support Program of Gansu Province] grant number [1304FKCA067].
Acknowledgments
Thanks for the anonymous reviewers and all the editors in the process of revision.
Conflicts of Interest
The authors declare no conflict of interest.
References
- World Travel and Tourism Council. Global Economic Impact & Issues 2018. Available online: https://www.wttc.org/economic-impact/country-analysis/ (accessed on 28 October 2018).
- Buckley, R. Tourism and Environment. Annu. Rev. Environ. Resour. 2011, 36, 397–416. [Google Scholar] [CrossRef]
- Wise, N. Outlining triple bottom line contexts in urban tourism regeneration. Cities 2016, 53, 30–34. [Google Scholar] [CrossRef]
- Lu, C.Y.; Wang, C.J.; Zhu, W.L.; Li, H.J.; Li, Y.J.; Lu, C.P. GIS-Based Synthetic Measurement of Sustainable Development in Loess Plateau Ecologically Fragile Area—Case of Qingyang, China. Sustainability 2015, 7, 1576–1594. [Google Scholar] [CrossRef]
- Du, D.; Lew, A.A.; Ng, P.T. Tourism and economic growth. J. Travel Res. 2016, 55, 454–464. [Google Scholar] [CrossRef]
- Mathieson, A.G. Tourism: Economic, Physical and Socialism Pacts; Longman: London, UK, 1982. [Google Scholar]
- Rizal, P.; Asokan, R. Measuring the Impact of Tourism Industry on Regional Economy of Sikkim State, India. J. Int. Acad. Res. Multidiscip. 2016, 1, 411–419. [Google Scholar]
- Balaguer, J.; Cantavella-Jorda, M. Tourism as a long-run economic growth factor: The Spanishcase. Appl. Econ. 2002, 34, 877–884. [Google Scholar] [CrossRef]
- Akama, E. International Tourism Receipts and Economic Growth in Kenya 1980–2013; Mpra Paper; University Library of Munich: Munich, Germany, 2016. [Google Scholar]
- Khoshkhoo, M.H.I.; Alizadeh, V.; Pratt, S. The Economic Contribution of Tourism in Iran: An Input–output Approach. Tour. Anal. 2017, 22, 435–441. [Google Scholar] [CrossRef]
- Seetanah, B. Assessing the dynamic economic impact of tourism for island economies. Ann. Tour. Res. 2011, 38, 291–308. [Google Scholar] [CrossRef]
- Govdeli, T.; Direkci, T.B. The Relationship between Tourism and Economic Growth: OECD Countries. Int. J. Acad. Res. Econ. Manag. Sci. 2017, 6, 104–113. [Google Scholar] [CrossRef]
- Ongan, S.; Demiroz, D.M. The Contribution of Tourism to the Long-run Turkish Economic Growth. J. Econ. 2005, 53, 880–894. [Google Scholar]
- Roudi, S.; Arasli, H.; Akadiri, S.S. New insights into an old issue—Examining the influence of tourism on economic growth: Evidence from selected small island developing states. Curr. Issues Tour. 2018, 4. [Google Scholar] [CrossRef]
- Besel, F.; Uygun, U. The Relationship Between Economic Growth and Tourism Income: The Case of Turkey. In Proceedings of the 3rd SCF International Conference on “Economic and Social Impacts of Globalization”, Antalya, Turkey, 5–7 October 2017. [Google Scholar]
- Arslanturk, Y.; Balcilar, M.; Ozdemir, Z.A. Time-varying linkages between tourism receipts and economic growth in a small open economy. Econ. Model. 2011, 28, 664–671. [Google Scholar] [CrossRef]
- Kokotovic, F. Analysis of A Maritime Versus A Land-Locked Tourism Dependent Economy: Croatia and The Czech Republic. UTMS J. Econ. 2017, 8, 319–328. [Google Scholar]
- Shahbaz, M.; Ferrer, R.; Shahzad, S.J.; Haouas, I. Is the tourism–economic growth nexus time-varying? Bootstrap rolling-window causality analysis for the top 10 tourist destinations. Mpra Pap. 2017. [Google Scholar] [CrossRef]
- Lutz, H.J. Soil condition of picnic grounds in public forest parks. J. For. 1945, 43, 121–127. [Google Scholar]
- Wall, G.; Wright, C. The Environmental Impact of Outdoor Recreation; University of Waterloo: Waterloo, ON, Canada, 1977. [Google Scholar]
- Wall, G. Canadian geographers discuss tourism. Ann. Tour. Res. 1979, 6, 367–368. [Google Scholar] [CrossRef]
- Wackernagel, M.; Rees, W.E. Our Ecological Footprint: Reducing Human Impact on the Earth. Popul. Environ. 1996, 1, 171–174. [Google Scholar]
- Stefanica, M. Environmental impact of transportation in the tourism industry—Dimensions and actions. Econ. Ed. 2017. [Google Scholar] [CrossRef]
- Rizal, P.; Asokan, R. Emerging Environmental Issues with the Development of Tourism Industry in India: A Study. Int. J. Dev. Res. 2016, 5, 995–999. [Google Scholar]
- Stanciu, A.C.; Dinu, R.N.; Popovici, N. Tourism-Environment Impact Relationship on the Romanian Black Sea Coast. Ovidius Univ. Ann. Econ. Sci. 2016, 16, 143–147. [Google Scholar]
- Jafari, M. Investigating the Role of Tourism in the Conservation and Sustainable Development of the Environment (with an emphasis on the geographic approach). J. Tour. Hosp. Sports 2017, 32, 51–63. [Google Scholar]
- Gossling, S.; Peeters, P.; Hall, C.M.; Ceron, J.P.; Dubois, G.; Lehmann, L.V.; Scott, D. Tourism and water use: Supply, demand, and security. An international review. Tour. Manag. 2012, 33, 1–15. [Google Scholar] [CrossRef]
- Smith, S. Regional analysis of tourism resources. Ann. Tour. Res. 1987, 14, 254–273. [Google Scholar] [CrossRef]
- Hein, L.; Metzger, M.J.; Moreno, A. Potential impacts of climate change on tourism; a case study for Spain. Curr. Opin. Environ. Sust. 2009, 1, 170–178. [Google Scholar] [CrossRef]
- Brahmasrene, T.; Lee, J.W. Assessing the dynamic impact of tourism, industrialization, urbanization, and globalization on growth and environment in Southeast Asia. Int. J. Sustain. Dev. World Ecol. 2017, 24, 362–371. [Google Scholar] [CrossRef]
- Chin, C.H.; Lo, M.C.; Nair, V.; Songan, P. Examining the Effects of Environmental Components on Tourism Destination Competitiveness: The Moderating Impact of Community Support. Asian Acad. Manag. J. 2016, 21, 75–104. [Google Scholar] [CrossRef]
- Zhang, J.H.; Feng, W.Y.; Zhao, P.Y.; Guo, X.D. An Empirical Study on Tourism’s Pulling Effects on Economy in Shanxi Province. Areal Res. Dev. 2017, 36, 115–119. (In Chinese) [Google Scholar]
- Chen, W.J.; Gao, X. Research on dynamic relationship between Tourism and Regional Economic Development based on VAR Model. Soc. Sci. Guangxi 2018, 2, 38–44. (In Chinese) [Google Scholar]
- Sui, J.L.; Liu, B.Y. Nonlinear Time-varying Causality between Tourism Development and Macroeconomic Growth in China: Based on Nonlinear Markov Switching Causality Model. Econ. Manag. J. 2017, 39, 24–41. (In Chinese) [Google Scholar]
- Yang, S.X. An empirical study on the relationship between tourism and regional economic growth: Based on the data from 1997 to 2016 in Guilin. China Circ. Econ. 2017, 14, 66–67. (In Chinese) [Google Scholar]
- Xu, C.H.; Ding, L.; Dong, H.A.; Su, P.D. On the Spatiotemporal Distribution Pattern and Impact Mechanism of the Relationship between Tourism Dependency and Economic Growth in Zhejiang Province. Tour. Sci. 2017, 31, 82–95. (In Chinese) [Google Scholar]
- Fan, S.J.; Yang, X.Y. A Study on the Impact of Tourism Resources Development on Ecological Environment. Rev. Fac. Ing. 2017, 32, 375–384. [Google Scholar]
- Liu, X.Y.; Wang, Z. Study on the Tourism Ecological Capacity Based on the Ecological Footprint Theory in Nanji Wetlands. J. Fujian For. Sci. Technol. 2016, 43, 105–109. (In Chinese) [Google Scholar]
- National Economic and Social Development Statistics Bulletin of Qingyang City in 2016. Available online: http://www.ahmhxc.com (accessed on 1 July 2018).
- Gansu Provincial Bureau of Statistics. Gansu Province Statistical Yearbook in 2017. Available online: http://www.gstj.gov.cn/ (accessed on 1 July 2018).
- Liao, K.C.; Yue, M.Y.; Sun, S.W.; Xue, H.B.; Liu, W.; Tsai, S.B.; Wang, J.T. An Evaluation of Coupling Coordination between Tourism and Finance. Sustainability 2018. [Google Scholar] [CrossRef]
- Feng, H.; Chen, X.; Heck, P.; Miao, H. An entropy-perspective study on the sustainable development potential of tourism destination ecosystem in Dunhuang, China. Sustainability 2014, 6, 8980–9006. [Google Scholar] [CrossRef]
- Xu, X.T.; Hu, J.; Liu, D.J. Evaluation and Spatial Variability of Provincial Tourism Competitiveness in China. Econ. Manag. 2015, 37, 126–135. (In Chinese) [Google Scholar]
- Xue, B.; Geng, Y.; Yang, M.; Yang, F.; Hu, X. Emergy-based study on eco-economic system of arid and semi-arid region: A case of Gansu province, China. J. Arid Land 2010, 2, 207–213. [Google Scholar]
- Sun, X.; Liu, X.S.; Li, F.; Tao, Y. Comprehensive evaluation of sustainable development for different scale cities in China. Acta Ecol. Sin. 2016, 17, 5590–5600. (In Chinese) [Google Scholar]
- Wang, L.L.; Yu, H.; Zhou, B. Coupling Coordinative Degree between Tourism Industry and Regional Economic Development in Zhejiang Province. Areal Res. Dev. 2017, 6, 87–92. (In Chinese) [Google Scholar]
- Xue, B.; Mitchell, B.; Geng, Y.; Ren, W.; Müller, K.; Ma, Z.; de Oliveira, J.A.; Fujita, T.; Tobias, M. A review on China’s pollutant emissions reduction assessment. Ecol. Indic. 2014, 38, 272–278. [Google Scholar] [CrossRef]
- Zhang, H.F.; Song, S.B.; Qu, W.E. Assessment for Nanjing’s Sustainable Development Capacity on Ecological Environment System Based on Entropy Change Perspective. Ecol. Econ. 2016, 6, 168–173. (In Chinese) [Google Scholar]
- Zhou, C.; Feng, X.G.; Tang, R. Analysis and Forecast of Coupling Coordination Development among the Regional Economy-Ecological Environment-Tourism Industry—A Case Study of Provinces Along the Yangtze Economic Zone. Econ. Geogr. 2016, 3, 186–193. (In Chinese) [Google Scholar]
- Qingyang City Bureau of Statistics. Qingyang Yearbook; China Statistics Press: Beijing, China, 2017. (In Chinese)
- Qingyang Environment Protection Bureau. Qingyang City Environmental Quality Bulletin. Available online: http://hbj.zgqingyang.gov.cn/ (accessed on 1 July 2018).
- National Tourism Administration of the People’s Republic of China. China’s Tourism Statistical Yearbook; China Travel and Tourism Press: Beijing, China, 2017. (In Chinese)
- National Bureau of Statistics; Ministry of Environment Protection. China’s Environment Statistical Yearbook; China Statistics Press: Beijing, China, 2017. (In Chinese)
- Sims, C.A. Macroeconomics and reality. Econometrica 1980, 48. [Google Scholar] [CrossRef]
- Xue, B.; Zhang, Z.L.; Guo, X.; Chen, X.; Geng, Y. A study on the coupling relationships between regional economic growth and environmental pressure: Case of Ningxia Autonomous Region. Ecol. Environ. Sci. 2010, 19, 1125–1131. (In Chinese) [Google Scholar]
- Gao, T.M. The Analysis Method of Econometrics and Modeling; Tsinghua University Press: Beijing, China, 2006. (In Chinese) [Google Scholar]
- Zhang, Z.L. Interactions between Resource Consumption, Environmental Pollution and Economic Development in Under-Developed: Area-Case of Central Gansu Province, China; Lanzhou University: Lanzhou, China, 2011. (In Chinese) [Google Scholar]
- Tang, C.F. An exploration of dynamic relationship between tourist arrivals, inflation, unemployment and crime rates in Malaysia. Int. J. Soc. Econ. 2010, 38, 50–69. [Google Scholar] [CrossRef]
- Elryah, Y. Injections into the Dutch Disease: Do IMF Packages and Foreign Aids Recover Sudan’s Economy? Soc. Sci. Electron. Publ. 2015, 1, 334–343. [Google Scholar]
- Gilberthorpe, E.; Papyrakis, E. The extractive industries and development: The resource curse at the micro, meso and macro levels. Extr. Ind. Soc. 2015, 2, 381–390. [Google Scholar] [CrossRef]
- Yang, M.; Yang, F.X.; Sun, C.W. Factor market distortion correction, resource reallocation and potential productivity gains: An empirical study on China’s heavy industry sector. Energy Econ. 2018, 69, 270–279. [Google Scholar] [CrossRef]
- Sun, D.; Lu, D.; Li, Y.; Zhou, L.; Zhang, M. Energy Abundance and China’s Economic Growth: 2000–2014. Chin. Geogr. Sci. 2017, 27, 673–683. [Google Scholar] [CrossRef]
- Corden, W.M.; Neary, J.P. Booming Sector and De-Industrialisation in a Small Open Economy. Econ. J. 1982, 92, 825–848. [Google Scholar] [CrossRef]
- Xu, K.N.; Wang, J. An Empirical Study of a Linkage Between Natural Resource Abundance and Economic Development. Econ. Res. J. 2006, 1, 78–89. (In Chinese) [Google Scholar]
- Shao, H.Q.; Zhou, T.T.; Wang, K. An empirical study of the tourism development, economic growth and carbon emissions based on VAR model. Tour. Res. 2017, 9, 51–59. (In Chinese) [Google Scholar]
- Ming, C.C. Does tourism development promote economic growth in transition countries? A panel data analysis. Econ. Model. 2013, 33, 226–232. [Google Scholar]
- Shin, H.J.; Kim, H.; Son, J.Y. Measuring the Economic Impact of Rural Tourism Membership on Local Economy: A Korean Case Study. Sustainability 2017, 9, 639. [Google Scholar] [CrossRef]
- Anansiriprapha, P.; Wu, X. Economic Factors on the Tourism Industry in Thailand. Available online: https://ssrn.com/abstract=2858937 (accessed on 28 October 2018).
- Dogru, T.; Bulut, U. Is tourism an engine for economic recovery? Theory and empirical evidence. Tour. Manag. 2018, 67, 425–434. [Google Scholar] [CrossRef]
- Cui, F.F. On the Interactive Relationship between Tourism and Ecological Environment in Lijiang River Basin; Guangxi Normal University: Guilin, China, 2013. (In Chinese) [Google Scholar]
- Vita, G.D.; Katircioglu, S.; Altinay, L.; Fethi, S.; Mercan, M. Revisiting the environmental Kuznets curve hypothesis in a tourism development context. Environ. Sci. Pollut. Res. 2015, 22, 1–12. [Google Scholar]
- Zhang, X.F. An Empirical Study on the Relationship of Tourism Economic Growth and Environmental Pollution in Hubei Province. J. EMCC 2018, 28, 19–22. (In Chinese) [Google Scholar]
- Sun, Y.Y. The contribution study of inbound tourism on economic growth based on regression model: Take the nine provinces along the Silk Road economic belt as an example. Tour. Res. 2016, 8, 58–62. (In Chinese) [Google Scholar]
- Cao, X.; Guo, L.P. Does the Development of Chinas Tourism Have Caused the Resource Curse Effect? Tour. Trib. 2017, 32, 14–25. (In Chinese) [Google Scholar]
- Veeck, G.; Lucius Hallett, I.V.; Che, D.; Veeck, A. The Economic Contributions of Agricultural Tourism in Michigan. Geogr. Rev. 2016, 106, 421–440. [Google Scholar] [CrossRef]
- Azam, M.; Mahmudulalam, M.; Hafeez, M.H. Effect of tourism on environmental pollution: Further evidence from Malaysia, Singapore and Thailand. J. Clean. Prod. 2018, 190, 330–338. [Google Scholar] [CrossRef]
- Thomas, A.E. Impact of Tourism on Environment: Responding to Global Challenges. Pauline J. Res. Stud. 2013, 1, 169–182. [Google Scholar]
© 2018 by the authors. Licensee MDPI, Basel, Switzerland. This article is an open access article distributed under the terms and conditions of the Creative Commons Attribution (CC BY) license (http://creativecommons.org/licenses/by/4.0/).