Article

Urban Mobility and Greenhouse Gas Emissions: Status, Public Policies, and Scenarios in a Developing Economy City, Natal, Brazil

by
André Luiz Lopes Toledo
1,2,* and
Emílio Lèbre La Rovere
2
1
Academic Directorate of Construction of Central Natal Campus, Federal Institute of Education, Science and Technology of Rio Grande do Norte, Natal 59015-000, Brazil
2
Energy Planning Program of Alberto Luiz Coimbra Institute for Graduate Studies and Engineering Research, Federal University of Rio de Janeiro, Rio de Janeiro 21941-909, Brazil
*
Author to whom correspondence should be addressed.
Sustainability 2018, 10(11), 3995; https://doi.org/10.3390/su10113995
Submission received: 21 August 2018 / Revised: 26 October 2018 / Accepted: 27 October 2018 / Published: 1 November 2018
(This article belongs to the Section Sustainable Transportation)

Abstract

:
This study aims to deepen the understanding of the role of the urban mobility sector in the current and future greenhouse gas (GHG) emissions of a middle-sized city of Brazil, which is also a developing economy. With the cross-reference between road and rail mobility data, governmental mobility planning, the Global Protocol for Community-Scale Greenhouse Gas Emission Inventories (GPC) of the Intergovernmental Panel on Climate Change (IPCC) emission quantification methodology, and the creation of scenarios for up to 10 subsequent years, it is possible to verify that individual motorized transport accounts for 60% of the total emissions from the urban transportation sector, with the largest amount of carbon dioxide equivalent (CO2eq) emissions per passenger among all of the forms of mobility. However, in the case of this study, government mobility planning, by not encouraging more energy-efficient transport and non-motorized modes, ends up aggravating GHG emissions in the scenarios considered for 2020 and 2025. In turn, the mitigation scenarios proposed herein integrate public transport and non-motorized transport solutions that would reduce the total of equivalent carbon dioxide (tCO2eq) by at least 45,000 tCO2eq per year by 2025. This cross-referencing of the environmental impact of government mobility policies can be replicated in other cities in developing countries that do not yet present municipal inventories or emission monitoring.

1. Introduction

The International Energy Agency (IEA) and Intergovernmental Panel on Climate Change (IPCC) [1,2] data and estimates report that the transport sector accounts for a significant share of worldwide energy consumption and greenhouse gas (GHG) emissions. Scenarios for later years indicate the sector as still strategically important in global GHG emissions. Several global initiatives seek to decarbonize the sector. However, according to the Paris Process on Mobility and Climate (PPMC) report during the Marrakech Partnership for Global Climate Action (MPGCA) initiative, many factors make green transport difficult, including lack of will and political awareness, tax incentives for fossil fuels, lack of access to financing, municipal governments with low autonomy, lack of financial and human resources, lack of prioritization of urban mobility in public investments, and lack of data from the sector.
Following the strong urban growth of this region, the transport sector in Latin America contributes 35% of GHG emissions, which is higher than other regions worldwide, with the highest emission rate growth among all of the sectors of the economy and with the greatest difficulties in implementing GHG emission reductions [3,4,5,6]. GHG emissions from this sector are mostly from the road segment, reaching up to 92% of contributions [3]. Comparing, for example, with South Asia, another developing region that is climatically vulnerable and experiencing a strong urbanization process [7,8], the transport sector, which accounted for 27% of total emissions in 2005, should reduce its share in 2030 to 19%, due to the intense increase in emissions from electricity generation, from 30% to 46.6% of total emissions [9]. The GHG Emissions Inventory, which reveals the current state of emission levels and their sources, is the first step in analyzing city emissions, using a predetermined systematic method [10].
In order to contribute to an adequate direction of urban development, the Brazilian Federal Government promulgated Law 12587/12, which establishes the National Urban Mobility Policy (PNMU), and is in compliance with the constitutional determination that the Union must establish guidelines for urban development. The PNMU also establishes that Brazilian municipalities with over 20,000 inhabitants should develop Urban Mobility Plans (PlanMob). The Urban Mobility Plan is a technical document that defines the goals and guides the actions that should be adopted by the municipality in the following years, aiming at urban mobility improvement. It is also the instrument for implementing the National Urban Mobility Policy, aiming at integrating the different modes of transport and improving the accessibility and mobility of both people and cargo in the municipality territory. It should present an analysis of the urban mobility system in accordance with the principles of universal accessibility, fair access to public transport, the use of public spaces for circulation, and the sustainable development of cities, as well as planning for short, medium, and long-term actions. This document should include collective public transport services, road traffic, urban mobility system infrastructures, accessibility for people with disabilities and mobility restrictions, among other mobility aspects, aiming at quality of life gains [11,12].
Despite the important role of cities in controlling and mitigating GHG emissions [13], urban mobility planning may depart from national commitments of several countries, especially in cities located in developing countries, due to investment and staff constraints [
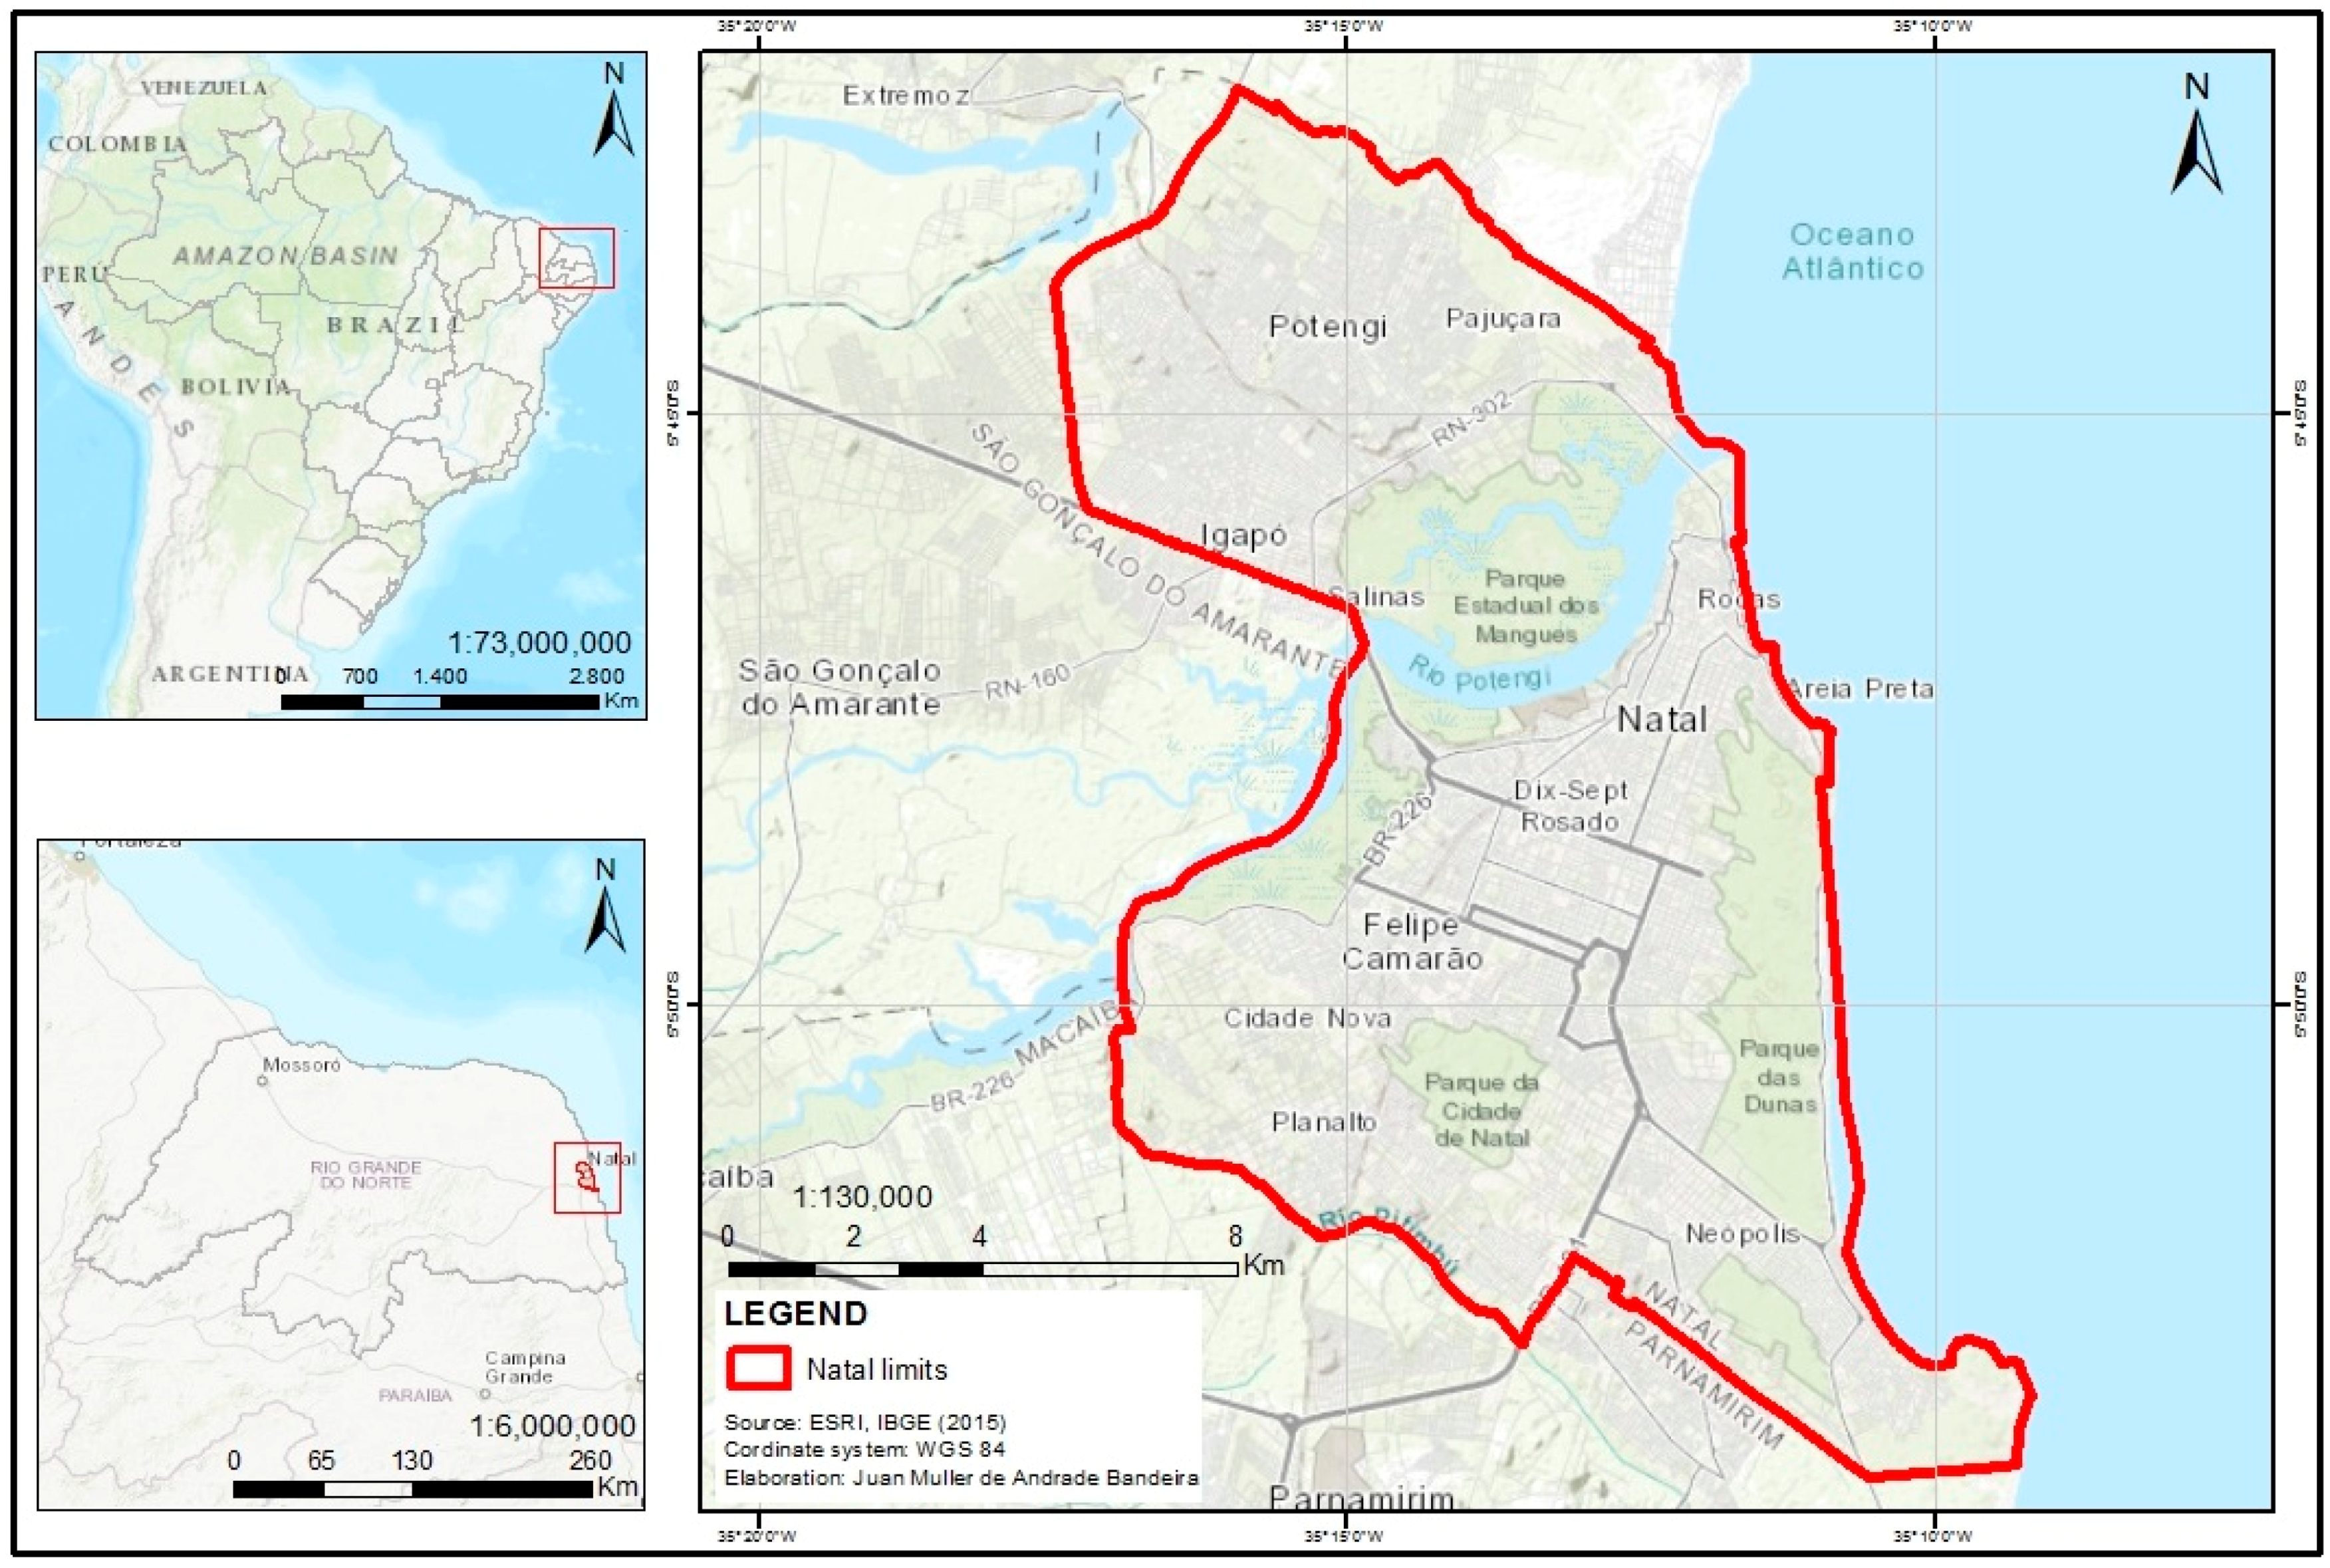
14], hindering the quantification and consequent mitigation of their emissions. The mid-sized Brazilian city of Natal, which is the capital of the state of Rio Grande do Norte, has an estimated population of 885,180 inhabitants distributed throughout a 167,264 km2 area. Natal is the largest city in a metropolitan region in Brazil, comprising 14 municipalities and 1,577,072 inhabitants [15]. The service sector accounts for 63.6% of its gross domestic product (GDP), followed by the industrial sector, with 16.5%, and agricultural activities contributing with less than 0.1% [15]. Natal’s occupation and development characteristics are similar to other medium-sized cities in Brazil and Latin America, suffering a strong economic and disordered population growth in the last decades of the 20th century [16].
Concerning the transport sector, this growth was reflected in an increase in motorization rates, especially those of the private vehicle fleet, causing congestions, pollution, and traffic accidents. This motorization rate was further aggravated by the poor quality of the local public transport, the dispersed occupation pattern of suburban regions [17,18], public incentives for the automotive industry, and subsidies for fossil fuels [19,20,21,22].
The present study analyzes emissions from Natal’s urban transport sector that do not yet have a GHG Emissions Inventory.
Even though this is a case study, not many studies on emissions have been carried out in Brazil and, especially in cities. This is particularly relevant since, as previously reported, a federal law requires cities with over 20,000 inhabitants to prepare an urban mobility plan. The significance of this study is to contribute to the literature on GHG transport and emissions, aiming to understand the main emitters in the urban sector, and providing data for public policy makers and committee members to elaborate Urban Mobility Plans concerning the impacts of not prioritizing non-motorized public and modal modes of transport in their planning.

2. Literature Review

The relationships between urban planning, public policies, urban mobility planning, GHG emissions, and emission scenarios have been addressed by several authors, but not simultaneously and in an applied way as in the present study. The work by Silva [23] analyzed the traffic-oriented development applied to a small city and the consequent reduction of GHG emissions. Jain and Tiwari [24] analyzed mobility emission scenarios with bus and cycleway insertions. Lee and Lim [25] analyzed compact cities with lower demands for mobility. Franzitta et al. [26] analyzed the insertion of hydrogen-driven public transport in emissions in a case study. Hukkalainen et al. [27] analyzed a methodology to evaluate the impact of urban planning in a case of small urban agglomerations, in terms of energy and emissions, including transportation planning. Madlener and Sunak [28] developed the relationships between urbanization and energy consumption, citing learned lessons that can compose sustainable public policies. Shekarrizfard et al. [29] established a model for the quantification of emissions linked to transport in an urban area case. Fenton [30] carried out an analysis of reasons that led to the success of a city considered a reference in sustainable transport. Kwan and Hashim [31] carried out a review on the co-benefits generated by public transportation. Muneer et al. [32] conducted a case study of GHG emissions in the transportation of a small city, including a scenario of electric vehicle insertion. Dhakap and Schipper [17] carried out extensive and important descriptive analyses of transport and emissions in Asian developing cities, relating the co-benefits and synergies that can be proven and quantified in several aspects in the present study, reinforcing their conclusions. This study also proposes, within the reported mitigation scenarios, a more efficient and less energy-wasteful public transport, mitigating traffic and promoting equity access to urban mobility, as proposed by Pupim de Oliveira et al. [33] and Doll and Puppim de Oliveira [34], focusing on meeting urgent demands and generating environmental and social co-benefits that can also be measured [35]. Tan et al. [36], after an in-depth analysis of urban transport systems and their energy sources, created public policy proposals that display potential for the effective mitigation of GHG emissions. The case studies by Wang et al. [37], Kim et al. [38], and Alonso et al. [39] related changes in land use with impacts on travel generation, consequently impacting emissions.
The Global Protocol for Community-Scale Greenhouse Gas Emission Inventories (GPC) methodology was created by the International Council for Local Environmental Initiatives (ICLEI) in partnership with the World Resources Institute (WRI) and the Climate Leadership Group (C40) in 2014, based on the 2006 National GHG Inventory Guidelines published by the IPCC. It aims to be a robust and clear methodology, allowing for the generation of reliable and comparable inventories. The adoption of this methodology by several cities globally will allow the correct direction of sustainable development and emission mitigation action planning. The emissions of all of the GHGs are converted to total of equivalent carbon dioxide (CO2eq) emissions from the Global Warming Potential (GWP) values that are specific to each gas. The GWPs show the global warming potential of each gas measured in values established from IPCC studies, and are essential for comparisons between gases and CO2 [10,40].
The baseline approach for applying the GPC/IPCC methodology is the top–down approach, which uses fossil fuel supply (consumption) data to calculate CO2 emissions from its combustion. However, in order to analyze a specific sector with data availability, it is possible to carry out the bottom–up, or sectorial, approach that considers—in the case of mobile combustion—the mileage and fuel consumption data of vehicles [41].
This methodology seeks to standardize city emission quantification, subsidizing the reach of the Paris Agreement targets (2015). The study carried out by Mengel et al. [42] pointed out that maintaining the temperature below 2 °C, which is the goal of the Paris Agreement, is insufficient to prevent a 1.5 m rise in sea level by 2300, underscoring the importance of more intense short-term actions to reduce emissions. Ari and Sari [43] developed indicators to facilitate the fair accountability of countries regarding GHG emissions, considering environmental, social, economic, and technical factors, suggesting a revision of the current responsibility criteria of the Paris Agreement. Obersteiter et al. [44] concluded on the risk of the Paris Agreement assigning carbon dioxide removal (CDR) technologies to the main mitigations to be achieved in the second half of this century, given their uncertainty regarding implementation feasibility.
The latest IPCC Special Report, Global Warming of 1.5 °C, highlights the mitigation of environmental, social, and economic damage by setting a target of 1.5 °C against the 2 °C target established in the Paris Agreement. This report also points out that heating impacts on natural and human systems are already being observed due to an increase of about 1 °C compared to pre-industrial temperatures. The propensity of occurrence of extreme climate phenomena is greater when comparing the 2 °C heating with that of 1.5 °C. Similarly, impacts on sea level rises and coastal communities, impacts on biodiversity and ecosystems, risks to human health, food security, water supply, and economic growth are highest. However, to reach the target of 1.5 °C, more intensive decarbonization measures are required, including in the transport sector [45].

3. Data and Methods

3.1. Data Source

This study was carried out taking as an example the city of Natal (GPS coordinates: −5°47′42.00′′ S, −35°12′33.98′′ W), the capital of the state of Rio Grande do Norte, which is located in the northeast of Brazil (Figure 1).
The data for elaboration of this study were obtained from public data, accessed as follows:
  • Public available data: obtained from the PlanMob for the municipality of Natal [46], comprising information on public (composition, fleet age, and traveled annual mileage) and private (traffic count and Origin–Destination research) transports in the municipality, as well as fuel sales reports issued by Brazilian National Petroleum Agency (ANP) [47] and the annual fleet report by State Department of Transit of Rio Grande do Norte (DETRAN/RN) [48].
  • Public data obtained on request: natural gas sales data from Natal’s gas distributor, Potigás [49], Brazilian Company of Urban Trains (CBTU) railway diesel consumption data [50], traffic-counting data obtained from the time Natal’s PlanMob was developed, and data related to intermunicipal road transport under the Rio Grande do Norte Road and Roadwork Department (DER/RN) responsibility [51].
The data obtained for the sub-sectors all refer to 2015, which makes up the base year of this study, due to the available public data and being the reference year for PlanMob traffic and counting studies in the municipality of Natal.

3.2. Methodology of GHG Emissions Inventory

After the collection of both available and requested public data, the Global Protocol for Community-Scale Greenhouse Gas Emission Inventories (GPC) methodology was adopted, based on the methodology applied by the Intergovernmental Panel on Climate Changes (IPCC), which was used to calculate the municipal inventory of urban transport emissions between 2012–2015 [10,40].
The data were cross-checked with the city’s PlanMob [46], as well as with the Brazilian Company of Urban Trains (CBTU) [52] and the Department of Roads and Roadways (DER/RN) data, in order to understand the role of the following sub-sectors: municipal and intermunicipal urban public transport, freight and urban services, urban trains, and individual motorized transportation. Based on fuel sales data in the municipality, the total emissions of the urban transport sector were calculated using a top–down methodology [40] from 2012 to 2015, where CO2 emissions are estimated from fossil fuel consumption. The municipality does not present detailed fleet data and updated mileage allowing for the quantification of total fleet emissions, via a bottom–up methodology. This method would require a greater availability of disaggregated information (traveled distances, fuel consumption efficiency, vehicle occupancy rates, and number of trips, among others) for the estimation of total GHG emissions. This problem is similar to that of other medium-sized Latin American cities: less personal and institutional resources to control their economic sector emissions [3]. This detailing was carried out only for the urban public transport sector, with data obtained from PlanMob. The freight and urban services sector were also partially quantified through PlanMob, although with 2007 data. This particularity will be discussed ahead. The total quantification for the other sub-sectors followed the top–down method.
The fuel consumption data provided by the CBTU allowed for the calculation of rail transport emission impacts, applying the top–down method. For the road transport, the PlanMob data on individual transport allowed for travel quantification for this sector, but total GHG emissions were calculated by subtracting the total urban transport emissions from the public sub-sectors and diesel users and services, since diesel passenger cars are not manufactured in Brazil (and their use includes a federal tax benefit with the intention of reducing freight charges). However, although diesel is allowed only in commercial vehicles, occasional misrepresentations concerning vehicle classifications enable the use of vehicles classified as light commercial vehicles as individual motorized transportation. The DER/RN data allowed for the bottom–up quantification of intermunicipal transport (Table A1). The sub-sectors of this methodology are synthesized in Figure 2. The adopted methodology is considered adequate, as it allows for the quantification of total urban transport GHG emissions in the reference city, as well as a deeper understanding of the impact of each transport mode concerning emissions, according to available data, and meets the objective of the research. The hypothesis was adopted regarding the equivalence between results obtained by the top–down and bottom–up methodologies, since international practices register small differences between CO2 emission estimations by these methods.

3.3. Methodology of Scenarios

Subsequently, using the GPC/IPCC methodology, the impact of the PlanMob planning regarding GHG emissions was analyzed, calculating scenarios for 2020 and 2025, according to the PlanMob forecast of increased urban transport fuel consumption [53]. Mitigation scenarios are then presented, comprising public policy proposals to strengthen public transportation over the private sector, which was diagnosed as the main responsible factor for increasing emissions in the two scenarios that use PlanMob data.
PlanMob presents fuel consumption scenarios for the city for 2020 and 2025. This study calculates the total CO2 emissions of these PlanMob scenarios, following the same methodology as in [40], naming the scenarios CPMob1 and CPMob2. These scenarios will provide data for the proposal of a further two scenarios focused on reducing GHG emissions, the CM1 and CM2 mitigation scenarios. CM1 presents an effort to direct public urban mobility policies for the reduction of GHG emissions, which is an aspect that is not addressed in PlanMob. The additional mitigation scenario CM2 is more ambitious, considering more impacting or more intense actions than those adopted in CM1. The elaboration of these scenarios involves a literature review of the solutions applicable to the reference city.

4. Calculations

This section details how GHG emissions in CO2eq, were calculated using data from the various urban transport sectors. Although all of the data were subjected to the same GPC/IPCC methodology explained in Section 3, this section allows for the subsequent replication of the calculations for other cities, according to locally available data.

4.1. Inventory of Urban Transport Emissions and Urban Mobility Plan

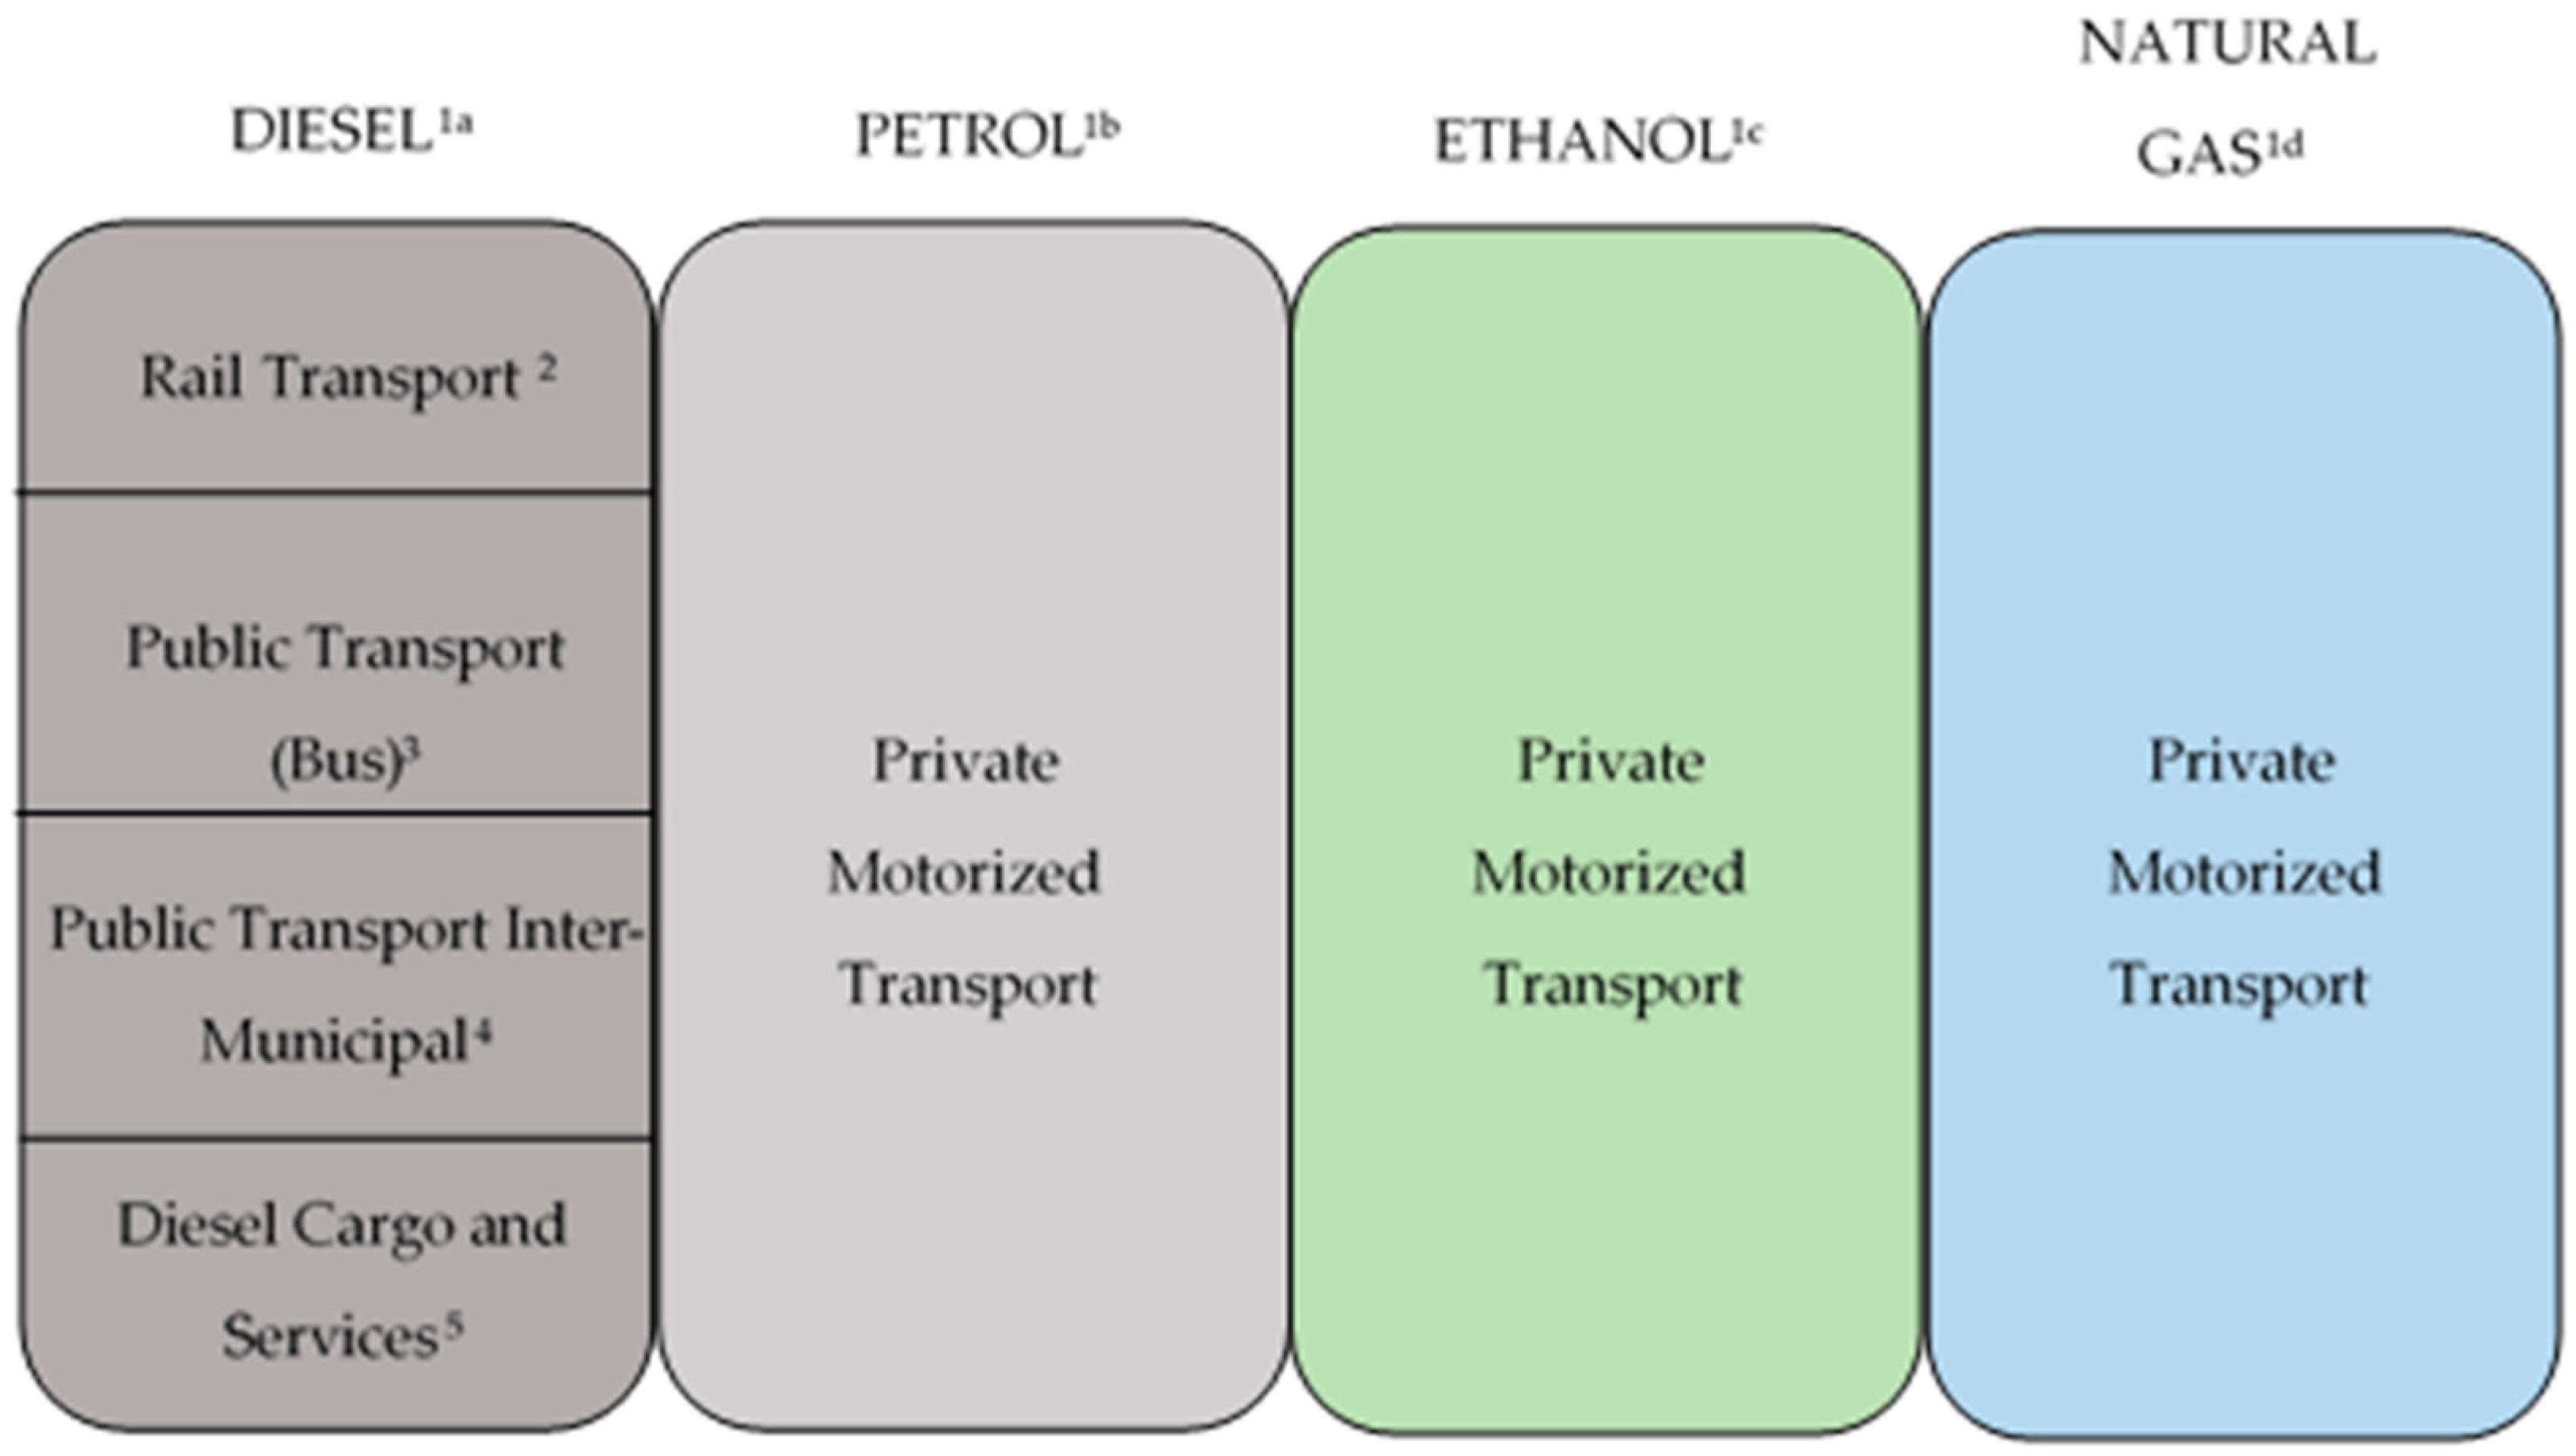
In this study, the emissions of GHG of Scope 1 of Natal’s transportation sector were analyzed, adopting the Tier 2, and applying the national emission factors [54] of this category.
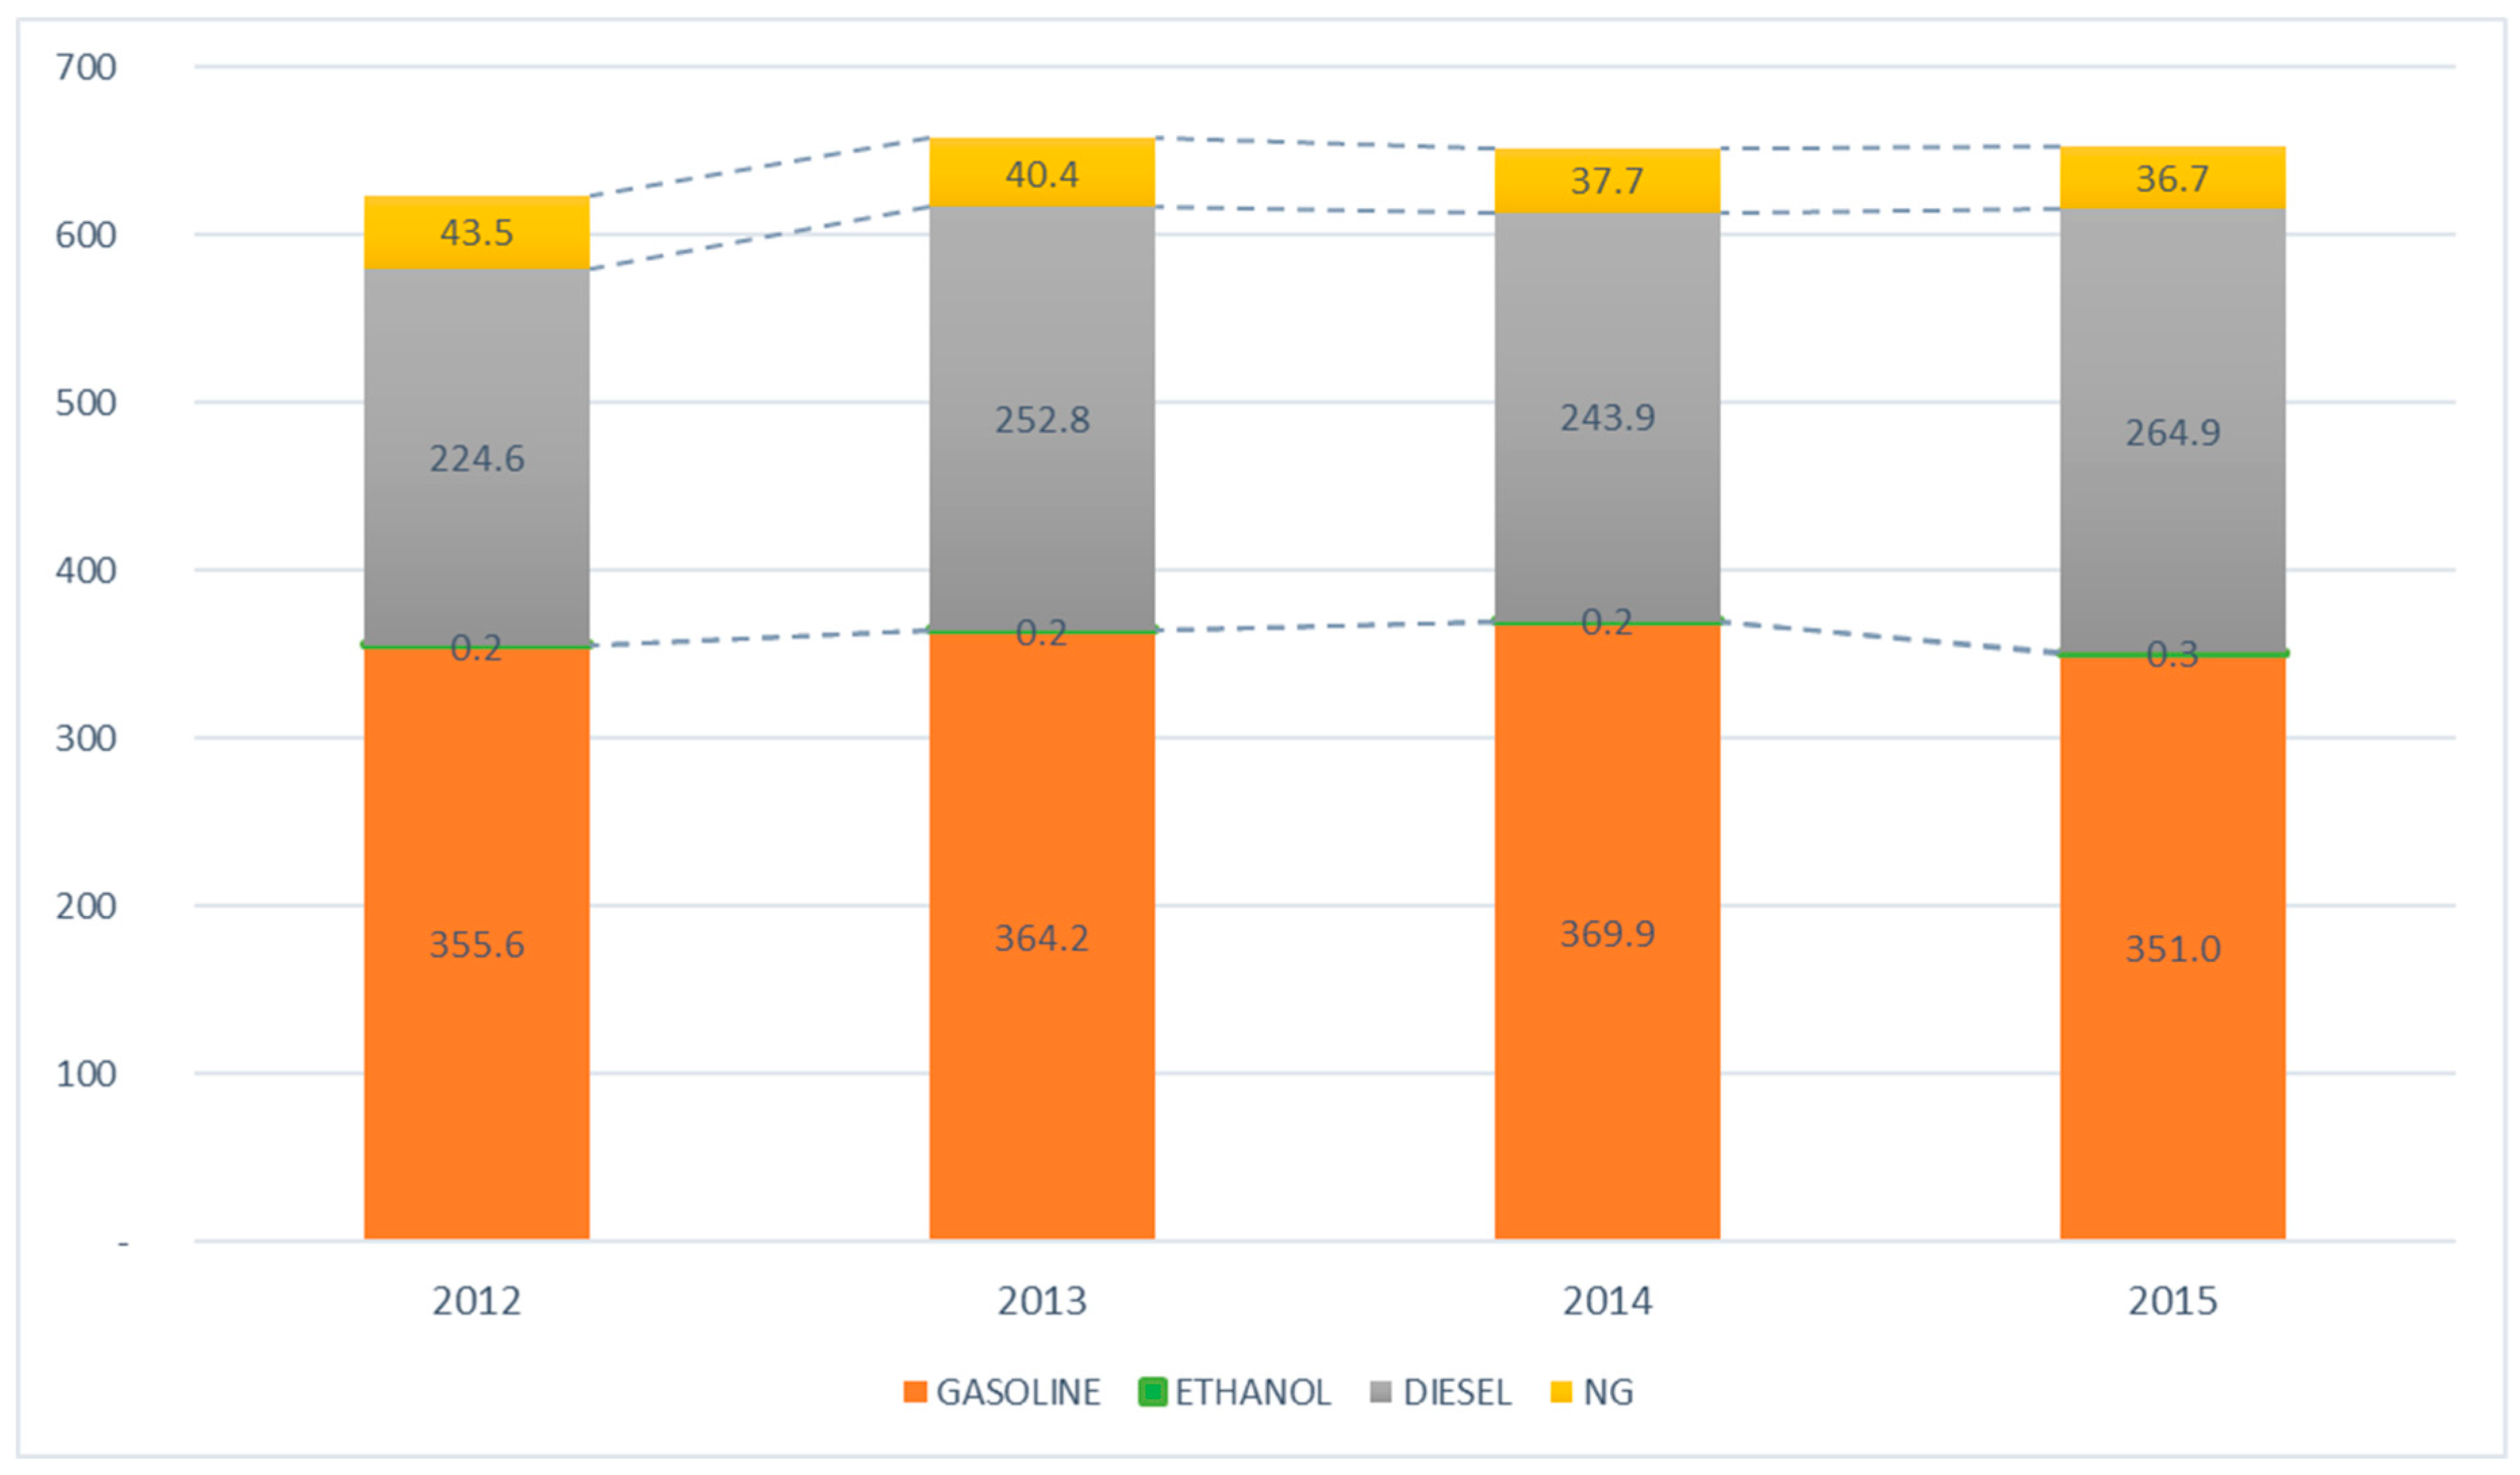
Total transportation fuel sales are displayed in Table 1, according to the obtained data. These data allow for the calculation of total greenhouse gas emissions in CO2eq of Natal’s urban transport sector, according to the aforementioned GCP/IPCC methodology.
The calculation bases of the public urban road transport granted to the private initiative, as displayed in Table 2, came from PlanMob, which indicates the traveled kilometers and the existing typology of the vehicles. According to PlanMob, there was no change in the lines and kilometers of this sub-sector between 2012–2015.
The data used to calculate emissions from intercity transport are presented in Annex 1, which lists the nomenclature of intercity lines with origin or destination in the municipality of reference. According to the Origin–Destination (O–D) matrix reported in PlanMob, the municipality of Natal concentrated 80% of the motivations of metropolitan interurban journeys. This percentage was adopted to adjust the emissions of this sector, accounting for the municipality that generates travel.
In addition to the road systems, a 56.2-km system exists in the rail mode for passengers only, operated in a simple way, with diesel-powered equipment. This system makes internal connections in the municipality, as well as intermunicipal connections in the metropolitan region of Natal. No Origin–Destination search data was found for this system, but it shows little participation in the city’s transport network, and it is the municipality of Natal that concentrates the displacement demands and the billing. The emissions for this system were calculated conservatively in the reference municipality (Table 3).
There is little current relevant data for municipal freight transport in PlanMob. The data available are from 2007, which is from an Origin–Destination survey carried out in the municipality [55]. No updates to this data in PlanMob 2017 were carried out. According to the 2007 O–D survey, 35,226 truck trips are carried out daily, of which 13,073 were internal, 6901 originated in the municipality, and 6601 had the municipality as their destination. This 2007 data was used for a bottom–up estimation of fuel consumption [40], considering a mean fleet age of five years [48], heavy diesel trucks for intermunicipal transportation, medium-sized diesel trucks for internal transport, and a transport distance corresponding to the approximate extension of the municipality, at its largest dimension of 25 km for internal transportation, and half of this value, 13 km, for intermunicipal transportation. This estimate was compared to diesel sales in the municipality in 2007 in order to quantify the weight of this sector for the same year (Table 4). Due to the precariousness of the data update, the cargo sector was joined to other urban public service sectors that use diesel vehicles, such as private bus transportation and leased minivans (transfers), public maintenance services, garbage collection, and school transportation.

4.2. GHG Emission Scenarios

PlanMob presents urban mobility scenarios for 2020 and 2025, according to a specific methodology to this planning that takes into account GDP evolution, population growth, and increases in the current fleet. The analysis of the methodology applied by the municipal government in the elaboration of PlanMob is not within the scope of this study. However, according to the cited bibliography [46], primary data were obtained through Classified Volumetric Counting (CVC), documentary, and secondary data and filming cameras, and technical meetings, and public hearings were held. We also developed models for population income growth and used the Aimsum software to simulate traffic and elaborate our own scenarios. In these scenarios, a percentage increase of fuel consumption is observed due to the degradation of the level of traffic. The business as usual, or reference, scenario does not indicate works or changes in the road system. In addition to the reference scenario, PlanMob presents a list of 41 non-structural works that, if implemented, would generate a slight benefit in relation to the initial scenario. This scenario predicts an increase in fuel consumption that is lower than the baseline scenario. The impacts on fuel consumption are displayed in Table 5. Increases in individual motorized trips for 2020 and 2025 are listed in 
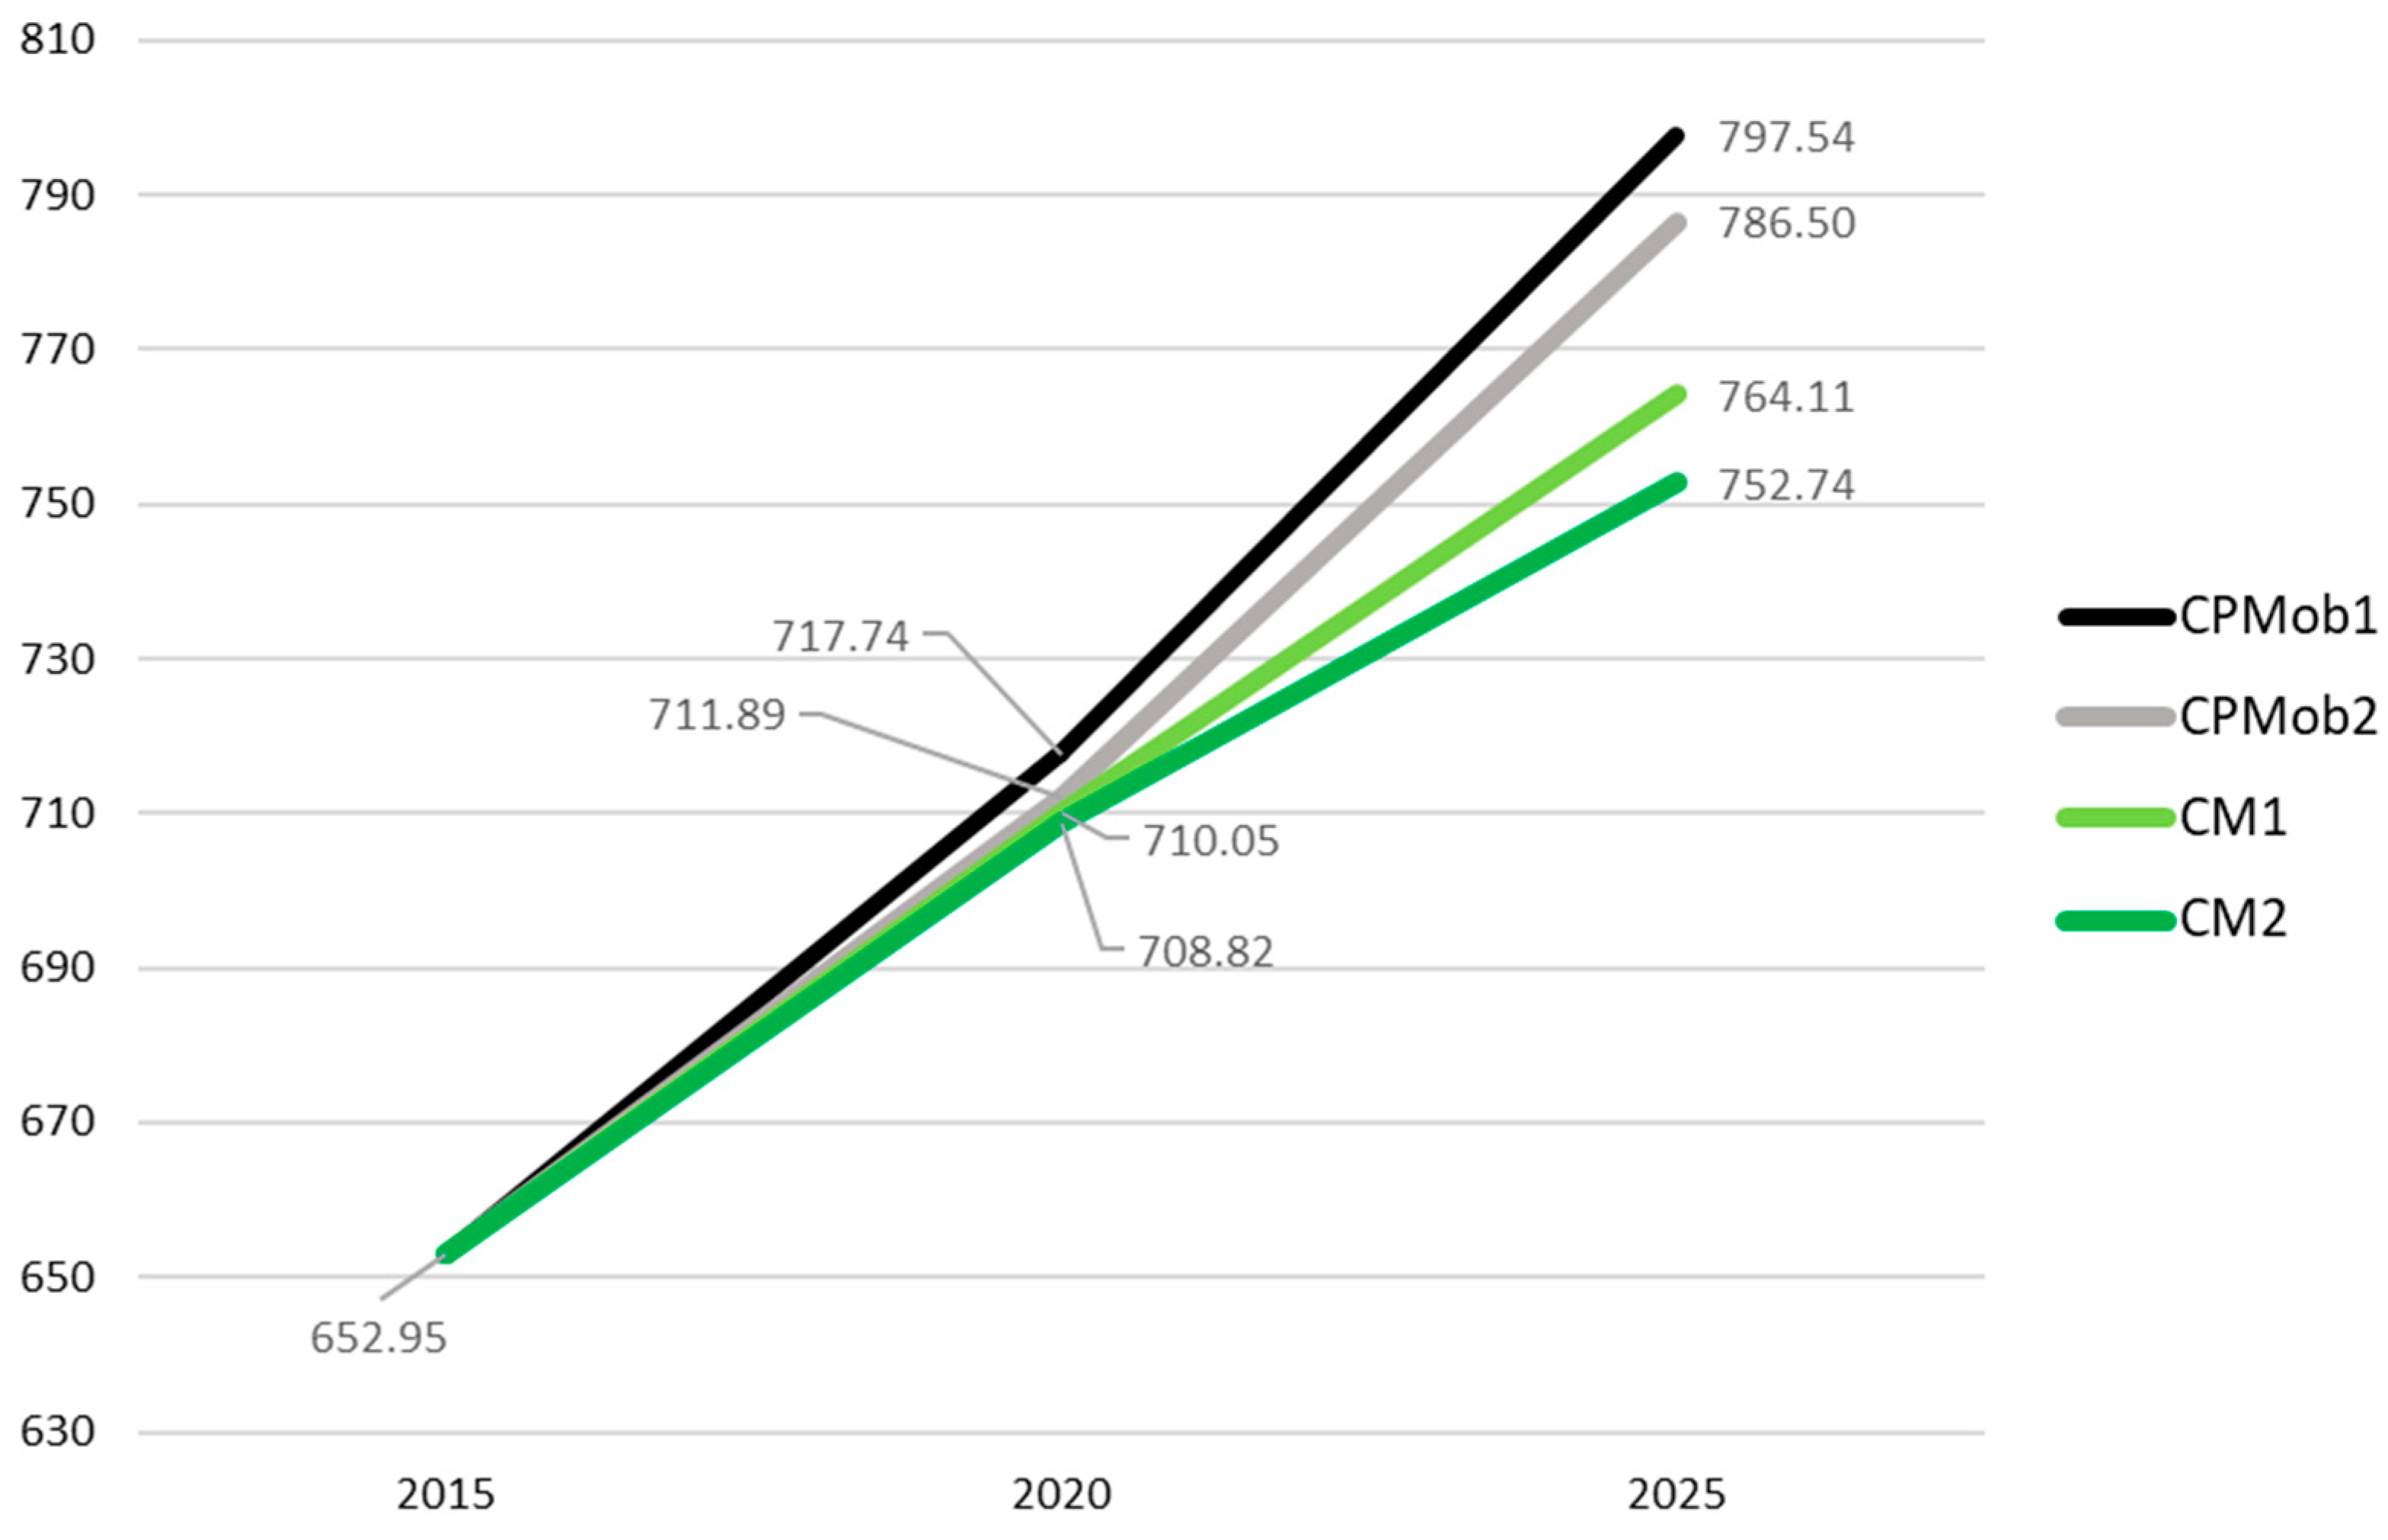
Table 6. The emissions were calculated for 2020 and 2025 following the business-as-usual projection, generating the GHG emission scenario termed CPMob1. GHG emissions were then calculated for the Urban Mobility Planning interventions, generating scenario CPMob2. Emissions were calculated by the aforementioned top–down methodology [40].
Since the CPMob1 and CPMob2 scenarios were constructed considering a linear increase in fuel consumption, the emission estimates of each sub-sector were the same as in the reference year, 2015. In addition to the emission scenarios based on the PlanMob data, mitigations focusing on reducing GHG emissions, primarily acting in the sub-sectors with the highest emissions participation, were calculated according to the inventory for the base year. The first mitigation scenario, CM1, presents an effort to direct urban mobility public policies to emission reductions, which is an aspect that is not addressed in PlanMob. The additional mitigation scenario—CM2—is more ambitious, considering actions that are more impacting or more intense than those adopted in CM1. The mitigation scenarios are not only aimed at reducing GHG emissions, they are also aimed at improving city mobility.
The literature review allowed us to direct the mitigation scenarios of this study to solutions that are applicable to the reference city. Pereira Jr et al. and La Rovere et al. [56,57], in their national study concerning Brazil, addressed the following actions in the initial mitigation scenario: investments in Bus Rapid Transit (BRT), the expansion of cycle paths, traffic optimization, improvement in the energy efficiency of light and heavy vehicles, and expansion of ethanol and biodiesel use. In these studies, the additional mitigation scenario also included the insertion of electric buses, additional light vehicle energy efficiency, subway and light rail train (VLT) expansion, and investment in waterways and railways for cargo transportation. The impact of improving combustion vehicle energy efficiency is further reinforced by several authors [2,58,59,60,61,62,63]. The focus on public transportation is decisive in all of the literature related to urban transport decarbonization [64,65,66]. Gouvello et al. [67] also cited the direction that the urban transport sector must take for its decarbonization: the development of high-capacity bus systems and rail transportation in high-traffic locations, urban mobility management to reduce congestion—a 20 km/h to 25 km/h increase in hourly traffic speed can generate up to a 5% decrease in emissions, the establishment of strategies to limit individual transportation, integrating different transport modes, integrating land use with transport—reducing travel distances, encouraging non-motorized transportation, and strengthening the use of biofuels, especially ethanol. The Transport and Urban Mobility Sector Plan for Mitigation and Adaptation to Climate Change [65] also directs actions, focusing on public transportation, urban planning with densification and the mixed use of regions, the creation of infrastructure for mobility by collective public transport, and the replacement of fossil fuels in urban buses. The adoption of electric vehicles is also considered an inevitable path [63,68] in the reduction of total emissions.

4.2.1. Medium-Sized Cities

The scope of this study is to privilege mitigation scenarios that can be effectively developed by the public policies of the municipalities [5,69]. However, medium cities, as the object of this study, present limitations in their mitigation actions when compared to larger cities:
  • The subway system—transport on high-capacity electrified rails—is unviable at the medium-sized city scale [65,67];
  • In spite of the great importance of the type of fuel used in the generated emissions, municipalities in general display limited incentive or even disincentive capacity for one fuel or another: the tributes are mostly state and/or nationwide. The municipality may only restrict the schedules or traffic zones of certain vehicles;
  • Cities also display little capacity for actions aimed at improving the energy efficiency of vehicles, as these are normally regulated by national standards. They can encourage less polluting vehicles and modes, giving them greater freedom of movement or exclusive parking areas.
These particularities are considered in scenarios CM1 and CM2, which privilege the actions that can be taken in a municipal scope. The descriptions of the considerations adopted in each mitigation scenario will be presented during the analysis of the results, since they depend on the previous stage of the GHG emissions inventory.

4.2.2. Based on Official Data, Official Planning, and Official Problems

The construction of the scenarios followed the forecasts of increases in motorized individual trips (Table 6) estimated by the PlanMob [46]. It also followed the series of growth in the number of urban train passengers, according to the increase in capacity that the network has been suffering since the 2014 World Cup event. However, this has been limited by the difficulty that the CBTU has been undergoing to reach its daily passenger targets due to delays in the delivery schedule of their compositions. Of the 12 diesel compositions acquired in 2014, only five were in operation by the end of 2017. Due to the lack of Origin–Destination studies for this transport mode, there will be no mode substitution when its growth occurs; it is also modal, with a subsidized rate of about USD $0.14 (US$ 1.00 quoted at R $3.35 as of 25 December 2017) against the USD $1.00 fare on urban buses and up to USD $2.27 on intercity buses, possibly replacing non-motorized modes within its activity. For intercity transportation, the same growth rate was adopted for the number of individual trips, with no modal migration; there are no plans to change its structure according to the state body [51], nor plans for its integration into urban transport in the PlanMob. The diesel freight and urban service sector will expect emissions growth as defined by the planned top–down quantification for all traffic.
PlanMob suggests the deployment of an extensive cycling network, from the existing 31 km to 210 km, but no quantification for budgets or sources of resources for this action, as well as an execution schedule, are available. This implementation will be included in the CM1 and CM2 mitigation scenarios, to be completed in 2025, but distant from the basic scenarios by the simple absence of a government plan for its implementation. The 2007 data [55] estimate that 4% of daily trips were carried out by bicycle, even with no adequate bicycle structure. In the projections reported by Gouvello et al. [67], an adequate cycle network deployment allows for a decrease of up to 1.6% in total emissions, which would migrate from individual transport. The evaluated city has the potential to reach higher levels of mitigation, but, due to a lack of updated O–D data, the same estimate reported by Gouvello et al. [67] for the fully installed network will be applied.
PlanMob 2017 also mentions:
  • The inefficiency of the transport network of urban buses with point-to-point lines, overlapping roads, and concurrent routes, but does not present proposals for change; instead, it only mentions that a shift to a hierarchical structural network should be carried out, within the main transportation corridors
  • The generalized deficiency in pedestrian mobility, but also without presenting any plan of action for correction. The only planned intervention is the rehabilitation of a historic neighborhood, which is currently not very representative of urban mobility as a pole that generates travel;
  • The possible implementation of a bicycle-sharing network, but without any quantification of its impact or viability.
For these reasons, these actions were not included in the CPMob1 and CPMob2 scenarios, and the lack of data on their impact on urban mobility and, consequently, on GHG emissions, were not included in the mitigation actions. The literature review also identified studies regarding new modes of transport [70,71], analyzing the implementation of a tramway (VLT) and trolleybus system, respectively, in Natal. The deployment of a 10-km trolleybus line was considered in the CM1 scenario for 2025. Additionally, the CM2 scenario will also include the implementation of a total of 28 km of tramway lines, in another road stretch in the municipality. The analyzed literature [70,71], although presenting initial indicators of cost estimates, does not present the analysis of the investment return for the possible operator, which prevents an effective analysis of the actual cost to implement these modalities. The 10-km trolleybus system has an estimated investment of R $17.3 million for infrastructure and R $22.77 million for the acquisition of 18 articulated trolleybuses. The 28-km tramway system, including infrastructure, expropriation, station construction, maneuvering yards, parking lots, and vehicle acquisition, totals an estimated R $2 billion, but lacks a revenue analysis of the system and parking operations throughout the tramway shelf-life.
The mitigation scenarios also included replacing part of the diesel bus fleet with electric vehicles. Pereira Jr et al. [56], in the mitigation scenario for Brazil, estimated an 8% dissemination of this type of vehicle until 2030, but in the reference city, passengers were concentrated in only a few lines, so there is the possibility of replacing a higher percentage of traveled mileage maintaining the existing network. Percentages of 10% for CM1 and 15% for CM2, for 2025, and 3% and 5% for 2020, respectively, will be adopted.
After the scenario elaborations, public policy proposals for the urban transport sector that stimulate sustainable development, and consequently better quality of life for the population, were constructed [72].

5. Results

5.1. GHG Emission Inventory

Table 7 and Figure 3 display the CO2eq GHG emissions inventory of the urban transport sector, according to the type of fuel, between 2012–2015.
Table 8 displays the CO2eq GHG emission inventory in the urban transport sector in the municipality of Natal in 2015, by sub-sectors, as a result of data obtained from PlanMob and data requested for this base year. The contributions of motorized individual transport, municipal public transport, intermunicipal road transport, passenger rail transport, urban diesel freight, and the services sector are listed per category.
Figure 4 displays the emission data in graphical form by sub-sector. Figure 5 exhibits the contributions of CO2eq emissions per passenger transported in each sub-sector.
Figure 6 compares intermunicipal public transport with that carried out within the municipality. In addition to emissions per passenger, the mileage traveled per passenger—which is higher in intercity transport—was also analyzed.
Figure 7 presents the complementary data that was observed when analyzing the behavior of the Brazilian fleet: an increase in the participation of diesel vehicles in total automobiles and light commercial vehicles sales.

5.2. Emission Scenarios

The results of the total urban transport sector CO2eq emissions in Natal for scenarios CPMob1, CPMob2, CM1, and CM2 are displayed in Table 9 and Figure 8. Table 9 also displays the emission mitigations achieved in each analyzed scenario compared to the reference scenario CPMob1.
Table 10 presents the impacts of the actions foreseen in the mitigation scenarios, according to the adopted mode of transport.

6. Discussion

6.1. Inventory

6.1.1. Public Road Transport

Total urban public transport CO2eq emissions were quantified by fuel sales data. Quantification of the urban public transport sector through traveled kilometers and used vehicles were calculated from PlanMob data. The municipality has activities concerning the inspection of public transportation routes, so these data show a reasonable degree of reliability. The low fleet of urban vehicles destined to public transport is worth noting. According to DETRAN/RN data, the reference municipality fleet in 2015 totaled 360,777 vehicles, while the active public transport fleet totaled only 823 vehicles, or 0.23% of the fleet. However, this small fleet, due to the high annual mileage achieved, the use of diesel only, and medium-age vehicles contributed about 10% of total CO2 emissions.

6.1.2. Individualized Motorized Transport

The high impact of individual motorized transport in the last decades is a recurring phenomenon in the large and medium-sized Latin cities of developing countries. Cars, vans, motorcycles, and scooters in 2015 added up to 319,326 vehicles, or about 86.6% of the total fleet of the municipality. Individual transport accounted for about 60% of CO2eq emissions in this inventory, being the most striking mode concerning total urban transport emissions in the municipality. This is the first mode of transport to where public intervention policies should be directed. However, one of the direct disincentive policies for this mode of transport is the increase in public transport attractiveness, which, as discussed in the previous topic, is composed of an old and reduced fleet. This negative impact of individual transport is in agreement with that found by Dhakap and Schipper [17] in developing Asian countries, and is also found in the Kathmandu Valley by Dhakal [73].
However, even with an old fleet, the public transport sector shows an emission rate per passenger that is 2.7 times lower than the emission rate per passenger of individual motorized transport. These results are in line with those reported by Jain and Tiwari [24], who encouraged the adoption of different modes of transportation. They are also aligned with the study by Madlener and Sunak [28], who cited individual private transport as the main cause of high emissions in the urban transport sector.

6.1.3. Intermunicipal Public Transport

As reported in the Origin–Destination survey, the municipality has a regional role in transport intent. Thus, this suburban sector transports 10,488,855 passengers annually, or about 8% of the total 135 million passengers (urban transport serves 124.6 million passengers). The emission rate per passenger in intermunicipal transport is 2.38 times higher than urban transport. Emission growth accompanies the annual mileage index driven by passengers in the two sub-sectors. This growth stems directly from the greater distances between municipalities, which is a result that is consistent with increasing displacement distances. However, this mode presents total and per passenger emissions that are lower than the private motorized transport. The analysis of route efficiency, the reduction of the average age of the vehicles—which presents an average age that is similar to the urban fleet, of 7.5 years—and the use of less emitting technologies such as natural gas or even electric vehicles, can still stimulate an increased use of this public transport mode, leading to reduced emissions.

6.1.4. Railway Transport

This sub-sector is noteworthy as the lowest absolute emissions (0.2% of total emissions) and the lowest emission rate per passenger among all of the urban systems, with an emission index that is 3.2 times lower than individual motorized transport and 17% lower than public bus transport. Unfortunately, its participation in urban movements is also the lowest, accounting for only 2% of passengers transported by the public road system. This improved emission efficiency, even using diesel-powered vehicles, results from the increased energy efficiency of rail transport.

6.1.5. Freight and Urban Services

The data on this sub-sector is scarce, without a lack of updated Origin–Destination, traffic counting, fleet discrimination, and traveled miles data. However, the municipal economy is mainly concentrated in the service sector, with no important industrial regions as cargo-generating centers and a small-scale port nationwide. However, the participation of this sector represents almost a third of the total urban transport sector emissions. The analysis of the 2007 O–D matrix and comparisons with the diesel oil consumption at the time indicate that freight transport would only account for about one-third of this sub-system, with the remaining being the chartered transport of passengers by bus, micro buses, and public utilities. This sector, displaying scarce data, can benefit from updating its Origin–Destination research through quantifying the impact of activities such as garbage collection and the movement of water and sewage and energy maintenance vehicles and ambulances, among others; these are all services executed by the public power, either directly or via concession, facilitating a faster change from diesel oil to electric vehicles, for example.
This sector is still noteworthy in another aspect: in Brazil, diesel car sales are not allowed, but diesel vans and trucks are, provided they have four-wheel drive. According to data from the National Association of Automobile Manufacturers, about 6% of the vehicle sales that were classified as light commercial vehicles (including vans and trucks) in 2015 were diesel vehicles [74], with a participation percentage of diesel vehicles in automobiles and light commercial vehicle sales rising from 5.4% to 8.1% in just six years (2012–2017), i.e., a 50% increase in sales. This increase was motivated by the federal subsidy diesel tariff. This has also led to a series of diesel trucks that have been created essentially for passenger transport [75]. Comparing the data from the state fleet [48] to the ANFAVEA sales data [74], the percentage of participation of vans and trucks in the fleet of cars and light commercial vehicles of Brazil and of Natal was similar: 16%. No data on the percentage of these diesel vehicles in the reference city that was destined to the use of individual transport or for freight transportation are available, so that this sub-sector certainly displays a significant percentage of emissions from individual motorized transportation, which were legally encouraged by the subsidy offered to freight transport.

6.2. Scenarios

The scenarios were built using the Municipal Transportation Planning, which is rather timid in its solutions for urban transport itself, and displays a worsening traffic in all of its scenarios for 2020 and 2025. The city presents a small percentage of biofuel consumption (sugarcane ethanol) that is lower than the 30–40% forecast in Brazilian scenarios, as observed in fuel sales. Instead, it is close to 10%, which is mainly due to the small difference in the final gasoline price. The mitigation scenarios included conceptual studies with the inclusion of trolleybus and tramways in the public transport network. However, as these simulations were not accompanied by the updating of an Origin–Destination research, when integrating the different transport systems, the GHG emission reduction results were lower than the capacity of these transportation modes. The tramway alone, which was designed according to the proposed system, has the capacity to carry up to 900,000 passengers per day, or about 60% of all urban transport passengers, but was analyzed only as a substitute for diesel buses. Considering the estimated 17% for an adequate, safe, and comfortable system such as the tramway [67], about 150,000 passengers per day could migrate from individual transport to this transport mode, reducing approximately 15% of motorized individual transport, which in turn accounts for about 60% of the city’s transport emissions. Therefore, this modal tramway displays the potential to mitigate around 71,000 tCO2eq with an integrated planning of urban transport, adjusting bus circulation to feed its operation axis and discouraging individual transportation. The incentive to public and non-motorized transport aligns with the scenarios obtained by Shekarrizfard et al. [29], Jain and Tiwari [24], and Dhakal [73], who presented significant reductions in GHG emissions by increasing incentives for these modalities.
Insufficient data was available for the analysis of municipal government emission reduction costs in the mitigation scenarios:
  • The solution with the greatest emission reduction in both mitigation scenarios is the implementation of an integrated bicycle system, but no budget quantification in the PlanMob is available, nor any separation of bike path and cycle path stretches—which display differentiated costs—which makes an estimate of average national or international implementation costs difficult.
  • As mentioned previously, the trolleybus and tramway systems that have been reported in the literature do not present an analysis of investment returns during their operation; instead, they present only partial implementation cost estimates, which would make a comparison between these values incorrect.
However, as a way to overcome this deficiency regarding investment estimates, the municipal government may offer these feasibility studies to the private sector, defining segments or sectors of interest, or concession periods, with the so-called Expression of Interest Procedure (Procedimento de Manifestação de Interesse—PMI), which will serve to direct a future concession or PPP—Public–Private Partnerships, as suggested by Dhakap and Schipper [17] due to the limited investment capacity of cities in developing countries. The PMI should include technical and economic–financial feasibility studies, institutional modeling, legal modeling, design, and the other elements that are necessary to compose the pieces of future bidding of these modalities.

6.3. Public Policies

Transportation displays a high potential for emission reduction, but also applies a set of actions, including infrastructure, education, stimulus, use restrictions, and regulations and citizen participation, in order to achieve success [68,69]. Public policies can be directed toward the mitigation of carbon emissions, in the same way as Tan et al. [36], who constructed public policy suggestions not in accordance with political goals, but instead through a deep analysis of transport modes and their energy structure, in a case study for Chongqing.

6.3.1. Discouraging Private Individual Transport

Individual transport is the sub-sector that displays the greatest impact, and where the highest emission growth is predicted. This sub-sector should be discouraged, with actions restricting its flow, rotating vacancies, low-speed roads, pedestrian-only streets, areas reserved for public transportation, a decrease in the number of parking spaces, and an effective campaign to improve transportation public education as well as education concerning the negative impacts of individual motorized transportation and changes in municipal investment planning for the sector, focusing on public transportation and non-motorized transport modes. These measures are in line with those proposed by Dhakap and Schipper [17] and Madlener and Sunak [28]. The co-benefit examples cited by Puppim de Oliveira et al. [33] and Doll and Puppim de Oliveira [34] in more efficient systems of urban mobility demonstrate the potential for the co-benefits of the focus on attractive, lower-carbon public transport. Individual motorized transport in diesel vehicles, which is not quantifiable with the available data but is certainly relevant concerning municipal emissions, can be discouraged by the creation of circulation zones that prohibit the use of diesel vehicles during extended hours, as is already adopted in several cities worldwide, further reducing particulate emissions [6].

6.3.2. Public Transport Promotion

Incentives to public transport can be initiated by measures where there is little or no public investment: the municipality offers public competition regarding feasibility studies concerning the implementation of a trolleybus system, including concessions in a pre-established stretch for a defined period. Likewise, a public competition could be implemented for a feasibility analysis of a tramway system to be deployed and granted entirely or via Public–Private Partnership (PPP). Both systems also depend on a change in the urban bus network, which is hierarchical and allows for the use of high-capacity systems.
The implementation of application services to monitor buses and urban microbuses, confirming mileage and fuel consumption estimates and providing real-time data to passengers about their location and travel time estimates.

6.3.3. Other Services Regulated by the Municipality

As mentioned previously, utility diesel fleets offer short-term mitigation potential; the municipality can regulate the obligation to switch fuel, for example to energy, water, and sewage utilities, garbage collection, ambulances, and police, among others. Limitations regarding the circulation of medium and large trucks and diesel vehicles, allowing electric minibuses for door-to-door access, can also impact this sub-sector in the short term.
The compulsory use of electric vehicles by the taxi fleet can also be rapidly implemented. This sector could be even better quantified with the adoption of GPS travel control applications, in order to provide data on the actual impact of this private transport concession.
The regulation of shared carpool and urban mobility services, such as Uber and similar creating mechanisms to encourage their use will release land use, while also encouraging the adoption of electric vehicles.

6.3.4. Active Transport

Incentives for active transport include sidewalks and interconnected, accessible bicycle paths. This would require legislation collection for land and property owner mobility with effective supervision that also displays transparency in government actions and intentions. There are no municipal targets for the interconnection of active transport modes, as well as no advertising of the cycle plan, noting that 60% of displacements are already non-motorized. Appropriate sidewalks and bike lanes should be accompanied by tree cover to encourage walking, given the tropical, high-sunshine climate.
Stimulus should also be provided for companies that develop initiatives of active transport, such as freight with bicycles and bicycle-sharing, among others, through awards and incubators.

6.3.5. Data Transparency and Integrated Planning

The link between urban mobility planning and urban land use and occupation should be stimulated. The PlanMob that was developed by the city did not take into account land use to create future mobility scenarios. No interaction between current data and land-use projections that could impact urban mobility was carried out. The distancing of the analyzed PlanMob from emission-reduction policies is not an exclusivity of Latin American cities: it is not easy to combine the various social, economic, and environmental interests [4,5,76]. Analyzing the work by Silva et al. [23], the targeting of urban land-use planning for mobility (transit-oriented planning) could lead to about 9–15% gains in the reduction of energy consumption and consequent emissions. Shekarrizfard et al. [29] cited several examples that, through better urban planning, could increase the number of journeys without the same increase in emissions. Alonso et al. [39] found a scenario that produces an effective reduction of motorized trips and consequent emissions in the city of Madrid only in urban re-sensing. In the Beijing case study developed by Wang et al. [37], the intense population growth in suburban regions quadrupled individual transport emissions between 2000–2009 due to trip increases. The case study on land use near subway stations in Los Angeles conducted by Kim et al. [38] demonstrated the link between the location of offices and shopping centers and the generation of travel. According to Dhakap and Schipper [17], urban mobility planning fails because it does not predict a decrease in vehicle inventory and the demand for travel; instead, it only provides infrastructure improvement directed to the most emitting mode, encouraging it.
Obtaining O–D data may be the cheapest form of mitigation, since it allows for subsequent integration between several transport modes, including intermunicipal transport.
Transparency in municipal transport data is required, especially regarding the quantification and estimated cost of public transport. Data transparency fosters innovation in solutions for this sector.

7. Limitations

This work was developed with available public data or data requested from the governing bodies responsible for the mobility sectors. Data such as the O–D matrix and the vehicle count that are not kept up to date by the responsible agencies can generate distortions, especially in the scenario projections.
This study delves into detailing the sub-sectors of urban mobility, but did not present an exploratory scope, exploring research paths beyond existing official documents. There is vast literature that deals with the impact of land use on GHG emissions. In addition to the bibliographies cited above, Bart (2010), Deal et al. (2017), Kennedy et al. (2011), Hankey et al. (2010), and Pan et al. (2018) [77,78,79,80,81] deepened studies on the environmental impacts of urban sprawl, including GHG emissions, as well as mitigation policy proposals. However, the main urban mobility planning document—PlanMob—has not yet been integrated with Urban Land-Use Planning, or the Urban Master Plan.
This study also displays limitations because it does not comprise comparison parameters with Brazilian cities or of similar developing countries, being one of the first studies directed toward medium cities; this presents deficiencies already mentioned in the previous topics in keeping their data updated regarding municipality planning.

8. Conclusions

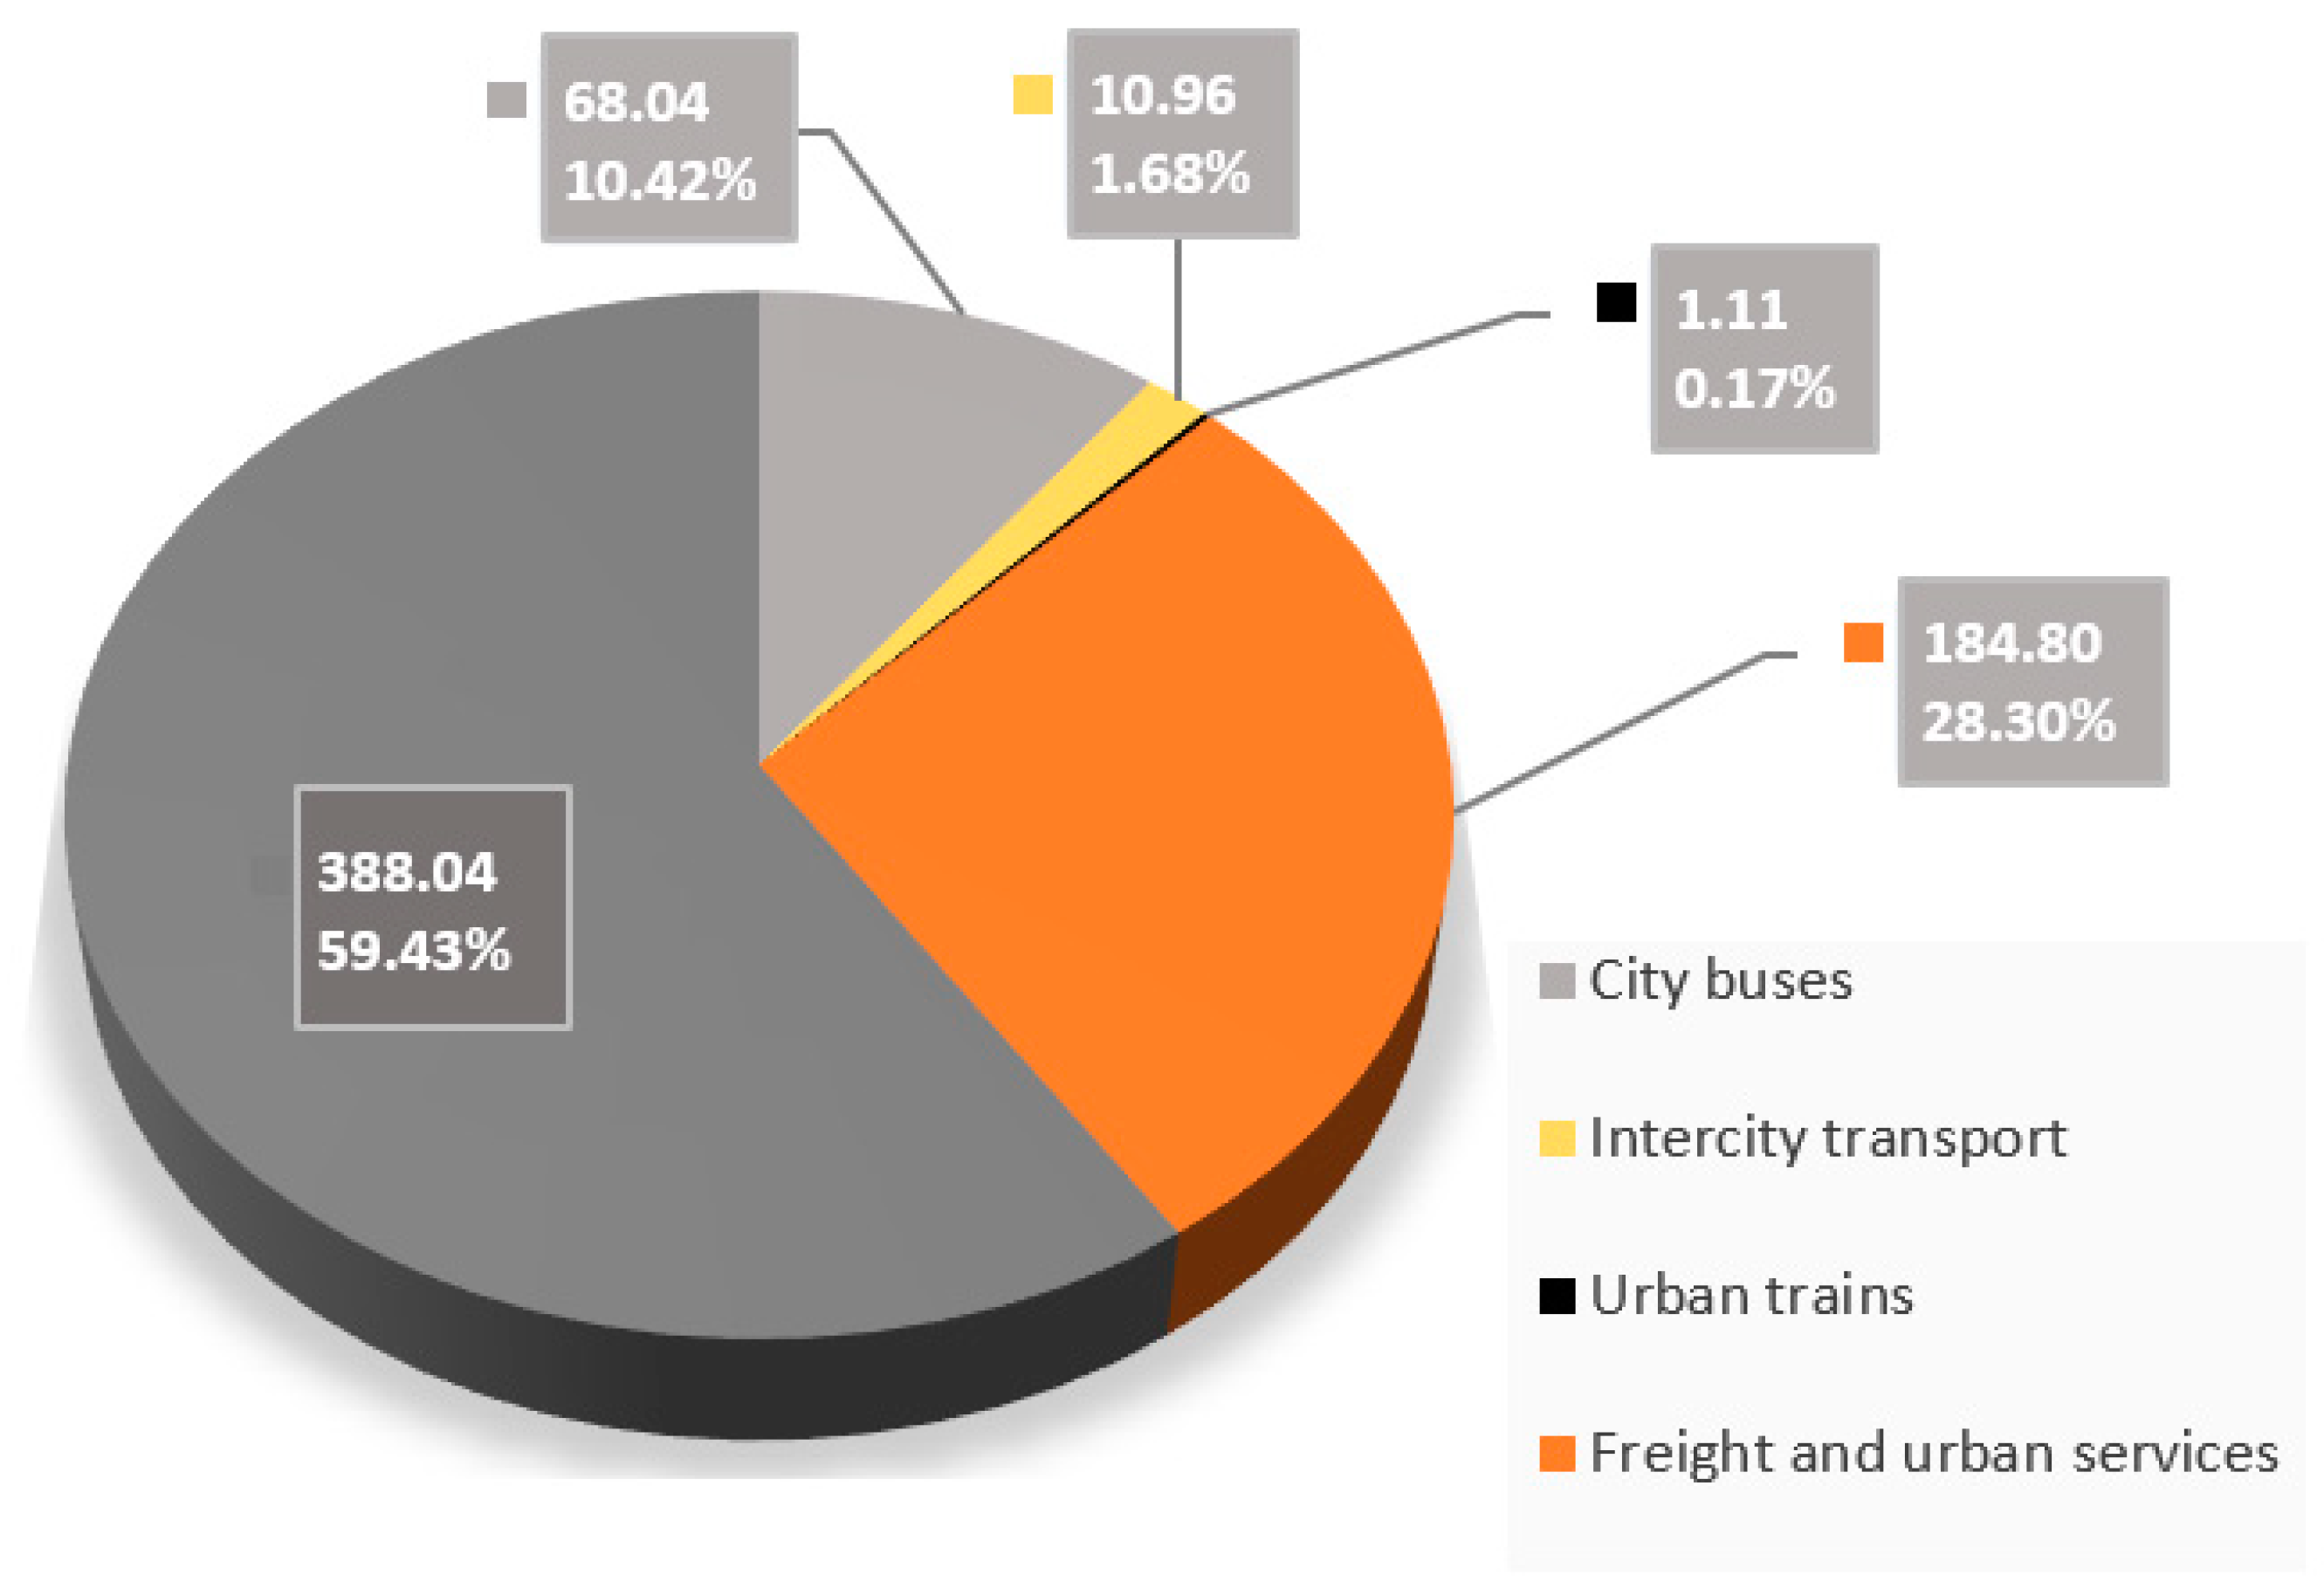
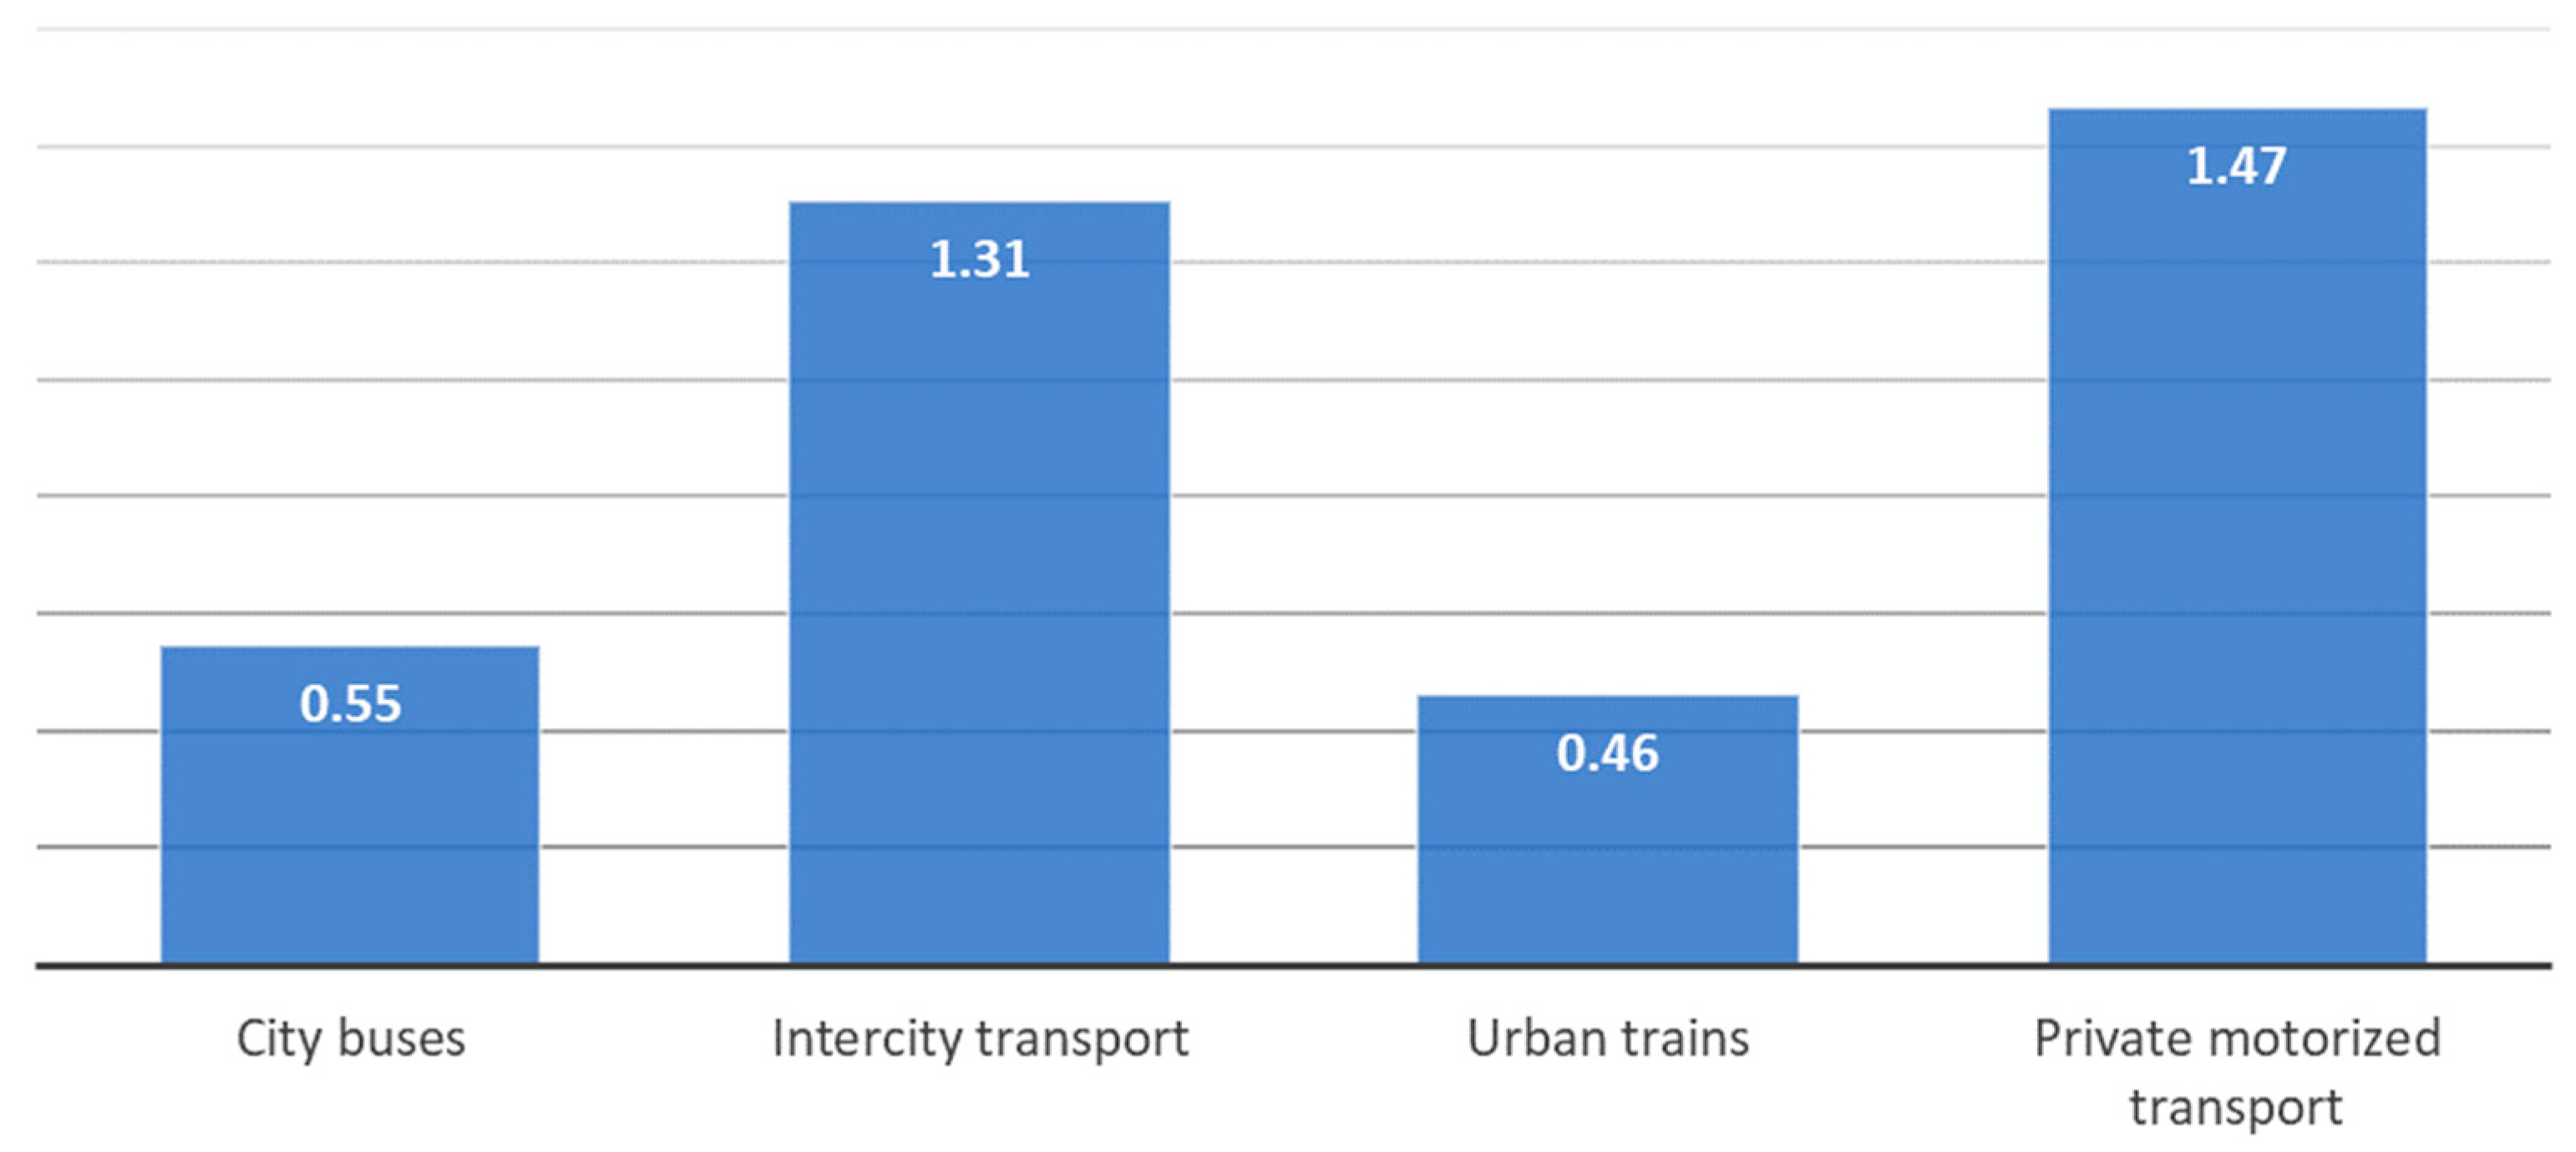
The results obtained by this study allow for the characterization of the urban transport sector, defining the sub-sectors that exhibit the greatest impact. Individual motorized transport accounts for 59.43% of greenhouse gas emissions from urban transport, followed by the freight and urban services sector, at 28.3%, for the base year of 2015. The public bus transport sector, with a fleet of only 0.23% of the total of vehicles in the city, contributes 10.43% of the CO2eq emissions. The freight and public utilities sector use diesel engines in their operations and include, in its total, the use of diesel vehicles such as pick-ups and diesel SUVs in private transportation, as there is no data available separating diesel vehicles from the city’s fleet. The public bus transport sector comprises exclusively diesel vehicles that have a high average age and high average monthly mileage, which explains their proportionally high CO2eq emissions.
The sub-sector detailing of the GHG emissions inventory of urban transport reinforces the need to direct public policies for collective transportation, which would improve energy efficiency and attractiveness, make urban transport comfortable and safe, and discourage the displacement of individual motorized vehicles.
The planning of urban mobility actions presented by the PlanMob distanced the national incentive policies for public and non-motorized individual transport, with negative consequences in the resulting GHG emission scenarios. The scenario planned by the city in its PlanMob will result in a 20.45% increase in CO2eq emissions in 2025. In turn, the mitigation scenarios include actions to encourage collective transportation, the replacement of fossil fuels by electric motors, and incentives toward non-motorized transportation Mitigation scenarios would result in an initial mitigation of up to 44,800 tCO2eq by 2025, and can achieve mitigation values of up to one-third of the total GHG emissions from urban transport if high-capacity and electrified public transport such as tramways were to be integrated into the transport network.
The development of the scenarios also indicated that the execution of a bicycle system would lead to the greatest direct emission decreases, maintaining the urban road transport system in a similar way to the existing system. Electromobility modes—the trolleybus and the tramway—enable additional mitigations with increased operational urban transport capacity. The tramway alone, which was calculated as a simple substitution to the road mode, has the potential to mitigate at least 71,000 tCO2eq, which is about 9% of the total city emissions. Its implementation must be associated with a reorganization of the daily commuting flow of collective transportation and incentives regarding individual transport migration.
These results should support municipal public policy makers in reviewing the PlanMob adopted criteria, approaching national emission reduction commitments, directing investments to less emitting sectors, such as non-motorized and electrified public transport, and taking mitigation action on the most emitting sectors.

Author Contributions

Conceptualization, A.L.L.T.; Formal analysis, E.L.L.R.; Investigation, A.L.L.T.; Resources, A.L.L.T.; Supervision, E.L.L.R.; Writing—original draft, A.L.L.T.; Writing—review & editing, E.L.L.R.

Funding

This research was funded by a scholarship supported by Program CAPES/DINTER at the Federal University of Rio de Janeiro and Federal Institute of Science, Education and Technology of Rio Grande do Norte, financed by CAPES—Brazilian Federal Agency for Support and Evaluation of Graduate Education within the Ministry of Education of Brazil, grant number 023/2014.

Conflicts of Interest

The authors declare no conflict of interest. The funders had no role in the design of the study; in the collection, analyses, or interpretation of data; in the writing of the manuscript, and in the decision to publish the results.

Appendix A

Table A1. Total urban transport CO2eq emissions in Natal—scenarios for 2020 and 2025.
Line IdentificationNumber of Passengerskm Per YearLine IdentificationNumber of Passengerskm Per Year
1.E1.366,763.00179,430.001.E2.2666,903.00129,360.00
1.E1.228,646.00179,872.001.E2.2768,066.00129,360.00
1.E1.431,148.00168,192.001.E2.2058,148.00120,360.00
1.E1.124,801.00168,191.001.E2.2152,164.00117,600.00
1.E1.754,391.00153,561.601.E2.1948,935.00118,580.00
1.E1.1628,079.00110,592.001.E2.1754,822.00129,360.00
1.E1.1552,293.0073,566.001.E2.1864,961.00129,360.00
1.E1.3252,166.00226,560.001.E2.21.162,359.00108,780.00
1.E1.3356,747.00113,822.001.E2.19.165,491.00108,780.00
1.E1.1772,636.0081,618.001.E2.22.162,359.00117,600.00
1.E1.1352,538.00142,848.001.E2.5.248,555.00134,400.00
1.E1.3446,537.0062,952.001.E2.2486,470.00140,650.00
LDI-195-102289,075.00549,217.16LDI-185-094347,335.00203,750.00
LDI-110-100336,422.00451,919.001.E2.1571,720.00129,360.00
LDI-140-054552,611.00602,196.521.E2.1470,287.00129,360.00
LDI-140-06618,600.0033,777.601.E2.1665,914.00129,360.00
LDI-150-117984,888.00541,817.001.E2.1366,120.00129,360.00
LDI-150-116812,842.00530,904.001.E2.20.166,451.00117,600.00
LDI-160-090878,960.00433,532.001.E2.24.158,794.0089,189.00
LDI-160-089634,071.00303,820.001.E2.23.148,838.0082,419.00
1.E1.4961,031.00114,912.001.E2.2564,052.00129,360.00
1.E1.1040,479.0083,220.001.E2.423,550.00180,480.00
1.E1.5060,826.00114,912.001.E2.323,014.00199,680.00
1.E1.1158,513.00106,856.001.E2.5223,428.00171,360.00
1.E1.5165,284.00264,389.28Total10,488,885.0011,980,085.76
1.E1.5233,431.00129,360.00
1.E2.533,757.0079,104.00
LDI-105-01330,910.0048,800.00
LDI-185-088548,227.00384,062.00
LDI-185-0871,471,600.00871,222.00
LDI-185-736506,142.00359,072.00
LTR-105-01638,202.0038,506.60
LTR-105-019197,589.00191,520.00
LTR-105-753472,191.00662,354.00
1.E2.2260,191.00118,580.00
1.E2.2367,532.00129,360.00
Data consolidated by the author. Primary source of data: [51].

References

  1. IPCC. Summary for Policymakers; IPCC: Geneva, Switzerland, 2014; ISBN 9789291691432. [Google Scholar]
  2. IEA. CO2 Emissions from Fuel Combustion 2017—Highlights; IEA: Paris, France, 2017. [Google Scholar]
  3. BID. Leading the Sustainable Development of Cities—Transport System; BID: Washington, DC, USA, 2017; ISBN 8572271600. [Google Scholar]
  4. Gössling, S.; Cohen, S. Why sustainable transport policies will fail: EU climate policy in the light of transport taboos. J. Transp. Geogr. 2014, 39, 197–207. [Google Scholar] [CrossRef] [Green Version]
  5. Eliasson, J.; Proost, S. Is sustainable transport policy sustainable? Transp. Policy 2015, 37, 92–100. [Google Scholar] [CrossRef]
  6. C40 Cities Climate Leadership Group. Good Practice Guide: Low Emission Vehicles; Cities Climate Leadership Group: London, UK, 2016. [Google Scholar]
  7. Fulton, L.; Mejia, A.; Arioli, M.; Dematera, K.; Lah, O. Climate Change Mitigation Pathways for Southeast Asia: CO2 Emissions Reduction Policies for the Energy and Transport Sectors. Sustainability 2017, 9, 1160. [Google Scholar] [CrossRef]
  8. Mani, M.; Bandyopadhyay, S.; Chonabayashi, S.; Markandya, A.; Mosier, T. South Asia’s Hotspots—The Impact of Temperature and Precipitation Changes on Living Standards; The World Bank: Washington, DC, USA, 2018; ISBN 9781464811555. [Google Scholar]
  9. Shrestha, R.M.; Ahmed, M.; Suphachalasai, S.; Lasco, R. Economics of Reducing Greenhouse Gas Emissions in South Asia; Options and Cost; Asian Development Bank: Mandaluyong, Philippines, 2012; ISBN 9789290921431. [Google Scholar]
  10. IPCC; Eggleston, S.; Buendia, L.; Miwa, K.; Ngara, T.; Tanabe, K. 2006 IPCC Guidelines for National Greenhouse Gas Inventories; IPCC: Kanagawa, Japan, 2006; ISBN 4887880324. [Google Scholar]
  11. MCid. PlanMob—Reference Book for Elaboration of Mobility Plan. In Proceedings of the Seminar on Sustainable Urban Mobility: Practices and Trends, São Paulo, Brazil, 2–3 December 2014. [Google Scholar]
  12. MCid. National Policy on Urban Mobility, Brazil Law No. 12587. 1 March 2012.
  13. Rosenzweig, C.; Solecki, W.; Hammer, S.A.; Mehrotra, S. Cities lead the way in climate-change action. Nature 2010, 467, 909–911. [Google Scholar] [CrossRef] [PubMed]
  14. Solecki, W.; Rosenzweig, C.; Dhakal, S.; Roberts, D.; Barau, A.S.; Schultz, S.; Ürge-Vorsatz, D. City transformations in a 1.5 °C warmer world. Nat. Clim. Chang. 2018, 8, 177–181. [Google Scholar] [CrossRef]
  15. IBGE. Estimates of the Resident Population in the Municipalities and for the Units of the Brazilian Federation. Available online: https://cidades.ibge.gov.br/brasil/rn/natal/pesquisa/38/46996 (accessed on 1 July 2017).
  16. Governo Do Rio Grande Do Norte. Strategic Plan for Sustainable Development for the Metropolitan Region of Natal: Natal Metropolis 2020; Governo Do Rio Grande Do Norte: Natal, Brazil, 2007.
  17. Dhakap, S.; Schipper, L. Transport and Environment in Asian Cities: Reshaping the Issues and Opportunities into a Holistic Framework. IGES Int. Rev. Environ. Strateg. 2005, 5, 399–424. [Google Scholar]
  18. Leibowicz, B.D. Effects of urban land-use regulations on greenhouse gas emissions. Cities 2017, 70, 135–152. [Google Scholar] [CrossRef]
  19. Vivanco, M.G.; de Andrade, M.F. Validation of the emission inventory in the Sao Paulo Metropolitan Area of Brazil, based on ambient concentrations ratios of CO, NMOG and NOx and on a photochemical model. Atmos. Environ. 2006, 40, 1189–1198. [Google Scholar] [CrossRef]
  20. De Souza, C.D.R.; Silva, S.D.; da Silva, M.A.V.; de D’Agosto, M.A.; Barboza, A.P. Inventory of conventional air pollutants emissions from road transportation for the state of Rio de Janeiro. Energy Policy 2013, 53, 125–135. [Google Scholar] [CrossRef]
  21. Policarpo, N.A.; Silva, C.; Lopes, T.F.A.; dos Araújo, R.S.; Cavalcante, F.S.Á.; Pitombo, C.S.; de Oliveira, M.L.M. Road vehicle emission inventory of a Brazilian metropolitan area and insights for other emerging economies. Transp. Res. Part D Transp. Environ. 2018, 58, 172–185. [Google Scholar] [CrossRef]
  22. Vanhulsel, M.; Degraeuwe, B.; Beckx, C.; Vankerkom, J.; De Vlieger, I. Road transportation emission inventories and projections—Case study of Belgium: Methodology and pitfalls. Transp. Res. Part D Transp. Environ. 2014, 27, 41–45. [Google Scholar] [CrossRef]
  23. Silva, M.; Leal, V.; Oliveira, V.; Horta, I.M. A Scenario-Based Approach for Assessing the Energy Performance of Urban Development Pathways. Sustain. Cities Soc. 2018, 40, 372–382. [Google Scholar] [CrossRef]
  24. Jain, D.; Tiwari, G. How the present would have looked like? Impact of non-motorized transport and public transport infrastructure on travel behavior, energy consumption and CO2emissions—Delhi, Pune and Patna. Sustain. Cities Soc. 2016, 22, 1–10. [Google Scholar] [CrossRef]
  25. Lee, J.H.; Lim, S. The selection of compact city policy instruments and their effects on energy consumption and greenhouse gas emissions in the transportation sector: The case of South Korea. Sustain. Cities Soc. 2018, 37, 116–124. [Google Scholar] [CrossRef]
  26. Franzitta, V.; Curto, D.; Milone, D.; Trapanese, M. Energy Saving in Public Transport Using Renewable Energy. Sustainability 2017, 9, 106. [Google Scholar] [CrossRef]
  27. Hukkalainen (née Sepponen), M.; Virtanen, M.; Paiho, S.; Airaksinen, M. Energy planning of low carbon urban areas—Examples from Finland. Sustain. Cities Soc. 2017, 35, 715–728. [Google Scholar] [CrossRef]
  28. Madlener, R.; Sunak, Y. Impacts of urbanization on urban structures and energy demand: What can we learn for urban energy planning and urbanization management? Sustain. Cities Soc. 2011, 1, 45–53. [Google Scholar] [CrossRef]
  29. Shekarrizfard, M.; Faghih-Imani, A.; Tétreault, L.F.; Yasmin, S.; Reynaud, F.; Morency, P.; Plante, C.; Drouin, L.; Smargiassi, A.; Eluru, N.; Hatzopoulou, M. Regional assessment of exposure to traffic-related air pollution: Impacts of individual mobility and transit investment scenarios. Sustain. Cities Soc. 2017, 29, 68–76. [Google Scholar] [CrossRef]
  30. Fenton, P. Sustainable mobility in the low carbon city: Digging up the highway in Odense, Denmark. Sustain. Cities Soc. 2017, 29, 203–210. [Google Scholar] [CrossRef]
  31. Kwan, S.C.; Hashim, J.H. A review on co-benefits of mass public transportation in climate change mitigation. Sustain. Cities Soc. 2016, 22, 11–18. [Google Scholar] [CrossRef]
  32. Muneer, T.; Celik, A.N.; Caliskan, N. Sustainable transport solution for a medium-sized town in Turkey—A case study. Sustain. Cities Soc. 2011, 1, 29–37. [Google Scholar] [CrossRef]
  33. De Oliveira, J.A.P.; Doll, C.N.H.; Suwa, A. Urban Development with Climate Co-Benefits: Aligning Climate, Environmental and Other Development Goals in Cities; The United Nations University Institute of Advanced Studies: Tokyo, Japan, 2013; ISBN 9789280845495. [Google Scholar]
  34. Doll, C.N.H.; de Oliveira, J.A.P. Urbanization and Climate Co-Benefits; Routledge: London, UK, 2017; ISBN 9781315667300. [Google Scholar]
  35. Doll, C.N.H.; Balaban, O. A methodology for evaluating environmental co-benefits in the transport sector: Application to the Delhi metro. J. Clean. Prod. 2013, 58, 61–73. [Google Scholar] [CrossRef]
  36. Tan, X.; Zeng, Y.; Gu, B.; Wang, Y.; Xu, B. Scenario Analysis of Urban Road Transportation Energy Demand and GHG Emissions in China—A Case Study for Chongqing. Sustainability 2018, 10, 2033. [Google Scholar] [CrossRef]
  37. Wang, Y.; Hayashi, Y.; Chen, J.; Li, Q. Changing urban form and transport CO2 emissions: An empirical analysis of Beijing, China. Sustainability 2014, 6, 4558–4579. [Google Scholar] [CrossRef]
  38. Kim, D.; Ahn, Y.; Choi, S.; Kim, K. Sustainable mobility: Longitudinal analysis of built environment on transit ridership. Sustainability 2016, 8, 1016. [Google Scholar] [CrossRef]
  39. Alonso, A.; Monzón, A.; Wang, Y. Modelling land use and transport policies to measure their contribution to urban challenges: The case of Madrid. Sustainability 2017, 9, 378. [Google Scholar] [CrossRef]
  40. WRI; C40; ICLEI. Global Protocol for Community-Scale Greenhouse Gas Emission Inventories: An Accounting and Reporting Standard for Cities; World Resources Institute: Washington, DC, USA, 2014; pp. 1–176. [Google Scholar]
  41. Maurice, L.Q.; Hockstad, L.; Hohne, N.; Hupe, J.; Lee, D.S.; Rypdal, K. Mobile Combustion. IPCC Guidel. Natl. Greenh. Gas Invent. 2006, 1–78. [Google Scholar]
  42. Mengel, M.; Nauels, A.; Rogelj, J.; Schleussner, C.F. Committed sea-level rise under the Paris Agreement and the legacy of delayed mitigation action. Nat. Commun. 2018, 9, 1–10. [Google Scholar] [CrossRef] [PubMed]
  43. Ari, I.; Sari, R. Developing CBDR-RC indices for fair allocation of emission reduction responsibilities and capabilities across countries. Cogent Environ. Sci. 2017, 3, 1–19. [Google Scholar] [CrossRef]
  44. Obersteiner, M.; Bednar, J.; Wagner, F.; Gasser, T.; Ciais, P.; Forsell, N.; Frank, S.; Havlik, P.; Valin, H.; Janssens, I.A.; et al. How to spend a dwindling greenhouse gas budget. Nat. Clim. Chang. 2018, 8, 7–10. [Google Scholar] [CrossRef]
  45. IPCC. Global Warming of 1.5 °C. Summary for Policymakers—2018; IPCC: Geneva, Switzerland, 2018. [Google Scholar]
  46. Natal Rio Grande do Norte. Urban Mobility Director Plan—Diagnosis and Trends; Natal Rio Grande do Norte: Natal, Brazil, 2017. [Google Scholar]
  47. ANP. Annual Sales of Hydrated Ethanol and Petroleum Products by Municipality. Available online: http://www.anp.gov.br/wwwanp/dados-estatisticos/vendas-anuais-de-etanol-hidratado-e-derivados-de-petroleo-por-municipio (accessed on 4 January 2018).
  48. DETRAN/RN. Government of the State of Rio Grande Do Norte Statistical Report of the Fleet of Vehicles—Renavan, 2015; Government of the State of Rio Grande Do Norte, Ed.; Government of the State of Rio Grande Do Norte: Natal, Brazil, 2016.
  49. POTIGAS. Total Consumption of NGV for the Municipalities Served by Potigás, in the Last 05 Years (2012, 2013, 2014, 2015, 2016); POTIGAS: Natal, Brazil, 2017. [Google Scholar]
  50. CBTU—Companhia Brasileira de Trens Urbanos. Letter 93-2017—Diesel Consumption for Railway Operation; CBTU—Companhia Brasileira de Trens Urbanos: Natal, Brazil, 2017.
  51. DER/RN. Intermunicipal Road Transport—DER/RN; Departamento Estadual De Estradas E Rodagem-DER/RN: Natal, Brazil, 2017.
  52. CBTU—Companhia Brasileira de Trens Urbanos. Management Report; CBTU—Companhia Brasileira de Trens Urbanos: Brasília, Brazil, 2016.
  53. PREFEITURA DO NATAL. Urban Mobility Director Plan—Offer Improvement Plan; PREFEITURA DO NATAL: Natal, Brazil, 2017.
  54. Ministério do Meio Ambiente—Governo do Brasil. National Inventory of Atmospheric Emissions by Road Automotive Vehicles 2013; Ministério do Meio Ambiente—Governo do Brasil: Brasília, Brazil, 2014.
  55. COPPETEC/COPPE/UFRJ. Urban Mobility Plan for Natal—Cargo Handling Report; COPPETEC/COPPE/UFRJ: Natal, Brazil, 2007. [Google Scholar]
  56. Pereira, A.O., Jr.; Cunha, S.H.F.; Santos, T. Economic and Social Implications of Greenhouse Gas Mitigation Scenarios in Brazil Until 2030—Transport Sector GHG Mitigation Scenarios; Centro Clima/COPPE/UFRJ: Rio de Janeiro, Brazil, 2016; ISBN 9788528503432. [Google Scholar]
  57. La Rovere, E.L.; Wills, W.; Pereira, A.O., Jr.; Dubeux, C.B.S.; Cunha, S.H.F.; Oliveira, B.C.P.; Moreira, M.M.R.; Watanabe, S.; Loureiro, S.M.; Moreira, L.S.S.C.; et al. Economic and Social Implications of Greenhouse Gas Mitigation Scenarios in Brazil until 2030: IES-Brazil Project; Forum Brasileiro de Mudanças Climáticas—FBMC, COPPE/UFRJ: Rio de Janeiro, Brazil, 2016; ISBN 9788528503432. [Google Scholar]
  58. Wills, W.; La Rovere, E.L. Light vehicle energy efficiency programs and their impact on Brazilian CO2 emissions. Energy Policy 2010, 38, 6453–6462. [Google Scholar] [CrossRef]
  59. Liu, Y.; Cirillo, C. Evaluating policies to reduce greenhouse gas emissions from private transportation. Transp. Res. Part D Transp. Environ. 2016, 44, 219–233. [Google Scholar] [CrossRef] [Green Version]
  60. Bueno, G. Analysis of scenarios for the reduction of energy consumption and GHG emissions in transport in the Basque Country. Renew. Sustain. Energy Rev. 2012, 16, 1988–1998. [Google Scholar] [CrossRef]
  61. Talbi, B. CO2 emissions reduction in road transport sector in Tunisia. Renew. Sustain. Energy Rev. 2017, 69, 232–238. [Google Scholar] [CrossRef]
  62. Usón, A.A.; Capilla, A.V.; Bribián, I.Z.; Scarpellini, S.; Sastresa, E.L. Energy efficiency in transport and mobility from an eco-efficiency viewpoint. Energy 2011, 36, 1916–1923. [Google Scholar] [CrossRef]
  63. Van der Zwaan, B.; Keppo, I.; Johnsson, F. How to decarbonize the transport sector? Energy Policy 2013, 61, 562–573. [Google Scholar] [CrossRef]
  64. Li, P.; Zhao, P.; Brand, C. Future energy use and CO 2 emissions of urban passenger transport in China: A travel behavior and urban form based approach. Appl. Energy 2017, 211, 820–842. [Google Scholar] [CrossRef]
  65. MCid; Ministério dos Transportes. Sector Plan for Transport and Urban Mobility for Mitigation and Adaptation to Climate Change (PSTM); Ministério dos Transportes: Brasília, Brazil, 2013.
  66. Redman, L.; Friman, M.; Garling, T.; Hartig, T. Quality attributes of public transport that attract car users: A research review. Transp. Policy 2013, 25, 119–127. [Google Scholar] [CrossRef]
  67. Gouvello, C. Brazil Low-Carbon Country Case Study; The World Bank: Washington, DC, USA, 2010. [Google Scholar]
  68. Baran, R. The Introduction of Electric Vehicles in Brazil: Evaluation of the Impact on Gasoline and Electricity Consumption; COPPE/UFRJ: Natal, Brazil, 2012. [Google Scholar]
  69. Mercier, J.; Carrier, M.; Duarte, F.; Tremblay-Racicot, F. Policy tools for sustainable transport in three cities of the Americas: Seattle, Montreal and Curitiba. Transp. Policy 2016, 50, 95–105. [Google Scholar] [CrossRef]
  70. De Araújo, T.O.F. A Study of a Basic System of Tramway in Natal-RN. Available online: https://monografias.ufrn.br/jspui/handle/123456789/5390 (accessed on 31 October 2018).
  71. Macedo, J.E.J. Study of Trolleybus Line in Natal. Available online: https://monografias.ufrn.br/jspui/handle/123456789/3636 (accessed on 31 October 2018).
  72. Gudipudi, R.; Lüdeke, M.K.B.; Rybski, D.; Kropp, J.P. Benchmarking urban eco-efficiency and urbanites’ perception. Cities 2017, 74, 109–118. [Google Scholar] [CrossRef]
  73. Dhakal, S. Implications of transportation policies on energy and environment in Kathmandu Valley, Nepal. Energy Policy 2003, 31, 1493–1507. [Google Scholar] [CrossRef]
  74. Associação Nacional dos. Fabricantes de Veículos Automotores—ANFAVEA Estatísticas 2015—ANFAVEA. Available online: http://www.anfavea.com.br/estatisticas-2015.html (accessed on 5 February 2018).
  75. Notícias Automotivas Utilitários e SUV a Diesel Vendidos no Brasil—Notícias Automotivas. Available online: https://www.noticiasautomotivas.com.br/conheca-os-utilitarios-suv-diesel-vendidos-no-brasil/ (accessed on 5 February 2018).
  76. Finnveden, G.; Åkerman, J. Not planning a sustainable transport system. Environ. Impact Assess. Rev. 2014, 46, 53–57. [Google Scholar] [CrossRef]
  77. Bart, I.L. Urban sprawl and climate change: A statistical exploration of cause and effect, with policy options for the EU. Land Use Policy 2010, 27, 283–292. [Google Scholar] [CrossRef]
  78. Deal, B.; Pan, H.; Timm, S.; Pallathucheril, V. The role of multidirectional temporal analysis in scenario planning exercises and Planning Support Systems. Comput. Environ. Urban Syst. 2017, 64, 91–102. [Google Scholar] [CrossRef]
  79. Pan, H.; Deal, B.; Destouni, G.; Zhang, Y.; Kalantari, Z. Sociohydrology modeling for complex urban environments in support of integrated land and water resource management practices. Land Degrad. Dev. 2018. [Google Scholar] [CrossRef]
  80. Kennedy, C.; Pincetl, S.; Bunje, P. The study of urban metabolism and its applications to urban planning and design. Environ. Pollut. 2011, 159, 1965–1973. [Google Scholar] [CrossRef] [PubMed]
  81. Hankey, S.; Marshall, J.D. Impacts of urban form on future US passenger-vehicle greenhouse gas emissions. Energy Policy 2010, 38, 4880–4887. [Google Scholar] [CrossRef]
Figure 1. Study area, city of Natal.
Sustainability 10 03995 g001
Figure 2. Base data for calculation of emissions of sub-sectors of urban transport. 1a, 1b, 1c, 1d Base data from [47]. 2 Base data from [50]; 3 Base data from [46]; 4 Base data from [51]; 5 1a–2–3–4.
Sustainability 10 03995 g002
Figure 3. Obtained urban transport emissions in Natal, 2012–2015 (thousand tCO2eq).
Sustainability 10 03995 g003
Figure 4. Obtained emissions by sub-sector of urban transport (thousand tCO2eq) for 2015.
Sustainability 10 03995 g004
Figure 5. Obtained emissions per passenger of urban transport subsectors (kgCO2eq) for 2015.
Sustainability 10 03995 g005
Figure 6. City and intercity buses: CO2 emissions in 2015.
Sustainability 10 03995 g006
Figure 7. Participation of diesel vehicles in total automobiles and light commercial vehicles sales between 2012–2017.
Sustainability 10 03995 g007
Figure 8. Obtained emission and mitigation scenarios (thousand tCO2eq).
Sustainability 10 03995 g008
Table 1. Total fuel sales in the municipality of Natal Roadwork Department (RN): 2012 to 2015.
YearAutomotive Gasoline (L)Ethanol (L)Diesel Oil (L)Vehicular Natural Gas (VNG) (m3)
2015206,748,247.0021,790,643.00107,088,571.0017,348,874.00
2014213,288,505.0013,616,587.0097,189,243.0017,808,217.00
2013205,480,285.0016,542,789.00100,040,426.0019,106,001.00
2012192,307,694.0015,985,976.0089,030,896.0020,534,658.00
Data consolidated by the author. Primary data sources: [47,49].
Table 2. Public road transport data granted by the municipality of Natal/RN: 2015.
Public Transport ServiceType of Vehicle Fleet Fleet (Amount)Mean Age of the Fleet (Years)Annual Distance Traveled (km)
REGULAR 1Diesel city bus6467.562,881,236.00
REGULAR 2Diesel micro-bus1777.517,597,340.00
Data consolidated by the author. Primary data source: [46].
Table 3. Public rail transport (2012 to 2015) in Natal.
YearNumber of PassengersDiesel Fuel Consumption (L)Fleet
20152,408,458420,687Two locomotives and three light rail systems
20141,541,000395,001Two locomotives and two light rail systems
20131,545,000403,475Four locomotives
20121,851,000242,276Four locomotives
Data consolidated by the author. Primary data source: [50].
Table 4. Estimation of the participation of the cargo sector in total diesel consumption for 2007.
AmountsRouteType of VehicleMean AgeDmt (km)
6901 daily tripsNatal—other destinationsHeavy-Duty Diesel Truck 200213
6601 daily tripsOther destinations—NatalHeavy-Duty Diesel Truck200213
13,073 daily tripsIntramunicipal travelMedium-Duty Diesel Truck200225
Estimated diesel consumption (L)20,516,793.16
Annual consumption in 2007 (L)100,034,207.00
Percentage participation cargo sector20.5%
Source: author, fuel sales data, and PlanMob 2007 [47,55].
Table 5. Public rail transport (2012 to 2015) in Natal.
Urban Mobility ScenarioIncreased Fuel Consumption by 2020Increased Fuel Consumption by 2025
1—business as usual10.1%22.2%
2—with interventions9.2%20.5%
Source: [53].
Table 6. Projection of individual motorized daily trips presented by the Municipal Transportation Planning.
Diagnosis in 2015Projection for 2020Projection for 2025
1,046,7971,127,3971,215,331
Source: [53].
Table 7. Obtained urban transport greenhouse gas (GHG) emissions of the municipality of Natal 2012–2015 (thousand tCO2eq).
2012201320142015
Gasoline355.6364.2369.9351.0
Ethanol0.20.20.20.3
Diesel224.6252.8243.9264.9
VNG43.540.437.736.7
Total624.0657.7651.7653.0
Table 8. Obtained urban transport emissions of the municipality of Natal and its sub-sectors in 2015.
ActivityEmissions in Metric Tons of CO2 Equivalents (Thousand tCO2eq)% Participation
Total Urban Transport653.0100%
City buses84.513.0%
Intercity transport11.01.7%
Urban trains1.10.2%
Freight and urban services169.426.0%
Private motorized transport386.959.3%
Table 9. Obtained urban transport CO2eq emissions in Natal: scenarios for 2020 and 2025. CPMob1 and CPMob2: Urban Mobility Plans’ total CO2 emissions for Netal for 2020 and 2025, respectively. CM1 and CM2: data for the proposal of a further two scenarios focused on reducing GHG emissions based on public urban mobility policies and more intense actions, respectively.
Total Emissions (Thousand tCO2eq)Reduction of Emissions in Relation to CPMob1 (2025)
201520202025
CPMob1652.95717.74797.54-
CPMob2711.89786.50−1.38%
CM1710.05764.60−4.13%
CM2708.82752.74−5.62%
Table 10. CO2eq reduction of the mitigation scenarios in 2025 (thousand tCO2eq).
Cycle Plan DeploymentInsertion of Electric BusesImplementation of Trolleybus LinesImplementation of the Tramway System
CM112.436.183.25
CM212.249.313.258.76

