Article

Urban Expansion and Farmland Loss in Beijing during 1980–2015

1
College of Land Science and Technology, China Agricultural University, Beijing 100193, China
2
Institute of Geographic Sciences and Natural Resources Research, Chinese Academy of Sciences, Beijing 100101, China
3
University of Chinese Academy of Sciences, Beijing 100049, China
4
Real Estate Management Office of Nanchang Economic and Technological Development Zone, Nanchang 330013, China
*
Author to whom correspondence should be addressed.
Sustainability 2018, 10(11), 3927; https://doi.org/10.3390/su10113927
Submission received: 28 September 2018 / Revised: 19 October 2018 / Accepted: 23 October 2018 / Published: 29 October 2018
(This article belongs to the Section Sustainable Urban and Rural Development)

Abstract

:
The analysis of urban land expansion and farmland loss is essential to adequately understand the land use change in a rapidly urbanizing China. We found that both urban expansion and farmland loss in Beijing experienced high- and low-speed stages and their spatial patterns were consistent during the past 35 years as most of the newly expanded urban land was converted from farmland. The area of farmland loss by urban expansion in Beijing is 12.6 km2/year, 39.86 km2/year, 23.38 km2/year, and 41.11 km2/year during the period of 1980–1990, 1990–2000, 2000–2010, and 2010–2015, respectively. The urban expansion in Beijing continuously preferred to consume “above average” quality farmland during 1980–2015. Meanwhile, although the urban expansion in Beijing was highly dependent on occupying farmland, the dependence of urban expansion on farmland consumption has declined over time. However, the contribution of urban expansion on farmland loss increased during 1980–2010 and decreased afterward. In order to protect the farmland from urban expansion, we call for more effort to improve the urban land use efficiency with rigid controls over areas of urban expansion.

1. Introduction

Urbanization is an increasing phenomenon all over the world that is expected to go further over the coming decades. The world urban population has increased from 29.6% (745 million) in 1950 to 53.6% (3.88 billion) in 2014 and is projected to be at approximately 66.4% (6.34 billion) by 2050 [1]. As the most populous country in the world, China has been experiencing an unprecedented and remarkable urbanization process since its Reform and Opening-Up [2]. The urban population in China rose from 17.92% in 1978 to 55.88% in 2015 [3], an increase of nearly 600 million people. According to the latest forecast by the World Bank [4], almost 70% of the Chinese population—about one billion—will live in urban areas by 2030.
This ongoing rapid urbanization process has inevitably profoundly reshaped the land use pattern in China, primarily characterized by intensive urban sprawl and continuous farmland loss [5,6]. Rapid urban expansion may cause changes in regional climate [7,8,9], hydrology [10,11], biodiversity and ecosystem [12,13,14,15], while the farmland loss has negative impacts on food production [16,17,18]. These two typical land use changes with consequentially significant impacts have drawn scientific interest and it is documented that the urban land expansion of a city can be inextricably associated with farmland loss in former rural areas. These are the two sides of the rural-to-urban transformation found in the urbanization process [5,19]. On the one hand, farmland is a major land source for urban expansion in China. According to Liu’s [20] work on 57 sample cities in China, 56.51% of newly increased urban land from the 1970s to 2013 was converted from farmland. The area of farmland occupied by urban land was much larger than other nonurban land like rural settlement, woodland, and grassland. On the other hand, although the farmland loss is partially attributed to ecology restoration (e.g., grain for green) and agricultural structure adjustment (e.g., the conversion of farmland to orchard and fishponds), a crucial driver has been the conversion of farmland to urban land [21,22]. Thus, the comprehensive analysis of urban land expansion and farmland loss is necessary to adequately understand the land use change in the urbanization process.
Numerous existing studies have summarized the spatiotemporal patterns of urban land expansion at different scales [23,24,25,26], revealed the similarities and differences of urban expansion across different regions [27,28,29], explored its transitional mechanisms and driving forces [30,31,32,33], and simulated and forecasted urban expansion in the future [34,35,36]. In addition to urban land expansion, continuous farmland shrinkage has also received much attention from scholars and politicians in recent years. Most existing researches about farmland loss have focused on the spatiotemporal patterns [37,38,39], influencing factors [40,41], the impact on grain production and food security [42,43], as well as the protection policy analysis [44,45,46]. Those studies usually took urban expansion or farmland loss as a relatively independent phenomenon and payed little attention to the interrelation of these two phenomena. Little has been written on the precise contribution of urban expansion to farmland shrinkage and the spatiotemporal variation of this contribution, as well as the dependence of urban expansion on farmland consumption.
Moreover, some research on farmland loss in urban expansion has summarized its quantity change and spatiotemporal pattern [47,48,49,50] while having paying little attention to its quality characteristic. Since quality degradation is another vital aspect of farmland loss in urban expansion, besides quantity decrease, which has a negative impact on grain production and food security [18,42,51], several studies emphasized the preference of high-quality farmland consumption in urban expansion [18,52]. Therefore, the comprehensive analyses of quantity and quality characteristics of farmland consumed in urban expansion is of particular importance for understanding the farmland loss in the urban expansion process.
In order to fill the gaps mentioned above, we chose Beijing as the study area to carry out our research. This study attempts to analyze the spatiotemporal patterns of urban expansion and farmland loss over the past 35 years, determine the magnitude, locations and quality of the farmland consumed by urban expansion, and evaluate the interaction of urban expansion and farmland loss quantitatively by developing and applying two relative indicators of the relative farmland consumption by urban expansion.

2. Materials and Methods

2.1. Study Area and Data Sources

Beijing, located in the northwest of the North China Plain (between 39°38′–40°51′ N and 115°25′–117°30′ E), covers an area of 16,410.54 km2 with an average elevation of 43.71 m. The north-west of the city is dominated by mountains and hills, accounting for 62% of the area, while the central and southeastern are flat plains. As the capital of China, as well as the political and cultural center of the country, Beijing is one of the largest metropolises by both area and population in China. As an advancing miniature of urbanizing China, Beijing is clearly undergoing a rapid urbanization at a faster pace than most other cities with an urban population growth from about 5.21 million (57.62%) in 1980 to 18.78 million (86.51%) in 2015 [53].
The five land use maps (1980, 1990, 2000, 2010, and 2015) used to analysis the urban expansion and farmland loss were made by the Institute of Remote Sensing Applications, Chinese Academy of Sciences, using MODIS and Landsat-TM images [54,55]. The resolution of land use maps in 1990, 2000, and 2010 is 100 m while the land use map in 1980 is 1 km. The land use map for 1980 was based on satellite images from the 1980s as the lack of satellite images in 1980, and it is the earliest land use map that can be made using satellite images [55]. This might lead to some variations in the data.
The classification system of the land use maps includes six primary classes (farmland, forest, grassland, water body, construction land and unused land) and 25 sub-classes. The construction land is further divided into three subclasses including urban land, industrial land, and rural settlements. The objects of the study are farmland in general categories and urban land in subclasses. A large number of field surveys were conducted to assess the accuracy of the database and the overall accuracy of the 25 sub-classes of land use was above 91.2%, and the accuracies of farmland and urban land were over 91.86% [23,56].
In addition to the land use maps above, we also employed two maps of the soil and Digital Elevation Model (DEM) to evaluate farmland quality. The soil map, which contained the information of soil texture, soil profile, bulk density, effective soil thickness, and soil organic matter, was collected from 1979 to 1985 during the 2nd China national soil survey. It is the most authoritative official soil data and has been widely used in many researches until now [55]. The DEM data was obtained from the International Scientific Data Service Platform, with a resolution of 30 m. Using DEM, the slope was calculated by slope tool in spatial analyst in the ArcGIS 10.0 software and the resolution was resampled to 100 m using a bilinear interpolation technique. The five soil attributes of the soil map mentioned above were converted into several raster layers for further farmland quality calculation and the resolution was set to 100 m in order to be compatible with the land use data.

2.2. Analysis of the Rates and Patterns of Urban Land Expansion and Farmland Loss

2.2.1. Rate and Intensity of Urban Expansion and Farmland Loss

Two indexes to quantify the magnitude of urban expansion are defined as follows.
Er = (Ub − Ua)/Ua × 1/T × 100%
Ei = (Ub − Ua)/A × 1/T × 100%
where Er denotes the urban expansion rate and Ei is the urban expansion intensity during the study period. Ua and Ub are the amount of urban construction land use at the beginning and end of the study, respectively. A is the total area and T denotes the duration of the study.
Similarly, two indexes to quantify the magnitude of farmland loss are defined as follows.
Lr = (Fa − Fb)/Fa × 1/T × 100%
Li = (Fa − Fb)/A × 1/T × 100%
where Lr denotes the farmland loss rate and Li is the farmland loss intensity during the study period. Fa and Fb are the amount of farmland use at the beginning and end of the study, respectively. T denotes the duration of the study.
Er (Lr) directly measure the annual area change rate of urban land (farmland), which is effective for comparison of urban expansion (farmland loss) in different periods, while the latter Ei (Li) eliminates the size effect of regions inside the city and is more appropriate for comparison of urban expansion (farmland loss) in different regions during the same period.

2.2.2. Spatial Patterns of Urban Expansion and Farmland Loss

To describe the detailed spatial patterns of urban land expansion and farmland loss, we used the ArcGIS 10.0 software to make the directional and concentric map of the study area from the city center at Tiananmen Square, located in 39°54′27″ N, 116°23′17″ E. Rays extending from the city center were drawn with equal intervals of 22.5° from the direction of 11.25° northeast and divided the study area into 16 sectors (Figure 1). Meanwhile, 26 buffer rings covering the city were generated at intervals of 5 km in order to discern the spatial patterns of urban expansion and farmland loss in different distances from the city center.

2.3. Evaluation of the Farmland Lost by Urban Expansion

2.3.1. Quantity Assessment

To assess the relative consumption of farmland for urban expansion, two quantitative indicators were developed as follows.
CI = FTU/AUE
FI = FTU/AFL
where CI is the dependence of urban expansion on farmland consumption, FI is the contribution of urban expansion on farmland loss; FTU is the area of farmland consumed by urban expansion, AUE is the total area of urban land transfer in and AFL is the total area of farmland transfer out. Since the resolution of the land use map in 1980 was different from that in 1990, the land use map in 1990 was resampled to 1 km when calculating the transition matrix during 1980–1990.
Both the value of CI and FI range from 0 to 1. The higher the CI, the greater the dependence of urban expansion on farmland consumption. If CI equals 1, it means that all the urban expansions are at the cost of farmland. Similarly, the higher the FI, the greater the contribution of urban expansion on farmland loss. If FI equals 1, it means that all the lost farmland is converted to urban land. To demonstrate the spatiotemporal variation of the aforementioned trends, the CI and FI during periods 1980–1990, 1990–2000, 2000–2010, and 2010–2015 in 5 × 5 km grids were mapped. Different sizes of the grid were tested, ranging from 2 km to 10 km, with increasing steps of 1 km and 5 km was eventually selected. An increase in the grid size decreases the spatial resolution of the map, while smaller grids do not display the regularity of spatial distribution well.

2.3.2. Quality Evaluation

In addition to the quantity analyses above, the quality of farmland lost by urban expansion was evaluated. The land quality in this paper refers to the land’s ability to perform a crop production function and the associate natural attributes (e.g., soil fertility) were mainly considered. Six indicators were chosen in this paper based on data availability, previous related research and the indicators of land quality recommended by the Ministry of Land and Resources in the Gradation on Agricultural Land Quality in the Regulation for Gradation on Agriculture Land Quality (RGALQ) [57]. The RGALQ also summarized the grading and scores of quality indicators in different regions and the indicator with greater influence was assigned a higher weight. Based on the rules of RGALQ [57] and the joint consideration of relevant studies [52,58] and the expert knowledge about the local conditions, the scores and weights of the indicators were determined and presented in Table 1.
Using the above six indicators, the farmland quality in Beijing was assessed through the following equation.
Q = i = 1 6 S i × W i
where Q is the quality score, Si is the score of indicator i (Table 1), Wi is the weight of indicator i, i is the number of indicators, ranging from 1 to 6. The quality score was calculated based on the data of the slope and soil attributes, and the farmland quality maps were extracted using the land use maps. The computations were finished through the tool of the raster calculator and extracted by mask in the ArcGIS 10.0 software.
Based on the values of Q, the quality of farmland lost by urban expansion can be identified by the following equation:
QI = QFTU/QF
where QI is the quality index of farmland lost by urban expansion, QFTU is the average quality score of farmland consumed by urban expansion, QF is the average quality score of the total farmland. If QI is higher than 1, it means that the quality of farmland lost by urban expansion is higher than the average of the whole farmland. The higher the QI, the stronger the preference of urban expansion for high-quality farmland.

3. Results

3.1. Urban Expansion in Beijing during 1980–2015

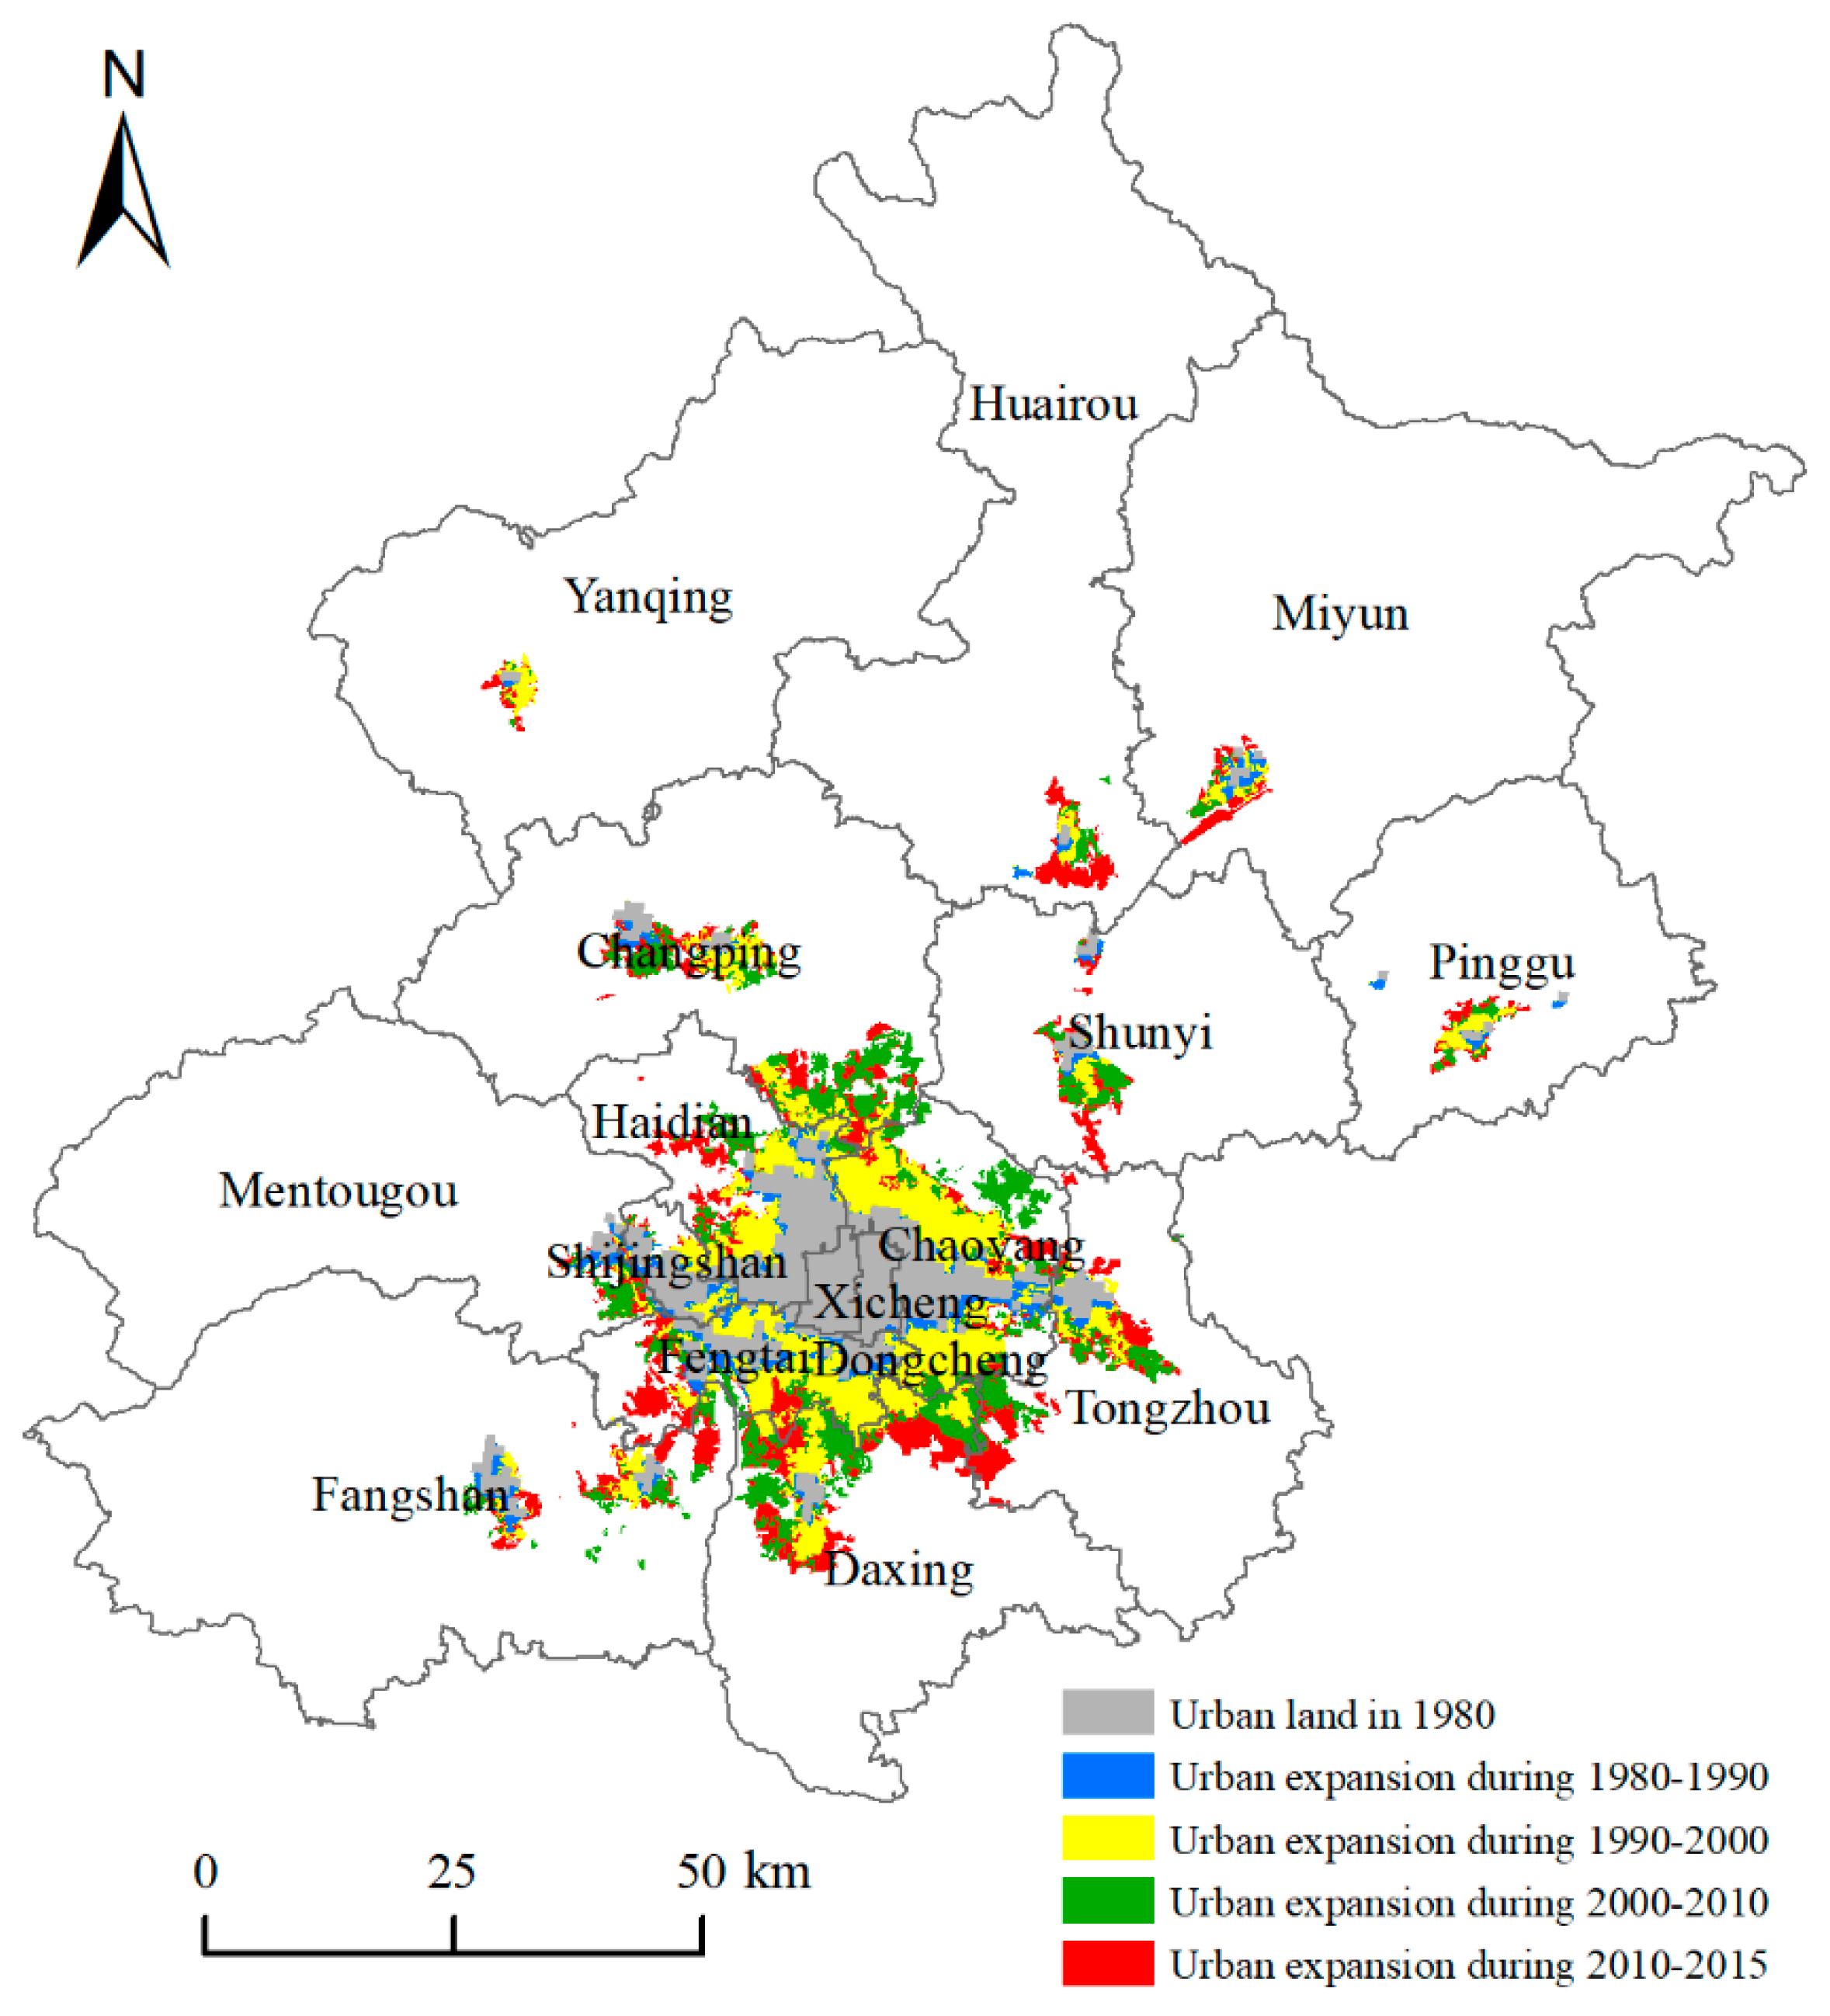
The urban area of Beijing expanded from 471 km2 in 1980 to 1642.52 km2 in 2015, with an expansion of 31.19 km2/year. Over the past 35 years, the urban area of Beijing has been continuously growing but the rate and intensity of expansion underwent some rise and fall phases (Figure 2, Table 2). During the first decade (1980–1990), urban areas only expanded 14.29 km2. In the following decade (1990–2000), the urban growth of Beijing sped up with the expansion area of 54.97 km2/year and an expansion rate of 11.33%. The urban expansion in this phase was concentrated in suburban districts. Among all the 16 districts, the most significant urban expansion occurred in Chaoyang, Fengtai and Haidian with annual expansion intensities of 3.51%, 3.47%, and 1.60%, which accounted for 29.12%, 19.29%, and 12.58% of the total urban expansion in the city. On the contrary, the annual urban expansion intensities in Mentougou, Huairou, Miyun, Yanqing, and Shunyi were under 0.10%, which constituted less than 2% of the total urban expansion. During the third phase (2000–2010), the urban growth slowed down with the expansion area of 37.17 km2/year and expansion rate of 3.59%. Compared with the previous phases, the urban expansion was mainly in exurban rather than suburban districts in this phase. The urban expansion area in Changping, Daxing, and Chaoyang accounted for 20.56%, 20.26%, and 15.63% of the total urban expansion with annual expansion intensities of 0.57%, 0.73% and 1.28%, respectively. The urban expansion in Yanqing, Miyun, Pinggu, and Huairou each accounted for less than 2% of the total urban expansion and the annual urban expansion intensities were under 0.10%. During the fourth phase (2010–2015), urban expansion mainly occurred in Daxing, Tongzhou, and Fengtai, accounted for 19.52%, 17.48% and 12.72% of the total with annual urban expansion intensities of 0.89%, 0.91% and 1.96% respectively. In contrast, urban expanded rather slowly in Yanqing, Mentougou, Miyun, Fangshan and Pinggu, and none of these districts had an annual expansion intensity of higher than 0.15% in this phase.
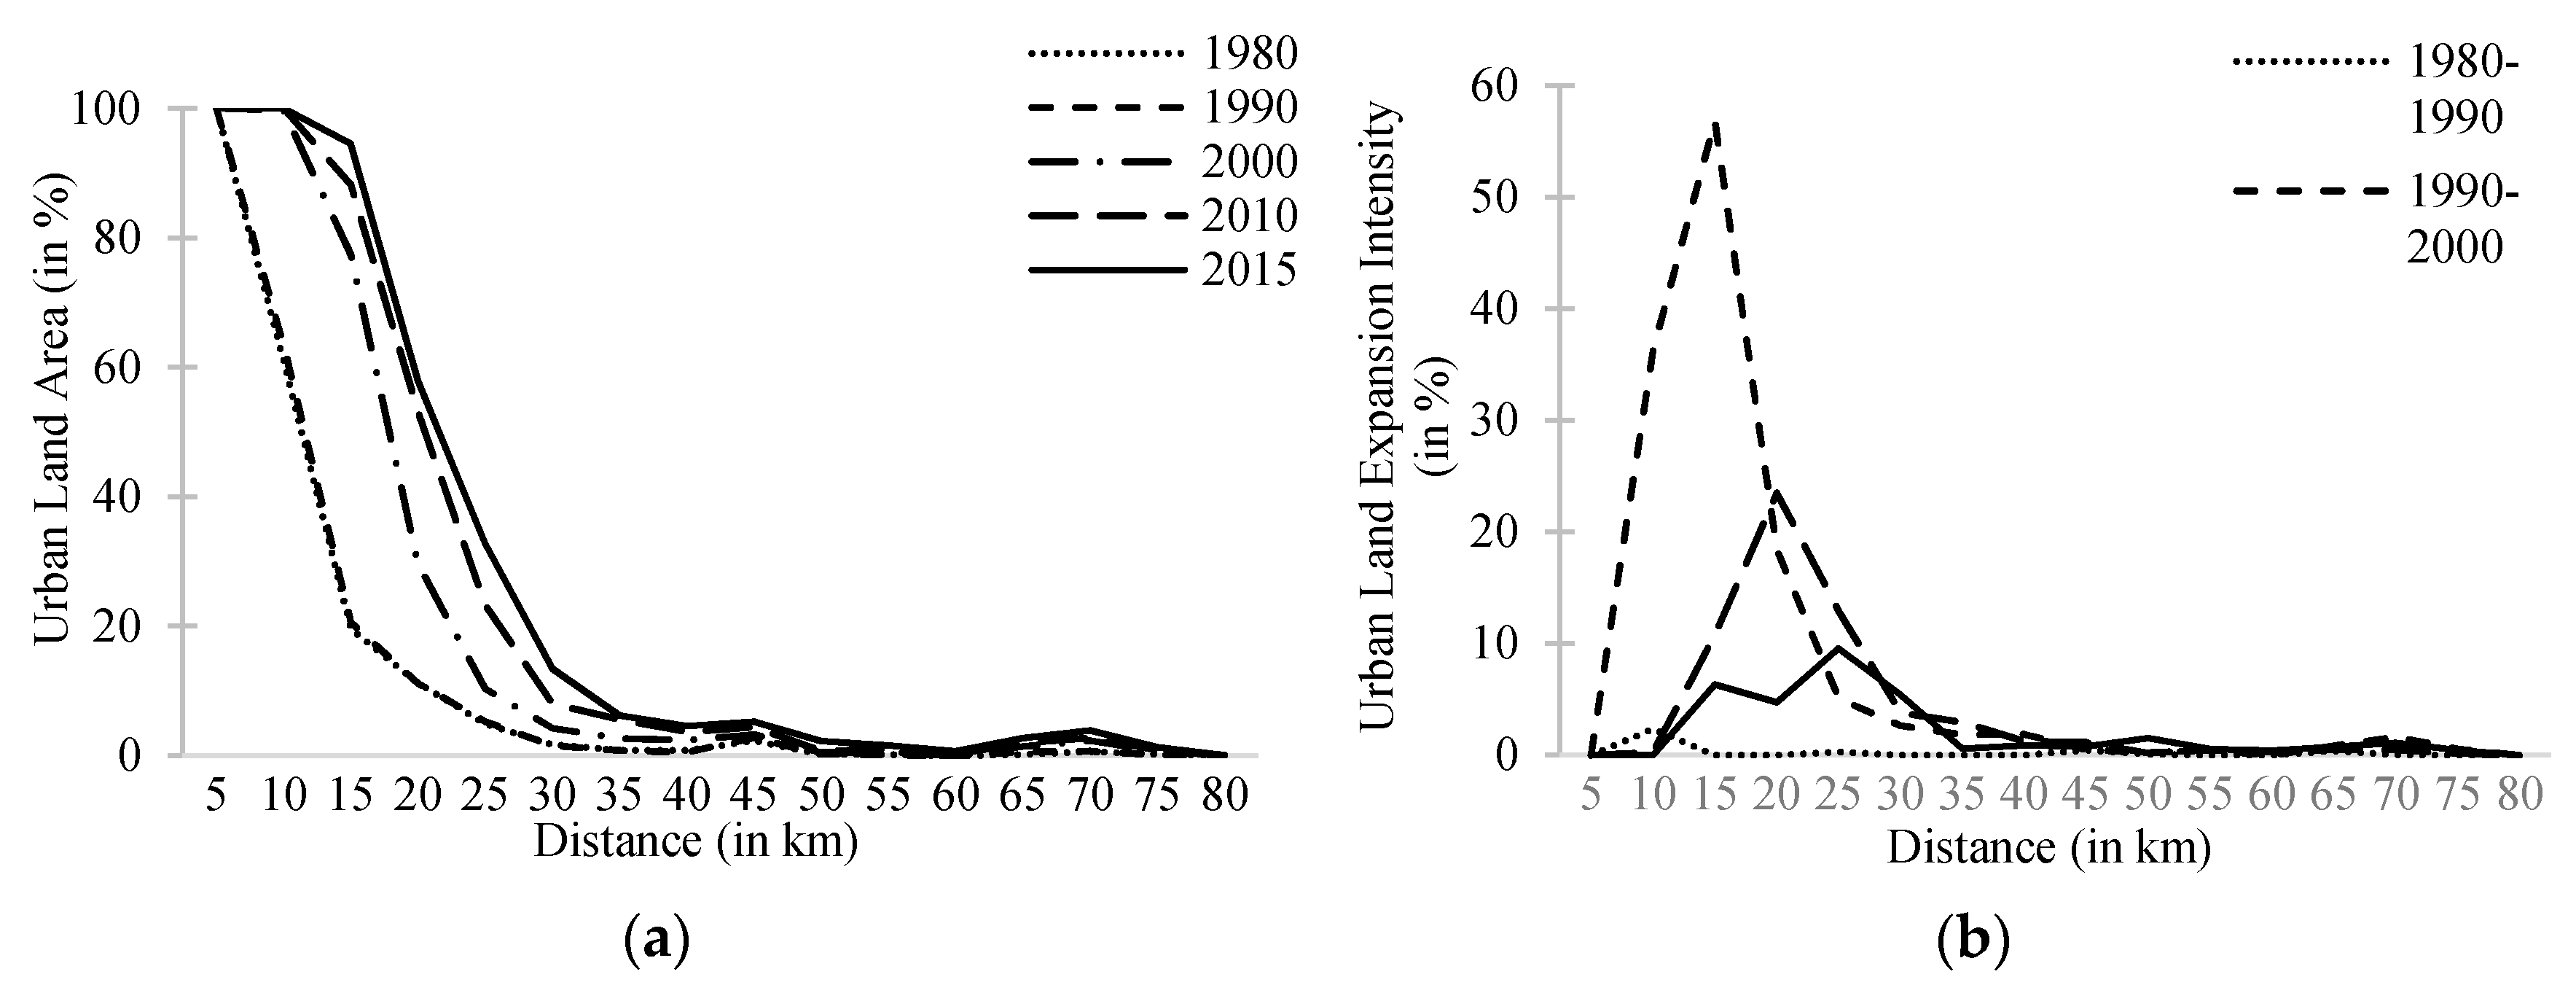
Land space in the city has always been saturating and the city fringe has been outward-spreading during the past 35 years (Figure 2). The urban land covered nearly 100% within 5 km from the city center in 1980 and 1990, while the radius of 100% urban area scope increased to 10 km after 2000. In 2010, urban land accounted for 94.53% at 10–15 km away from the center and the proportion was 57.87% at 15–20 km from the center (Figure 3a). As is revealed in the concentric circle analysis, the urban expansion intensity in Beijing varied over time and the increasing distance away from the city center over the past 35 years (Figure 3b). During 1980–1990, the urban land expansion intensity reached a peak at approximately 5–10 km away from the city center. The urban land expansion was not notable in this period since the expansion intensity never exceeded 5% in any radius and even below 1% in the distance of more than 15 km away from the center. During 1990–2000, the urban expansion was concentrated in the region of 5–25 km away from the center and the urban land expansion intensity reached a peak of 56.82% at 10–15 km away from the center. Meanwhile, urban expansion was also relatively hot in the distance of approximate 65–70 km from the center where the built-up areas of Miyun, Pinggu and Yanqing are located. During the following phase (2000–2010), the urban expansion was still concentrated in the region 5–25 km away from the center while the maximum urban expansion intensity failed to 23.49%. Meanwhile, the peak of urban expansion intensity appeared in 15–20 km from the city center, which was farther than in the former two decades. During 2010–2015, the urban land expansion intensity reached a peak of 9.55% at 20–25 km around away from the center. The peak of urban land extended intensity extended outward over time but concentrated in areas within 30 km away from the city center while the urban land expansion intensity was kept under 2% in the areas more than 30 km away from the city center, reflecting the mononuclear urban expansion of the city during the past 35 years.
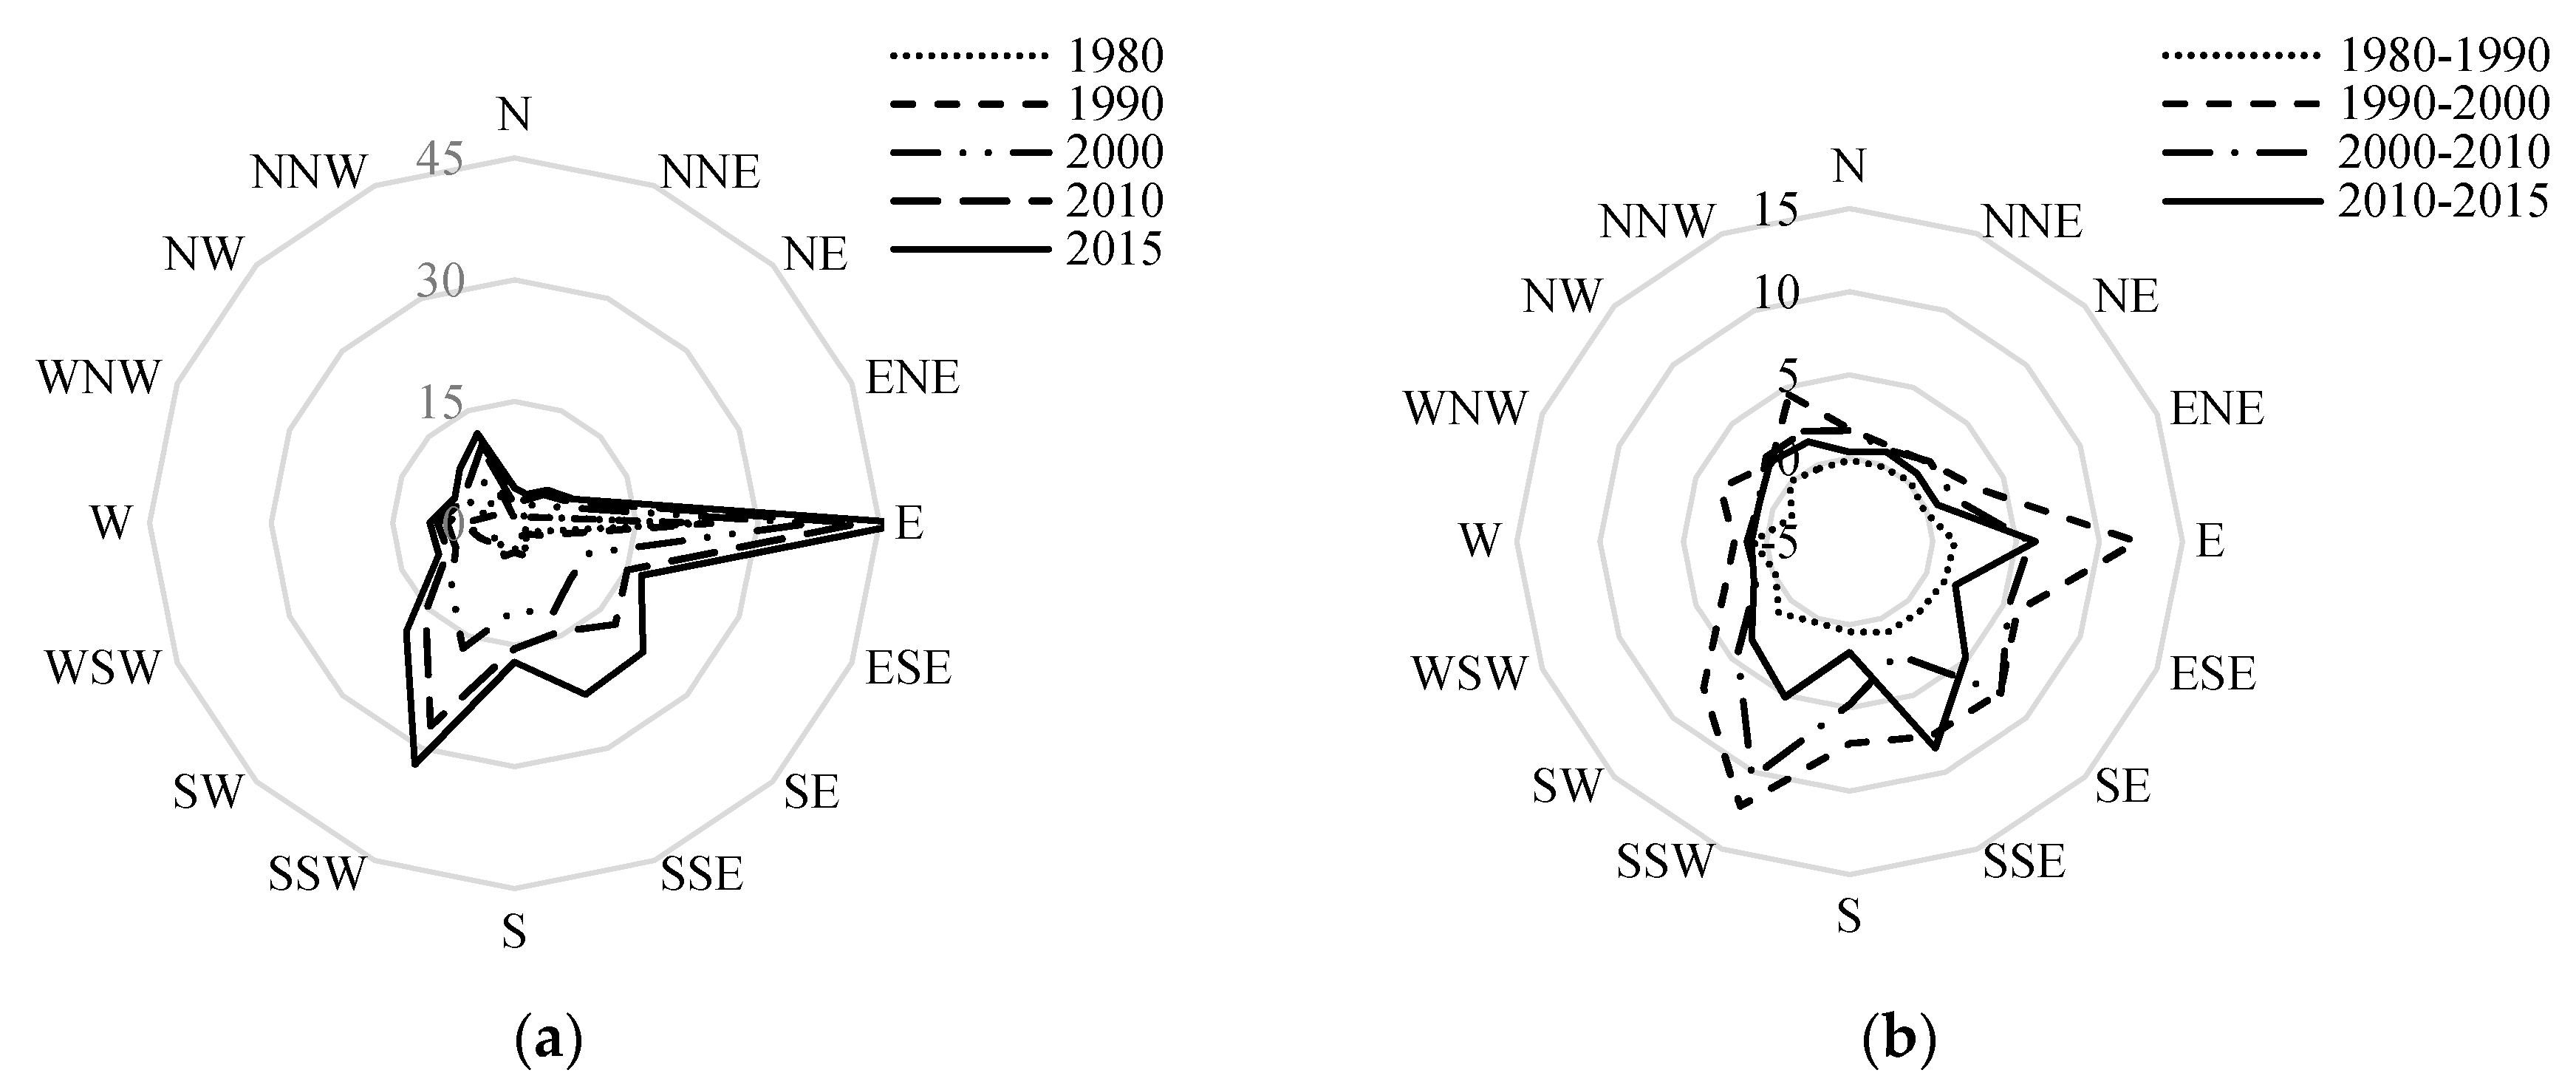
The urban area in Beijing was mainly located in the east and southeast where there are flat plains. The proportion of urban land in the E sector has been the highest among all the directions during the past 35 years and reached to 48.49% in 2015 from 22.90% in 1980 (Figure 4a). The urban percentage increased over time for most directions, but there were some distinct features for different phases (Figure 4b). From 1980–1990, the highest expansion intensity in all directions was 1.32% in the E sector, suggesting the primary slow developing stage of urbanization in Beijing after Reform and Opening-up. A few directions appeared to have negative expansion intensities, which may be caused by the resolution difference between the two land use maps. During the following stage of 1990–2000, the highest expansion intensity among all directions sped up to 12.26% in E, followed by SSW and SE with the expansion intensity of 12.20% and 7.80% respectively, reflecting the rapid urbanization in Chaoyang and Fengtai. During 2000–2010, the expansion intensity decreased and the top three sectors were SSW, SE, and E with the expansion intensities of 10.36%, 7.86% and 5.84% respectively, suggesting the sustaining urbanization of Daxing and Tongzhou. During 2010–2015, the top three sectors of urban expansion intensity were SSE, E and SSW with expansion intensities of 8.43%, 6.17%, and 5.13%, respectively.

3.2. Farmland Loss in Beijing during 1980–2015

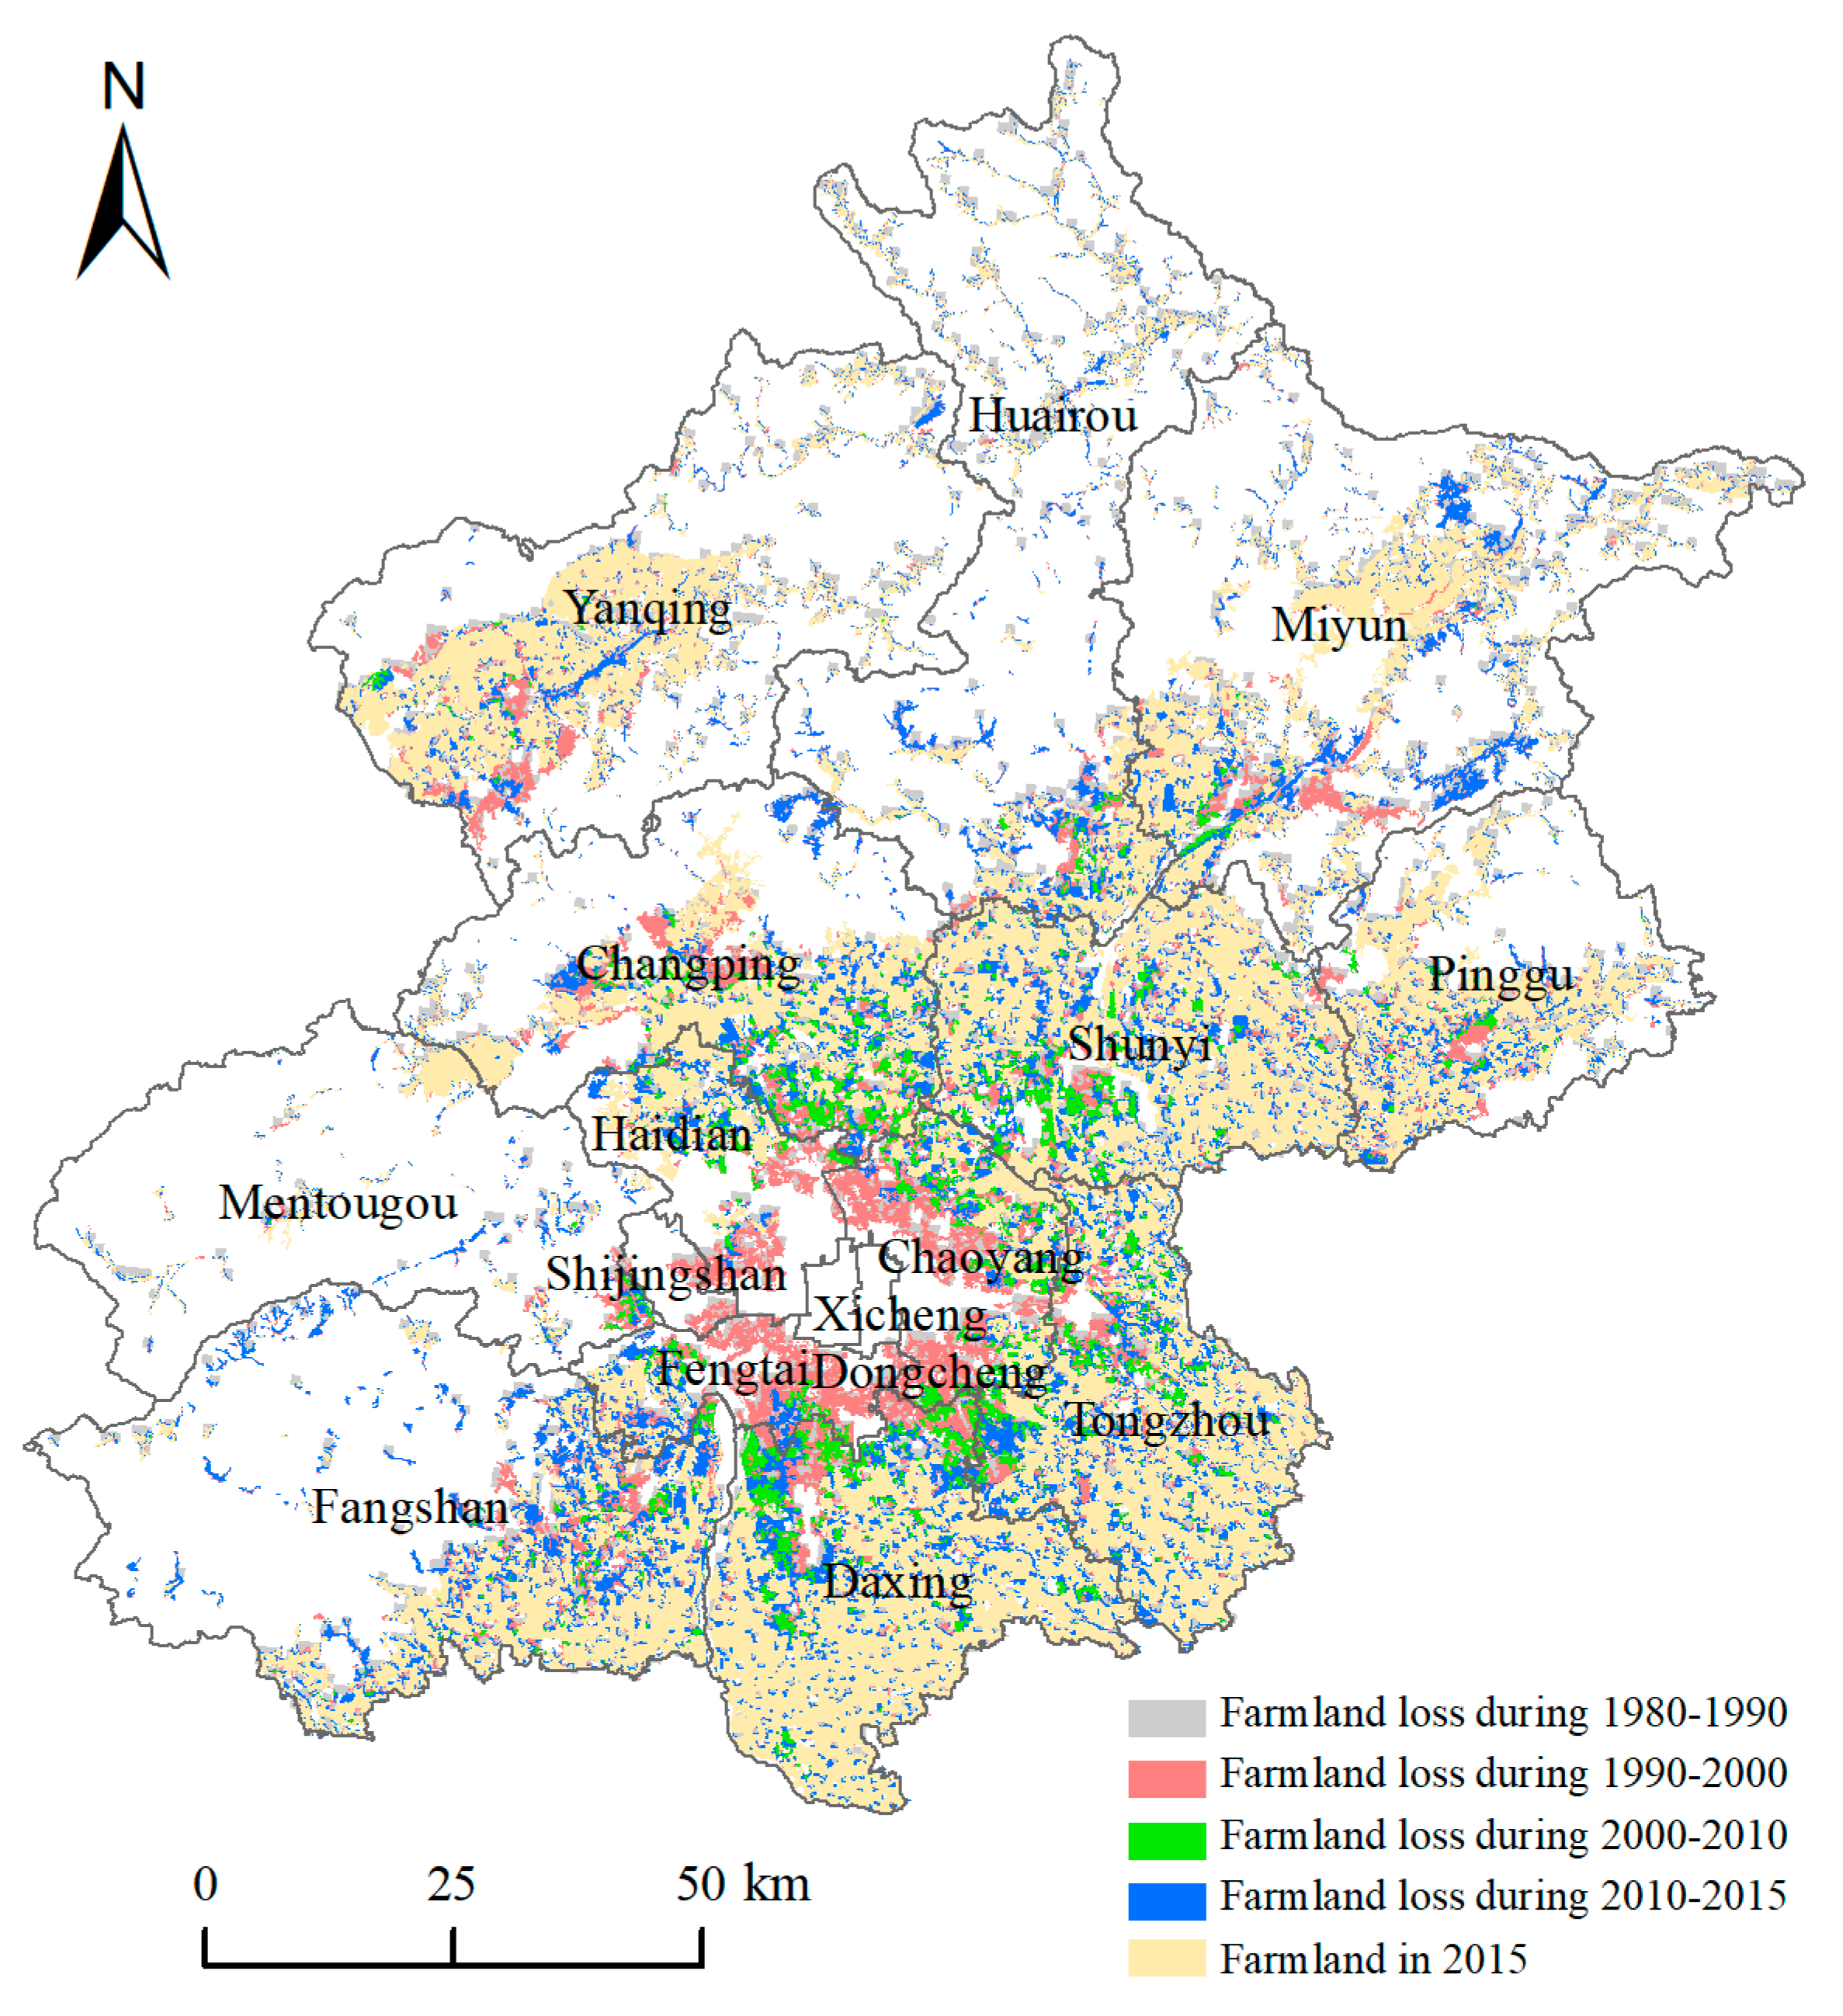
According to the land use raster data, the total amount of farmland in Beijing decreased from 5903 km2 in 1980 to 4071.20 km2 in 2015, with an annual shrinkage of 52.34 km2/year (Table 3). The shrinkage of farmland in Beijing was continuous during the past 35 years, while the reduction took on an evident process in different periods (Figure 5). During the first decade (1980–1990), the reduction of farmland area in Beijing was 47.59 km2. In the following decade (1990–2000), the farmland loss area shot up to 93.42 km2/year and the annual loss rate was 1.60%. The farmland loss in this period mainly occurred in Chaoyang, Changping, and Fengtai with annual loss intensities of 2.87%, 0.82%, and 2.90%, which accounted for 14.08%, 11.92%, and 9.56% of the total farmland loss in the city. In comparison, the farmland loss in Shijingshan, Mengtougou, Huairou, and Pinggu each contributed less than 5% of the total farmland loss.
During the third phase (2000–2010), the farmland loss of Beijing slowed down with the loss area of 48.03 km2/year and an annual loss rate of 0.98%. Most of the farmland loss in this period occurred in Daxing, Changping, and Shunyi with annual loss intensities of 0.89%, 1.28%, and 0.71%, accounting for 19.20%, 15.40%, and 15.15% of the total, respectively. The farmland loss was relatively unapparent in Mengtougou, Huairou and Pinggu, accounting for less than 2% of the total farmland loss. During the recent five years (2010–2015), the farmland loss rebounded to 73.94 km2/year and the annual loss rate increased to 1.66%. Farmland loss in this phase is mainly concentrated in Fangshan, Tongzhou and Daxing, which accounted for 27.20%, 20.36% and 15.20% of the total farmland loss. In contrast, farmland loss progressed rather slowly in Shijingshan, Yanqing and Pinggu, with an annual loss intensity under 0.1%.
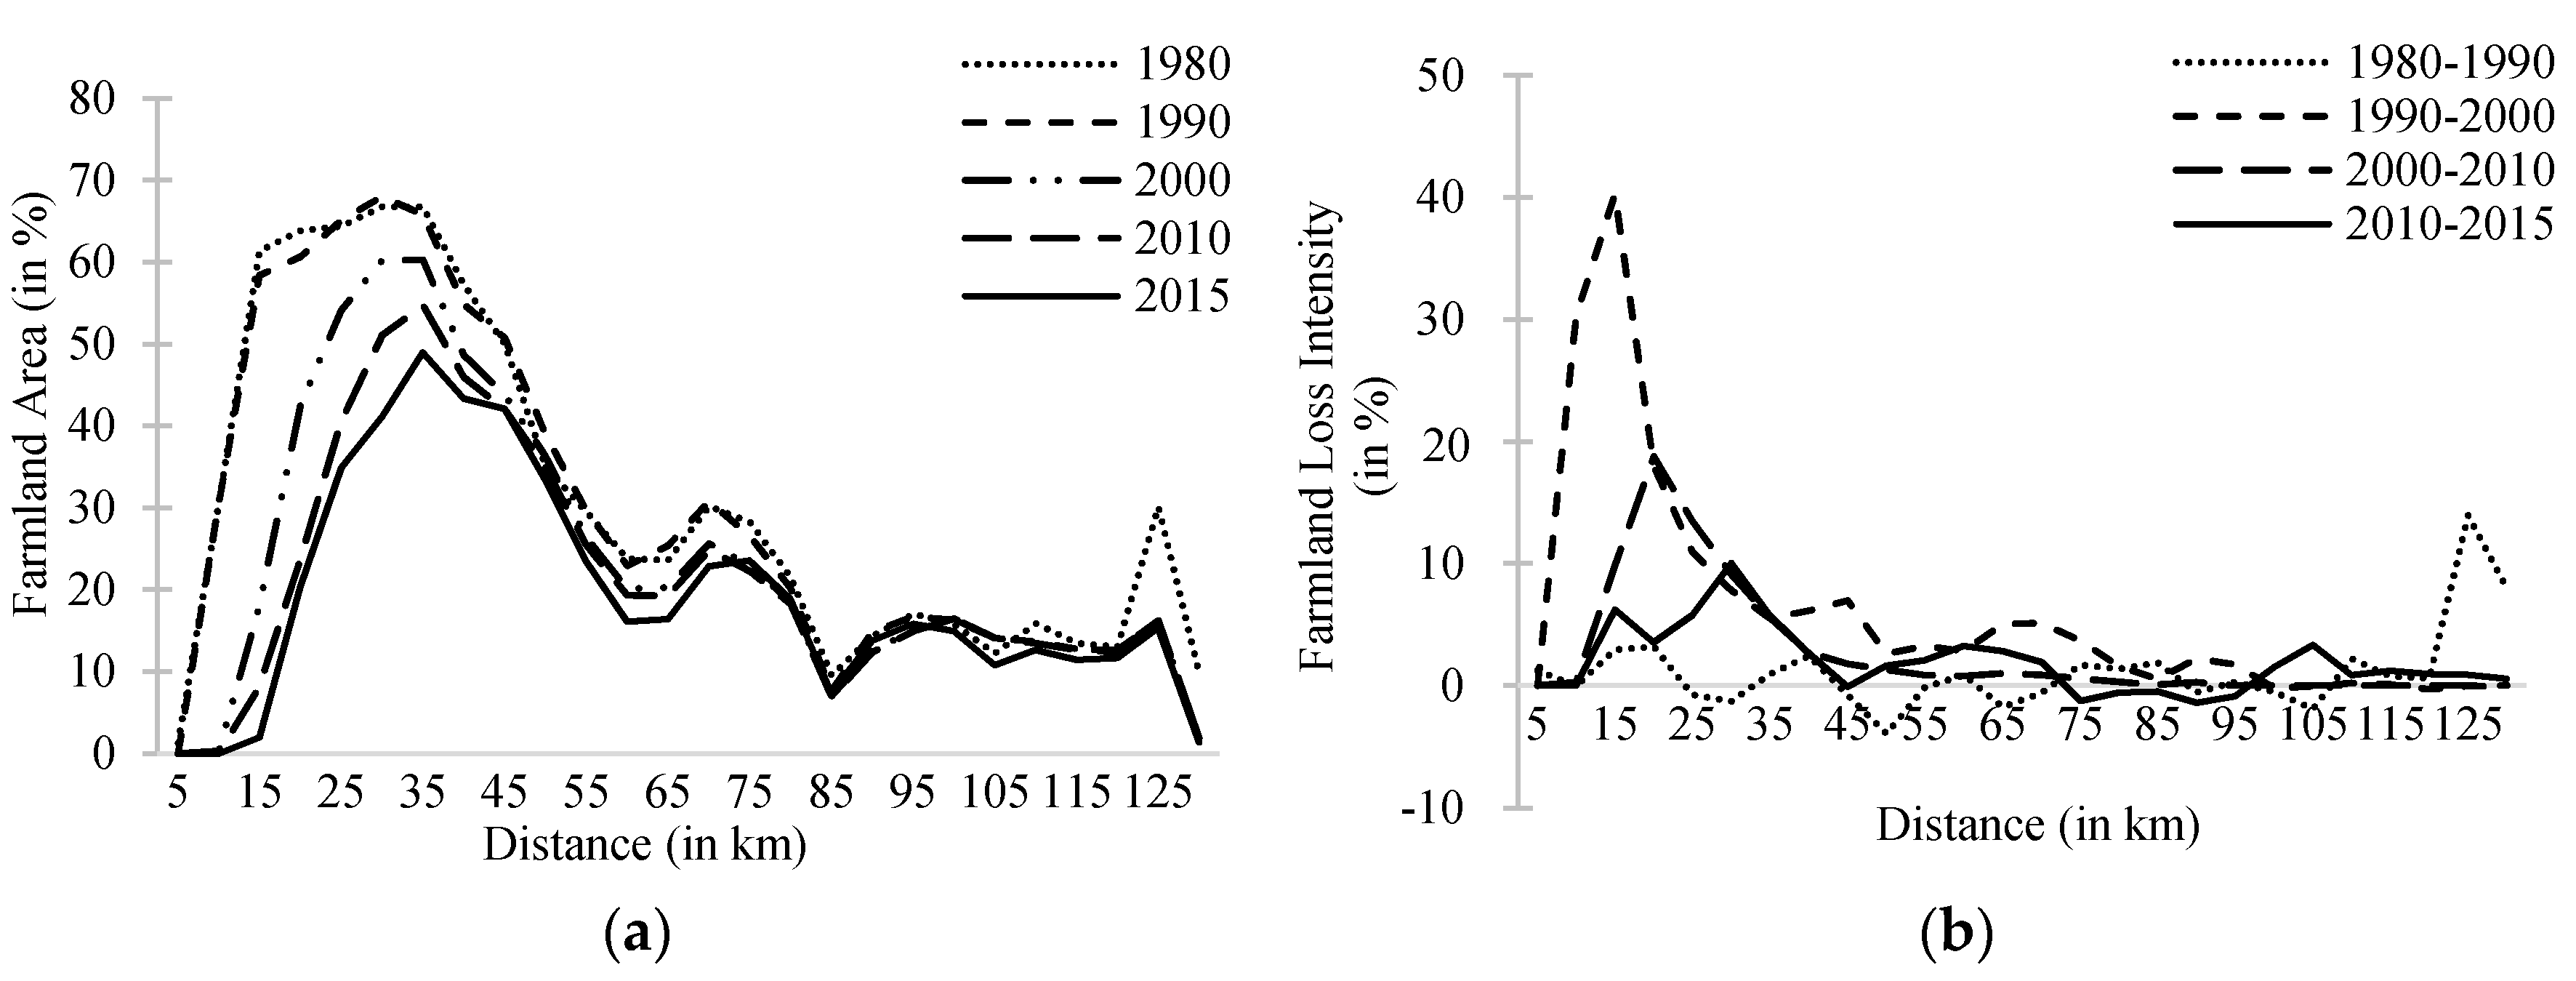
It was revealed in the concentric analysis that farmland in Beijing has shrunk outward in a layered structure and the trend varied in different stages over the past 35 years (Figure 6). During the first decade (1980–1990), the farmland loss intensity fluctuated with the increasing distance to the city center, which became negative at approximately 5–10, 20–30, 40–55, 60–70, 85–90, and 95–105 km away from the city center and reached a peak of 13.95% at approximately 120–125 km away from the city center. During the following decade (1990–2000), farmland loss was far more remarkable than the previous decade and the intensity firstly increased and then decreased with the increasing distance from the city center, peaked at 40.31% in 10–15 km. The hotspot region of farmland shrinkage extended outward to a distance of 15–20 km from the city center during 2000–2010 and the farmland loss intensity peak reduced to 18.79%. During the recent five years (2010–2015), the farmland loss intensity reached a peak of 10.03% at 25–30 km around away from the city center.
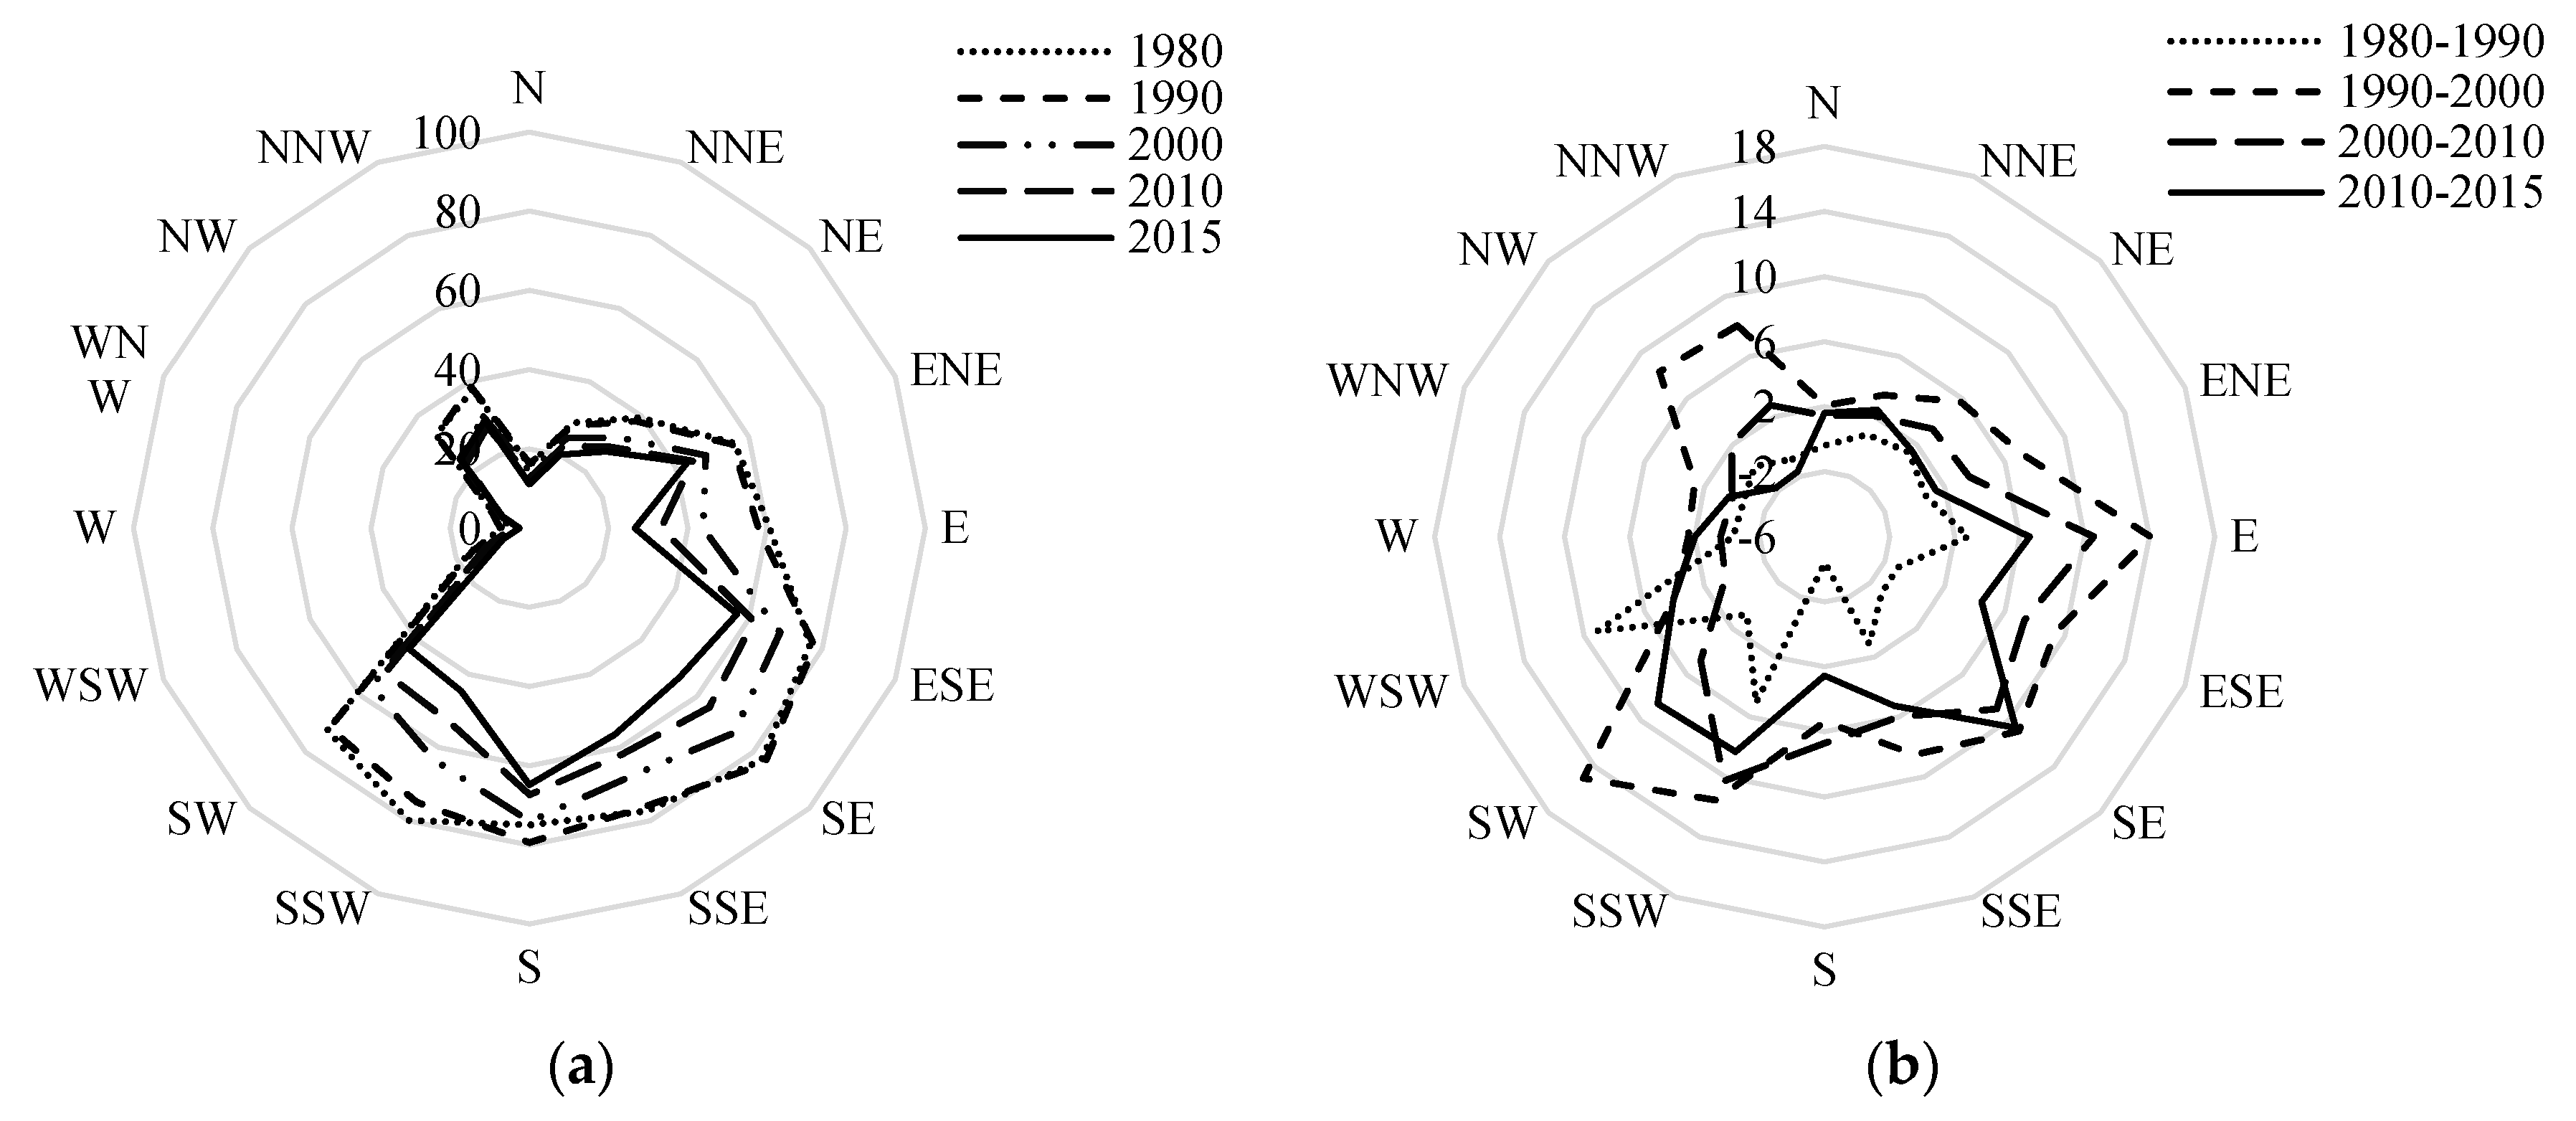
As observed from the spatial orientation of farmland distribution (Figure 7a), the sector with the highest proportion of farmland changed from SE with 82.86% in 1980 to S with 64.78% in 2015. The farmland shrinkage in Beijing occurred in almost every direction during the past 35 years, but there were some differences in different periods (Figure 7b). The highest farmland loss intensity in the all directions changed from WSW of 9.17% in 1980–1990 to SW of 15.00% in 1990–2000. During the following decade (2000–2010), the loss intensity decreased overall and the top three directions were E, SSW and SE with the loss intensities of 10.56%, 10.28% and 8.97%, respectively. During 2010–2015, the top three sectors of farmland loss intensity were SE, SW, and SSW with the expansion intensities of 10.62%, 8.52%, and 8.31%.

3.3. Dependence and Contribution of Urban Expansion on Farmland Loss

The annual area of farmland consumed by urban expansion was 12.6 km2/year, 39.86 km2/year, 23.38 km2/year, and 41.11 km2/year in the periods of 1980–1990, 1990–2000, 2000–2010, and 2010–2015, respectively. The temporal fluctuation tendency of the quantity of farmland consumed by urban expansion was in tune with the variation trend of urban expansion and farmland loss during the past 35 years.
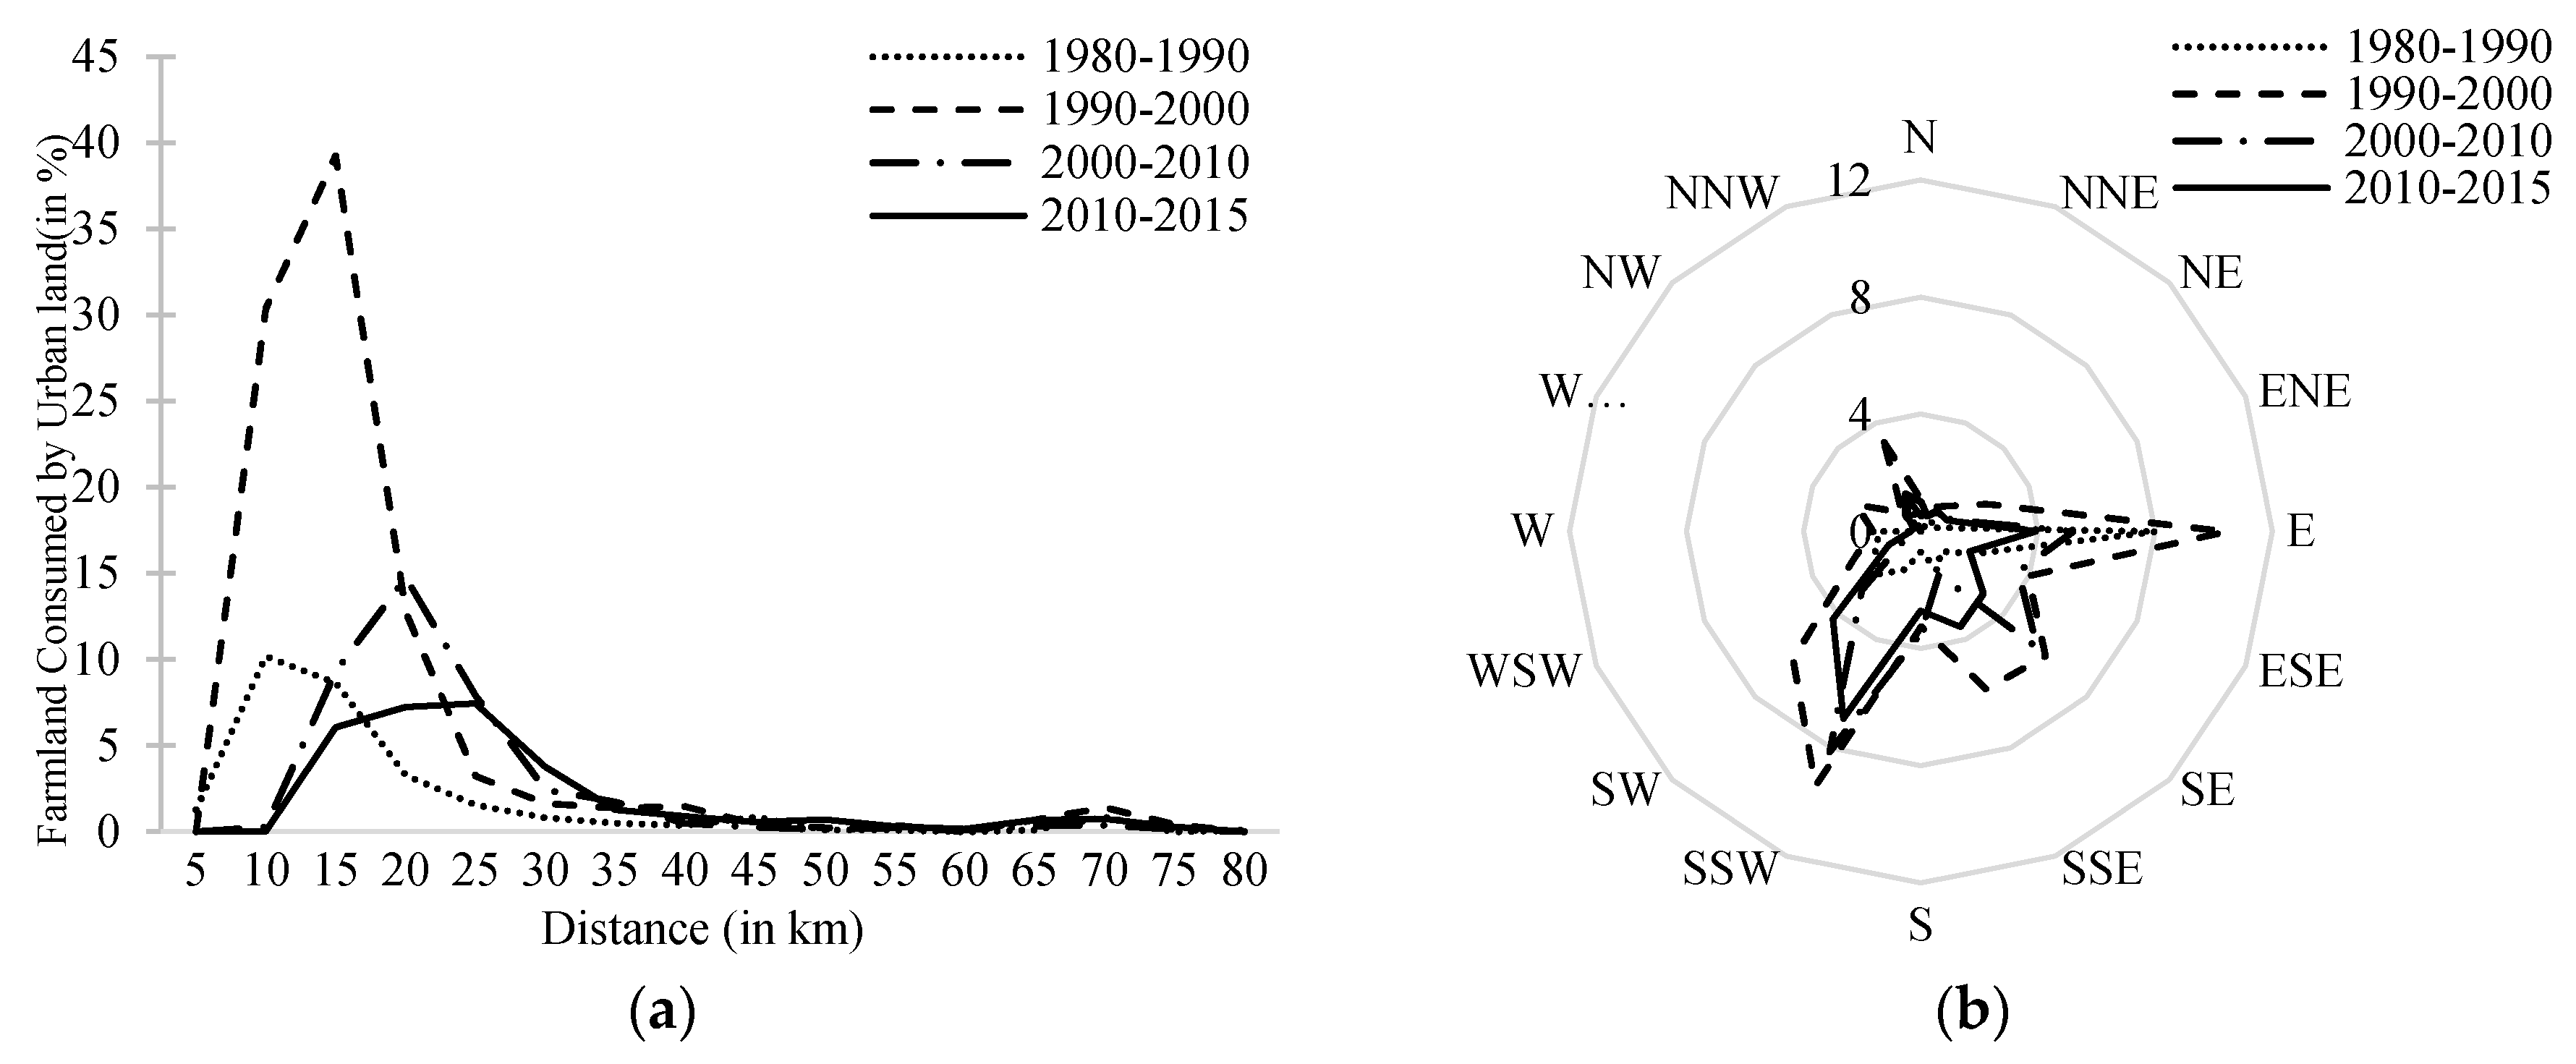
The concentric analysis revealed that the highest-risk areas of farmland lost by urban expansion gradually extended outward to a distance of 20–25 km from the city center during 2010–2015 from 5–10 km during 1980–1990, 10–15 km during 1990–2000, and 15–20 km during 2000–2010 (Figure 8a). The max intensities of farmland lost by urban expansion were 10.19%, 39.25%, 14.74%, and 7.44% in the four periods, respectively. The trend of hotspots of farmland consumed by urban expansion extended outward spatially over time was in accordance with the spatial characteristics of urban expansion and farmland loss. Meanwhile, the farmland consumed by urban expansion was mainly concentrated in the directions of E, SE, SSW, and SW (Figure 8b), which were in accordant with the orientation distribution of urban expansion and farmland loss as well.
During the past 35 years, the dependence of urban expansion on farmland consumption declined; the CI values of the periods of 1980–1990, 1990–2000, 2000–2010, and 2010–2015 were 0.75, 0.72, 0.63, and 0.57, respectively (Table 4). Farmland has always obtained the lion’s share of the land sources of city expansion. Three-fourths of urban expansion were achieved by consuming farmland during 1980–1990 and the ratio was still more than 55% during 2010–2015 after a sustained decline. However, the contribution of urban expansion on farmland loss kept increasing before 2010 and then decreased after 2010; the FI values were 0.07, 0.34, 0.48, and 0.15 correspondingly.
The spatial distribution of CI and FI of Beijing varied over time during the past 35 years (Figure 9 and Figure 10). During the first decade (1980–1990), the urban expansion was highly dependent on farmland consumption and the high-value CI was scattered around the central city and in exurban areas. During the following decade (1990–2000), the dependence of urban expansion on farmland consumption declined while the spatial scope expanded, which was mainly distributed around the central city where lots of farmland was consumed by urban expansion. In the third decade (2000–2010), the dependence of urban expansion on farmland consumption presented a distinct annulus and the CI value generally decreased with increasing distance to the central city. In the last five years (2010–2015), the annulus characteristic of CI remained while the farmland consumption by urban expansion expanded in the outer northeast and northwest exurban areas.
During the first decade (1980–1990), the contribution of urban expansion on farmland loss was not considerable and the high-value of FI was scattered around the central city. During the following decade (1990–2000), the contribution of urban expansion on farmland loss increased and the spatial scope of high-value FI expanded, which was mainly distributed around the central city. Meanwhile, the low-value FI generally distributed in outer suburban areas where the farmland loss mainly resulted from causes other than urban expansion. In the third decade (2000–2010), the FI value decreased with increasing distance from the center of the city and the distribution of FI showed a significant annulus characteristic, just like CI. In the last five years (2000–2010), the annulus feature of the contribution of urban expansion on farmland loss remained while FI in the outer northeast and northwest exurban areas declined.

3.4. Quality of the Farmland Lost by Urban Expansion

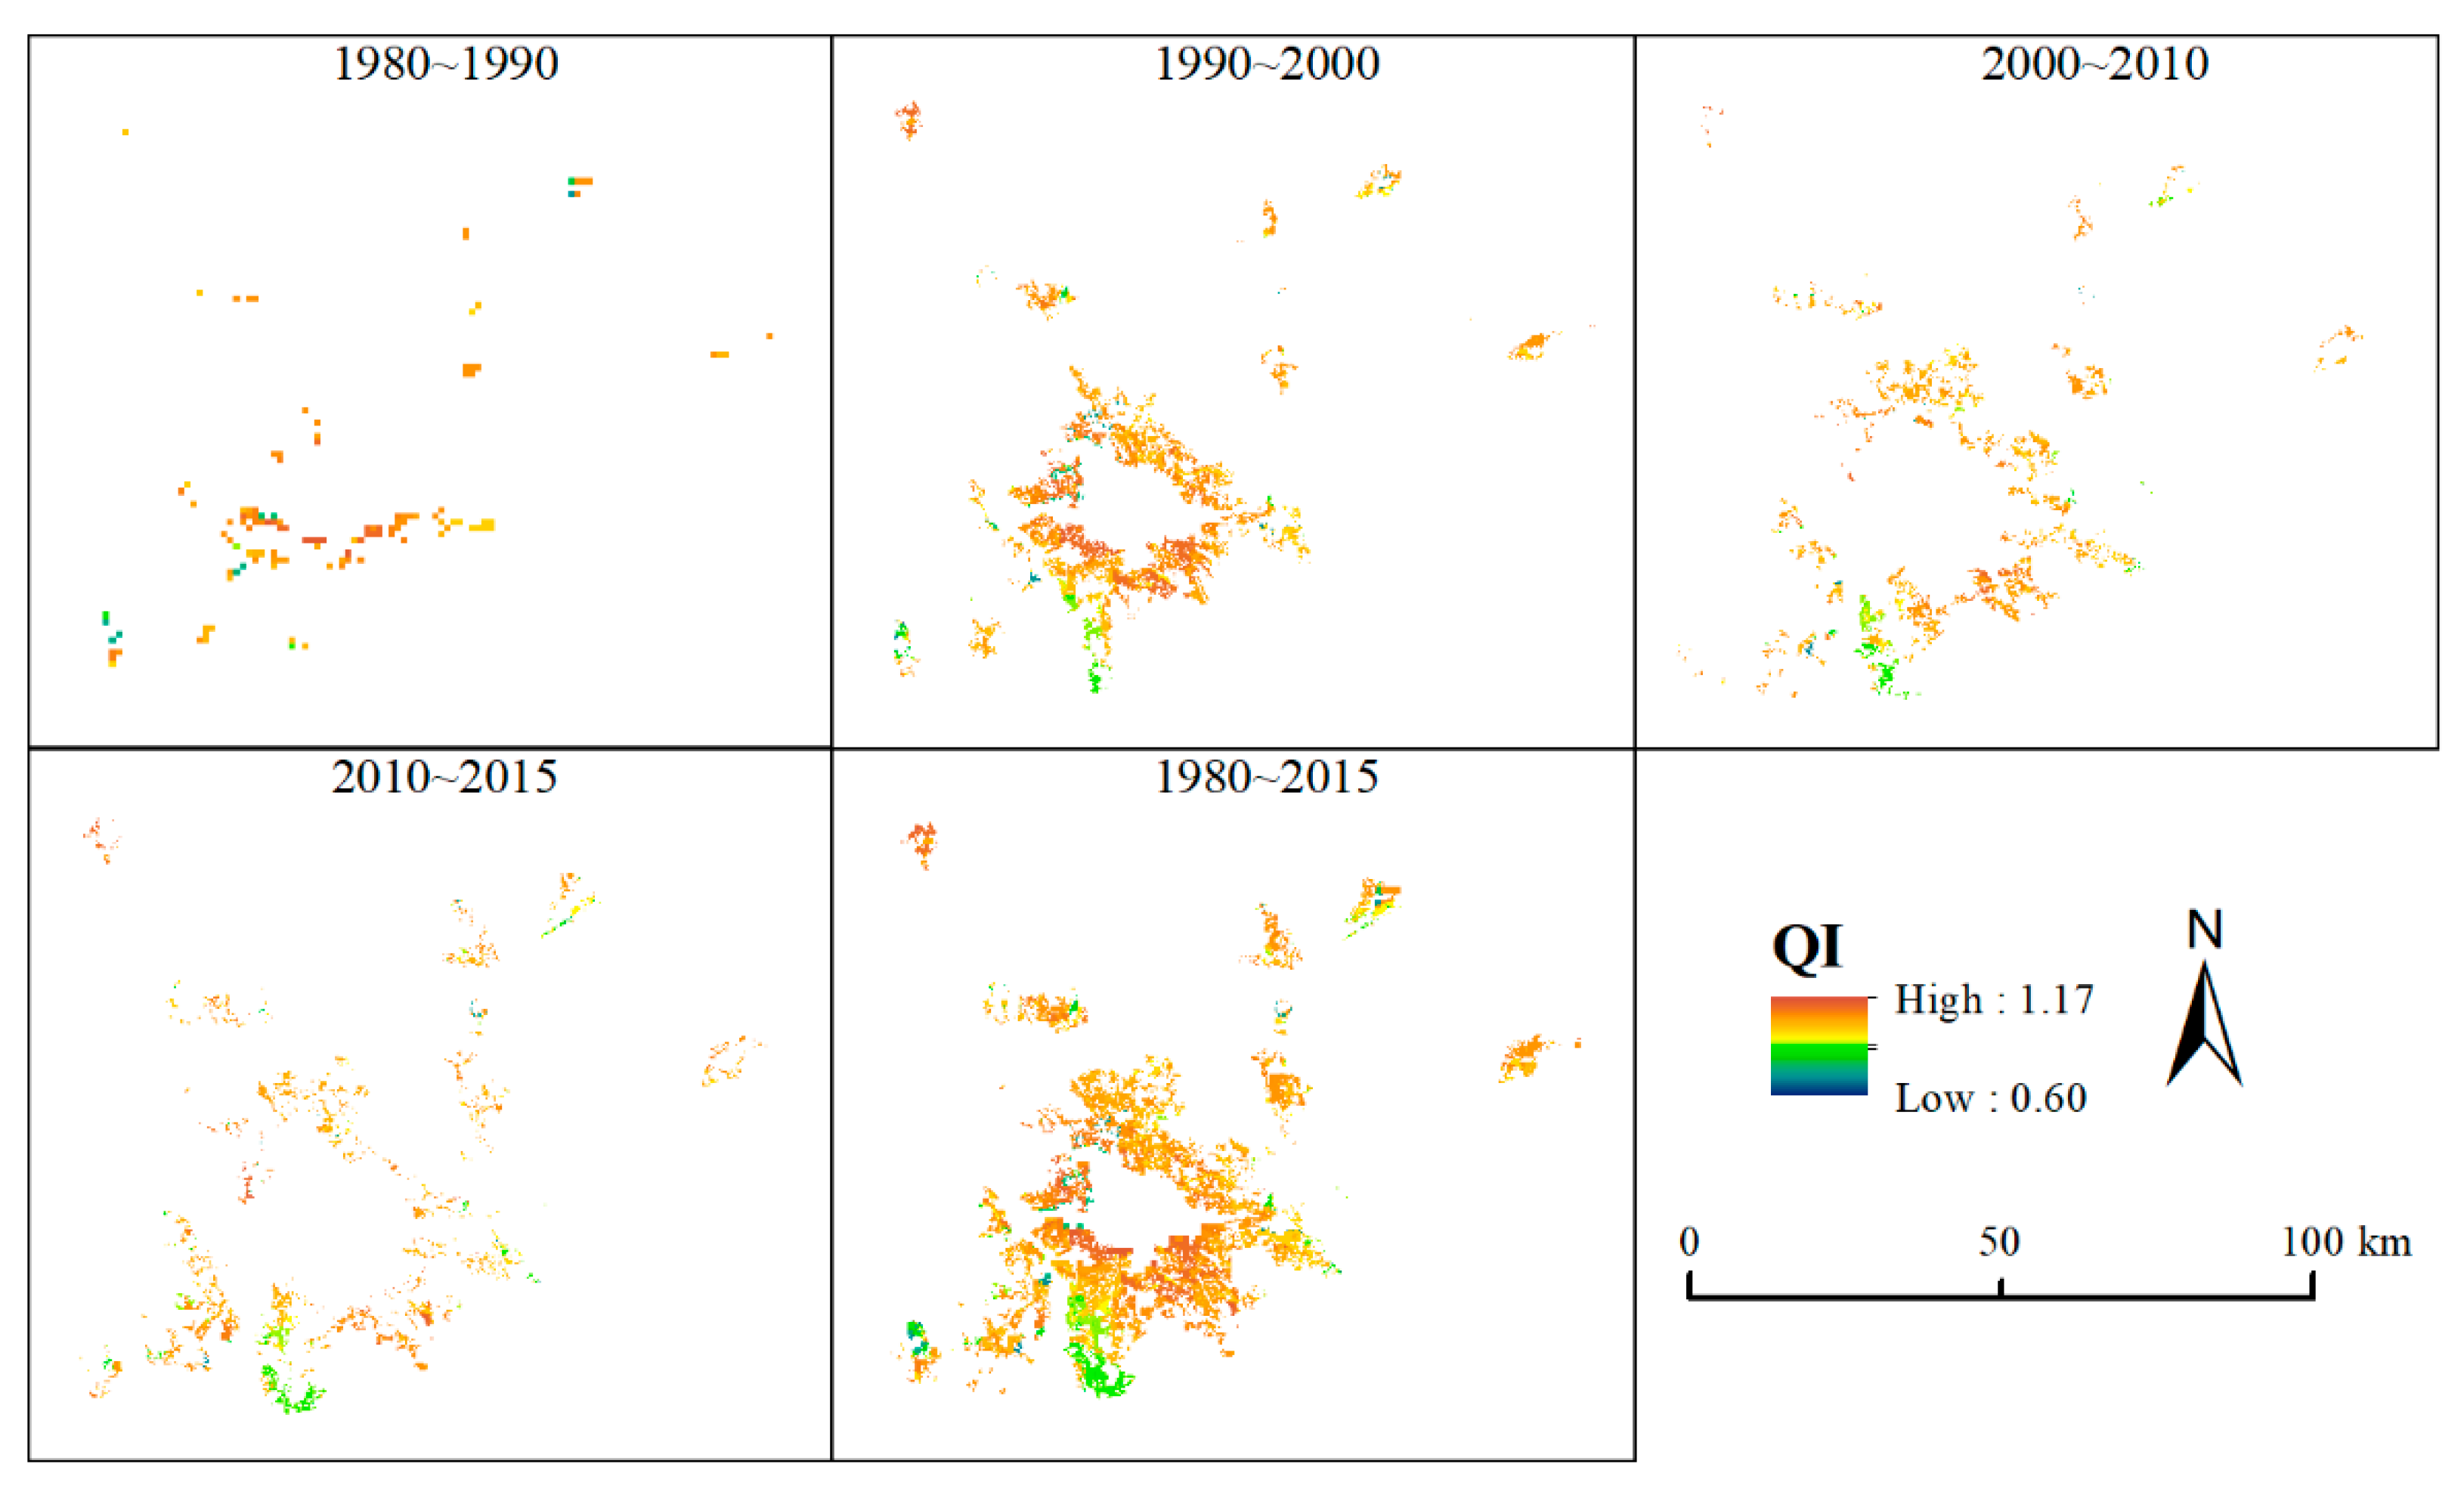
The QI were 1.03, 1.04, 1.02, and 1.02 in the periods of 1980–1990, 1990–2000, 2000–2010, and 2010–2015, respectively, which means the quality of the farmland consumed by urban expansion was sustaining higher than the average level of total farmland (Table 5). 1990–2000 was the most prominent period when urban expansion occupied higher-quality farmland. The relative consumption of higher-quality farmland by urban expansion increased to 14.90% in the period of 1990–2000 and then decreased to 3.89% in the period of 2010–2015. Conversely, the relative consumption of lower-quality farmland decreased from 8.73% in 1980–1990 to 5.47% in the period of 1990–2000 and then increased afterward.
The quality of the farmland lost by urban expansion presented significant spatial-temporal variations (Figure 11). During the first decade (1980–1990), the farmland lost by urban expansion was scattered and the quality had no evident features. However, the quality of farmland lost by urban expansion presented a visible annular layer structure and gradually declined from the area around the central city to the outer suburban areas in the following decade (1990–2000). During the third decade (2000–2010), the annular layer structure remained consistent while the area of high-quality farmland lost by urban expansion around the central city decreased. In the last five years (2010–2015), the annulus layer structure of the quality of farmland lost by urban expansion became indistinct, as farmland lost by urban expansion in outer suburban areas became noticeable.

4. Discussion

4.1. Urban Expansion and Farmland Loss

During the past 35 years, urban expansion in Beijing has experienced high- and low-speed stages and the unlimited sprawl with massive farmland occupation was mitigated to some extent. Nevertheless, both the amount of farmland consumption by urban expansion and the dependence of urban expansion on farmland consumption have consistently demonstrated the fact that the urban expand at the cost of numerous farmland in the city. More than seven-tenths of urban expansion were achieved by consuming farmland before 2000 and the proportion was still more than 55% during 2010–2015 after a sustained decline. The topography factor was one of the primary reasons why urban expansion in Beijing prefers to occupy farmland. Accounting for about 38% of the total area of the city, flat areas in central and southeastern of Beijing are concentrated areas of population and urban development because they are more suitable for the construction of buildings and infrastructures including roads, electric networks, and pipeline systems than mountainous areas. Meanwhile, flat land also features farmland as it is suitable for the cultivation and large-scale crop plantation. Thus, farmland in Beijing was mostly distributed around urban areas in the southeastern flat plain. On this basis, most urban expansions took place in an edge-expansion pattern and locations near the urban area are more likely to be developed into urban land. Hence, the urban expansion in Beijing prefers to occupy farmland surround the exited urban areas.
Although it was widely recognized that the trend of farmland decline in China had been effectively contained with the implementation of a series of strict protection policies [59], the absolute amount of total farmland loss and farmland lost by urban expansion fluctuated and did not show a significant declining trend in Beijing. What is more, the contribution of urban expansion on farmland shrinkage in Beijing continuously increased before 2010. During 2000–2010, 47.66% of farmland loss in Beijing was caused by urban expansion. However, the proportion slumped to 15.45% during 2010–2015. Among the many causes of farmland shrinkage, urban expansion and the ecological restoration under the Grain-for-Green Program are considered to be the primary drivers of farmland shrinkage in China [5]. The increment of the contribution of urban expansion on farmland shrinkage before 2010 demonstrated the continuous intensification of the urban expansion’s consumption of farmland in Beijing. The sharp decline of the contribution of urban expansion on farmland shrinkage during 2010–2015 was closely related to the afforestation project of Beijing. During the implementation of the Plain Afforestation Project in Beijing from 2012 to 2015, 700 km2 of forest has been constructed in which many were converted from farmland through Grain-for-Green and the adjustment of the agricultural structure [60].
In addition to quantity loss, urban land expansion also made a contribution on farmland quality loss as it prefers to consume the higher-quality farmland. The farmland around the urban area in the flat plain is featured with high quality and has a long history of cultivation. The length of cultivation time can influence the primary factors that affect the farmland quality since crop growth and farming practices can naturally and artificially promote the improvement of soil texture and soil profile and the enhancement of nutrients including soil organic matter. The high quality farmland near the exited urban areas was preferred to be converted into newly expanded urban land.

4.2. Comparison with National Level and Relevant Studies

Using land use maps from the Chinese Academy of Sciences, the quantity change of urban expansion, farmland loss, as well as the farmland consumption by urban expansion during 1980–2015 were demonstrated in this study. The quantity change trends were consistent with exited findings of studies in Beijing based on remote sensing image data [28,47,52]. What is more, our research went a step further to assess the interaction of urban expansion and farmland loss. Although the dependence of urban expansion on farmland consumption continuously declined during the past 35 years, the urban expansion in Beijing occurred at the cost of farmland and the contribution of urban expansion on farmland loss increased. The consumption of farmland for urban expansion in Beijing is significantly higher than the national level. During 2000–2010, about 63% of urban land expansion in Beijing was converted from farmland, almost twice the national level of approximately 32% during the period 1998–2004 [5].
It is noteworthy that Beijing’s rapid urban expansion with simultaneous numerous farmland consumption is neither a unique case in China, nor worldwide. Another megalopolis in China, Shanghai, has also undergone an extraordinary urbanization with an urban expansion of 90.43 km2/year and farmland loss of 84.5 km2/year during 1979–2009 [25], which is more remarkable than Beijing. The urban expansion in Nanjing, the capital of Jiangsu province, was about 37.4 km2/year during 1985–2013 [61]. Research conducted by Peng et al. [62] in Chengdu, a city in western China, showed the total urban expansion area was 1910.2 km2 during 1978–2010 and the urban expansion rate and intensity increased significantly from 17.36 km2/year and 0.14% in 1978–2002 to 186.69 km2/year and 1.51% in 2002–2010. Although the magnitude and spatial features of the urban expansion varied in different stages and different regions, the consumption of farmland for urban expansion was prevalent across the whole of China and other developing countries, as well as many developed countries. In India, the amount of agricultural land lost to urban growth during 2001–2010 was 0.7 million hectares, roughly five times the size of Delhi [63]. Martellozzo et al. [64] showed that 60% of the urban and peri-urban growth in the Calgary–Edmonton corridor in Alberta in Canada during 1988–2010 was located on farmland. Skog, K. L. and Steinnes, M. [65] found that most farmland in Norway is converted to built-up areas in relation to existing urban settlement areas and almost three quarters of the converted farmland was fully cultivated.

4.3. Policy Implications

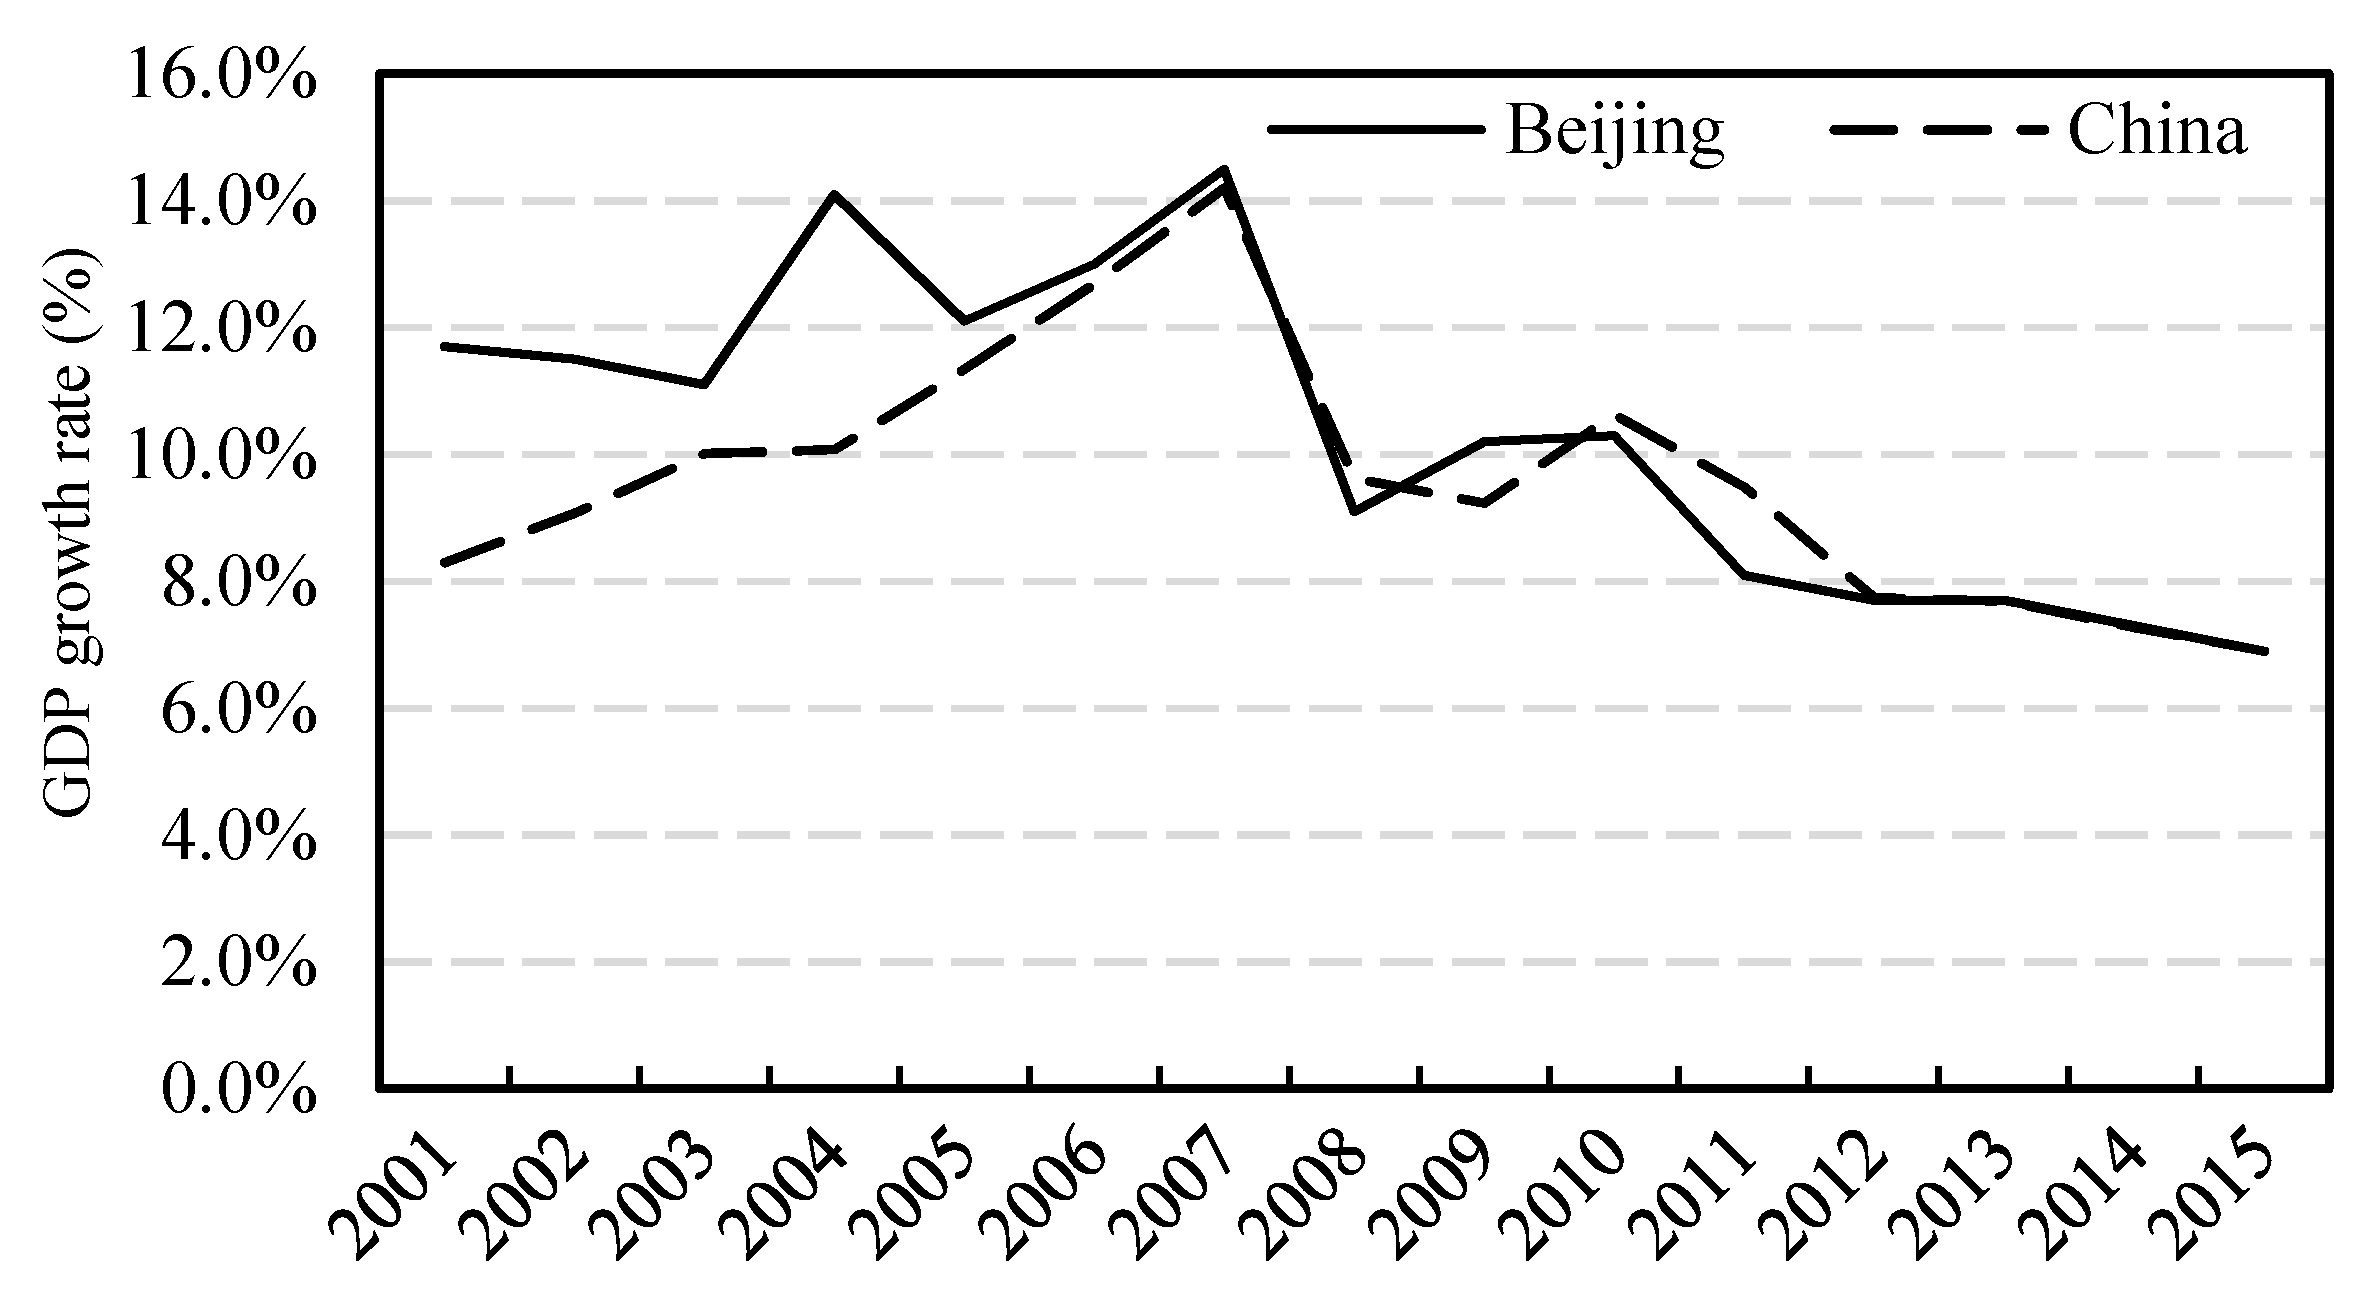
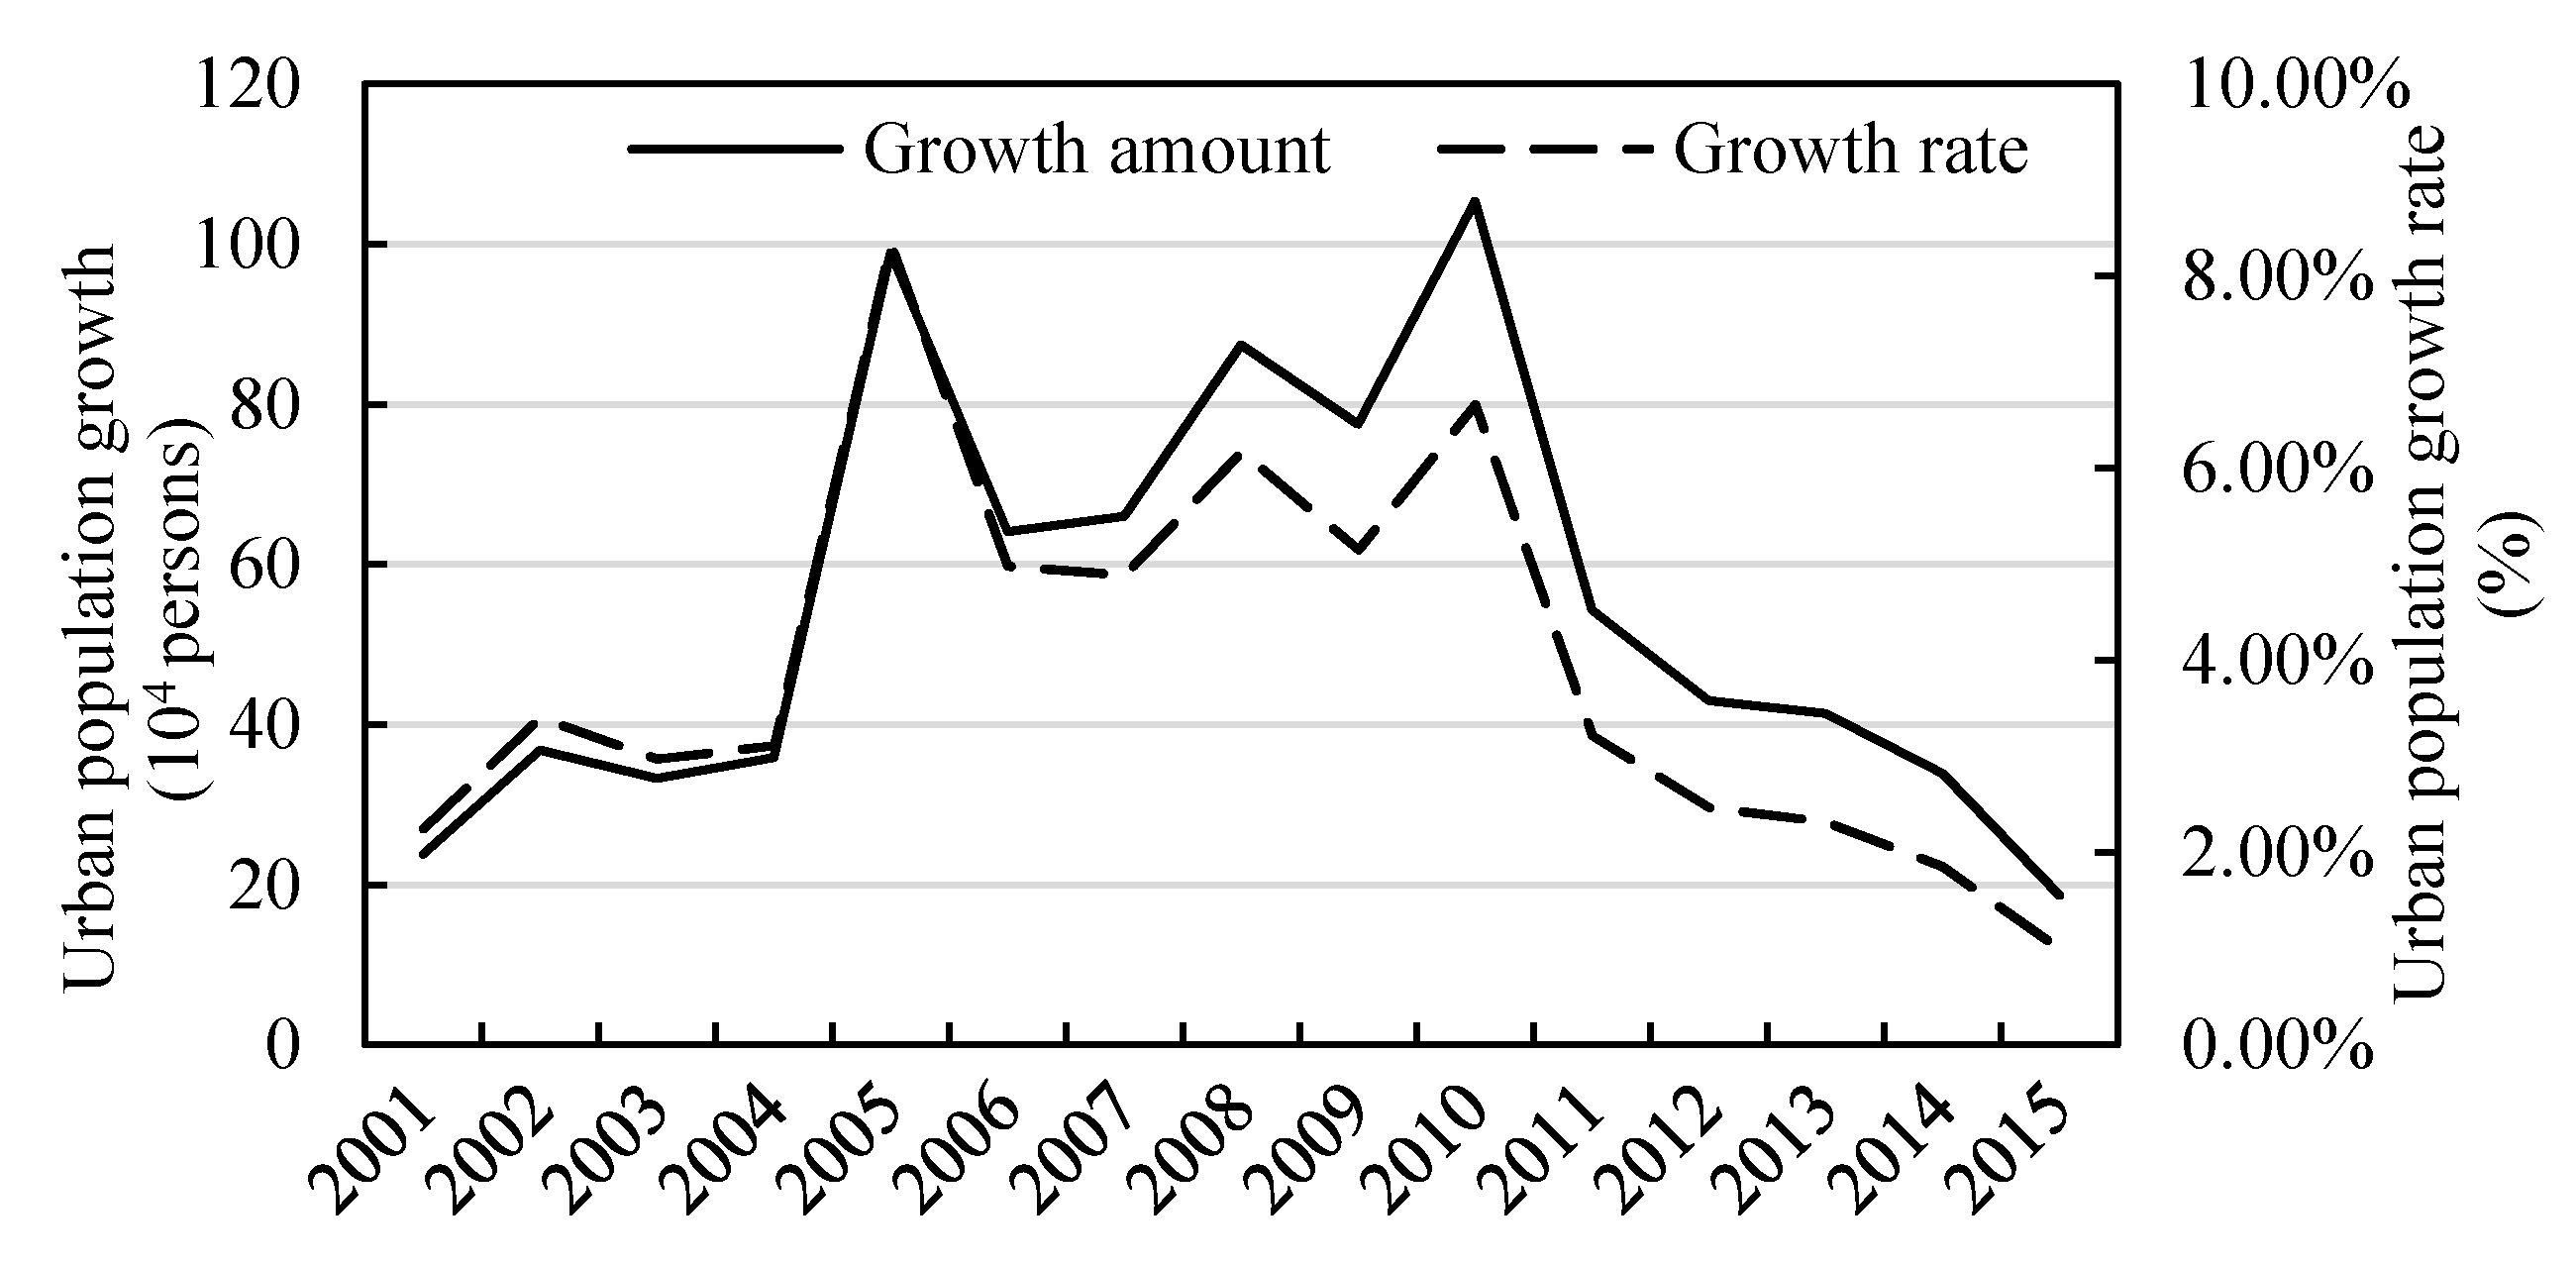
Efficient use should be more prioritized than the amount of control in urban land policy to protect farmland from urban expansion. On the one hand, the objective demand for newly built urban land would be reduced along with a slowdown in both economic and population growth, which are two dominant socioeconomic driving forces causing urban expansion [66]. China has entered into a new stage of economic development named the “economy’s new normal” and its economic growth shifted from high-speed to medium-to-high-speed. The growth rate of Beijing’s economic sector has also slowed down markedly since 2010 (Figure 12). Meanwhile, both the amount and rate of the growth of population in Beijing have also shown signs of moderating (Figure 13). On the other hand, urban land was used wastefully and disorderly to some extent in the rapid and massive expansion. The city master plan of Beijing (2016–2035) put forward that the area of urban and rural construction land would be reduced by 61 km2 in 2020 [67]. This rigid control over urban expansion is an impossible goal without a reasonable improvement in urban land use efficiency. Moreover, the formulation and implementation of the policy named “Dispersal of Non-Capital Functions”(fei shoudu gongneng shujie) [68] would disperse some industries out from Beijing, especially the high resource-consuming industries, part of the tertiary industries such as the regional logistics base and the specialized market, part of the social public service industries including some education, medical treatment, training institutions, as well as a part of the administrative and service institutions and enterprises. The construction land vacated from the dispersal of those industries should be efficiently reused to optimize the internal use structure and improve the utilization efficiency of the urban land in Beijing.
Another core issue is the ecological restoration policy, which should pay more attention to the greening inside of the urban area rather than shifting large-scale farmland to forest. Our study revealed that the contribution of urban expansion on farmland loss decreased during 2010–2015, in which lots of farmland was consumed by afforestation projects. The conversion of large-scale farmland to the forest not only threatens food security but also costs lots of financial and material resources in nursery stock purchase, plantation, and late management. In fact, farmland has an ecological function in addition to a production function. With the development of modern urban agriculture, farmland around the urban areas would also have a cultural function by providing spiritual experience (e.g., recreation, social activities, and countryside access) for urban residents. Instead of returning large-scale farmland to forest, the ecological restoration should focus on the greening of impervious urban areas. Afforestation on the land vacated from the dispersal of industries and consolidation in rural settlements could also be a principal mean of the ecological construction of the city.

5. Conclusions

This study investigated the expansion pattern of urban land, the shrinkage pattern of farmland, as well as the quantity, quality, and spatial pattern of farmland consumed by urban expansion in Beijing from 1980–2015 by using the land use/cover dataset. Our study found the area of farmland loss by urban expansion in Beijing to be 12.6 km2/year, 39.86 km2/year, 23.38 km2/year, and 41.11 km2/year during the period of 1980–1990, 1990–2000, 2000–2010, and 2010–2015, respectively. There was a sort of consistency between the temporal variation and spatial distribution of urban land expansion and farmland loss in Beijing. Urban land in Beijing expanded outward from the exited urban area, while the farmland shrank outward in a layered structure as the urban expansion in Beijing preferred to occupy farmland surrounded by the exited urban areas. The index we developed to evaluate the quality of farmland lost by urban expansion was 1.03, 1.04, 1.02, and 1.02 in the four periods, suggesting that this kind of sustained urban expansion prefers to consume “above average” quality farmland.
In addition, we documented the relationship between urban land expansion and farmland loss by developing two direct quantitative indicators. The indicator we developed to assess the dependence of urban expansion on farmland consumption showed values of 0.75, 0.72, 0.63, and 0.57 for those four periods. Thus, although urban expansion in Beijing is highly dependent on occupying farmland, this dependence has been continuously decreased. Our study also suggested that the contribution of urban expansion on farmland loss increased during the previous three decades of the study period (1980–2010) and decreased in the latter five years (2010–2015), as the indicator we developed to assess the contribution of urban expansion on farmland loss showed values of 0.07, 0.34, 0.48, and 0.15, respectively, for those four periods. To protect the farmland from urban expansion, we argue that urban land use efficiency should be improved with rigid controls over the urban expansion area. In the background of the “Dispersal of Non-Capital Functions”, the land vacated from the dispersal of those industries should be efficiently reused. Additionally, afforestation on the land vacated from the dispersal of industries and consolidation in rural settlements should be prioritized, to take pressure off of the farmland.

Author Contributions

Y.H., X.K. and J.Z. conceived and designed the study; Y.H. processed the data and wrote the paper; X.K. reviewed the original manuscript; J.S. helped to collect the data; L.W. helped mapping; Y.H., J.Z., J.S. and M.M. revised the paper. All authors have read and approved the final manuscript.

Funding

This research was funded by Beijing Municipal Natural Science Foundation, grant number 8151001 and National Natural Science Foundation of China, grant number 41771561.

Conflicts of Interest

The authors declare no conflict of interest.

References

  1. UN. World Urbanization Prospects:The 2014 Revision; Department of Economic and Social Affairs, Ed.; UN: New York, NY, USA, 2015. [Google Scholar]
  2. Normile, D. China’s living laboratory in urbanization. Science 2008, 319, 740–743. [Google Scholar] [CrossRef] [PubMed]
  3. National Bureau of Statistics of China. China Statistical Year Book; China Statistical Press: Beijing, China, 2016.
  4. World Bank—Development Research Center of the State Council. Urban China: Toward Efficient, Inclusive, and Sustainable Urbanization; World Bank: Washington, DC, USA, 2014; pp. 1–583. [Google Scholar]
  5. Liu, T.; Liu, H.; Qi, Y. Construction land expansion and cultivated land protection in urbanizing China: Insights from national land surveys, 1996–2006. Habitat Int. 2015, 46, 13–22. [Google Scholar] [CrossRef]
  6. Long, H.L.; Ge, D.Z.; Zhang, Y.N.; Tu, S.S.; Qu, Y.; Ma, L. Changing man-land interrelations in China’s farming area under urbanization and its implications for food security. J. Environ. Manag. 2018, 209, 440–451. [Google Scholar] [CrossRef] [PubMed]
  7. Zhao, D.M.; Wu, J. The Influence of Urban Surface Expansion in China on Regional Climate. J. Clim. 2017, 30, 1061–1080. [Google Scholar] [CrossRef]
  8. Liao, J.B.; Wang, T.J.; Jiang, Z.Q.; Zhuang, B.L.; Xie, M.; Yin, C.Q.; Wang, X.M.; Zhu, J.L.; Fu, Y.; Zhang, Y. WRF/Chem modeling of the impacts of urban expansion on regional climate and air pollutants in Yangtze River Delta, China. Atmos. Environ. 2015, 106, 204–214. [Google Scholar] [CrossRef]
  9. Cao, Q.; Yu, D.Y.; Georgescu, M.; Wu, J.G.; Wang, W. Impacts of future urban expansion on summer climate and heat-related human health in eastern China. Environ. Int. 2018, 112, 134–146. [Google Scholar] [CrossRef] [PubMed]
  10. Du, N.R.; Ottens, H.; Sliuzas, R. Spatial impact of urban expansion on surface water bodies—A case study of Wuhan, China. Landsc. Urban Plan. 2010, 94, 175–185. [Google Scholar] [CrossRef]
  11. Dong, Y.; Liu, Y.; Chen, J.N. Will urban expansion lead to an increase in future water pollution loads?—A preliminary investigation of the Haihe River Basin in northeastern China. Environ. Sci. Pollut. Res. 2014, 21, 7024–7034. [Google Scholar] [CrossRef] [PubMed]
  12. He, C.Y.; Liu, Z.F.; Tian, J.; Ma, Q. Urban expansion dynamics and natural habitat loss in China: A multiscale landscape perspective. Glob. Chang. Biol. 2014, 20, 2886–2902. [Google Scholar] [CrossRef] [PubMed]
  13. Lin, T.; Xue, X.Z.; Shi, L.Y.; Gao, L.J. Urban spatial expansion and its impacts on island ecosystem services and landscape pattern: A case study of the island city of Xiamen, Southeast China. Ocean Coast. Manag. 2013, 81, 90–96. [Google Scholar] [CrossRef]
  14. Zhao, S.Q.; Da, L.J.; Tang, Z.Y.; Fang, H.J.; Song, K.; Fang, J.Y. Ecological consequences of rapid urban expansion: Shanghai, China. Front. Ecol. Environ. 2006, 4, 341–346. [Google Scholar] [CrossRef] [Green Version]
  15. Xie, W.X.; Huang, Q.X.; He, C.Y.; Zhao, X. Projecting the impacts of urban expansion on simultaneous losses of ecosystem services: A case study in Beijing, China. Ecol. Indic. 2018, 84, 183–193. [Google Scholar] [CrossRef]
  16. Wang, H.X.; Zhang, M.H.; Cai, Y. Problems, challenges, and strategic options of grain security in China. In Advances in Agronomy; Sparks, D.L., Ed.; Academic Press: Cambridge, MA, USA, 2009; Volume 103, pp. 101–147. [Google Scholar]
  17. Li, Y.Y.; Li, X.B.; Tan, M.H.; Wang, X.; Xin, L.J. The impact of cultivated land spatial shift on food crop production in China, 1990–2010. Land Degrad. Dev. 2018, 29, 1652–1659. [Google Scholar] [CrossRef]
  18. Liu, G.L.; Zhang, L.C.; Zhang, Q.; Musyimi, Z. The response of grain production to changes in quantity and quality of cropland in Yangtze River Delta, China. J. Sci. Food Agric. 2015, 95, 480–489. [Google Scholar] [CrossRef] [PubMed]
  19. Atta-ur-Rahman; Surjan, A.; Parvin, G.A.; Shaw, R. Impact of Urban Expansion on Farmlands: A Silent Disaster; Elsevier Inc.: New York, NY, USA, 2016. [Google Scholar] [CrossRef]
  20. Liu, F.; Zhang, Z.X.; Shi, L.F.; Zhao, X.L.; Xu, J.Y.; Yi, L.; Liu, B.; Wen, Q.K.; Hu, S.G.; Wang, X.; et al. Urban expansion in China and its spatial-temporal differences over the past four decades. J. Geogr. Sci. 2016, 26, 1477–1496. [Google Scholar] [CrossRef]
  21. Wei, Y.D.; Ye, X.Y. Urbanization, urban land expansion and environmental change in China. Stoch. Environ. Res. Risk Assess. 2014, 28, 757–765. [Google Scholar] [CrossRef]
  22. Long, H.; Li, Y.; Liu, Y.; Woods, M.; Zou, J. Accelerated restructuring in rural China fueled by ‘increasing vs. decreasing balance’ land-use policy for dealing with hollowed villages. Land Use Policy 2012, 29, 11–22. [Google Scholar] [CrossRef] [Green Version]
  23. Kuang, W.; Liu, J.; Dong, J.; Chi, W.; Zhang, C. The rapid and massive urban and industrial land expansions in China between 1990 and 2010: A CLUD-based analysis of their trajectories, patterns, and drivers. Landsc. Urban Plan. 2016, 145, 21–33. [Google Scholar] [CrossRef] [Green Version]
  24. Xu, X.; Min, X. Quantifying spatiotemporal patterns of urban expansion in China using remote sensing data. Cities 2013, 35, 104–113. [Google Scholar] [CrossRef]
  25. Yin, J.; Yin, Z.; Zhong, H.; Xu, S.; Hu, X.; Wang, J.; Wu, J. Monitoring urban expansion and land use/land cover changes of Shanghai metropolitan area during the transitional economy (1979–2009) in China. Environ. Monit. Assess. 2011, 177, 609–621. [Google Scholar] [CrossRef] [PubMed]
  26. Quan, B.; Bai, Y.; Römkens, M.J.M.; Chang, K.-T.; Song, H.; Guo, T.; Lei, S. Urban land expansion in Quanzhou City, China, 1995–2010. Habitat Int. 2015, 48, 131–139. [Google Scholar] [CrossRef]
  27. Kuang, W.; Chi, W.; Lu, D.; Dou, Y. A comparative analysis of megacity expansions in China and the U.S.: Patterns, rates and driving forces. Landsc. Urban Plan. 2014, 132, 121–135. [Google Scholar] [CrossRef]
  28. Wu, W.; Zhao, S.; Zhu, C.; Jiang, J. A comparative study of urban expansion in Beijing, Tianjin and Shijiazhuang over the past three decades. Landsc. Urban Plan. 2015, 134, 93–106. [Google Scholar] [CrossRef]
  29. Chen, J.; Chang, K.-T.; Karacsonyi, D.; Zhang, X. Comparing urban land expansion and its driving factors in Shenzhen and Dongguan, China. Habitat Int. 2014, 43, 61–71. [Google Scholar] [CrossRef]
  30. Gao, J.; Wei, Y.D.; Chen, W.; Chen, J. Economic transition and urban land expansion in Provincial China. Habitat Int. 2014, 44, 461–473. [Google Scholar] [CrossRef]
  31. Li, X.; Zhou, W.; Ouyang, Z. Forty years of urban expansion in Beijing: What is the relative importance of physical, socioeconomic, and neighborhood factors? Appl. Geogr. 2013, 38, 1–10. [Google Scholar] [CrossRef] [Green Version]
  32. Osman, T.; Divigalpitiya, P.; Arima, T. Driving factors of urban sprawl in Giza Governorate of Greater Cairo Metropolitan Region using AHP method. Land Use Policy 2016, 58, 21–31. [Google Scholar] [CrossRef]
  33. Shu, B.; Zhang, H.; Li, Y.; Qu, Y.; Chen, L. Spatiotemporal variation analysis of driving forces of urban land spatial expansion using logistic regression: A case study of port towns in Taicang City, China. Habitat Int. 2014, 43, 181–190. [Google Scholar] [CrossRef]
  34. He, C.; Li, J.; Zhang, X.; Liu, Z.; Zhang, D. Will rapid urban expansion in the drylands of northern China continue: A scenario analysis based on the Land Use Scenario Dynamics-urban model and the Shared Socioeconomic Pathways. J. Clean. Prod. 2017, 165, 57–69. [Google Scholar] [CrossRef]
  35. Li, L.; Sato, Y.; Zhu, H. Simulating spatial urban expansion based on a physical process. Landsc. Urban Plan. 2003, 64, 67–76. [Google Scholar] [CrossRef]
  36. Kuang, W. Simulating dynamic urban expansion at regional scale in Beijing-Tianjin-Tangshan Metropolitan Area. J. Geogr. Sci. 2011, 21, 317–330. [Google Scholar] [CrossRef]
  37. Chang, H.S.; Chen, T.L. Exploring spatial patterns of farmland transactions and farmland use changes. Environ. Monit. Assess. 2015, 187, 596. [Google Scholar] [CrossRef] [PubMed]
  38. Zhong, T.Y.; Huang, X.J.; Zhang, X.Y.; Wang, K. Temporal and spatial variability of agricultural land loss in relation to policy and accessibility in a low hilly region of southeast China. Land Use Policy 2011, 28, 762–769. [Google Scholar] [CrossRef]
  39. Feng, Q.L.; Gong, J.H.; Liu, J.T.; Li, Y. Monitoring Cropland Dynamics of the Yellow River Delta based on Multi-Temporal Landsat Imagery over 1986 to 2015. Sustainability 2015, 7, 14834–14858. [Google Scholar] [CrossRef] [Green Version]
  40. Xie, Y.C.; Mei, Y.; Tian, G.J.; Xing, X.R. Socio-econornic driving forces of arable land conversion: A case study of Wuxian City, China. Glob. Environ. Chang. 2005, 15, 238–252. [Google Scholar] [CrossRef]
  41. Song, J.; Ye, J.T.; Zhu, E.Y.; Deng, J.S.; Wang, K. Analyzing the Impact of Highways Associated with Farmland Loss under Rapid Urbanization. ISPRS Int. J. Geo-Inf. 2016, 5, 94. [Google Scholar] [CrossRef]
  42. Shi, W.J.; Tao, F.L.; Liu, J.Y. Changes in quantity and quality of cropland and the implications for grain production in the Huang-Huai-Hai Plain of China. Food Secur. 2013, 5, 69–82. [Google Scholar] [CrossRef]
  43. Yang, H.; Li, X.B. Cultivated land and food supply in China. Land Use Policy 2000, 17, 73–88. [Google Scholar] [CrossRef]
  44. Zhong, T.Y.; Huang, X.J.; Zhang, X.Y.; Scott, S.; Wang, K. The effects of basic arable land protection planning in Fuyang County, Zhejiang Province, China. Appl. Geogr. 2012, 35, 422–438. [Google Scholar] [CrossRef]
  45. Liang, C.; Penghui, J.; Wei, C.; Manchun, L.; Liyan, W.; Yuan, G.; Yuzhe, P.; Nan, X.; Yuewei, D.; Qiuhao, H. Farmland protection policies and rapid urbanization in China: A case study for Changzhou City. Land Use Policy 2015, 48, 552–566. [Google Scholar] [CrossRef]
  46. Shen, X.Q.; Wang, L.P.; Wu, C.F.; Lv, T.G.; Lu, Z.W.; Luo, W.B.; Li, G. Local interests or centralized targets? How China’s local government implements the farmland policy of Requisition-Compensation Balance. Land Use Policy 2017, 67, 716–724. [Google Scholar] [CrossRef]
  47. Tan, M.H.; Li, X.B.; Xie, H.; Lu, C.H. Urban land expansion and arable land loss in China—A case study of Beijing-Tianjin-Hebei region. Land Use Policy 2005, 22, 187–196. [Google Scholar] [CrossRef]
  48. Cai, H.Y.; Yang, X.H.; Xu, X.L. Spatiotemporal Patterns of Urban Encroachment on Cropland and Its Impacts on Potential Agricultural Productivity in China. Remote Sens. 2013, 5, 6443–6460. [Google Scholar] [CrossRef] [Green Version]
  49. Zhang, Z.X.; Wen, Q.K.; Liu, F.; Zhao, X.L.; Liu, B.; Xu, J.Y.; Yi, L.; Hu, S.G.; Wang, X.; Zuo, L.J.; et al. Urban expansion in China and its effect on cultivated land before and after initiating “Reform and Open Policy”. Sci. China-Earth Sci. 2016, 59, 1930–1945. [Google Scholar] [CrossRef]
  50. Shi, K.F.; Chen, Y.; Yu, B.L.; Xu, T.B.; Li, L.Y.; Huang, C.; Liu, R.; Chen, Z.Q.; Wu, J.P. Urban Expansion and Agricultural Land Loss in China: A Multiscale Perspective. Sustainability 2016, 8, 790. [Google Scholar] [CrossRef]
  51. Zhang, J.A.; Pu, L.J.; Peng, B.Z.; Gao, Z.G. The impact of urban land expansion on soil quality in rapidly urbanizing regions in China: Kunshan as a case study. Environ. Geochem. Health 2011, 33, 125–135. [Google Scholar] [CrossRef] [PubMed]
  52. Song, W.; Pijanowski, B.C.; Tayyebi, A. Urban expansion and its consumption of high-quality farmland in Beijing, China. Ecol. Indic. 2015, 54, 60–70. [Google Scholar] [CrossRef] [Green Version]
  53. Beijing Municipal Bureau of Statistics. Beijing Statistical Year Book; China Statistical Press: Beijing, China, 2016.
  54. Liu, J.; Zhang, Z.; Xu, X.; Kuang, W.; Zhou, W.; Zhang, S.; Li, R.; Yan, C.; Yu, D.; Wu, S.; et al. Spatial patterns and driving forces of land use change in China during the early 21st century. J. Geogr. Sci. 2010, 20, 483–494. [Google Scholar] [CrossRef]
  55. Zhang, M.; Huang, X.; Chuai, X.; Yang, H.; Lai, L.; Tan, J. Impact of land use type conversion on carbon storage in terrestrial ecosystems of China: A spatial-temporal perspective. Sci. Rep. 2015, 5, 10233. [Google Scholar] [CrossRef] [PubMed] [Green Version]
  56. Liu, J.; Kuang, W.; Zhang, Z.; Xu, X.; Qin, Y.; Ning, J.; Zhou, W.; Zhang, S.; Li, R.; Yan, C.; et al. Spatiotemporal characteristics, patterns, and causes of land-use changes in China since the late 1980s. J. Geogr. Sci. 2014, 24, 195–210. [Google Scholar] [CrossRef]
  57. Ministry of Land and Resources of the People’s Republic of China. Regulation for Gradation on Agriculture Land Quality; GB/T 28407-2012; Standards Press of China: Beijing, China, 2012.
  58. Liu, Y.; Zhang, Y.; Guo, L. Towards realistic assessment of cultivated land quality in an ecologically fragile environment: A satellite imagery-based approach. Appl. Geogr. 2010, 30, 271–281. [Google Scholar] [CrossRef]
  59. Liu, X.; Zhao, C.; Song, W. Review of the evolution of cultivated land protection policies in the period following China’s reform and liberalization. Land Use Policy 2017, 67, 660–669. [Google Scholar] [CrossRef]
  60. Beijing Municipal Bureau of Forestry and Parks (General Office of Capital Greening Commission). Work Summary of the 12th Five-Year Plan, the 13th Five-Year Plan and the 2016 Work Plan. Available online: http://zfxxgk.beijing.gov.cn/110038/jh32/2016-06/02/content_705014.shtml (accessed on 2 June 2016).
  61. Chen, J.; Gao, J.; Chen, W. Urban land expansion and the transitional mechanisms in Nanjing, China. Habitat Int. 2016, 53, 274–283. [Google Scholar] [CrossRef]
  62. Peng, W.; Wang, G.; Zhou, J.; Zhao, J.; Yang, C. Studies on the temporal and spatial variations of urban expansion in Chengdu, western China, from 1978 to 2010. Sustain. Cities Soc. 2015, 17, 141–150. [Google Scholar] [CrossRef]
  63. Pandey, B.; Seto, K.C. Urbanization and agricultural land loss in India: Comparing satellite estimates with census data. J. Environ. Manag. 2015, 148, 53–66. [Google Scholar] [CrossRef] [PubMed]
  64. Martellozzo, F.; Ramankutty, N.; Hall, R.J.; Price, D.T.; Purdy, B.; Friedl, M.A. Urbanization and the loss of prime farmland: A case study in the Calgary-Edmonton corridor of Alberta. Reg. Environ. Chang. 2015, 15, 881–893. [Google Scholar] [CrossRef]
  65. Skog, K.L.; Steinnes, M. How do centrality, population growth and urban sprawl impact farmland conversion in Norway? Land Use Policy 2016, 59, 185–196. [Google Scholar] [CrossRef]
  66. Han, S.S. Urban expansion in contemporary China: What can we learn from a small town? Land Use Policy 2010, 27, 780–787. [Google Scholar] [CrossRef]
  67. Beijing Municipal Commission of City Planning and Land Resources Management. Beijing City Master Plan (2016–2035). Available online: http://www.bjghw.gov.cn/web/ztgh/ztgh000.html (accessed on 27 September 2017).
  68. The People’s Government of Beijing Municipality. Disperse the Non-Capital Functions and Promote the Coordinated Development of Beijing, Tianjin and Hebei. Available online: http://zhengwu.beijing.gov.cn/zwzt/sjfsdgn/ (accessed on 4 September 2017).
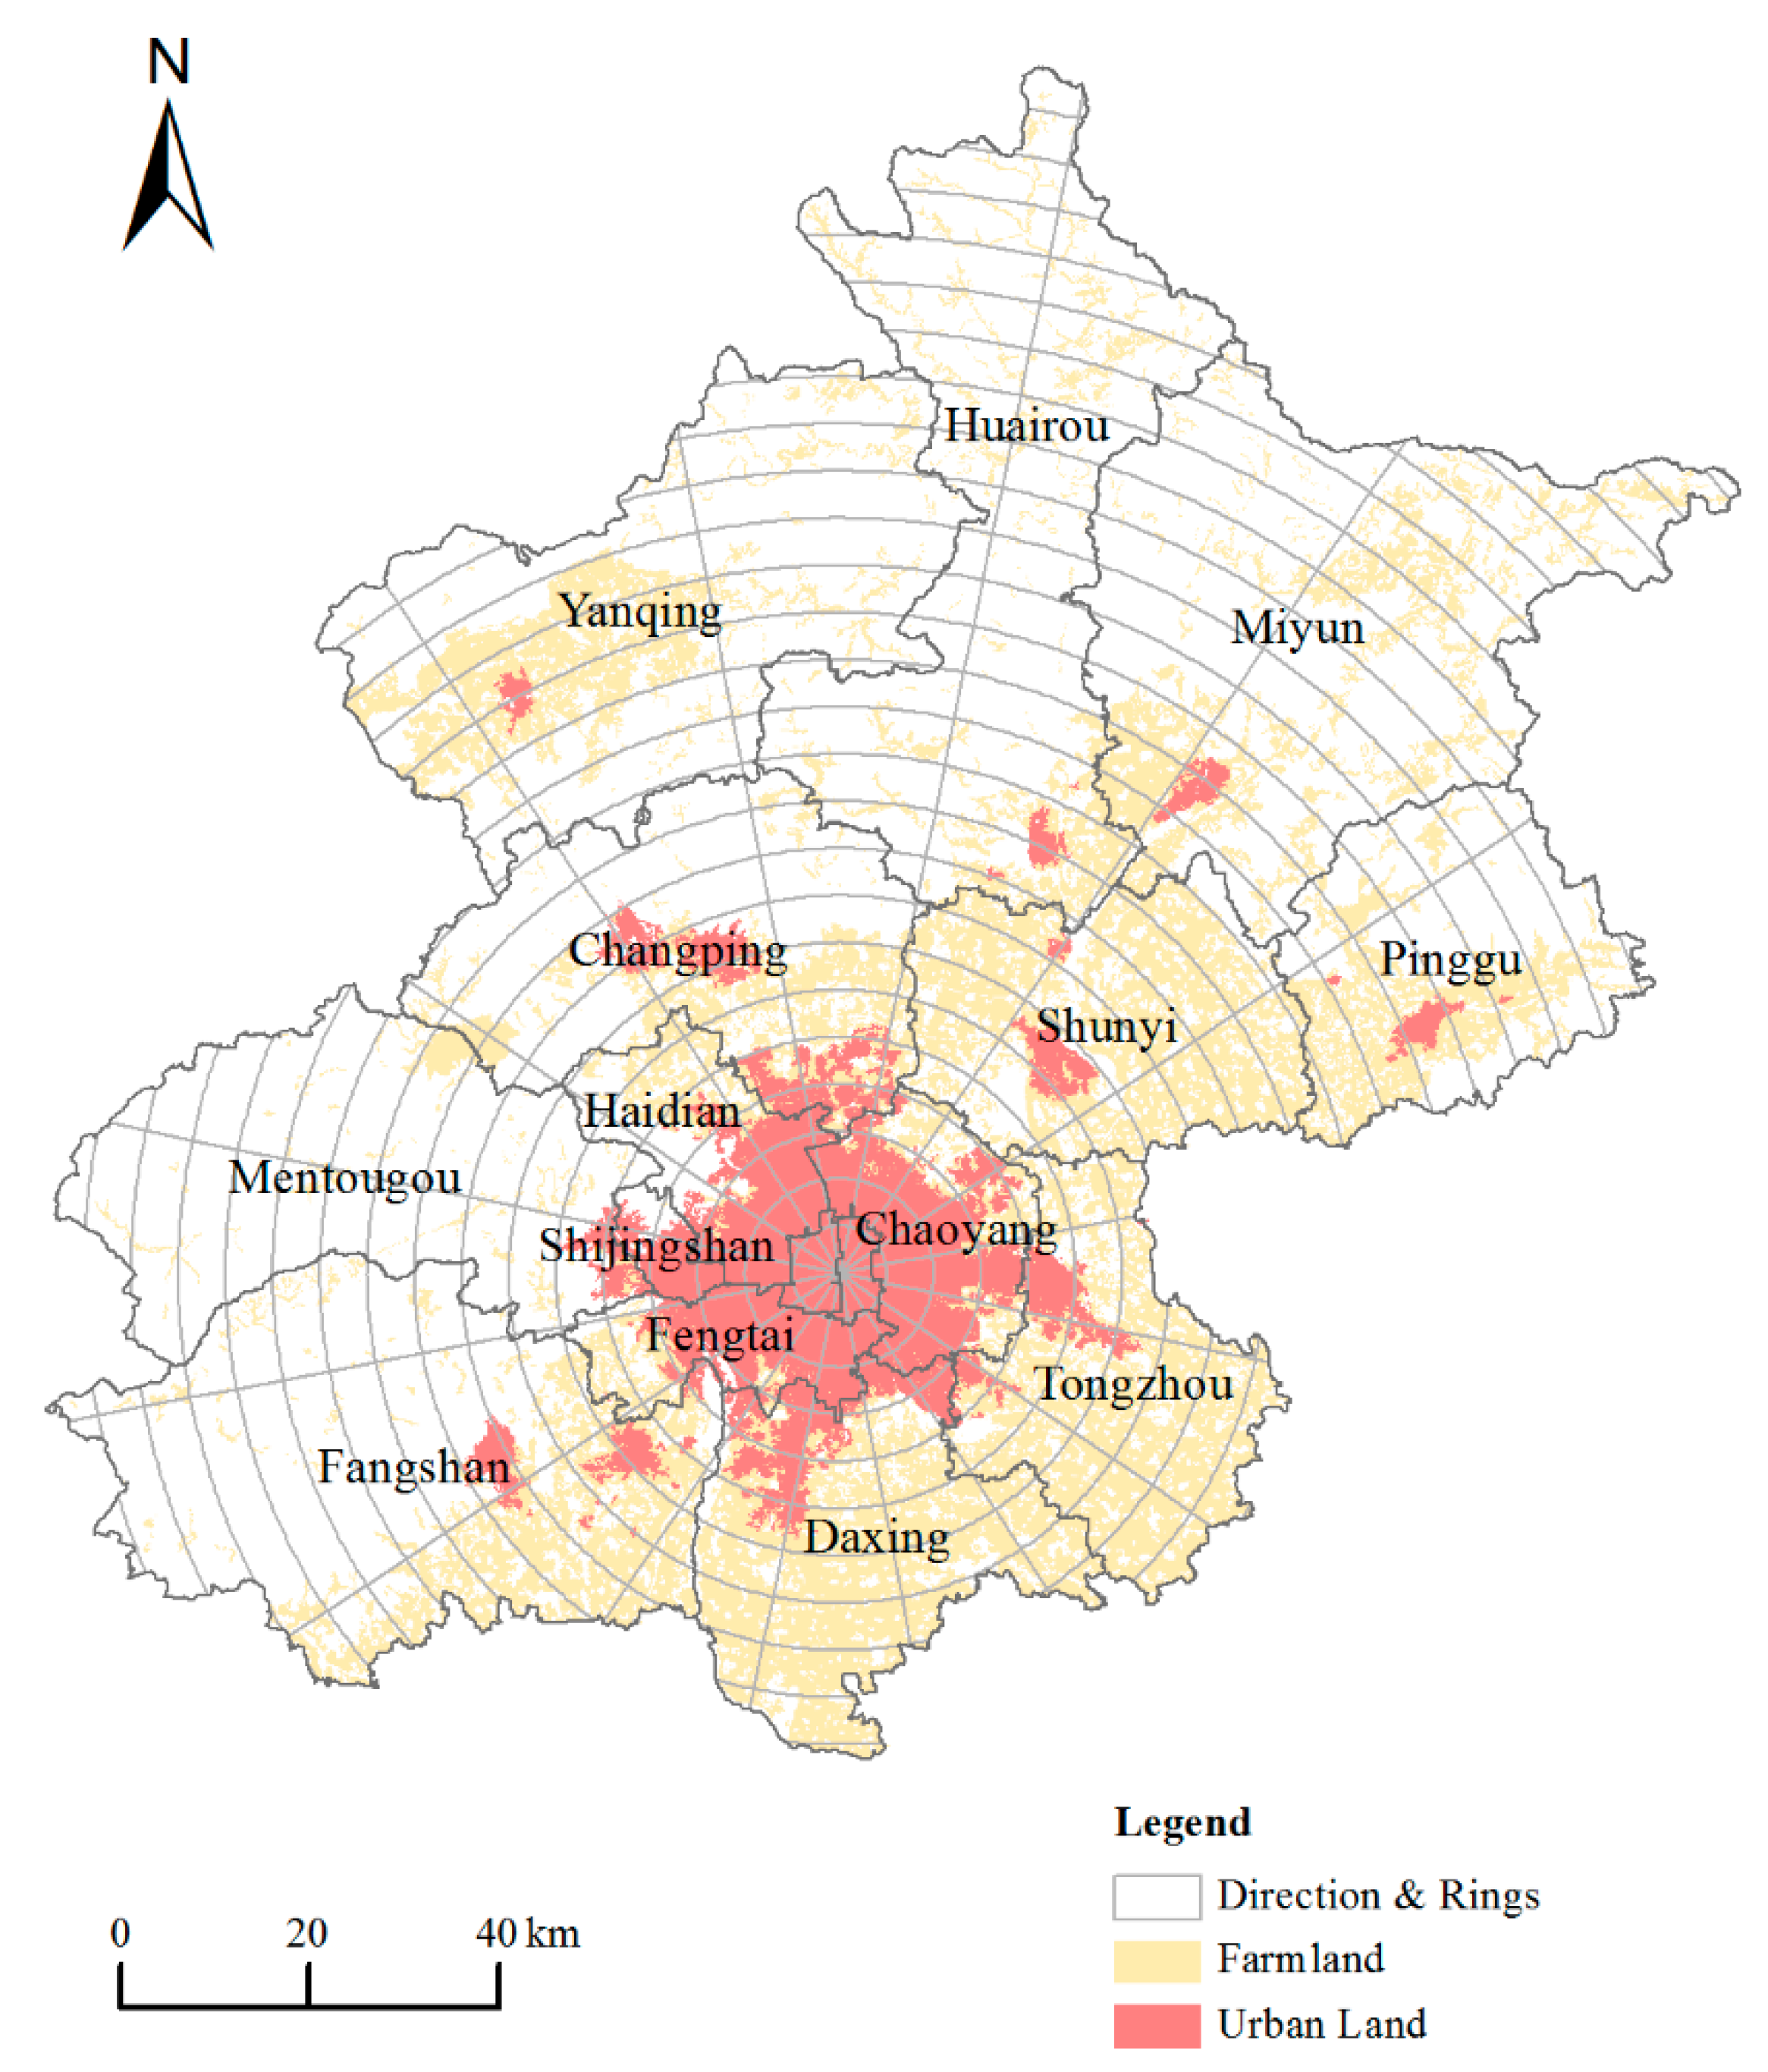
Figure 1. Directional and concentric map of Beijing.
Sustainability 10 03927 g001
Figure 2. Urban expansion in Beijing during 1980–2015.
Sustainability 10 03927 g002
Figure 3. Urban land area (a) and expansion intensity (b) with increasing distance to the city center in Beijing, 1980–2015.
Sustainability 10 03927 g003
Figure 4. Spatial orientation of urban distribution (a) and expansion intensity (b) in Beijing, 1980–2015.
Sustainability 10 03927 g004
Figure 5. Farmland loss in Beijing during 1980–2015.
Sustainability 10 03927 g005
Figure 6. Farmland area (a) and loss intensity (b) with increasing distance to city center in Beijing, 1980–2015.
Sustainability 10 03927 g006
Figure 7. Spatial orientation of farmland distribution (a) and loss intensity (b) in Beijing, 1980–2015.
Sustainability 10 03927 g007
Figure 8. (a) Farmland consumed by urban expansion with increasing distance to the city center in Beijing, 1980–2015; (b) Spatial orientation of the intensity of the farmland consumed by urban expansion in Beijing, 1980–2015.
Sustainability 10 03927 g008
Figure 9. Spatial distribution of the dependence of urban expansion on farmland consumption in Beijing, 1980–2015.
Sustainability 10 03927 g009
Figure 10. Spatial distribution of the contribution of urban expansion on farmland loss in Beijing, 1980–2015.
Sustainability 10 03927 g010
Figure 11. Quality of the farmland lost by urban expansion in Beijing, 1980–2015.
Sustainability 10 03927 g011
Figure 12. GDP growth rate of China and Beijing during 2001–2015. Data source: China Statistical Yearbook (2001–2015).
Sustainability 10 03927 g012
Figure 13. Amount and rate of population growth in Beijing during 2001–2015. Data source: Beijing Statistical Yearbook (2001–2015).
Sustainability 10 03927 g013
Table 1. Scores and weights for each particular indicator value in assessment.
ScoreSoil ConditionsTopography
Soil TextureSoil ProfileBulk Density (g/cm3)Effective Soil Thickness (cm)Soil Organic Matter (%)Slope (◦)
100Heavy loamloam/loam/loam, loam/clay/loam1–1.25≥150≥4.0≤2
90Clayloam/clay/clay, loam/sandy/loam, sandy/clay/clay≤1, 1.25–1.35100–1503.0–4.02–5
80Medium loamclay/sandy/clay, clay/clay/clay 2.0–3.05–8
70Light loamgravel/clay/gravel1.35–1.4560–1001.0–2.0
60Sandy loamloam/sandy/sandy 0.6–18–15
50Sandy soilclay/sandy/sandy1.45–1.55 ≤0.6
40Gravel soilsandy/sandy/sandy, gravel/gravel/gravel 30–60
30 >1.55 15–25
20
10 ≥25
Weight0.150.120.10.20.130.3
Table 2. Urban expansion rate and intensify during 1980–2015 in Beijing.
YearUrban Land Area (km2)PhasesArea of Expansion (km2/year)Expansion Rate (%)Expansion Intensity (%)
19804711980–19901.430.300.01
1990485.291990–200054.9711.330.33
20001035.012000–201037.173.590.23
20101406.742010–201547.163.350.29
20151642.521980–201533.477.110.20
Table 3. Farmland loss rate and intensity during 1980–2015 in Beijing.
YearFarmland Area (km2)PhasesArea of Loss (km2/year)Loss Rate (%)Loss Intensity (%)
198059031980–19904.760.080.03
19905855.411990–200093.421.600.57
20004921.182000–201048.030.980.29
20104440.892010–201573.941.660.45
20154071.201980–201552.340.890.32
Table 4. The dependence and contribution of urban expansion on farmland loss during 1980–2015.
1980–19901990–20002000–20102010–2015
CI0.750.720.630.57
FI0.070.340.480.15
Table 5. Proportions of farmland quality levels lost by urban expansion in Beijing during 1980–2015.
ClassQI1980–19901990–20002000–20102010–2015
Lower-quality≤0.98.735.476.9811.18
Medium-quality0.9–1.177.7879.6389.0384.93
Higher-quality>1.113.4914.903.993.89