Article

Sustainable Development of Water Resources: Spatio-Temporal Analysis of Water Stress in South Korea

1
Department of Civil Engineering, Inha University, Incheon 22212, Korea
2
Civil Engineering Department, The City College of New York, New York, NY 10031, USA
3
Department of Earth and Environmental Engineering, Columbia University, New York, NY 10027, USA
*
Author to whom correspondence should be addressed.
Sustainability 2018, 10(10), 3795; https://doi.org/10.3390/su10103795
Submission received: 30 September 2018 / Revised: 13 October 2018 / Accepted: 17 October 2018 / Published: 20 October 2018

Abstract

:
The development of South Korean water resources has been heavily concentrated in a few areas, corresponding to regions that have experienced economic growth. The resulting competition for the resource is leading to calls for more equitable water distribution. The objective of this study is to evaluate water stress areas for sustainable water resources management. For this, a spatially distributed water stress index that accounts for climate variability at intra- and inter-annual time scales is developed and applied to South Korea to better understand the water allocations, and the subsequent water stress. Water demand (household water, industrial water, agricultural water, and livestock water) and water supply (precipitation use, reservoir use, stream use, and underground water use) estimates based on the period 1973–2009 were used to compute the normalized deficit index (NDI) and normalized deficit cumulative (NDC) for each hydrologic basin. Water stress was assessed for each of the four decades (1973–1982; 1983–1991; 1992–2000; 2001–2009). The overall water stress has decreased in 2000–2009 compared to 1973–1982 because of water infrastructure development. However, while the risk of water stress was low in the Han River basin, the Nakdong River was found to be very vulnerable to water stress. It was possible to investigate where water management strategies are needed for the sustainable development of South Korean water resources.

1. Introduction

South Korea has achieved rapid economic growth since the 1960s. However, this has been accompanied by an increase in the overall water demand for industries and agriculture. The mean annual precipitation for South Korea is about 1245 mm, approximately 1.4 times greater than the global average of 880 mm. Nonetheless, per capita annual renewable water availability (as measured by annual precipitation) is about 2591 m3, about 1/8th of the global average due of high population density [1]. Further, 72% of the precipitation occurs during the flood season (June to September) through the East Asian monsoon and tropical depressions (typhoon). The national water policy’s central focus on maximizing economic growth has led to an increase in the regional imbalance in water availability [2]. The equitable distribution of water resources is emerging as an issue of regional conflict [2]. As competition for water increases across different use sectors, the temporal variability in available supply leads to increasing pressure to develop surface storage, or to use groundwater resources. Scarcity and quality of freshwater will heavily constrain water security for society, businesses and the environment in the future. Ensuring sufficient water supply for all the sectors is hence a challenge to consider first for sustainability in the 21st century.
Traditionally, water supply planning has focused on developing new resources as demand increased. However, in the current times, limitations on making large new reservoirs, restrictions on groundwater sources, increasing development costs and concerns for environmental impacts limit the ability to develop new resources. South Korea is using reservoir water for 52% of total water usage [1] and has significant trans-basin diversions since the seasonal difference of precipitation is very high. Thus, the stress and system reliability as measured by existing drought indices (e.g., Palmer Drought Severity Index: [3], Thornthwaite Index: Thornthwaite, [4,5], and Standardized Precipitation Index: McKee et al. [6]) may be significantly different from the actual impact in each basin. To determine the reliability of the existing water systems, one needs to develop estimates of potential water shortages not only due to droughts of varying severity and duration that result from natural variability in climate, but also due to changes in near to long-term demands. Consequently, we present a quantitative analysis that measures the water stress and system reliability for South Korea arising from variations in the water supply and due to changes in water demand by the economic growth and population increase. We attempt to understand how water stress and its spatial distribution have evolved over the last 40 years in South Korea, and the implicit role of water infrastructure in this evolution.
The procedure of this study is as follows. First, a database of water supply and demand is established to evaluate water stress for sustainable development of water resources. Next, an improved method based on water balance is provided which analyzes the spatio-temporal distribution of water stress. Finally, we provided an idea for sustainable development of water resources in the future through evaluating the impacts of development of water resources in the past on current water stress.
Section 2 presents the water resources management context for South Korea. In Section 3, we present the underlying methodology and results of water risk and system reliability measures. In Section 4, we discuss implications for sustainable water resources development in South Korea. Finally, we conclude the study in Section 5.

2. Water Resource Management in South Korea

Located in the Eurasian Continent on the Pacific Ocean (latitude 33° N–38° N, longitude 125° E–132° E), South Korea is significantly influenced by the East Asian monsoon and typhoon. Most of the annual precipitation (about 62.7%) occurs in the summer season (end of June to the beginning of September) with some precipitation during winter and spring. The mean annual precipitation is about 1300 mm (1986–2015). The South Coastal region and mid-upper streams of the Han River receive high precipitation and the middle streams of Nakdong River receive lower precipitation (see Figure 1). The variability of annual precipitation is relatively high in the south. The Korean Peninsula has a high gradient in the east and low gradient in the west. The slope is steep, and the length of a river is short. As a result, most precipitation occurring in a flood season tends to flow out all at once. There are 17 large reservoirs in South Korea primarily designed for water supply and flood control [1]. Figure 1c shows the east-west gradient and the storage volumes for each of the 17 multipurpose dams. Natural variations in climate in combination with increasing population demands are causing water stress in the region.
South Korea’s population density is about 513/km2 [7], considerably higher than the world average of about 53/km2. Besides, with the economic development since the 1960s, South Korea’s population has increased by more than 80% from about 27 million in 1965 to about 49 million in 2009. The population of the cities greatly increased. Seoul had a 275% growth in population from 1973 to 2009 (see Figure 2). This has led to increasing water demand and stress in the region of Seoul along the Han River basin, even though this is an area with high precipitation (see Figure 1a). Variability in rainfall is a key factor for water management. Rainfall variability may be a more important determinant of per capita income of nations than mean annual rainfall, and is hence a significant factor in the economic growth of a country [8]. Even if water is not used excessively, persistent shortage/drought induced by climate conditions can lead to stress. In light of this, we present the water risk for South Korea based on the magnitude of water deficits as a result of variability in supply and demands. The impact of cumulative deficits over time like multiyear drought impacts on the available surface and groundwater resources is also presented. The metrics specifically assess water risk posed by within-year and over-year variations in renewable water supply and changing water demand. Application of these indices at a basin level for South Korea is presented.

3. Water Risk and System Reliability Metrics

3.1. Water Stress Indices

The Water Risk Indices used here were developed by Devineni et al. [9] that are based on the sequent peak algorithm originally developed for reservoirs [10,11,12]. The computation of these indices as presented in Devineni et al. [9] is as follows:
For the jth geographical unit we define the following quantities:
d e f i c i t j , t = m a x   ( d e f i c i t j , t 1 + D j , t   S j , t , 0 )
  S I I j = m a x y ( m a x t ( d e f i c i t j , t ( y ) ;   t = 1   :   365 ) ;   y = 1   :   n )  
  S I C j = m a x t ( d e f i c i t j , t   ;   t = 1   :   n × 365 )  
where d e f i c i t j , t refers to the accumulated deficit, D j , t is total water demand, and S j , t is the total water supply volume, for geographical location j and day t and y to a year. The corresponding normalized indices, are
  N D I j = S I I j A P j
N D C j = S I C j A P j
where A P j is the average annual rainfall volume for basin j estimated by multiplying the area and the average depth of precipitation.
The daily water deficit is calculated from the difference between the daily water demand and supply. These daily deficits are accumulated while setting negative accumulations to zero. The NDI is the maximum accumulated deficit in a given year in relation to the average annual precipitation and the NDC is the maximum accumulated deficit for the whole time period of interest as it relates to the average annual precipitation. Devineni et al. [9] have also prescribed a comparison of NDI and NDC, through which we can assess whether a region is prone to multiyear drought risk and whether the resulting shortages will exceed the average renewable endogenous supply in the region or not. Nonetheless, unlike Devineni et al. [9] who took an approximation approach based on a fraction of local precipitation as renewal water supply, in this present analysis, given the access to water resources data in South Korea, we considered precipitation, surface water and groundwater (i.e., all possible water sources) for water supply.

3.2. Data Collection and Processing

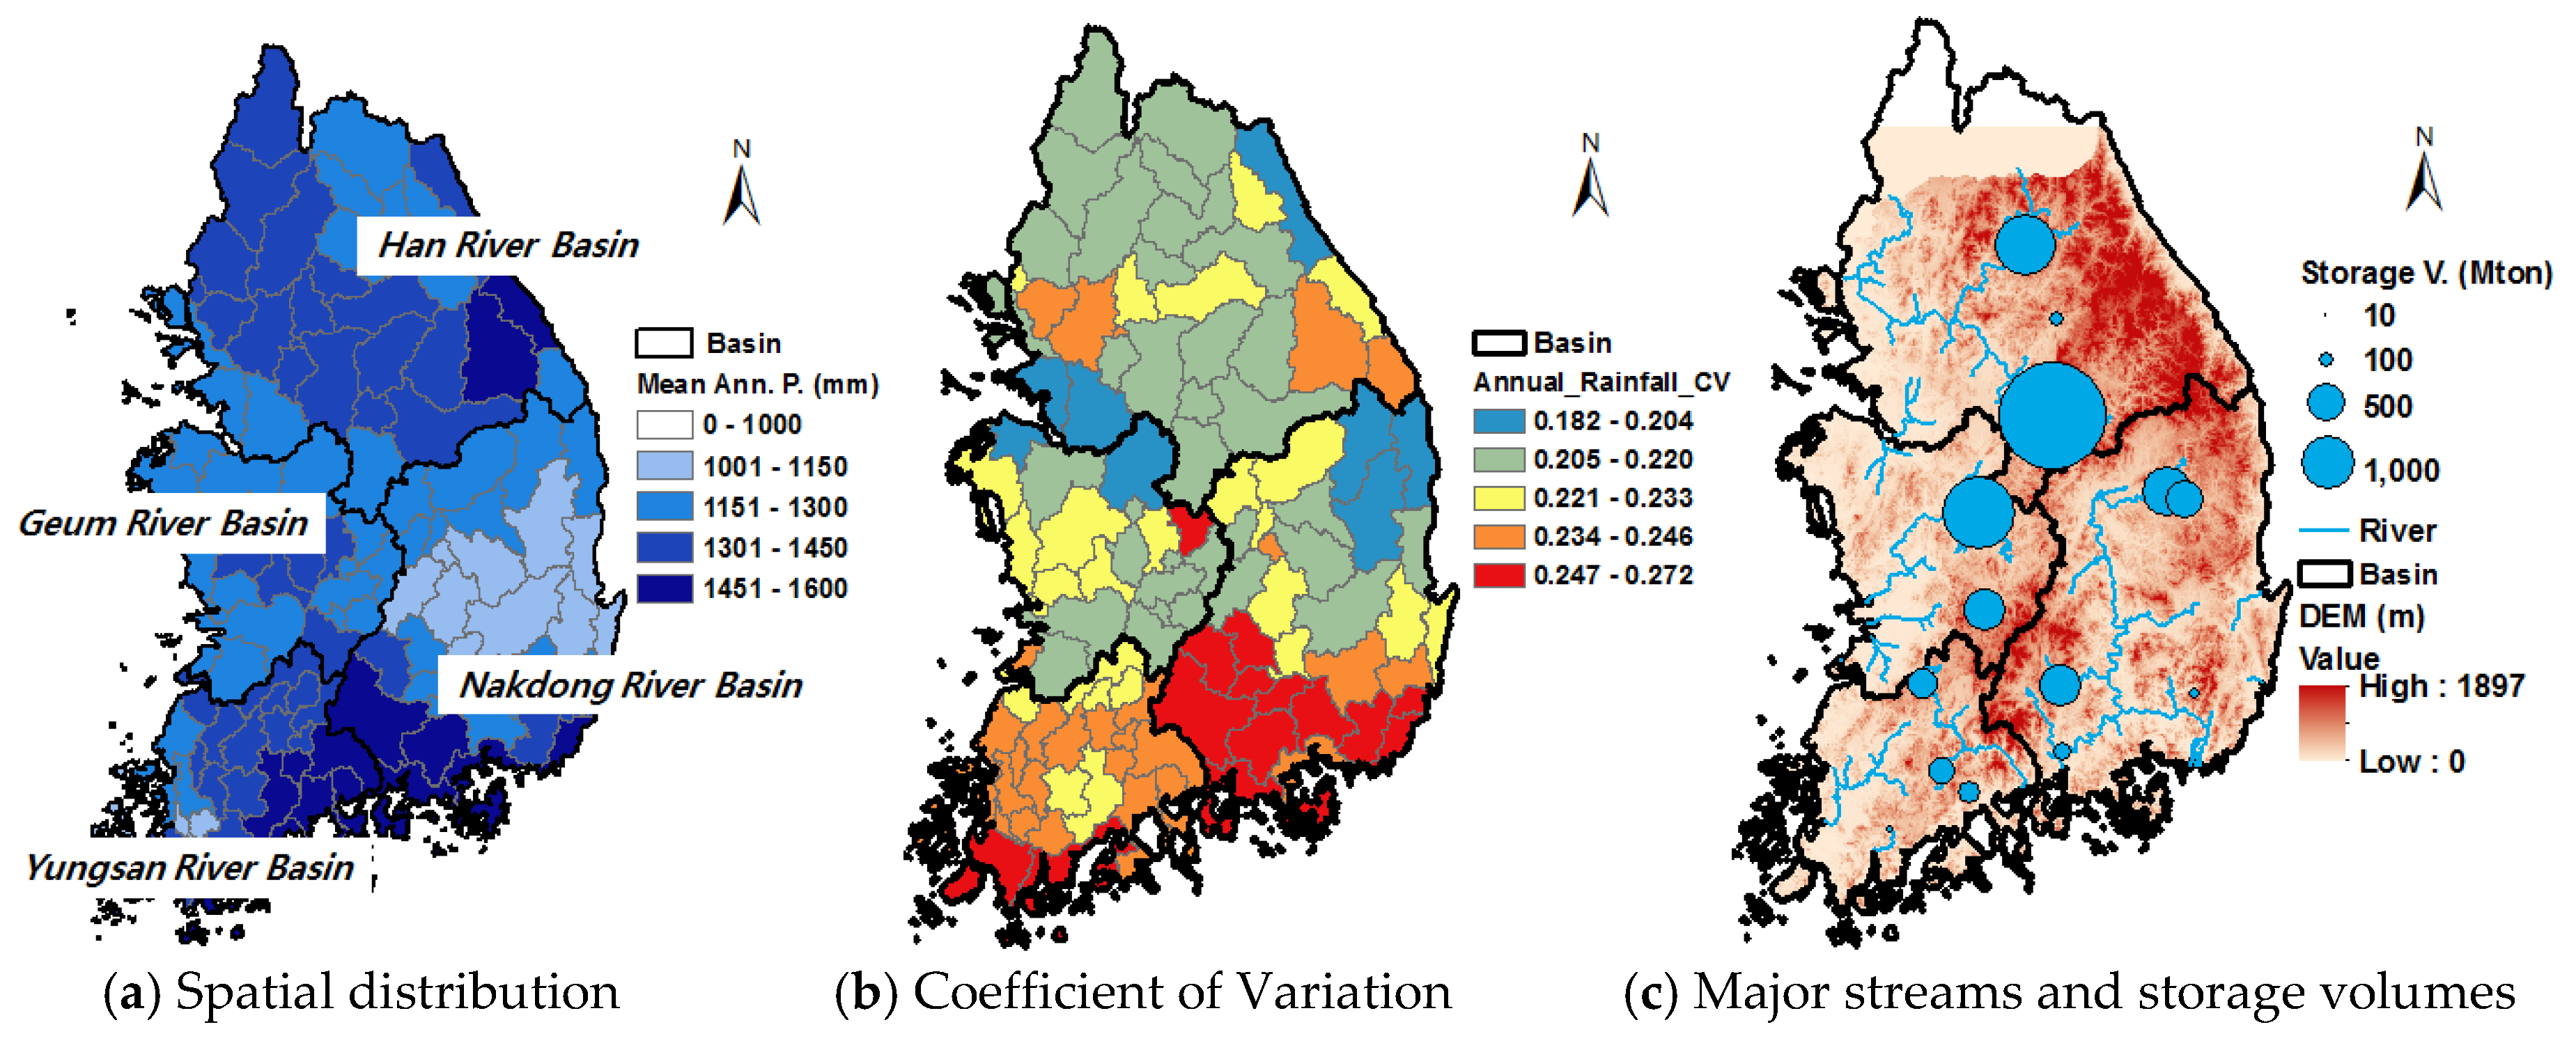
We compute the water risk for each sub-basin in South Korea. Water resources units in South Korea are classified into basins (low definition, four units), sub-basins (medium definition, 113 units) and watersheds (high definition, 840 units). Among them, sub-basin units have similar characteristics to the administrative districts. We collected the water supply and demand data for the sub-basins (113 units). 37 years of daily data on water supply and water demand from 1973 to 2009 are collected from the Water Management Information System (WAMIS; www.wamis.go.kr). WAMIS provides data on hydrometeorology, basin characteristics, river flow, dam storage and operations, groundwater levels and water use.
Water demand ( D j , t ) can be classified into household water use ( H j , t ), industrial water use ( I n j , t ), agricultural water use ( A g j , t ), and livestock water use ( L S j , t ).
  D j , t = H j , t + I n j , t + A g j , t + L S j , t  
We assumed a constant daily household, industrial, and livestock water usage. We used a per-capita daily water usage of 359 L [13] with the annual population data to estimate the domestic water consumption.
Annual industrial water use data for each sub-basin is available from the WAMIS database. Further, livestock water usage data for each sub-basin is available from the Korea Statistics website (http://kostat.go.kr).
We quantify the agricultural water demand ( A g j , t ) as the estimated total crop water requirement for ten major crops cultivated in the country. For each cultivated crop in a sub-basin, we calculated the water use based on the estimated crop growth stage, and FAO recommended reference crop evapotranspiration on a daily time scale [14].
Daily air temperature data is used to estimate the potential evapotranspiration for each sub-basin based on the Penman Monteith method [15]. The Penman Monteith method is recommended as the standard method for estimating the evapotranspiration if the relevant data is available. Time series of the crop area planted is obtained from the Korean Statistical Information Service (http://kostat.go.kr).
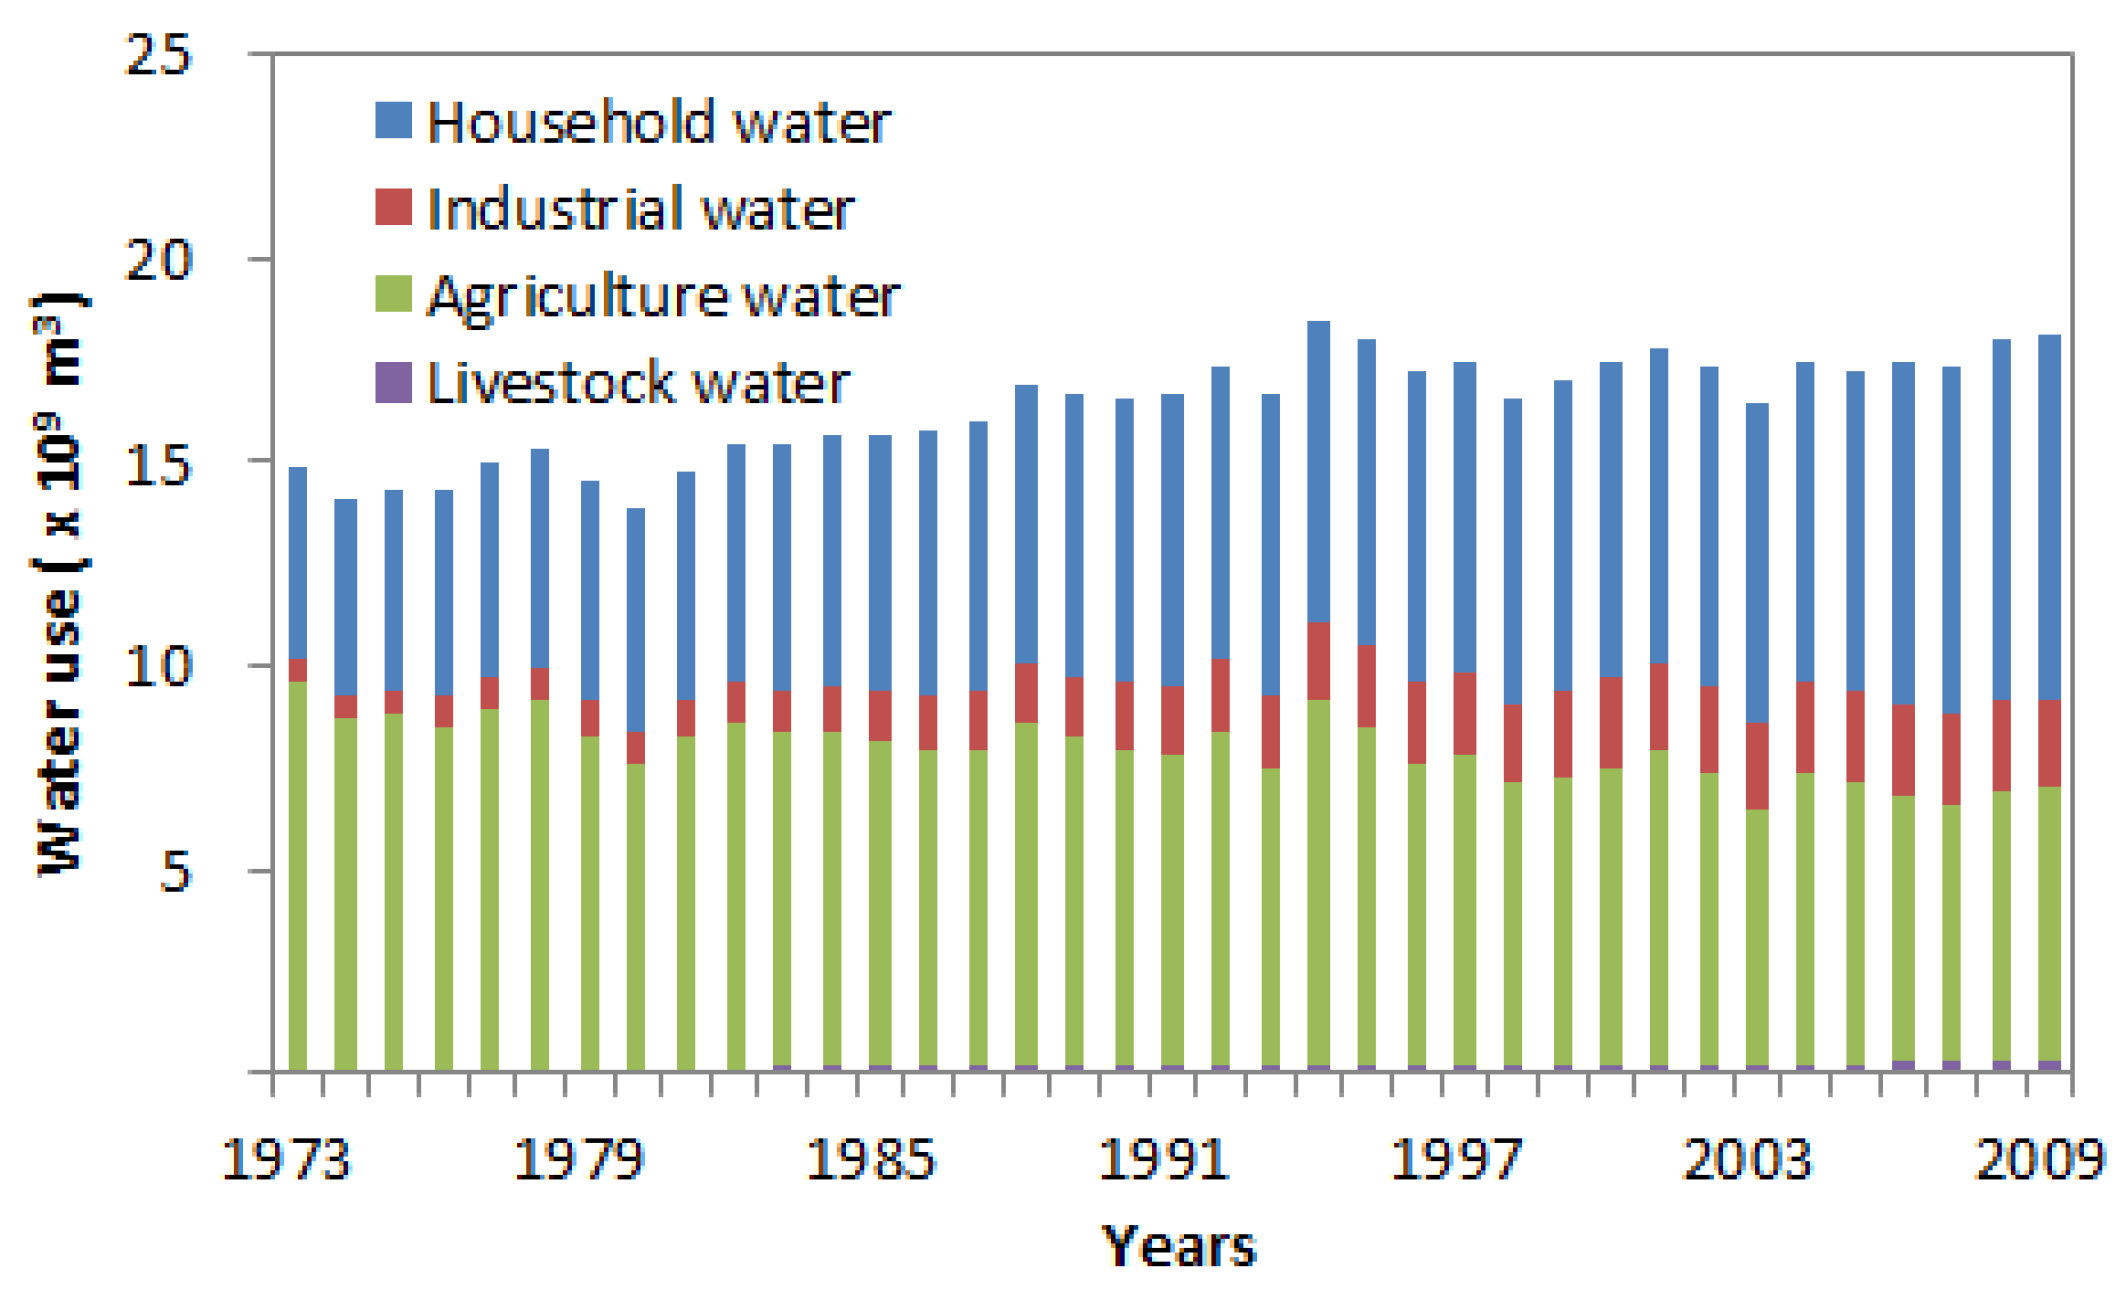
The time series of the estimated water demands from 1973–2009 is shown in Figure 3. Decreasing farm area over the 37 years led to a reduction in the demand for agricultural water (by about 29.3%). However, due to the increase of household water demand (by about 88.9%) caused by the population increase and industrial water demand (by about 323.1%) caused by the economic growth, the overall water demand has increased by about 21.7%. 
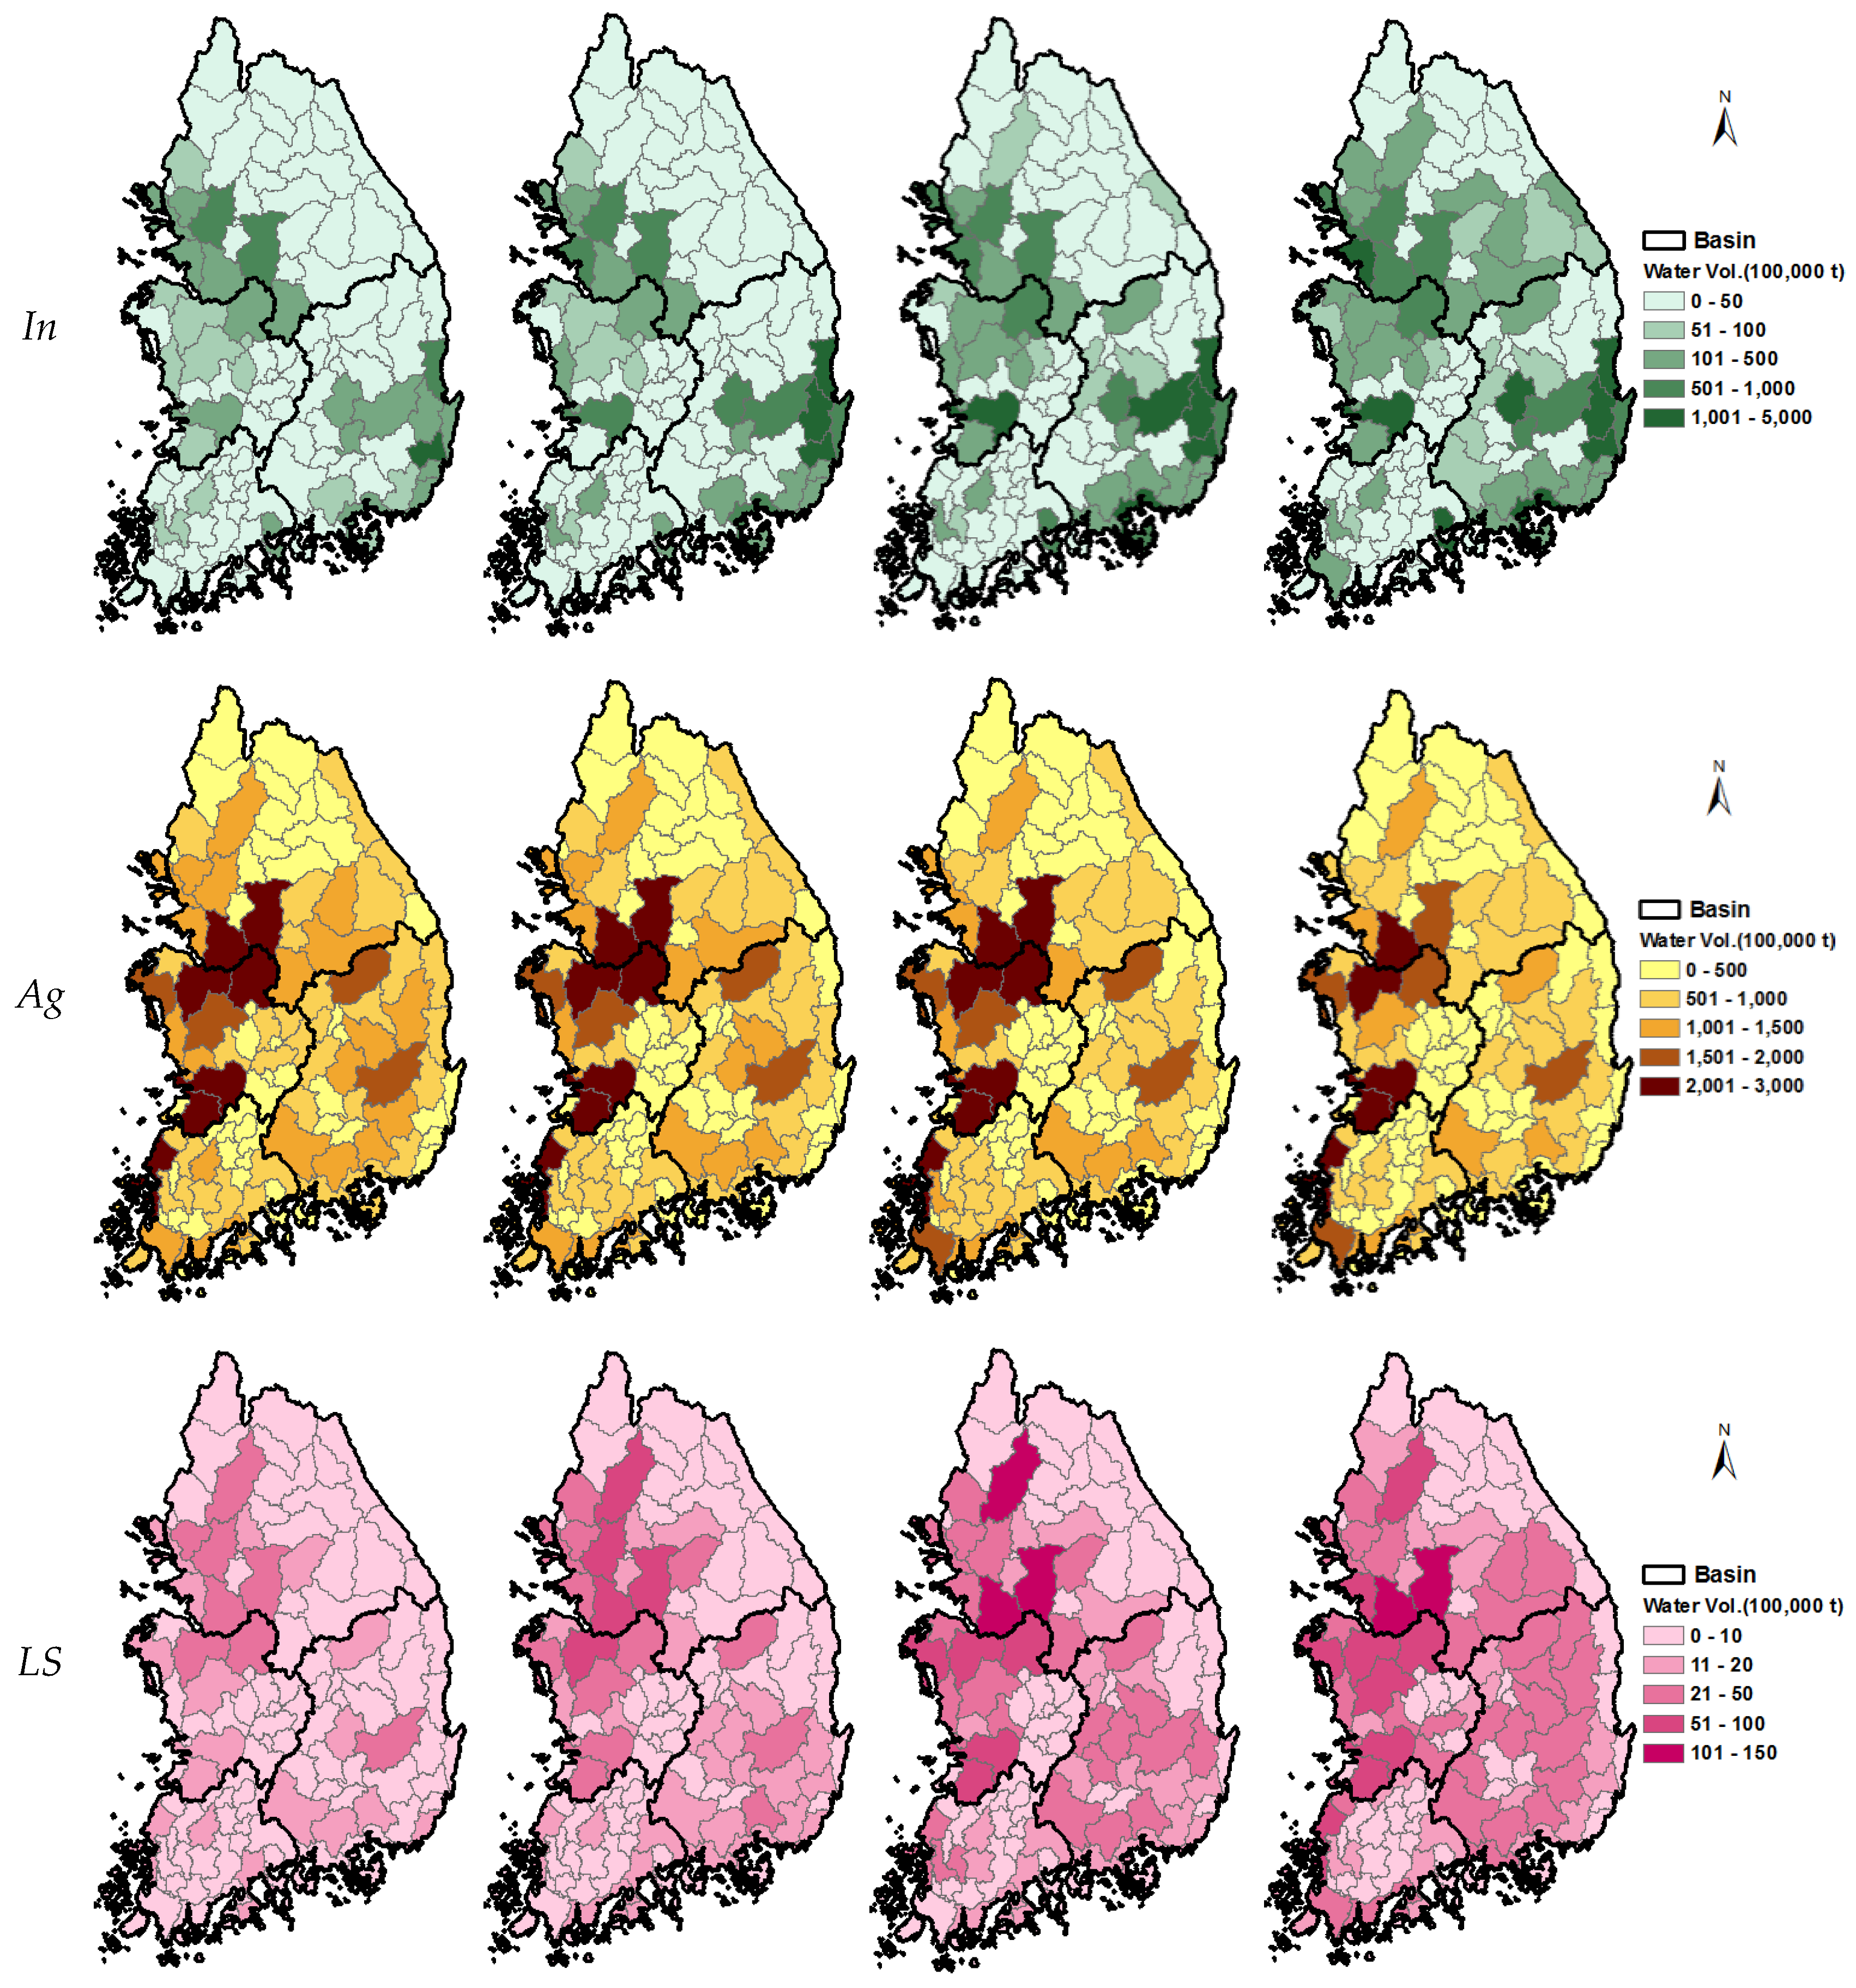
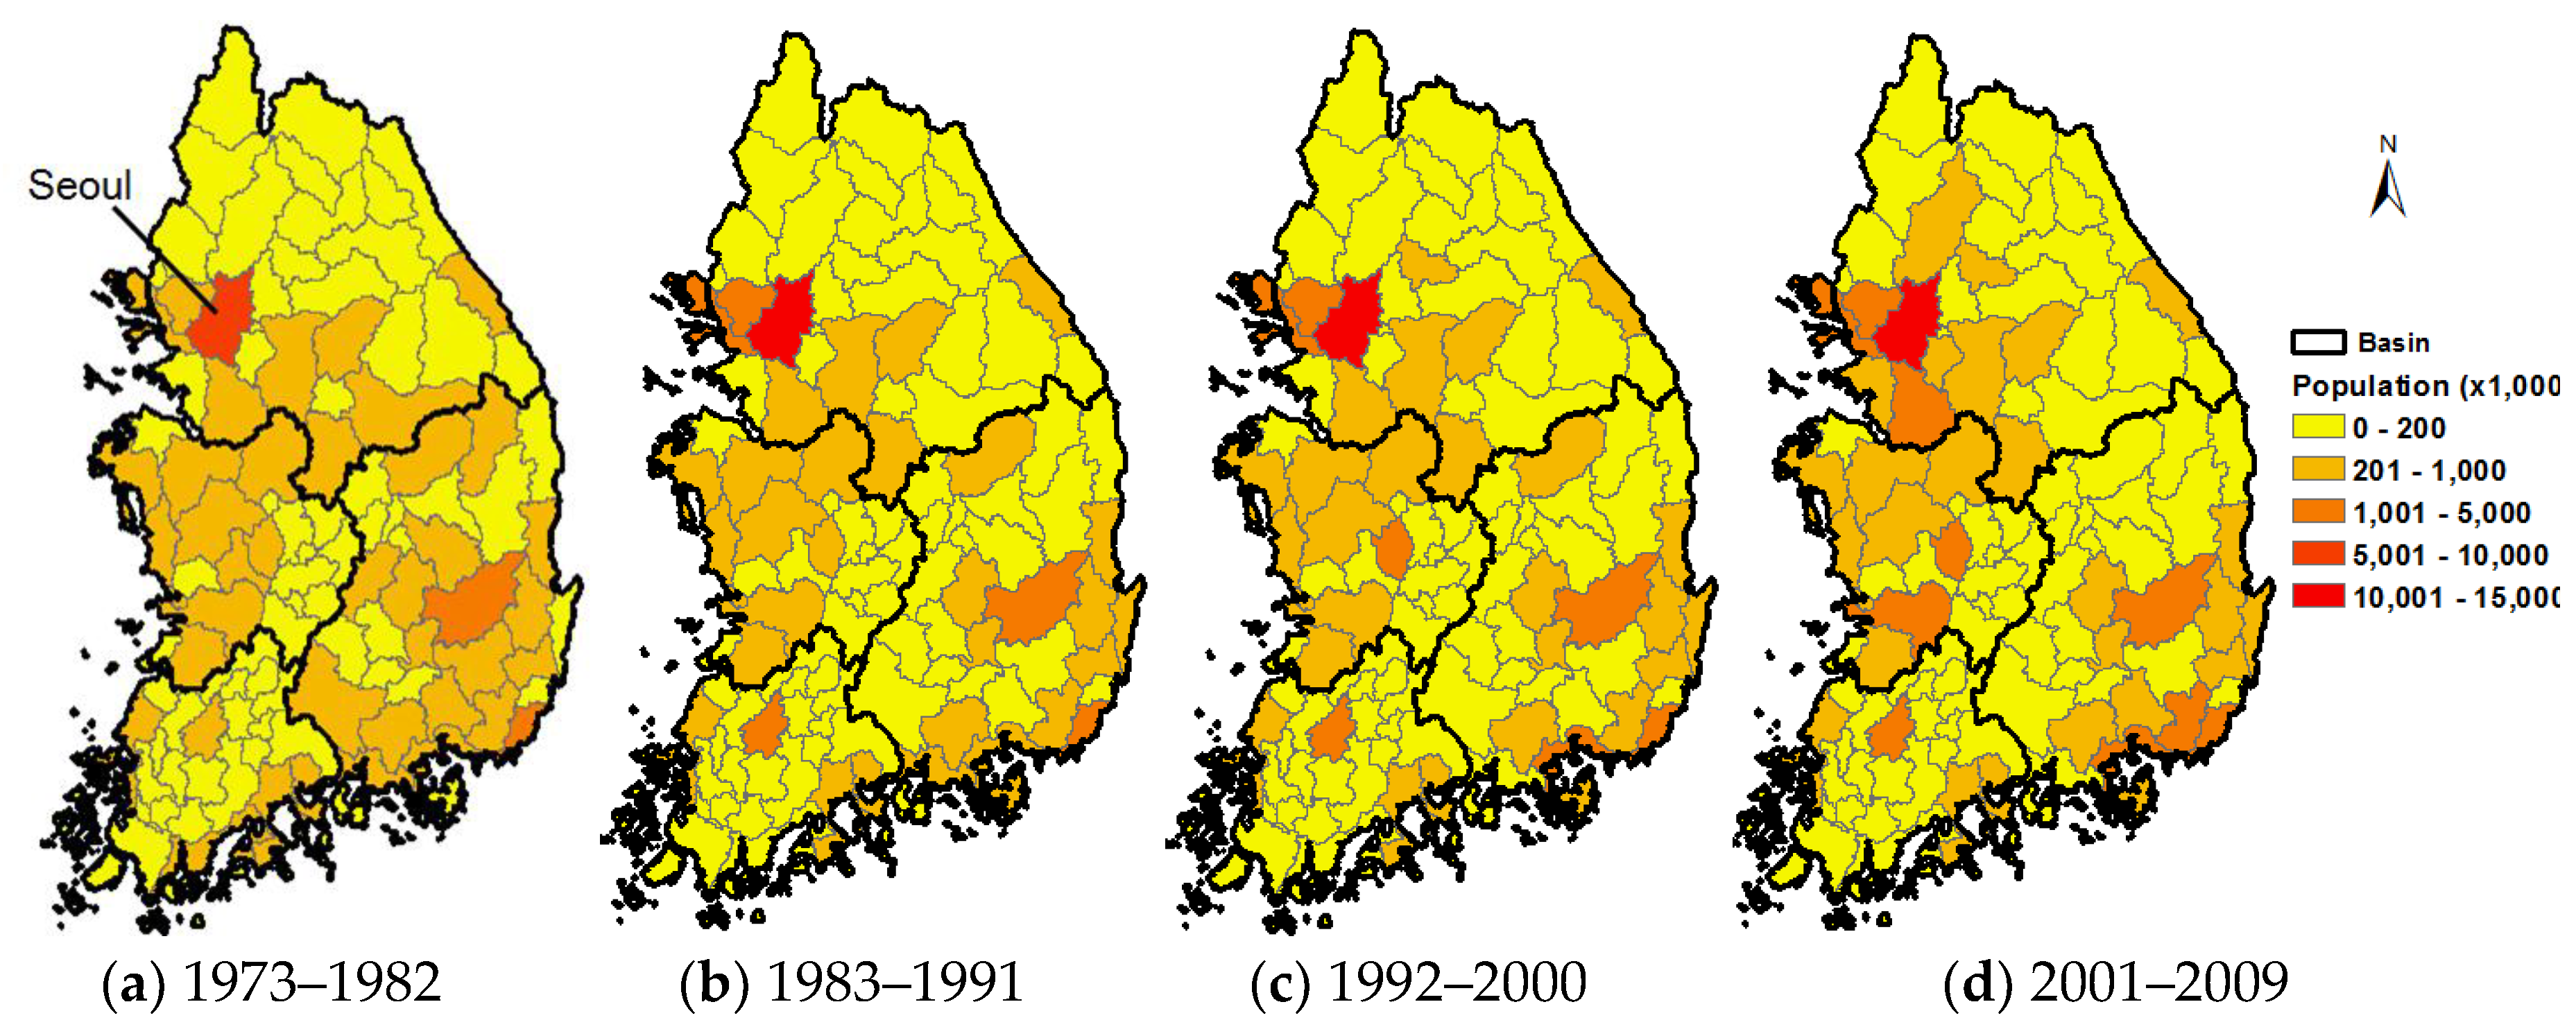
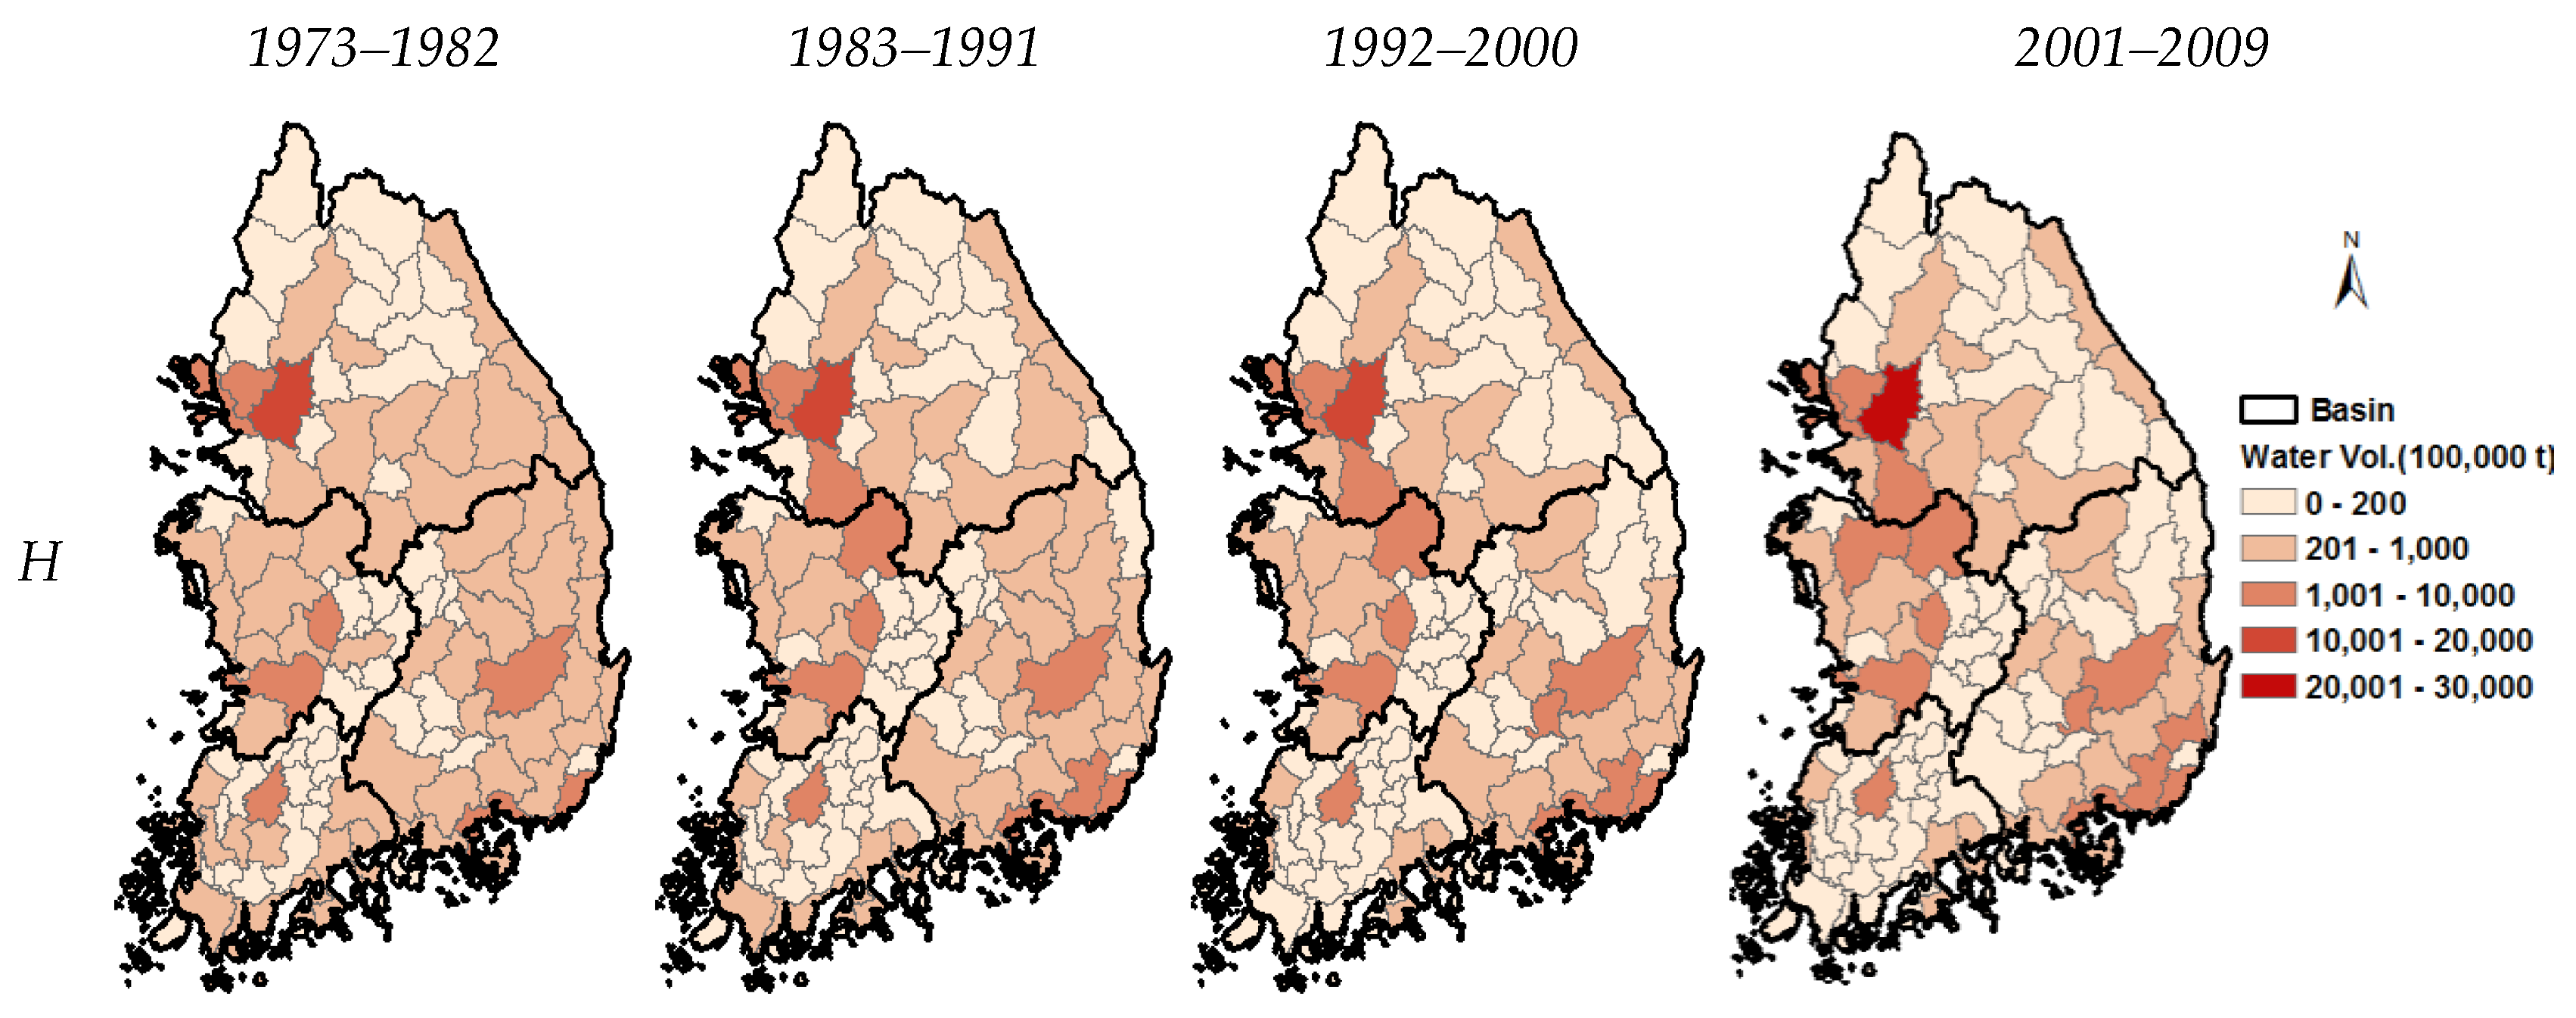
Figure 4 presents the spatio-temporal distribution of average water use for each sector over the last four decades (1973–1982, 1983–1991, 1992–2000, and 2001–2009). Notice the spatio-temporal shifts in water use patterns.
The water supply ( S j , t ) is classified into what is available as a fraction of the direct precipitation as the renewable water resource in each sub-basin ( P U j , t ), the water supply available from reservoirs as surface water resource ( R U j , t ), and groundwater supply ( U U j , t ). The relevant data were collected through WAMIS.
  S j , t = P U j , t + R U j , t + U U j , t  
Precipitation supply, PUj,t,is estimated as shown in Equation (8).
  P U j , t = α 1 P j , t A C j , t + α 2 P j , t ( A j A C j , t )  
where P j , t is the precipitation for any day t over a basin j. A j is the geographical area of the basin and A C j , t is the net cropped area of any day t for the basin. α 1 determines the effective rainfall [14] that the crops can utilize from the total rainfall in a day over the net cropped area. α 2 determines the amount of rainfall that can be harvested and used from the non-cropped area ( A j A C j ). The parameters α 1 and α 2 vary regionally and parametrically based on the information available. They conceptually embody the processes one could model for bare soil evaporation, soil moisture dynamics, and runoff generation [9].
In this study, the coefficients α 1 and α 2 are developed using information on an annual average water balance. The annual average renewable water supply based on precipitation in each basin, which is the difference between precipitation volume in each basin ( P j , y ¯ ( t ) × A j ) and outflow volume ( O j , y ¯ ( t ) ), can be expressed as shown in Equation (9).
  P U j , y ¯ ( t ) = P j , y ¯ ( t ) × A j O j , y ¯ ( t )  
We obtained the annual average runoff data ( O j , t ) 
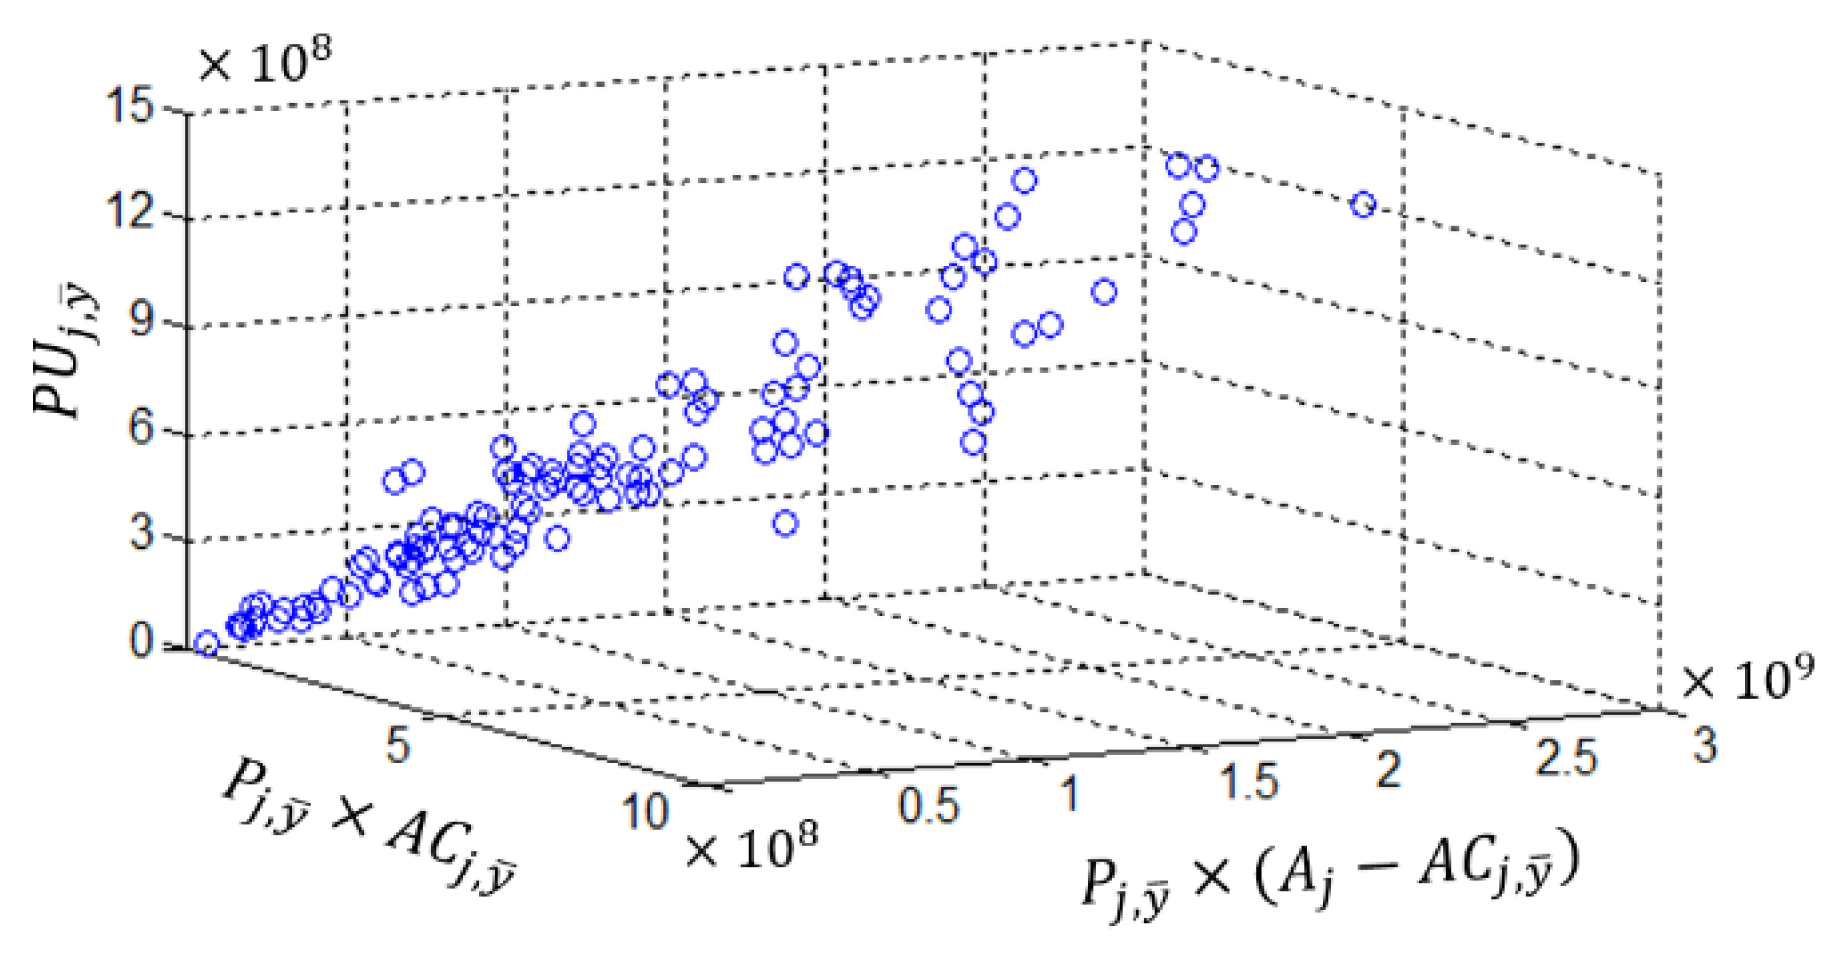
) for each sub-basin from WAMIS. Using Equations (8) and (9), we fit a multiple linear regression for precipitation use ( P U ) based on the precipitation on farmland ( α 1 P t ) and utilizable water on the non-farm land ( P t ( A A C ) ) ; see Figure 5, Multiple correlation coefficient 0.992, R2 0.984. Accordingly, 0.52 was used for α 1 and 0.43 was used for α 2 .
To determine the reservoir supply ( R U j , t ), the change of storage volume ( Δ V R , t ) according to inflow volume ( V I , t ) and outflow volume ( V O , t ) as shown in Equation (10) is estimated for each reservoir.
Δ V R , t = V I , t V O , t ,   V R m i n V R V R m a x
where V R refers to the reservoir storage volume, V R m i n refers to the minimum storage volume, and V R m a x refers to the maximum storage volume.
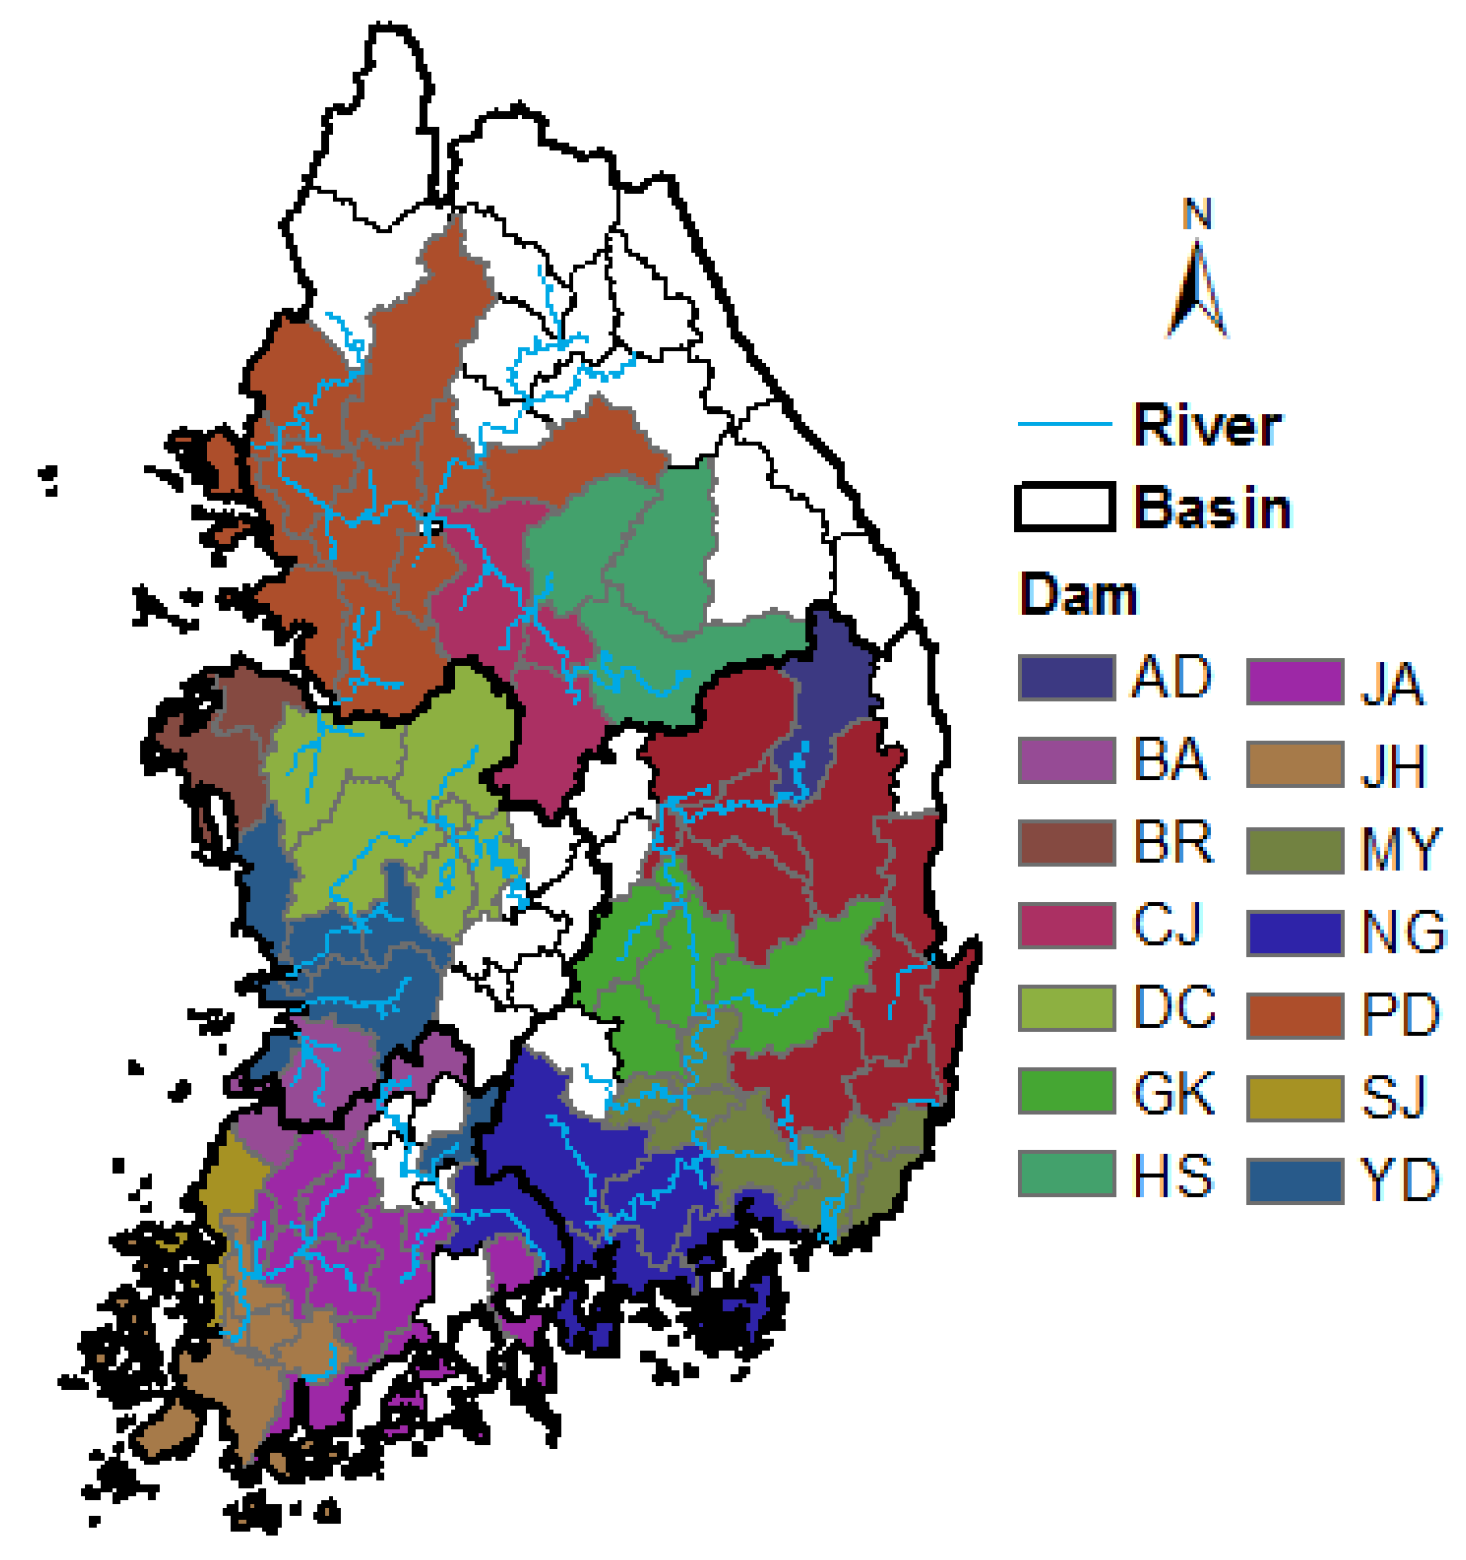
The total reservoir inflows accounting for trans-basin diversions (See Figure 6) and reservoir outflows as recorded in the database were used for these calculations. Table 1 shows the information about the multipurpose dams, which have a large water supply volume, among the reservoirs considered in this study. Some sub-basins around a dam can use the water through water transfer facilities as long as the quantity of water in the dam is sufficient for transfer.
For underground water supply ( U U j , t ), the data estimated as the use of underground water in each unit area were converted to daily data for utilization. Here, it was assumed that the intake of the underground water is available for the whole period from the data of the Water Management Information System.

3.3. Assessment of Water Stress

Water deficit is defined as the difference between the water demand and renewable water supply. Typically, a water deficit occurs because of an increase of water demand or decrease of water supply in spite of the development of a new water source, as shown in Figure 7. The maximum accumulated deficit estimated over an n-year period (SII) measures the potential impact of multiyear droughts in the n year period. The measure provides insights on the time-evolving vulnerability to drought arising from changes in the climate and from that due to changes in non-climatic conditions (e.g., demand). It also provides a robust planning measure of the ability to meet the demand without failure for the worst dry periods in the time period. One can develop effective planning strategies for the managers to minimize the drought impacts in the current or future climate and demands.
The cumulative deficit accounting measure also provides other important planning characteristics like the duration, severity and recovery time for the droughts [16]. Figure 7 provides a schematic of how we compute these attributes. The period or the time until the maximum cumulative deficit (peak) is defined as the drought critical duration when the cumulative deficit creeps from zero to the maximum cumulative deficit. This is when the system is most vulnerable. The maximum cumulative deficit is defined as the drought severity. The time from the maximum cumulative deficit to the time the deficit recedes back to zero is defined as the recovery time.
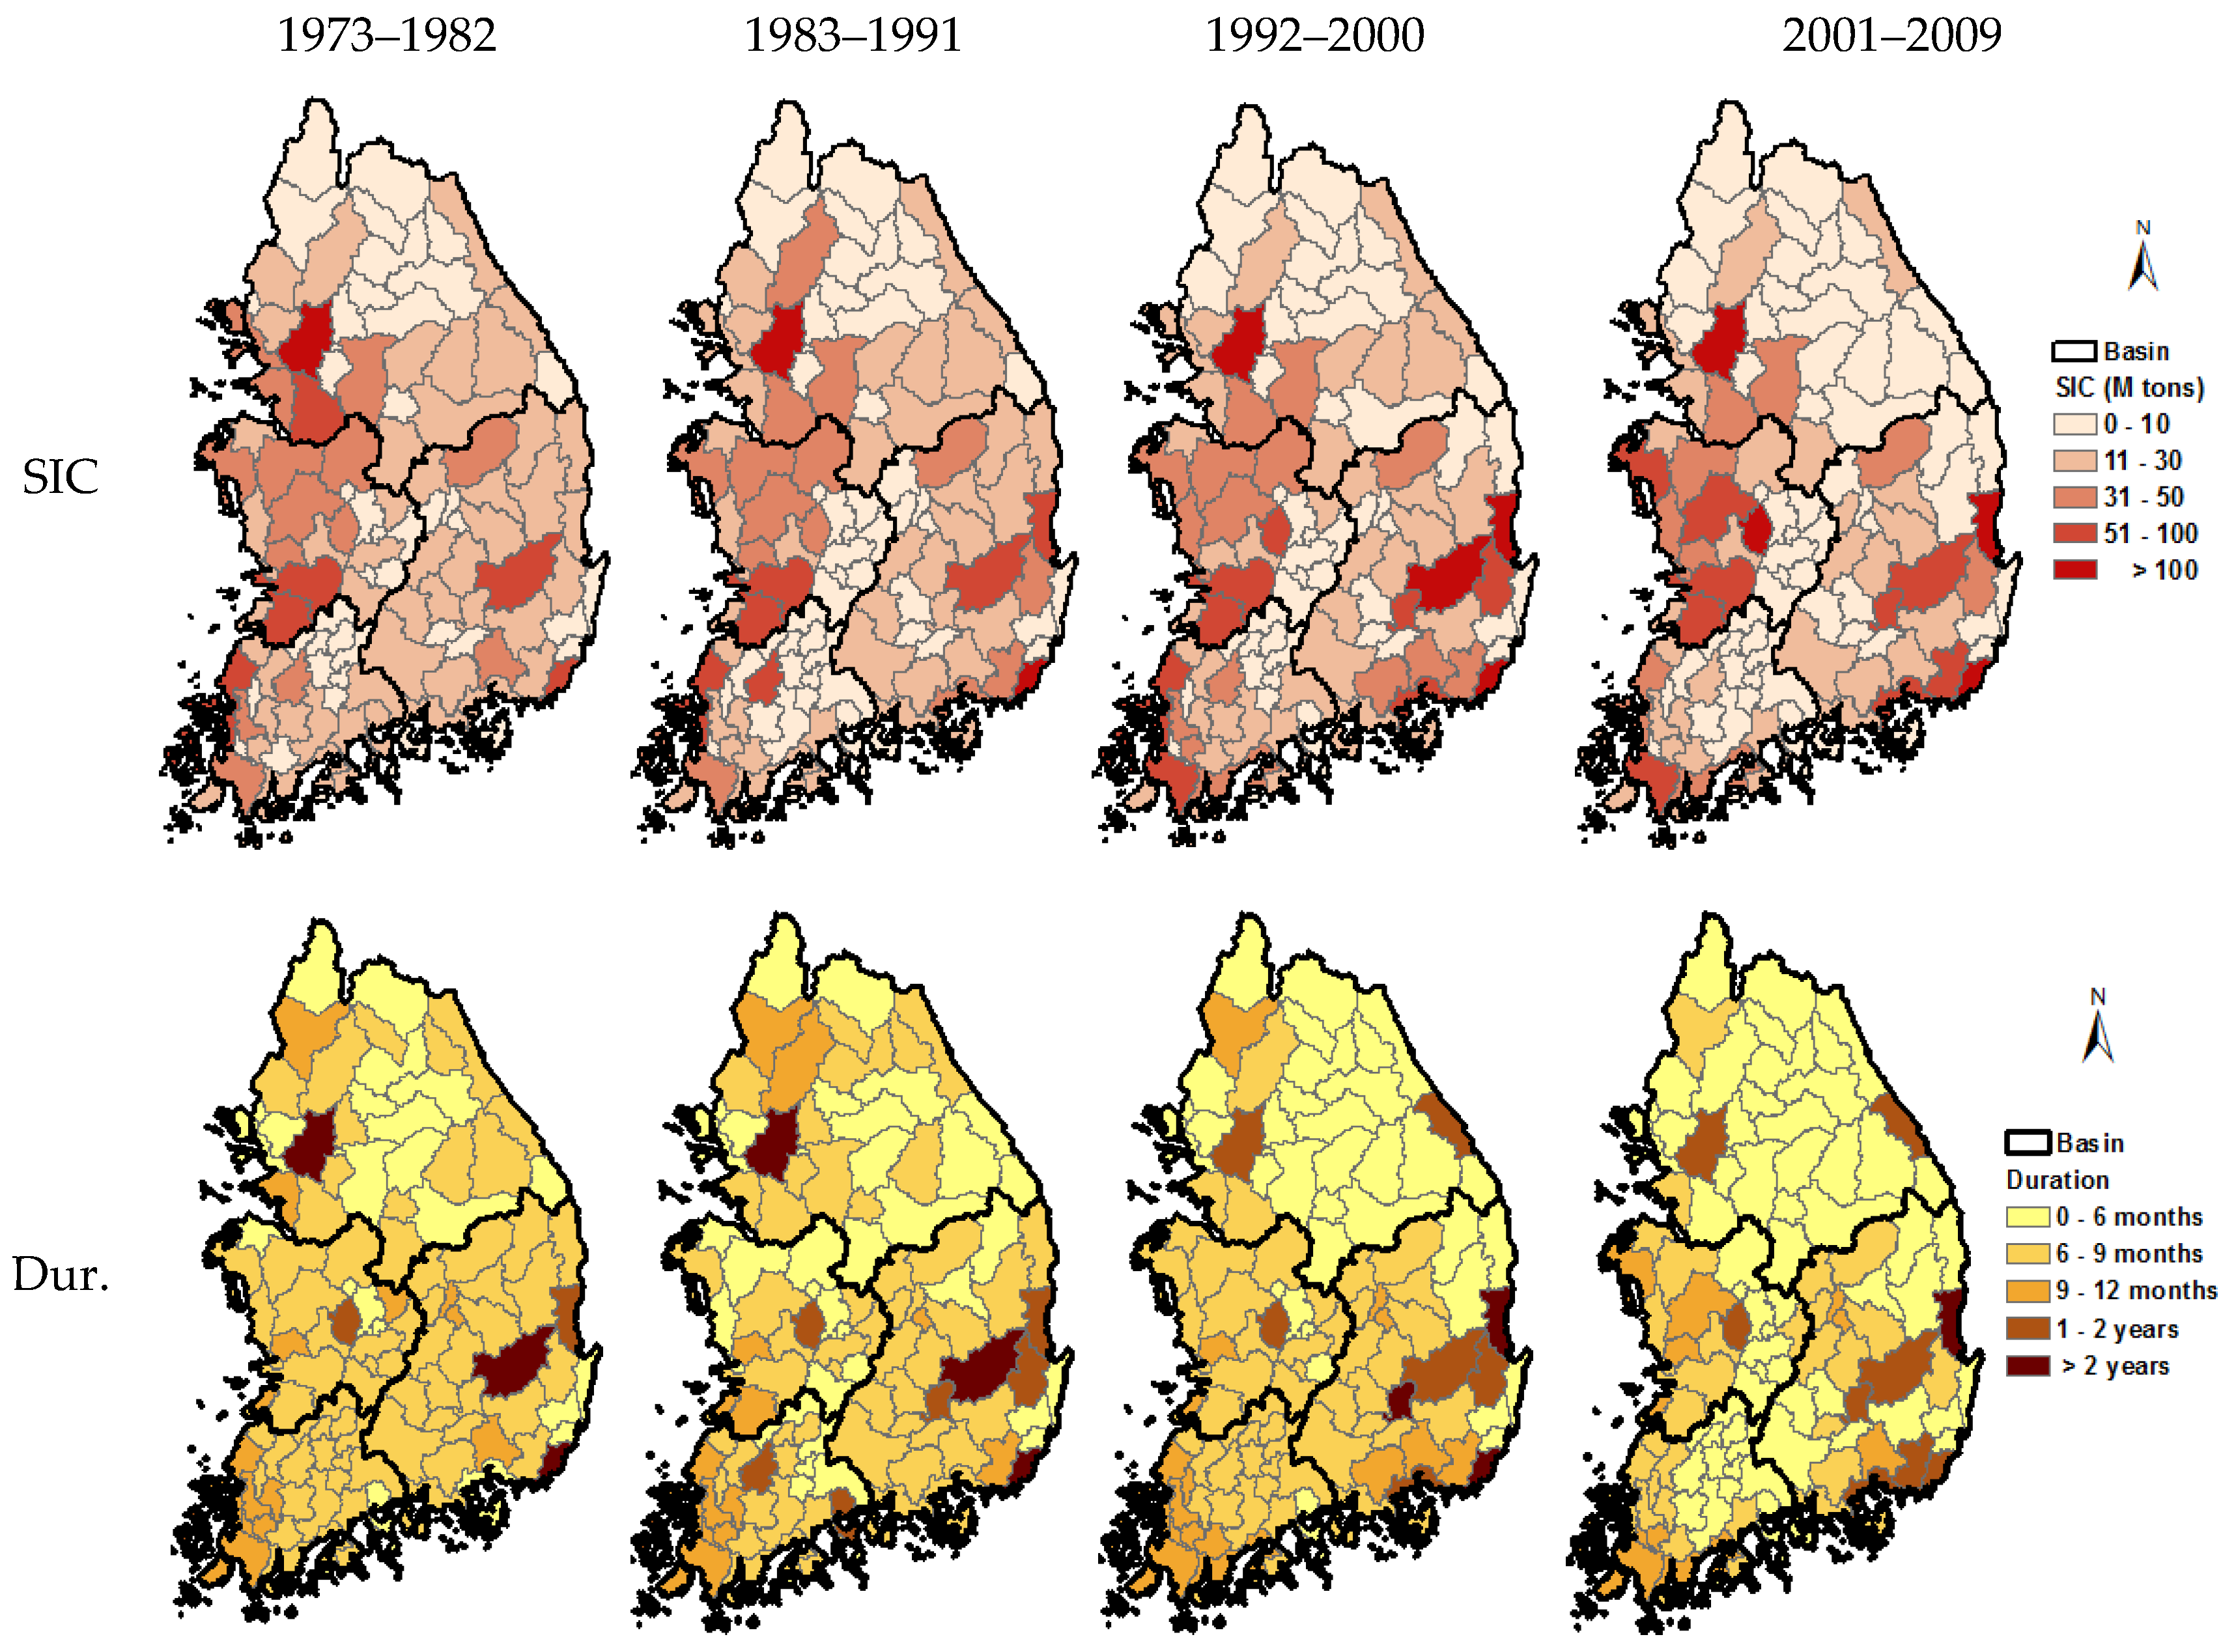
The drought severity (SIC, Stress Index Cumulative) and duration were estimated for each of the four decades (1973–1982; 1983–1991; 1992–2000; 2001–2009) and the spatial distributions in the each period are shown in Figure 8.
The SIC, and duration have decreased spatially in the Korean peninsula, but their magnitudes have increased in some sub-basins (Figure 8). This is primarily due to the movement of population and the addition of new reservoirs as water sources.
Based on SIC estimation for all basins, the corresponding normalized estimates, NDC, were estimated using the Equations (4) and (5) to quantify the extent of water stress in each decade. The extent of the water stress was classified into 5 criteria, as “Very Good (0–0.01)”, “Good (0.02–0.05)”, “Mediocre (0.06–0.10)”, “Serious (0.11–0.50)”, and “Very Serious (more than 0.50)” as per the published white papers for the drought event in 2001 as the first report for drought assessment from the Korean government that are the Report of the 2001 Drought Investigation Record in Korea [17]. These results are shown in Figure 9. The Figure 9a,b show the water stressed areas in the 1st period and 2nd period. A large number of regions were found to be water-stressed. This may be a manifestation of demand increase in the urban regions during these decades. Figure 9c,d show the distribution in the 3rd period and 4th decades. The water stress in many regions was found to have been resolved or have decreased compared with the 1st and 2nd periods. Specifically, the Han River basin was found to be safe from the risk of water stress. However, the Nakdong River basin, Geum River basin, Yungsan River basin were found to have significant number of water-stressed regions at more than serious levels, although with slight improvement from the 1st and 2nd periods.
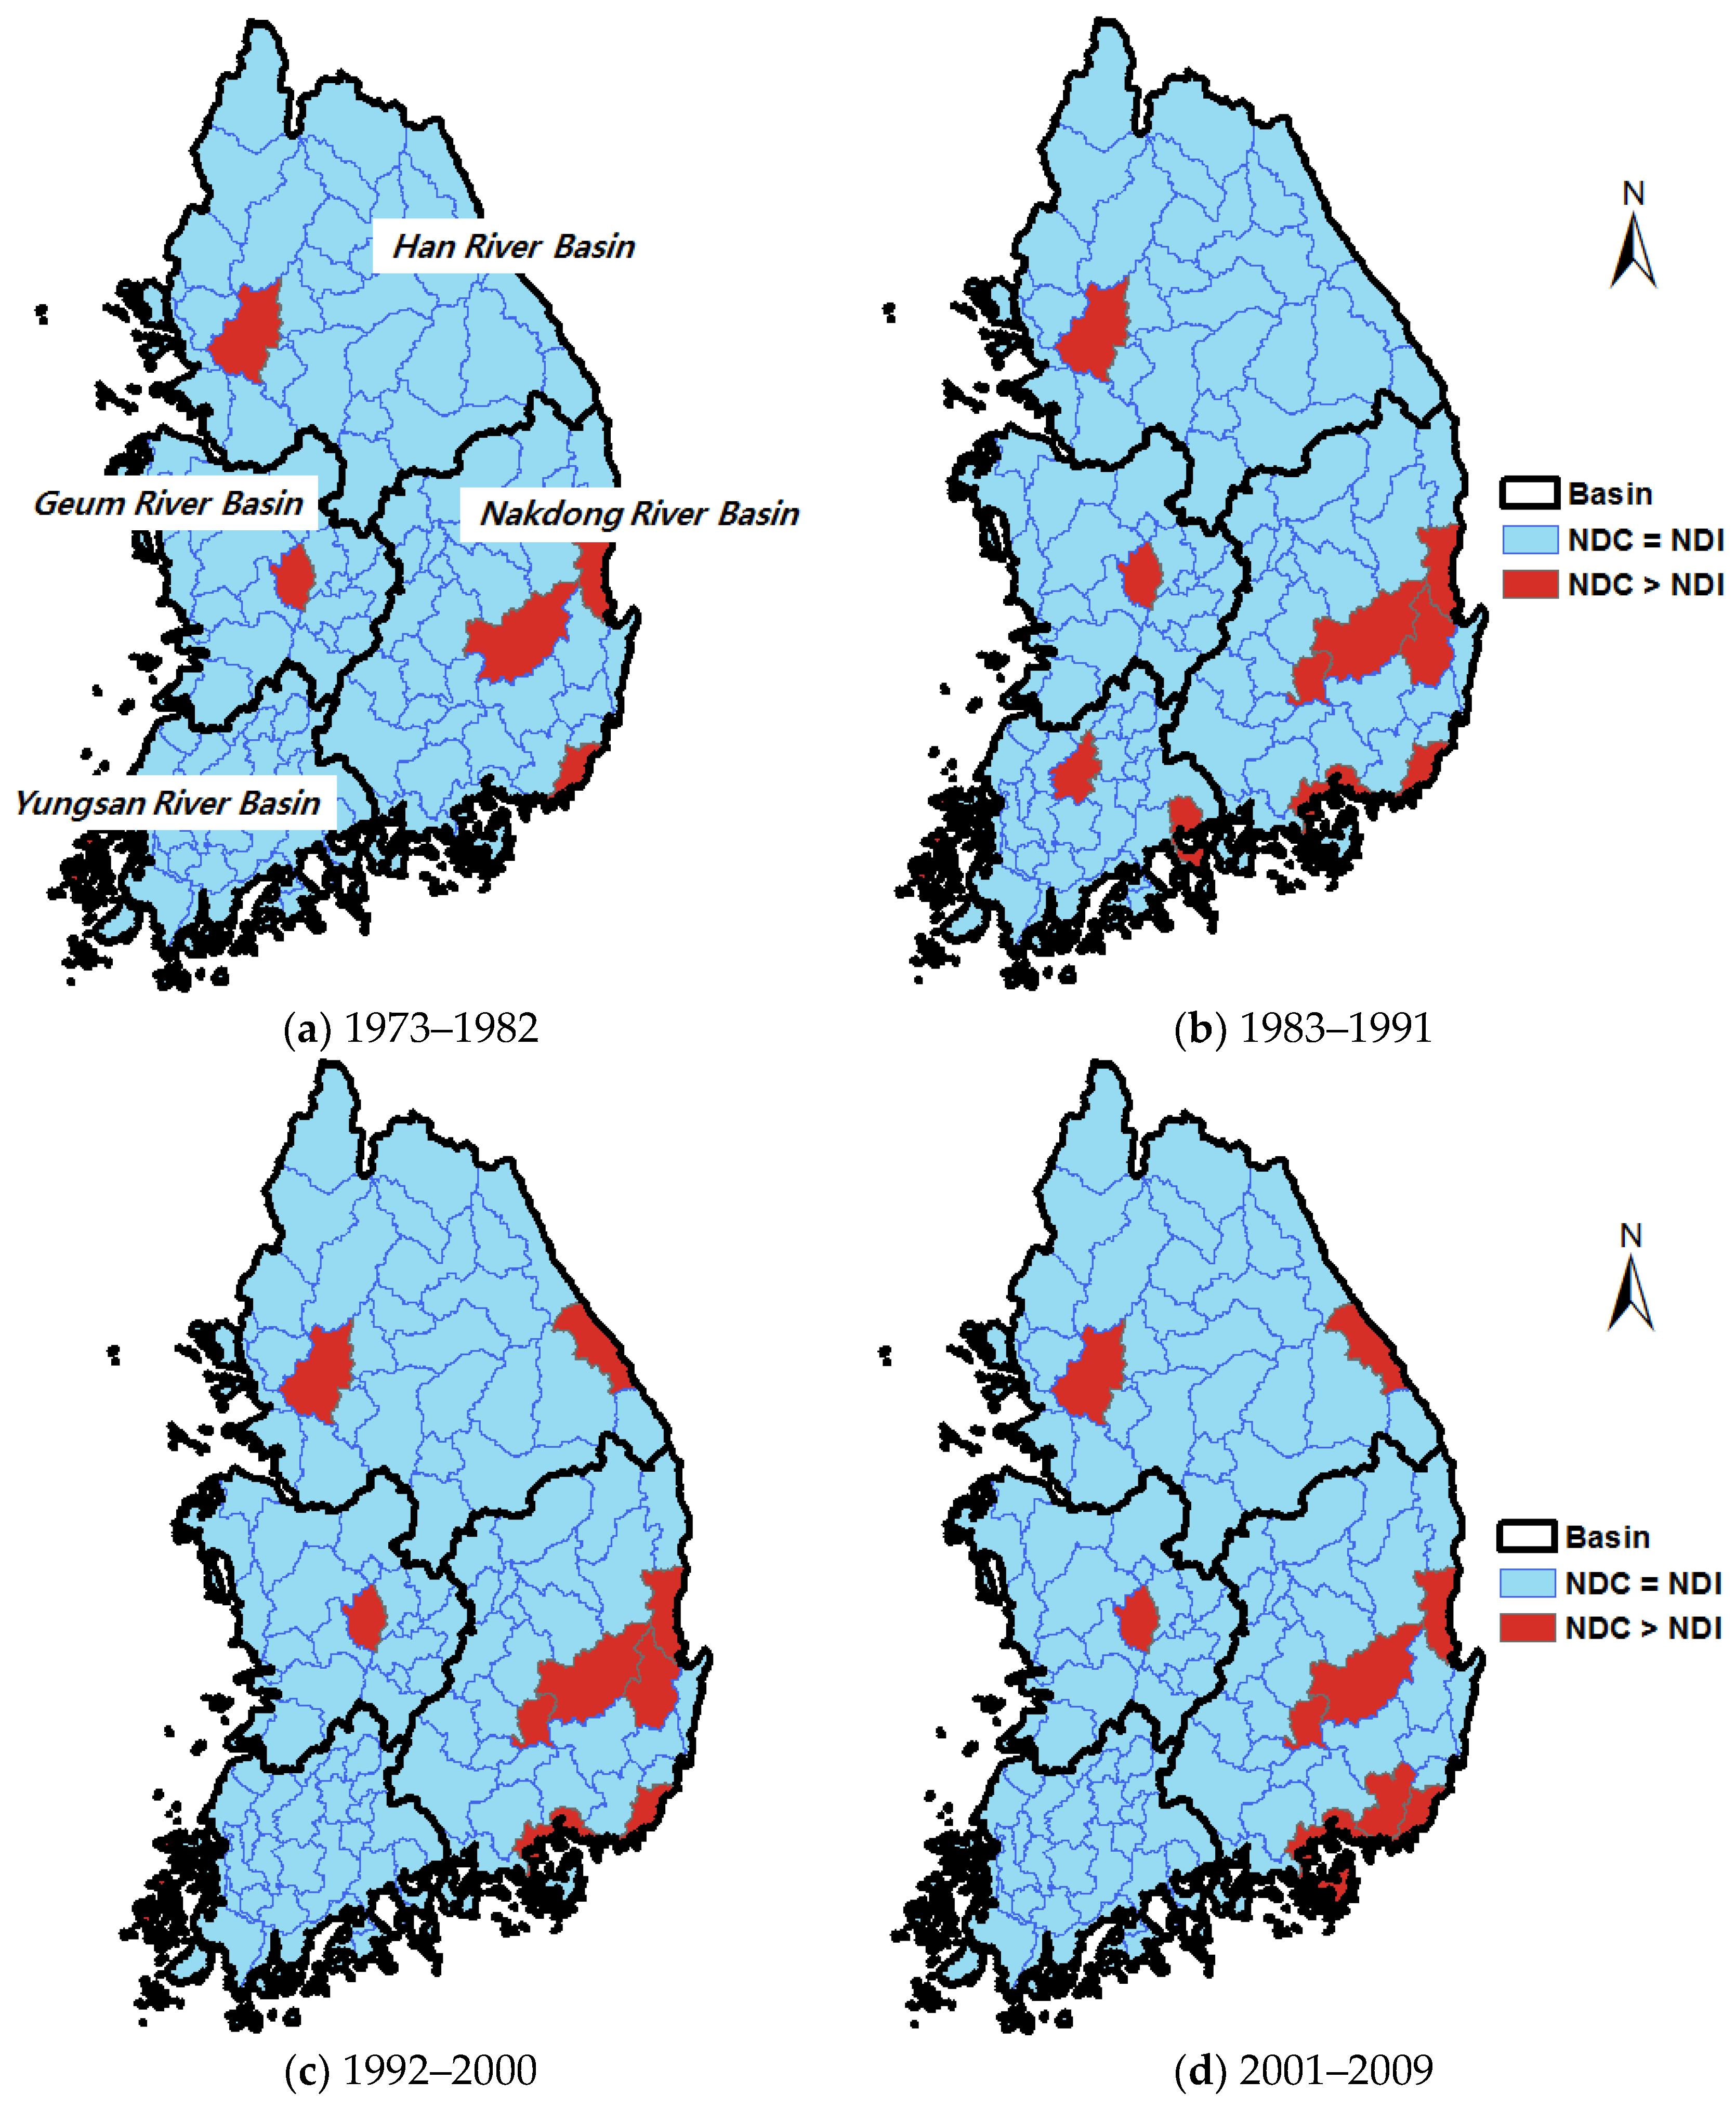
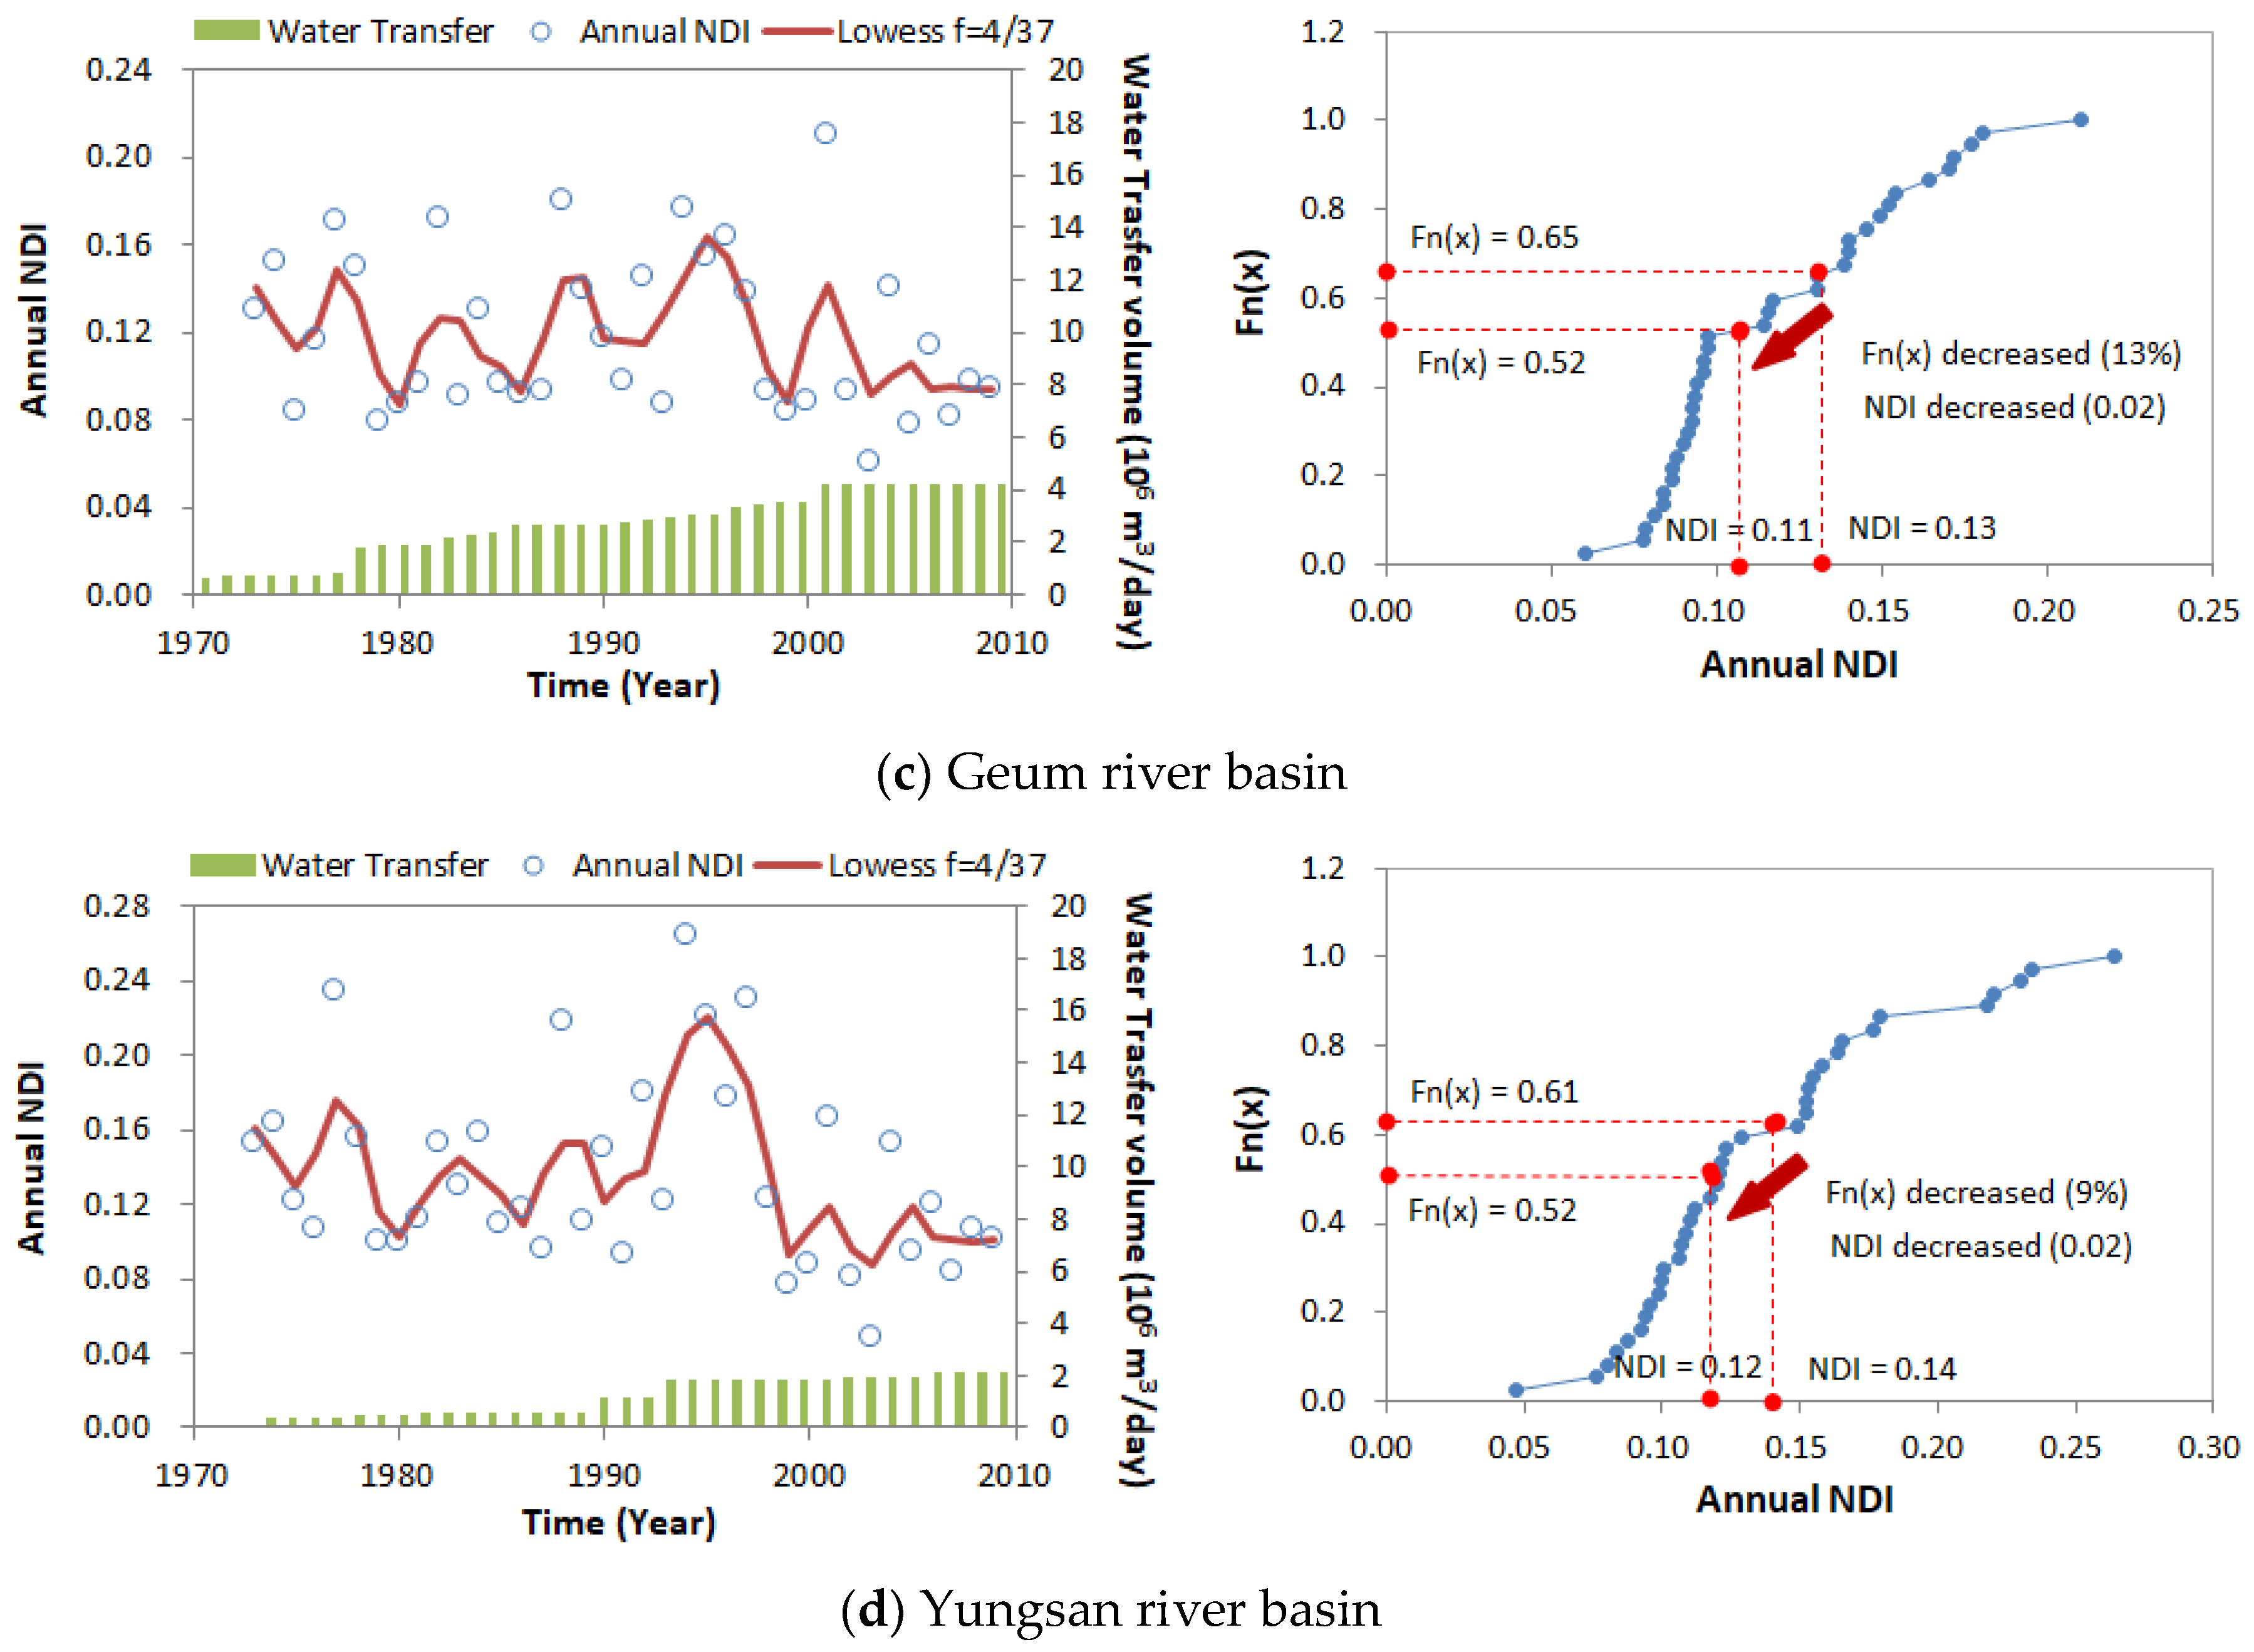
With further investigation of NDI and NDC, we can recognize the regions that are susceptible to persistent drought. The spatial distribution of this comparison is shown in Figure 10. The sub-basins shown in blue have NDC equal to the maximum NDI that means multi-year droughts do not have an impact over that of the driest year the historical period. These sub-basins typically are repetitive, which increases during the dry spell and decreases again with the advent of rains. The sub-basins under this category have high average annual precipitation and low inter-annual variability in rainfall. This implies that within year storage that can tap the seasonal rains will be sufficient to satisfy the water demands. This can preferably be satisfied by small scale and decentralized storages like small dams and water demand management, all of which are sufficient to satisfy within year demands and requires no further large scale infrastructural planning for carry over storage.
The sub-basins marked in red have NDC greater than the max NDI. These regions normally have high water deficits, experience periodic multiyear droughts and require large inter annual or carry over storages to meet the existing demands. The metropolitan cities, such as Seoul, Daegu, Busan, and Daejeon and the Nakdong River basin are the most vulnerable among the basins. As shown in Figure 1a, a comparatively smaller amount of precipitation is identified in the Nakdong River basin together with the increase of urban population.
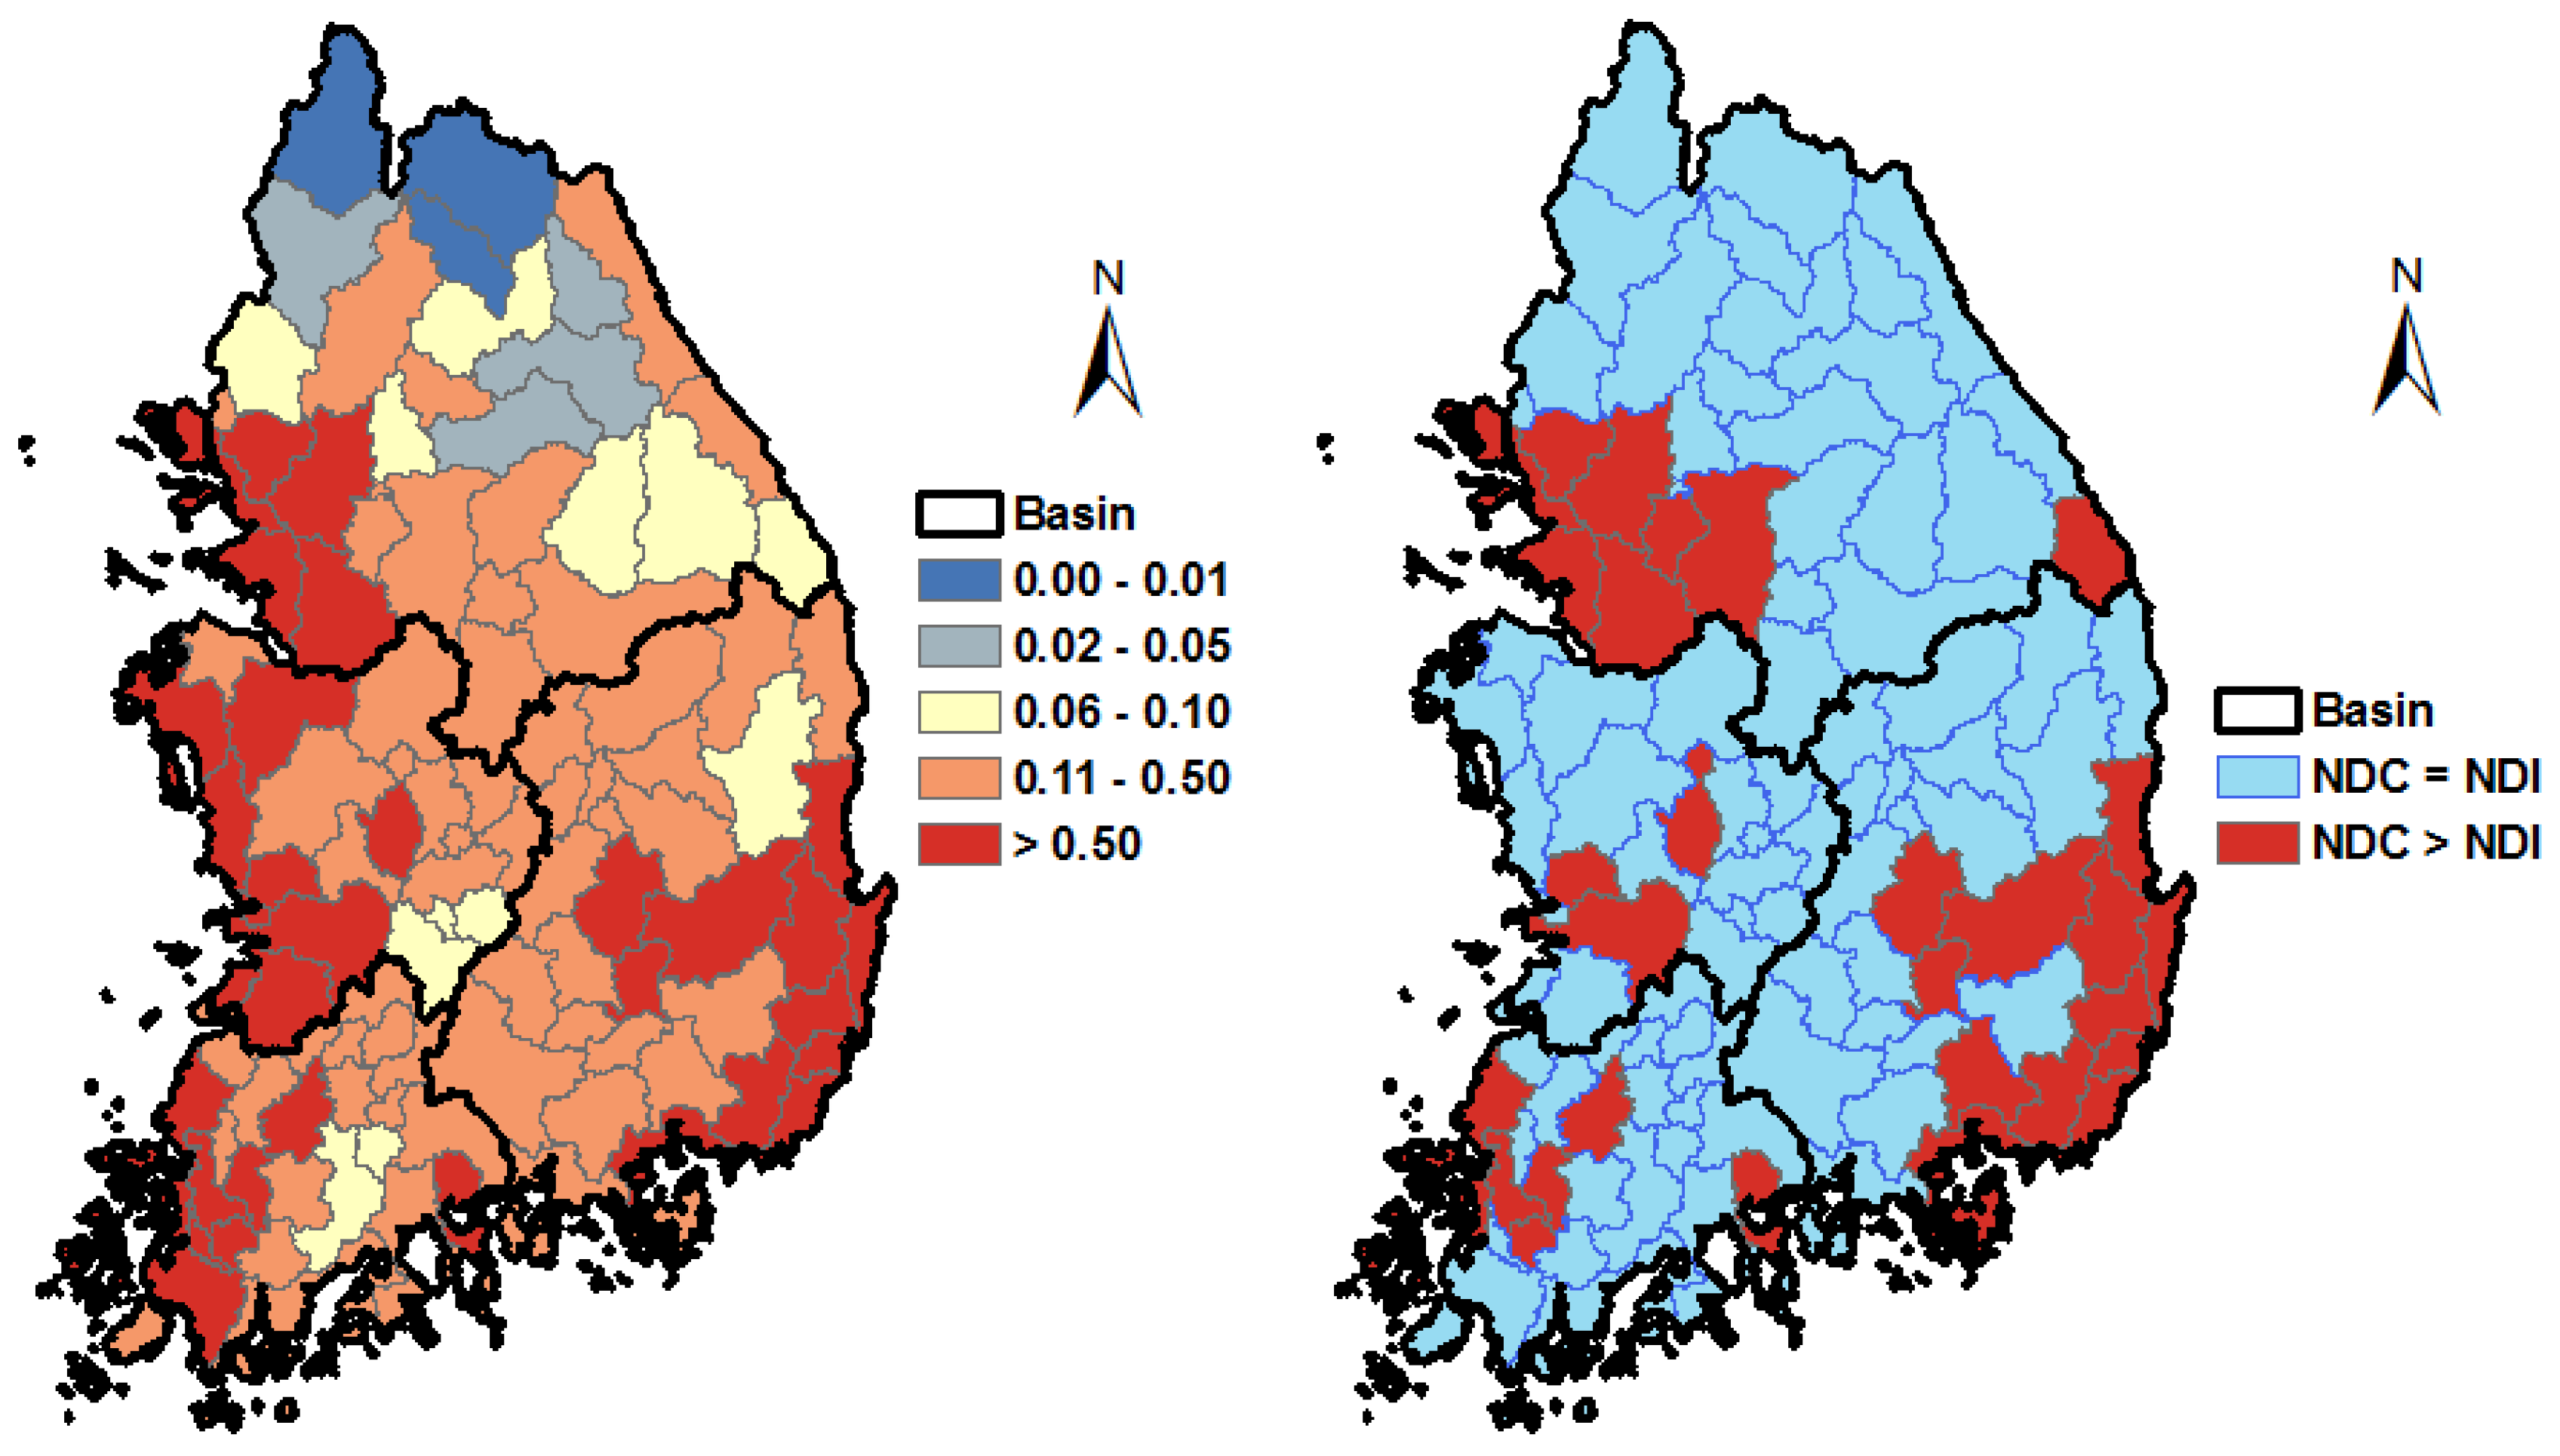
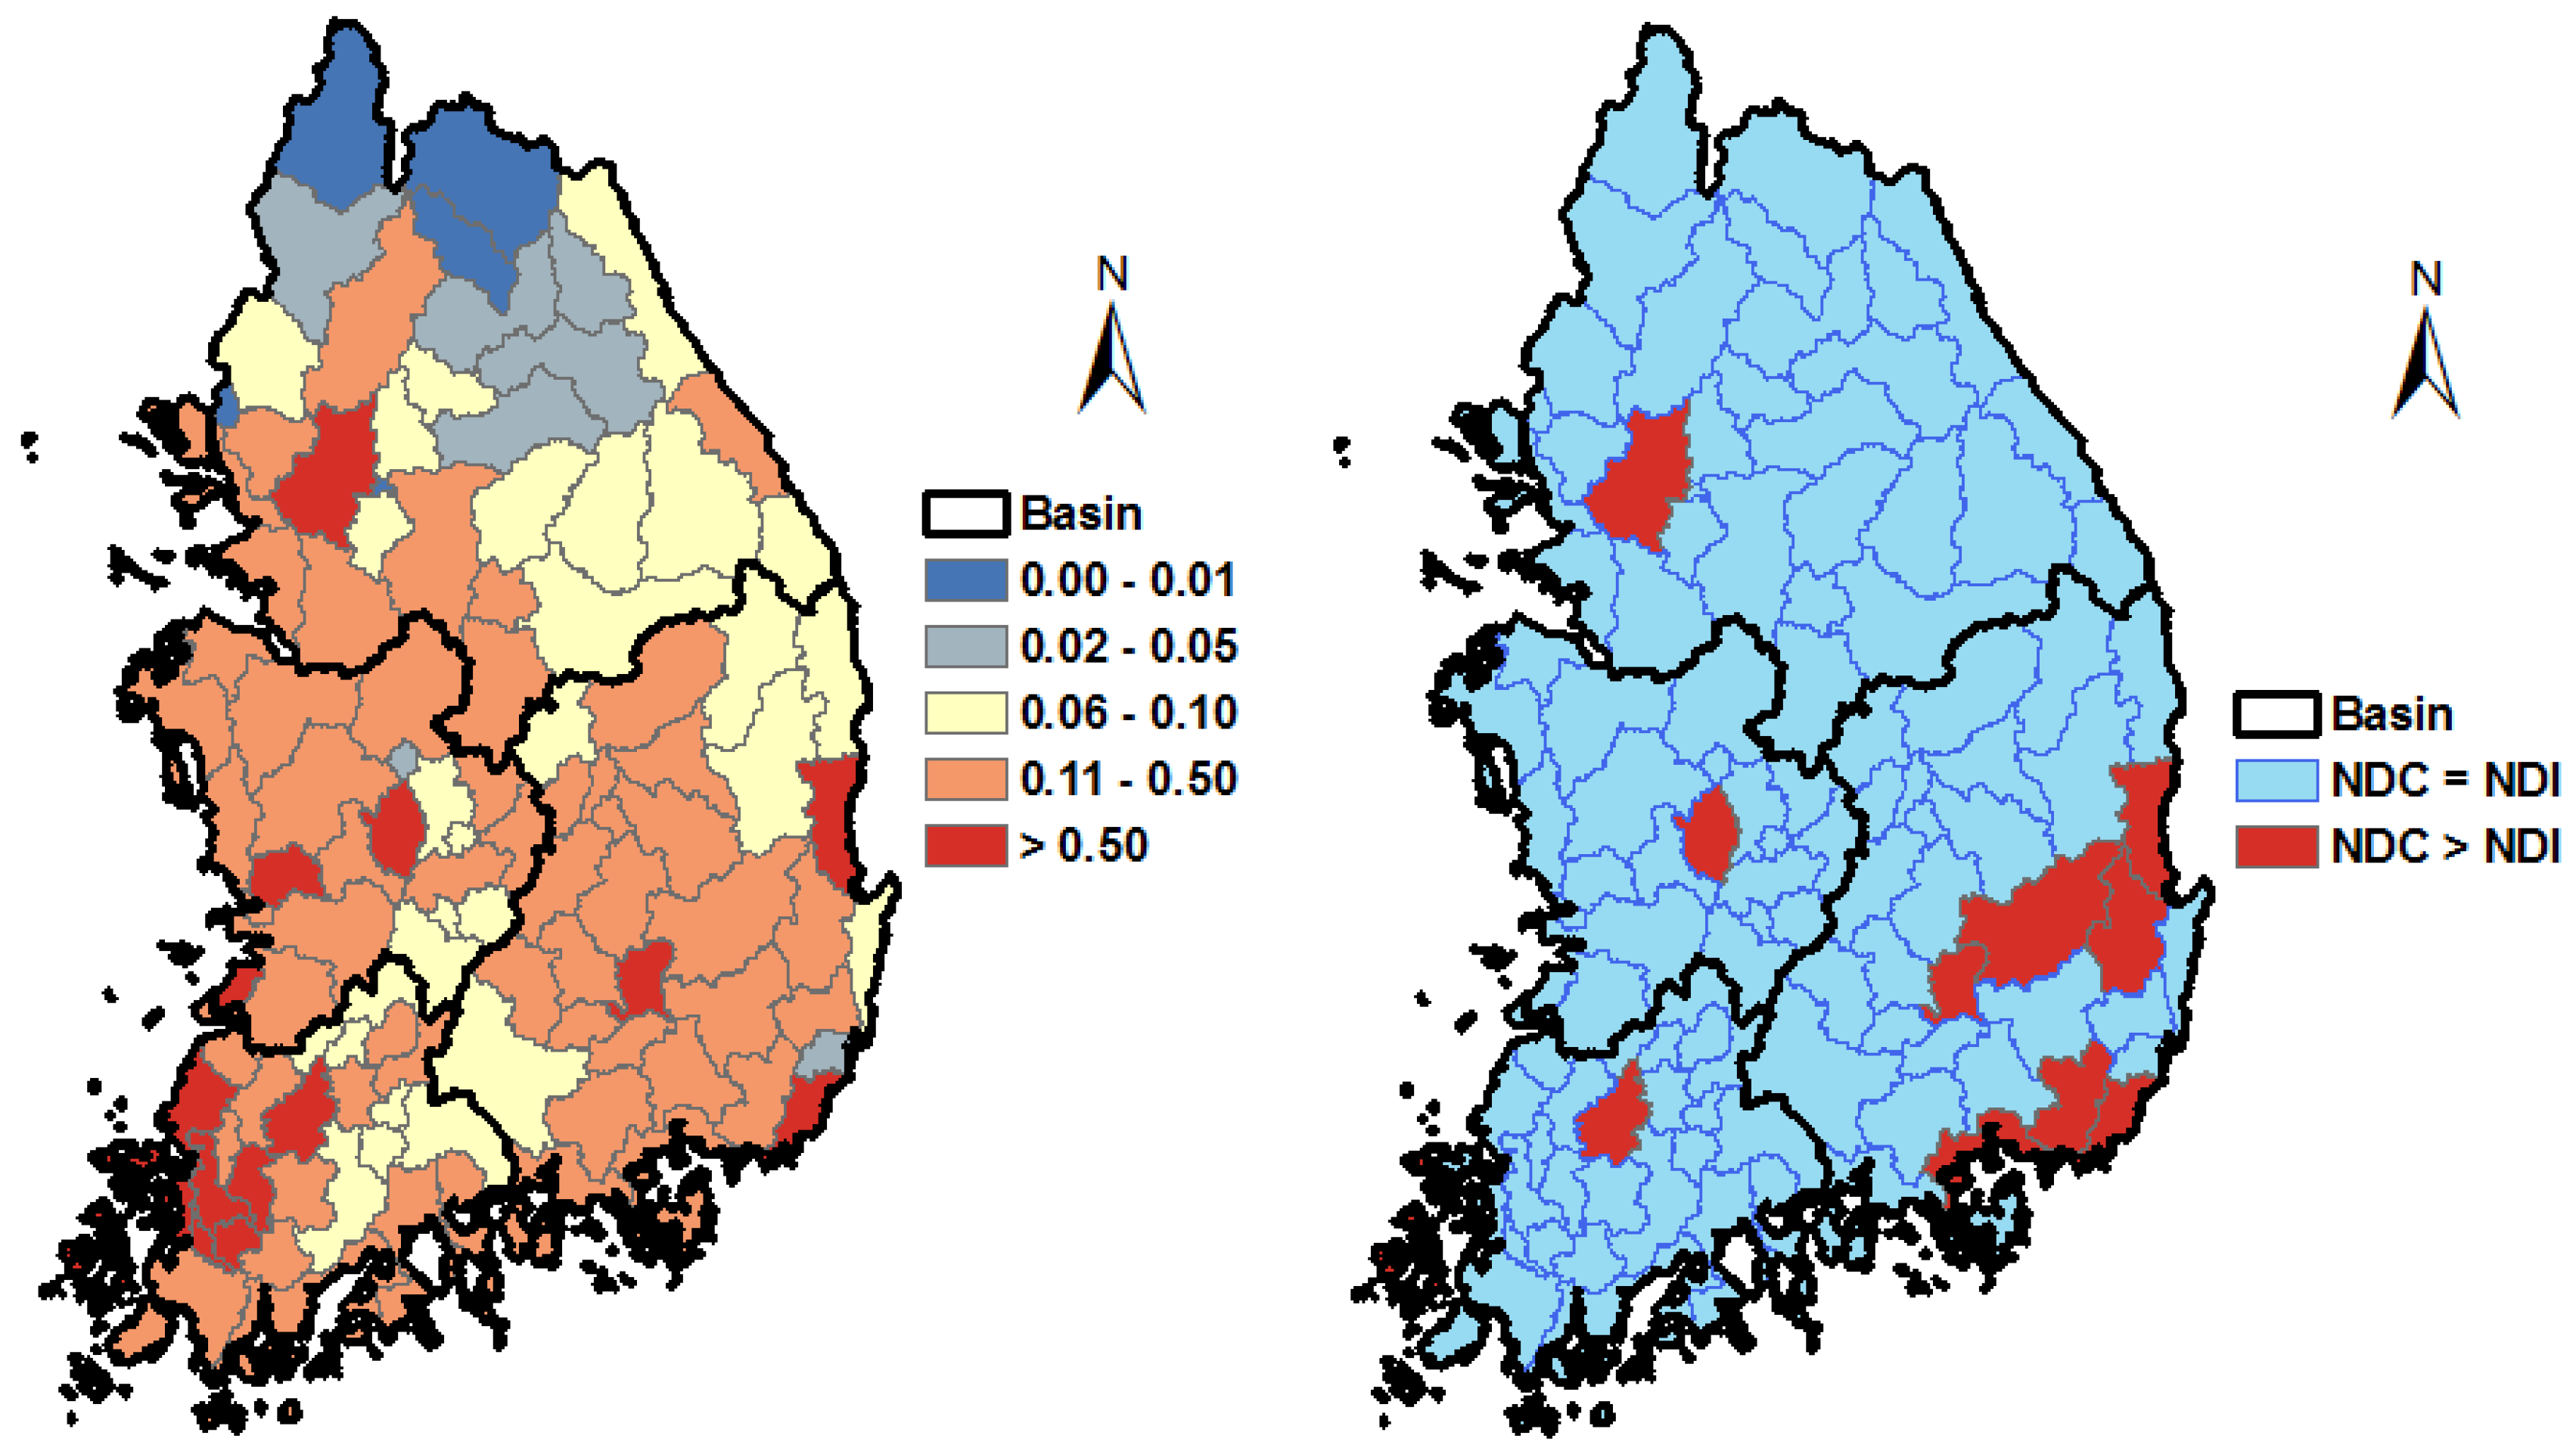
Trends based on the 37 years of NDI (water stress) data, and its influence factors were assessed using the Mann-Kendall test [18,19]. Figure 11 shows the results from the test for precipitation, total demand, and annual NDI in each sub-basin. The red color indicates that the value has an increasing trend with statistical significance at the 95% confidence level. Similarly, the blue color indicates that the value has a decreasing trend with statistical significance at the 95% confidence level. The light yellow color indicates no statistically significant trends. Precipitation (Figure 11a) has increased significantly in the Han River basin, the upper stream of the Nakdong River basin. Total demand (Figure 11b) has increased significantly in mid-lower stream sub-basins of each river basin, however, it has decreased significantly in upper stream sub-basins and most sub-basins in the Yungsan River basin. Annual NDI (Figure 11c) has decreased in most sub-basins of the Han River basin and many sub-basins of other basins, but has increased in some sub-basins of urbanizing area (Figure 2). These results explain that although precipitation has increased significantly in the Han River basin, expansive population growth in conjunction with the water resource development like dams and withdrawal facilities impacted significantly on decreasing water stress in South Korea.

4. Implications for Sustainable Water Resources Development

In a setting where the value of water resources is ever increasing, the conflicts between the stakeholders that use the limited water resources will be more and more serious. Accordingly, the demand for sustainable development of water resources is increasing. The first step for this will be the quantitative analysis of the water stress in each region. As previously mentioned, there are some limits in using the traditional water stress indices and drought indices, which were analyzed using the precipitation data or runoff data only, as the direct indicators for development of water resources, because each region developed the water resources in various ways suitable for its own water demand characteristics and is actively using the water resources. Thus, for sustainable development of water resources, the results analyzed based on the water balance between the water supply and demand should be utilized. Specifically, South Korea has many difficulties in stably securing water resources because of its meteorological, topographical, and social characteristics. Thus South Korea has actively developed and is using the reservoirs, streams, and underground water. Figure 12 shows the spatial distribution of NDI and NDC without considering water transfer while Figure 13 shows the spatial distribution of NDI and NDC with considering water transfer due to water resources development. The water stress indices we show here focuses on stress as defined through a temporal integration of deficit at a daily resolution. We can connect it more directly to infrastructure, planning or water conservation needs through the indices that inform storage requirements needed to meet the estimated supply-demand imbalance.
We further analyzed how the extent of water stress changed in each larger basin (Han, Nakdong, Geum, Yungsan) over the decades (1973–1982 decade compared to the 2000–2009 decade). For this, the annual NDI for the whole period was averaged for each basin (average of each unit basin) and the LOWESS method which uses locally-weighted polynomial regression [20] was applied to analyze the change characteristics of the annual NDI series compared with water transfer series due to water resources development in each basin (shown in Figure 14 (left)). Water resources development contributed to the decrease in water stress in each basin, with the highest decrease seen in the Han River basin due to a significant increase of the water transfers. The empirical cumulative distribution function of annual NDI is also shown in Figure 14 (right panel). The average NDI of the 1st period (1973–1982) is about 0.11 and is approximately the 76th percentile of the distribution. The average NDI of the 4th period (2001–2009) is about 0.05, and approximate 11th percentile. This indicates that the water stress (measured by the average maximum cumulative deficit (NDI) in a particular decade) decreased by about 65% (0.76 to 0.11). In the Nakdong River basin (see Figure 14b), the risk increased by about 2% during the period 1973–2009. Similarly, in the Geum River basin (see Figure 14c), the risk decreased by about 13%, and about 9% in the Yungsan River basin see Figure 14d. We can see that the most vulnerable basin is the Nakdong River basin and the safest basin is the Han River basin. By comparing the risk of water stress based on the past and present period, we can decide in what region the water resource development has been concentrated. It can be said that the water resource development was concentrated in the Han River basin that showed the decrease rate of the percentile of the annual NDI about 65% and that the water resource development was comparatively insufficient in the Nakdong River basin that showed the increase rate of about 2%. The Han River basin benefited from large-scaled stream intake facilities in the past, such as Soyang River Dam (completed in 1973) and Paldang Dam (completed in 1973). We see the greatest rate of decrease in the water risk from 1973 to 2009. It is true that the development of water resources was concentrated in the Han River basin, where about 56% of populations reside in South Korea. We also find that the Nakdong River basin is a region with the highest water stress. In the Geum River and Yungsan River basins, the water stress is considered to be in favorable condition with the NDI of 0.11 and 0.12, respectively. However, if precipitation smaller than the mean annual precipitation level occurs in the basins, those basins are likely to suffer serious water stress. Accordingly, the efforts to secure more stable water resources are considered necessary not only in the Nakdong River basin, but also in the Geum River basin and the Yungsan River basin. This examination of potential risk changes makes it easy to understand the exposure magnitude and duration by location, and is hence useful for siting decisions. Future Climate Scenarios can be easily accommodated to provide projected risk, and integrated with a plan for drought management that indicates the current level of accumulated water stress.
In recent years, dynamic methods [21,22] are applied actively to solving water problems with the development of technology. But this study analyzed water stress using statistical methods based on time series data. In particular, this study established the water balance model [23] and simulated quantitatively water stress using the NDI and NDC, not apply the existing methods like the meteorological, agricultural, and hydrologic method for water stress analysis. We proposed the methodology that can consider the variation of meteorological characteristics as a natural phenomenon, and population growth and urbanization as social changes. Many countries are deeply concerned about the problem of inequitable distribution of water. Here, this study tried to provide a clue like how sustainable development of water resources should be done for the future. This study can be used as an important material to make a strategy to mitigate water stress for achieving the Sustainable Development Goal 6 on Water and Sanitation by the UN in 2015 [24].

5. Conclusions

We are at the juncture where future water sustainability is under question with growing concerns regarding the reliable water supply for various needs. For water sustainability, it is necessary to examine water supply-demand imbalance and their spatio-temporal distribution in order to mitigate the water risk. A detailed quantitative assessment of water risk and storage assessment is presented considering the historical climate variability and the water demands for Korea. Cumulative water deficits were estimated using the water demand (household water, industrial water, agricultural water, and livestock water) between 1973 and 2009 (37 years) and water supply (precipitation use, reservoir use, stream use, and underground water use) for each sub-basin. It highlights the regions with high water stress because of inequitable development of water resources, thus identifying where water demand management or water policy intervention is needed. The spatial distribution of the regions vulnerable to water stress in the past and present are identified in the context of the history of South Korean water resource development. Accordingly, the result of this study is expected to be able to contribute to accessing the Sustainable Development Goal 6 as well as the establishment of the strategy for sustainable development of South Korean water resources based on their equitable distribution.

Author Contributions

This research presented here was carried out in collaboration between all authors. S.K. and N.D. had the original idea for the study. U.L. provided the research methods and H.S.K. arranged this research. S.K. with H.S.K. conducted the research and drafted the manuscript. All authors discussed the structure and comment on the manuscript at all stages.

Funding

This research was supported by Basic Science Research Program through the National Research Foundation of Korea (NRF) funded by the Ministry of Science, ICT & Future Planning (MSIT) (2017R1A2B3005695)

Conflicts of Interest

The authors declare no conflict of interest.

References

  1. Ministry of Land, Infrastructure, and Transport and K-Water in Korea. Water for the future: Water and Sustainable Development; K-Water: Daejeon, Korea, 2011.
  2. Choi, Y.H. South Korea’s economic development and the evolving role of the government: Energy and Water. J. East Asian Aff. 2011, 25, 115–136. [Google Scholar]
  3. Palmer, W.C. Meteorologic Drought; U.S. Department of Commerce Weather Burea: Washington, DC, USA, 1965; pp. 1–58.
  4. Thornthwaite, C.W. An approach toward a rational classification of climate. Geogr. Rev. 1948, 38, 55–94. [Google Scholar] [CrossRef]
  5. Thornthwaite, C.W. Drought. Encycl. Br. 1963, 7, 699–701. [Google Scholar]
  6. McKee, T.B.; Doesken, N.J.; Kleist, J. The relationship of drought frequency and duration to time scales. Presented at 8th Conference on Applied Climatology, Anaheim, CA, USA, 17–22 January 1993. [Google Scholar]
  7. World Bank. World Bank Open Data. Available online: https://data.worldbank.org/indicator (accessed on 1 March 2017).
  8. Brown, C.; Lall, U. Water and economic development: The role of variability and a framework for resilience. Natl. Resour. Forum 2006, 30, 306–317. [Google Scholar] [CrossRef] [Green Version]
  9. Devineni, N.; Perveen, S.; Lall, U. Assessing chronic and climate induced water risk through spatially distributed cumulative deficit measures: A new picture of water sustainability in India. Water Resour. Res. 2013, 49, 2135–2145. [Google Scholar] [CrossRef]
  10. Lall, U.; Miller, C.W. An optimization model for screening multipurpose reservoir systems. Water Resour. Res. 1988, 24, 953–968. [Google Scholar] [CrossRef]
  11. Loucks, D.P.; Stedinger, J.R.; Haith, D.A. Water Resource Systems Planning and Analysis; Prentice Hall: Englewood Cliffs, NJ, USA, 1981. [Google Scholar]
  12. Thomas, H.A., Jr.; Robert, P.B. Operations Research in Water Quality Management; Water Resources Group, DIV of Engineering and Applied Physics, Harvard University: Cambridge, MA, USA, 1963. [Google Scholar]
  13. Water Supply Statistics 2004; Ministry of Environment in Korea: Seoul, Korea, 2004.
  14. Allen, R.G.; Pereira, L.S.; Raes, D.; Smith, M. Crop Evapotranspiration: Guidelines for Computing Crop Requirements; Irrigation and Drainage Paper No. 56; FAO: Rome, Italy, 1998. [Google Scholar]
  15. Monteith, J.L. Evaporation and the environment. In The State and Movement of Water in Living Organisms: 19th Symposia of the Society for Experimental Biology; Cambridge University Press: London, UK, 1965. [Google Scholar]
  16. Etienne, E.; Devineni, N.; Khanbilvardi, R.; Lall, U. Development of a Demand Sensitive Drought Index and its application for agriculture over the conterminous United States. J. Hydrol. 2016, 534, 219–229. [Google Scholar] [CrossRef] [Green Version]
  17. Ministry of Construction & Transportation in Korea. 2001 Drought Investigation Record in Korea; Ministry of Construction and Transportation: Seoul, Korea. 2011.
  18. Mann, H.B. Nonparametric tests against trend. Econometrica 1945, 13, 245–259. [Google Scholar] [CrossRef]
  19. Helsel, D.R.; Hirsch, R.M. Statistical Methods in Water Resources. Studies in Environmental Science; Elsevier Science: Amsterdam, The Netherlands, 1992; Volume 49. [Google Scholar]
  20. Cleveland, W.S. Robust Locally Weighted Regression and Smoothing Scatterplots. J. Am. Stat. Assoc. 1979, 74, 829–836. [Google Scholar] [CrossRef]
  21. Kuriqi, A. Simulink application on dynamic modelling of biological wastewater treatment for aerator tank case. Int. J. Sci. Technol. Res. 2014, 3, 69–72. [Google Scholar]
  22. Kuriqi, A.; Kuriqi, I.; Poci, E. Simulink Programming for Dynamic Modelling of Activated Sludge Process: Aerator and Settler Tank Case. Fresenius Environ. Bull. 2016, 25, 2891–2899. [Google Scholar]
  23. Kim, S.; Kim, B.S.; Jun, H.D.; Kim, H.S. Assessment of future water resources and water scarcity considering the factors of climate change and social-environmental change in Han River basin, Korea. Stoch. Environ. Res. Risk Assess. 2014, 28, 1999–2014. [Google Scholar] [CrossRef]
  24. The UN Sustainable Development Solution Network (SDSN). Indicators and a Monitoring Framework for the Sustainable Development Goals; SDSN: Paris, France, 2015. [Google Scholar]
Figure 1. Precipitation characteristics and geographical characteristics in South Korea, analysis of annual average precipitation in 56 gaging sites in the whole nation (1973–2009), classified into 113 sub-basins, indicated in the South Korean water resources unit map.
Sustainability 10 03795 g001
Figure 2. Regional population distribution for 1973–2009.
Sustainability 10 03795 g002
Figure 3. Annual change of water demand, ① increase of household water demand caused by the population increase, ② increase of industrial water demand caused by the economic growth, ③ decrease of agricultural water demand volume caused by the decrease in farm area.
Sustainability 10 03795 g003
Figure 4. Spatial distribution of each water use volume for each period.
Sustainability 10 03795 g004aSustainability 10 03795 g004b
Figure 5. Relation between the precipitation and water supply according to land use characteristics.
Sustainability 10 03795 g005
Figure 6. Water transfer characteristics of major reservoir intake areas of the entire country.
Sustainability 10 03795 g006
Figure 7. Conceptual representation of water deficit for drought duration, severity and recovery duration considering water supply by precipitation and transfer from a dam.
Sustainability 10 03795 g007
Figure 8. Drought severity, duration and SIC (Stress Index Cumulative) in each period.
Sustainability 10 03795 g008
Figure 9. Spatial distribution of water stresses through NDI analysis.
Sustainability 10 03795 g009
Figure 10. Unit basins vulnerable to water stress for consecutive years.
Sustainability 10 03795 g010
Figure 11. Trends based on the 37 year (1973–2009) time series.
Sustainability 10 03795 g011
Figure 12. NDI (left) and NDC (right) without considering water transfer.
Sustainability 10 03795 g012
Figure 13. NDI (left) and NDC (right) with considering water transfer.
Sustainability 10 03795 g013
Figure 14. Annual NDI series and water transfer series due to water resources development (left) and cumulative probability distribution for annual NDI (right).
Sustainability 10 03795 g014aSustainability 10 03795 g014b
Table 1. Multipurpose dams in South Korea (be summarized from the WAMIS).
BasinDam
Name
Sub-Basin CodeCatchment Area
(km2)
Height
(m)
Length
(m)
Total Storage
(106 m3)
Water Supply Storage
(106 m3)
Built
(Year)
Han riverSoyang10112703123530290012131973
Chungju1003664898447275033801986
Hoingsung100620949205871202000
Nakdong riverAndong200115848361212489261977
Imha20021361735155955921993
Hapchun2018925964727905991989
Namgang202122853411263091661999
Milyang2023958953574732001
Hoabuk2008884533049382008
Geum riverDaechung3008320472495149016491981
Yongdam3001930704988156502001
Buan5301595028242351996
Boryung3203164502911171071998
Yungsan riverSumjin4003763643444663501965
Juam_140081010583304572701992
Juam_2420413451005632502191992
Jangheung5101193534031911282006

