Article

Changes in the Ecological Footprint of Rural Populations in the Taihang Mountains, China

1
College of Geomatics, Shandong University of Science and Technology, Qingdao 266590, China
2
Key Laboratory of Land Surface Pattern and Simulation, Institute of Geographic Sciences and Natural Resources Research, Chinese Academy of Sciences, Beijing 100101, China
3
International College, University of Chinese Academy of Sciences, Beijing 10049, China
4
College of Resources and Environment, University of Chinese Academy of Sciences, Beijing 100049, China
*
Author to whom correspondence should be addressed.
Sustainability 2018, 10(10), 3741; https://doi.org/10.3390/su10103741
Submission received: 14 August 2018 / Revised: 11 October 2018 / Accepted: 15 October 2018 / Published: 17 October 2018

Abstract

:
Due to massive rural–urban migration, population size and age structure are subject to significant changes in the mountainous areas of China. This can influence the ecological pressure of the mountainous areas correspondingly. In particular, large numbers of young laborers migrate from rural areas, which may greatly decrease the intensity of local human activities. However, it is still unclear how population changes (size and age structure) affect environmental changes and how to measure these changes. We analyzed changes in the ecological footprint (EF) in the Taihang Mountain region in northern China using field survey data. From 2000 to 2016, the population size in the study area decreased by 9.7%, while the EF declined by 32.1%. The EF per capita (EF_per) decreased more rapidly with decreasing elevation, which indicated that at lower elevations, households were less dependent on local resources. For households with more elderly people, the EF_per was considerably lower than for other households in 2000. However, in 2016, this was not the case, and the households with a share of the working-age population between 50–75% had the lowest EF_per. Our study is of great practical significance for reasonably guiding population migration and rural sustainable development.

1. Introduction

Massive rural–urban migration stimulated by the industrial revolution swept first through developed countries and is currently expanding its range through Asia and the rest of the world [1]. In Brazil, it is estimated that over 20 million people moved from rural to urban areas during the 1950s and 1970s [2]. In India, according to the Census of India in 2005, 20.5 million people (30% of the national urban growth) moved from rural to urban areas in the 1990s. In China, the rural population has significantly decreased, at a rate of about 17%, in the first decade of the 21st century, according to census data [3]. Such enhanced migration considerably changes the population structure in the regions the migrants come from, with direct and indirect consequences for the local environment.
In mountainous areas, because of the harsh natural environment and scarce job opportunities, rural–urban migration has become a worldwide trend [4]. To a certain extent, population migration not only changes the size of a population, but also affects age structure, since a large number of young laborers migrate into urban areas. This may greatly influence the intensity of local human activities. Compared with other areas, mountainous areas are more sensitive to intense human activities. On one side, humans in mountainous areas are more directly dependent on natural resources for their livelihoods [5], while on the other side, mountainous ecosystems are more vulnerable to anthropogenic disturbances [6,7].
In most rural mountainous areas, ecosystems are mainly affected by human activities such as agricultural production, cutting fuelwood, and livestock grazing. In many parts of the world, the migration of the rural population reduces cultivated land-use rates [8] and results in land abandonment [9,10]. For example, in the West Indies, emigration overseas (1950s–1970s) has reduced farming and increased reforestation. In Greece, the migration of rural populations towards large cities has played an important role in the abandonment of cropland. Such land abandonment is combined with the densification of scrublands and forests. At the same time, policies related to ecological protection have been implemented in some countries, which may cause a conversion of cropland to forest. For instance, in China, the Grain for Green Program (GGP) was initiated in 1999, responded to with nationwide cropland being set aside to mitigate and prevent soil erosion on sloped cropland and increase forest cover [11]. Another study has found that firewood consumption has decreased with the decline in rural households [12]. Generally, rural–urban migration has positive impacts on forest regrowth and ecosystem recovery [13]. Nevertheless, these studies investigating the impacts of rural labor migration have only evaluated a single factor related to human activities. In this context, we selected the ecological footprint model to measure the impacts of emigration on mountainous areas comprehensively.
The measurement of the ecological footprint (EF), proposed by Rees [14], has been used extensively as a comprehensive indicator of anthropogenic pressure on the environment [15,16]. It reflects the extent of appropriation which is caused by a household via the consumption of local resources and production. A previous study [17] has shown that population density has a roughly proportional effect (approximately unit elasticity) on the ecological footprint in China. However, it is still unclear to which extent the ecological footprint changes with rural–urban migration in mountainous areas.
Previous studies have examined the impacts of population migration on vegetation in China [18,19]. However, these studies have mainly focused on changes in population size and failed to consider changes in other demographic characteristics, such as age structure. A previous study [20] has indicated that age structure is an important factor affecting environmental impacts at the national level. Nevertheless, few studies have focused on the impact of age structure on the ecological environment at the micro-level. Thus, our study attempted to analyze changes in age structure at the micro-level (village level) and its effects on EF per capita, based on field survey data.
Mountainous areas in China account for 66% of the total land area. However, according to data from the fifth and sixth national censuses in 2000 and 2010, respectively, the resident population in rural areas across China has decreased by 16.3% during 2000–2010 in the mountainous areas. As an important mountainous area, the Taihang Mountain belt plays an important role as a water head site of the North China Plain. The area is characterized by serious soil erosion and considerable human impacts, with a significant migration of the rural population. Based on this, this study made a hypothesis that from 2000 to 2016, depopulation decreased both total EF and the EF per capita in the study area, due to labor migration (population aged 15–64) into urban areas. Thus, the main objectives of this study were (1) to estimate the change in the EF per capita of the Taihang Mountain region by using household survey data; and (2) to uncover the impacts of population migration on the changes in the EF of the Taihang Mountain region, considering population size and age structure by using the survey data. In the context of urbanization, synthetically measuring human impacts on mountainous area provided evidence for policymakers to guide population migration reasonably and was of great practical significance for rural land management, rational utilization of resources, etc.

2. Study Area and Data Source
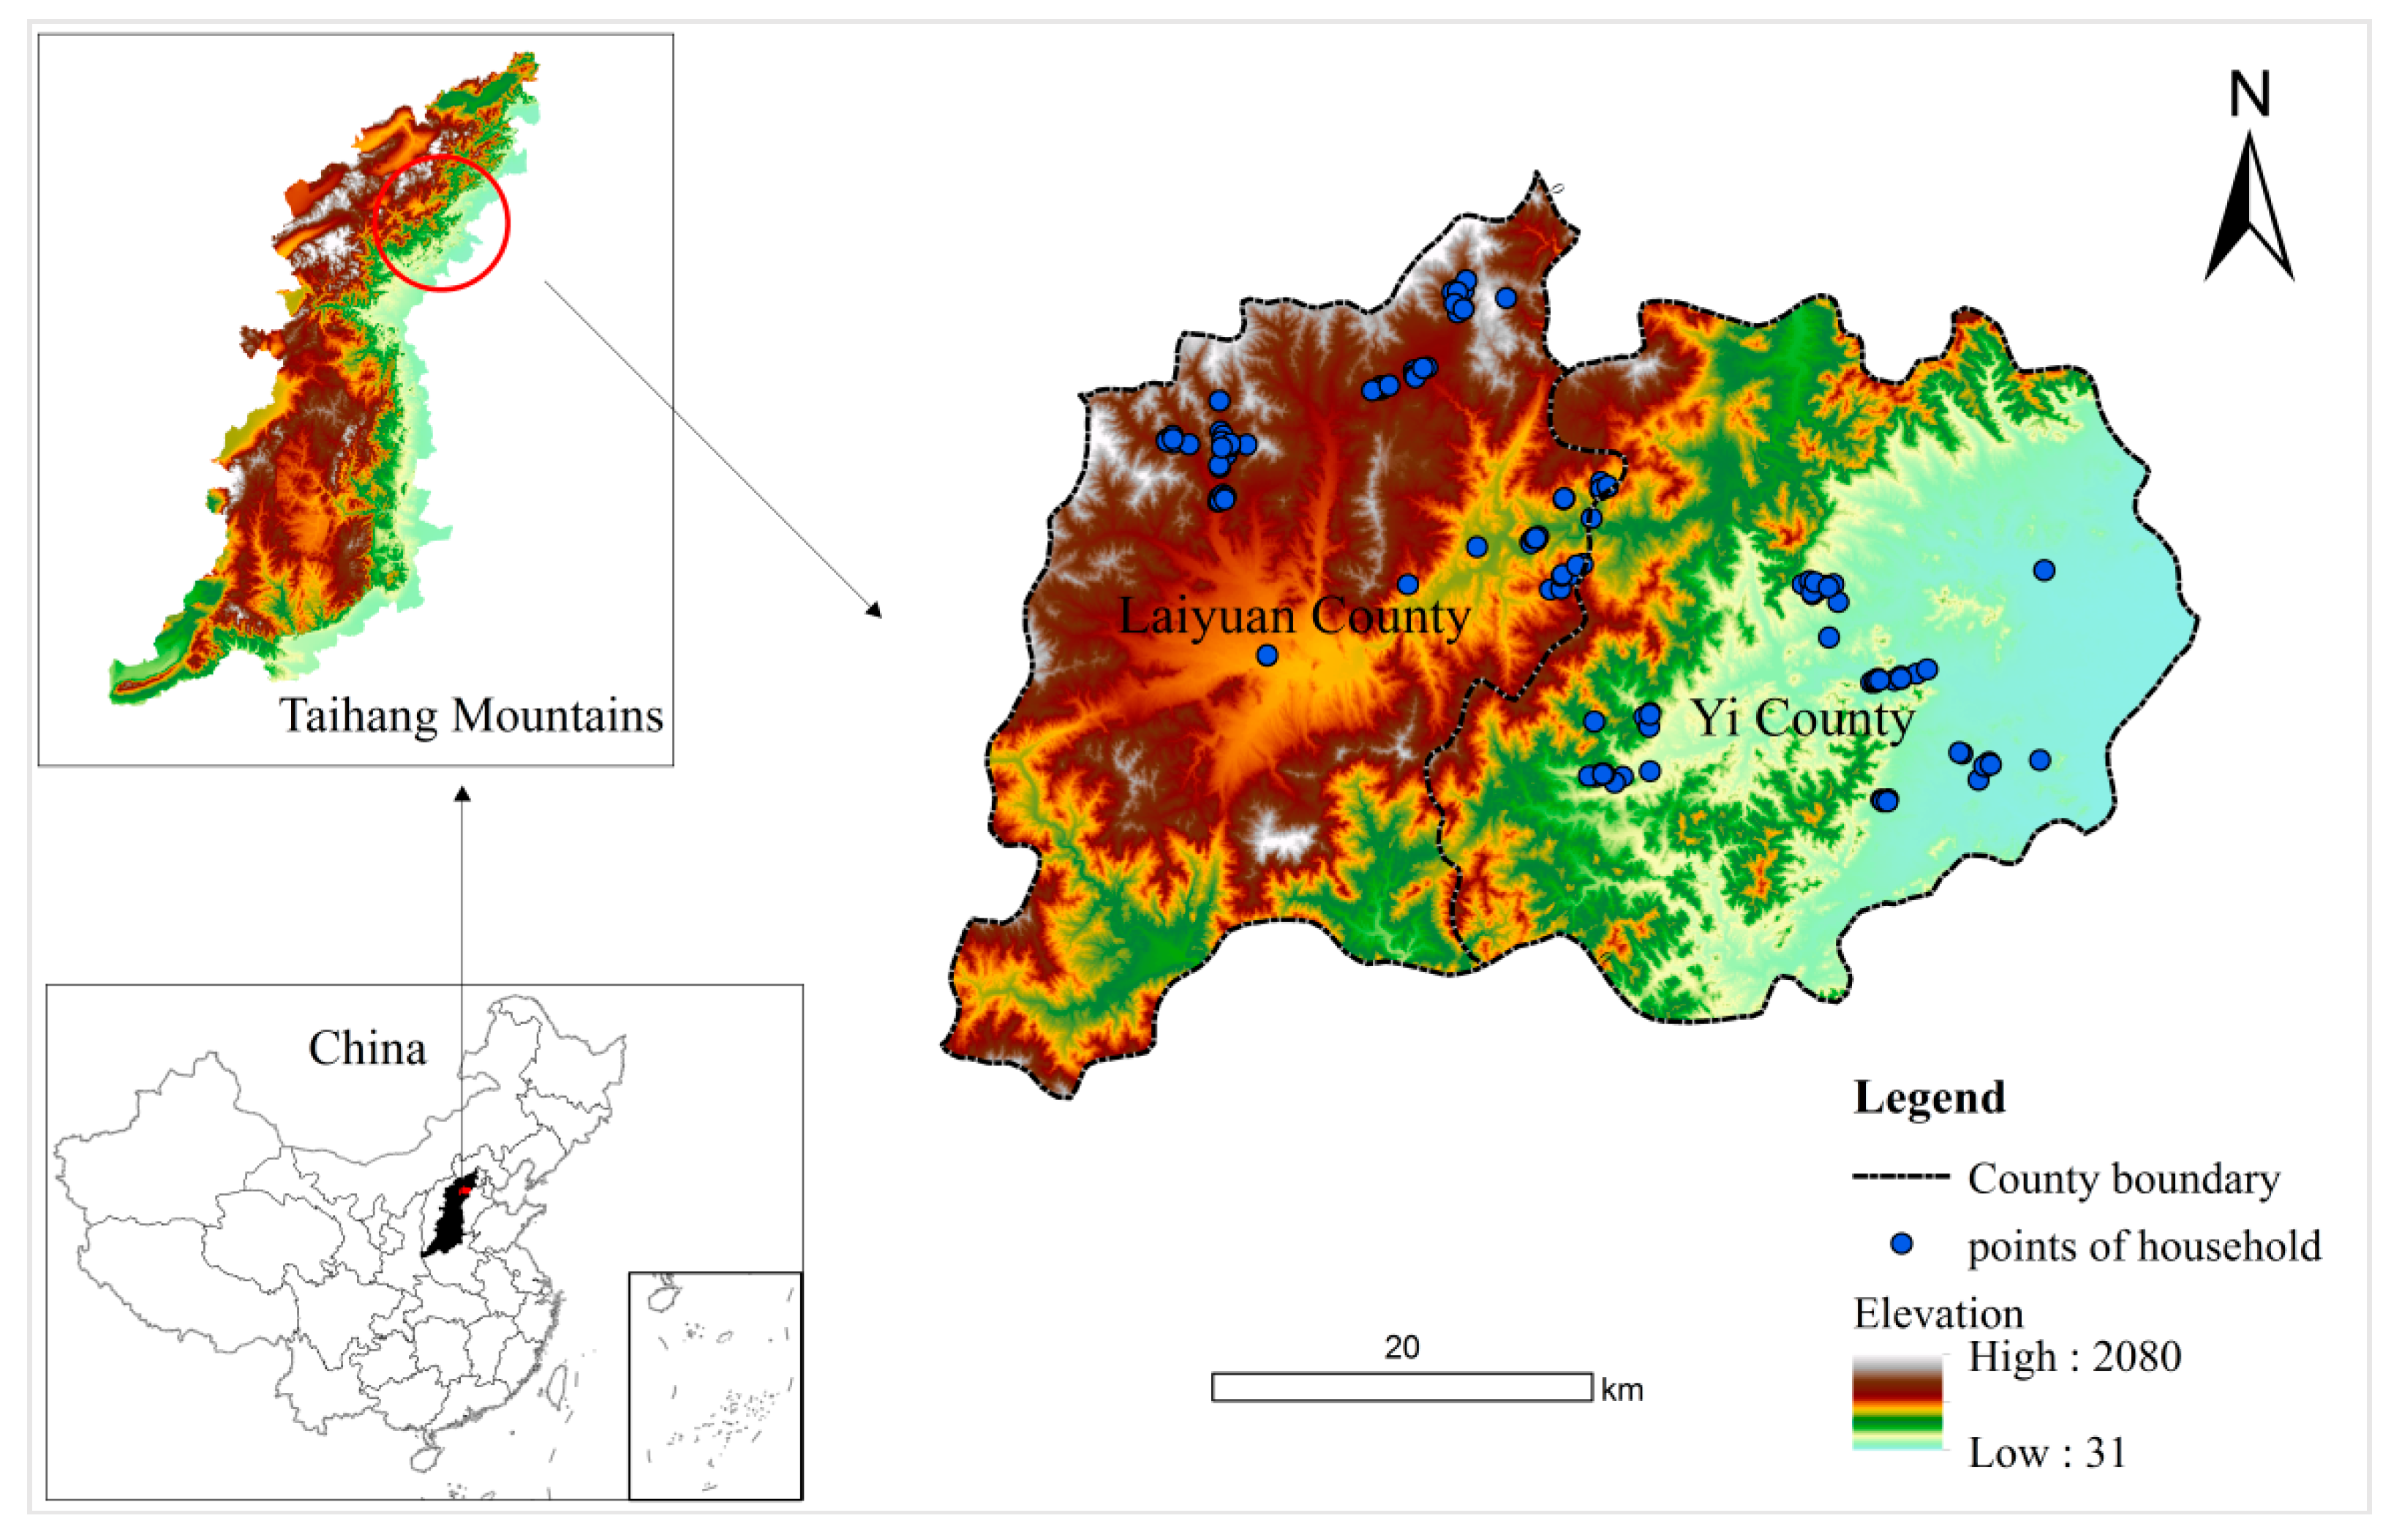
2.1. Study Area

We focused on two counties in the northern part of the Taihang Mountain region, namely Laiyuan County (114°20′–115°05′ E, 39°01′–39°40′ N) and Yi County (114°51′–115°37′ E, 39°02′–39°35′ N). The study area covered a total area of 5026 km2, with an average elevation of 700 m. The climate is a temperate monsoon climate, with an average annual temperature of 11.1 °C and an average annual rainfall of 511.7 mm [21]. According to data from the fifth and sixth national censuses, the rural population in the study area dropped by 15.7% from 2000 to 2010.
There are six land use types in the study area: i.e., arable land, grassland, forestland, water area, construction area and unused land. In 2000, their areas were 1150 km2, 1765 km2, 1909 km2, 77 km2 and 125 km2, respectively; during the period 2000–2016, arable land, grazing land and forestland decreased by 1.0%, 0.1%, 0.7%, respectively, while water area and construction area increased by 1.3% and 2.5%, respectively. In summary, in the study area, arable land, grazing land and forestland were the main land use types, and their total area accounted for 95.4–96.0% of the whole land area.
The study area has abundant forest resources. The dominant tree species in both counties are pine, larch, acacia, poplar, birch, apricot, and walnut. A variety of crops are planted in the area, including corn, beans, potatoes, sweet potatoes, wheat, and sorghum. Of these, corn was the main crop, accounting for 62.2% of the total cropland area in 2016.

2.2. Data

Our research is based on data from rural household surveys. We first conducted a preliminary survey in September 2016. During the formal survey period in 2017, we surveyed 20 villages of six towns, involving 1323 rural residents (Figure 1). Every sampled household was selected randomly. One trained interviewer carried out a household survey, based on a questionnaire, with either the head of the household or another knowledgeable person who served as a proxy respondent for other household members and departed migrants. It should be mentioned that respondents between the age of 30 and 60 were slightly over-represented, which also is the case for more highly-educated respondents. All answers were thoroughly checked for validity and quality; invalid questionnaires were excluded, resulting in a total of 288 valid questionnaires. The survey data of 2000 and 2016 covered the basic information on rural households (in terms of age, gender, health status, years of education, length of staying-at-home for family members, and livelihood diversification), agricultural production (yield, planting area, crop sales), income and consumption (including income source, consumption of living energy), and domestic livestock rearing and sales (with pigs, cattle, goats, and sheep as the main species).

3. Methods

3.1. Ecological Footprint Analysis

The ecological footprint is calculated by “adding up the areas (adjusted for their biological productivity) that are necessary to provide us with all the ecological services we consume” [22]. This interprets the amount of biologically productive space per capita of productivity, measured in global hectares (gha), to sustain the individuals within a given region. It is important to emphasize that we mainly focused on the ecological footprint of production, which had a greater impact on the ecological environment of the study area. For this reason, this study defined the ecological footprint of production as the ecological footprint per capita (EF_per), and did not estimate the EF of foods (e.g., meat, milk, etc.) produced outside the study area. During the preliminary survey, we found that there were no fishing grounds in the study area. Thus, the ecological footprint can mainly be measured in terms of cropland, grazing land, and forest area. The agricultural products produced on the cropland required local resources, which is why we used the yield of each crop to calculate the ecological footprint per capita of cropland (EFC_per) [22]. The ecological footprint per capita of forestland (EFF_per) assesses the households′ demand for firewood. In the study area, farmers often collect firewood for cooking and heating, and we therefore estimated the EFF_per by determining the amount of firewood per household.
In contrast to the traditional methods [22,23,24], the ecological footprint per capita of grazing land (EFG_per) was estimated via the grass requirements rather than the consumption of livestock products. In the study area, grass was not the main food source for pigs, and we therefore did not classify pigs as farming products on cropland. The grass consumption of pigs was estimated over a period of 2 years, while for other livestock, such an estimation was difficult, as it includes the number of livestock per household and their daily grass requirements [25], assuming that these animals consume grass each day. However, their actual diets were based on grains, grass, corn straw, and market feed (such as corn and products). Therefore, we estimated the footprint of the required grazing area via estimating the footprint of grass requirements minus the area occupied by other kinds of feedstuff. The footprint of the grass requirements was based on dividing the grass requirements by the per capita grass yield of rangeland [25], while the footprint of grain production for livestock was calculated in the same way as the EFC_per. We used the feed formula described in a related study [26]; for simplicity, the production of corn straw was considered equal to corn yield [27].
For reasons of comparison, we converted these areas into global hectares with the use of equivalence factors, reflecting the relative global productivity per capita for hectares of different land use categories [28]. The general calculation formula is as follows:
E F _ p e r = i = 1 n c i r j / p i ,
where E F _ p e r is the ecological footprint per capita (gha/cap), i is the type of produce, c i is the per capita production (consumption) of the i th goods (kg/cap) (firewood has a unit of m3), p i is the global average production capacity of the i th goods (kg/ha or m3/ha), j is the type of land, and rj is the equivalence factor of the j th land. We adopted the equivalence factors of the Global Footprint Account, 2017 Edition, released by the Global Footprint Network (GFN), to calculate the ecological footprint of 2000 and 2016. The equivalence factors were as follows: 2.53 for cropland, 1.29 for forest area, and 0.46 for grazing land.
The data of global average yield of each crop were obtained from the UN Food and Agriculture Organization (FAOSTAT) (http://faostat3.fao.org/home/E); the data of the global average yield of grass was based on a related study [29]. The data for the net annual increment, which is the average growth of timber measured as cubic meters under-bark per hectare per year, were obtained from the Global Forest Resources Assessment 2010.

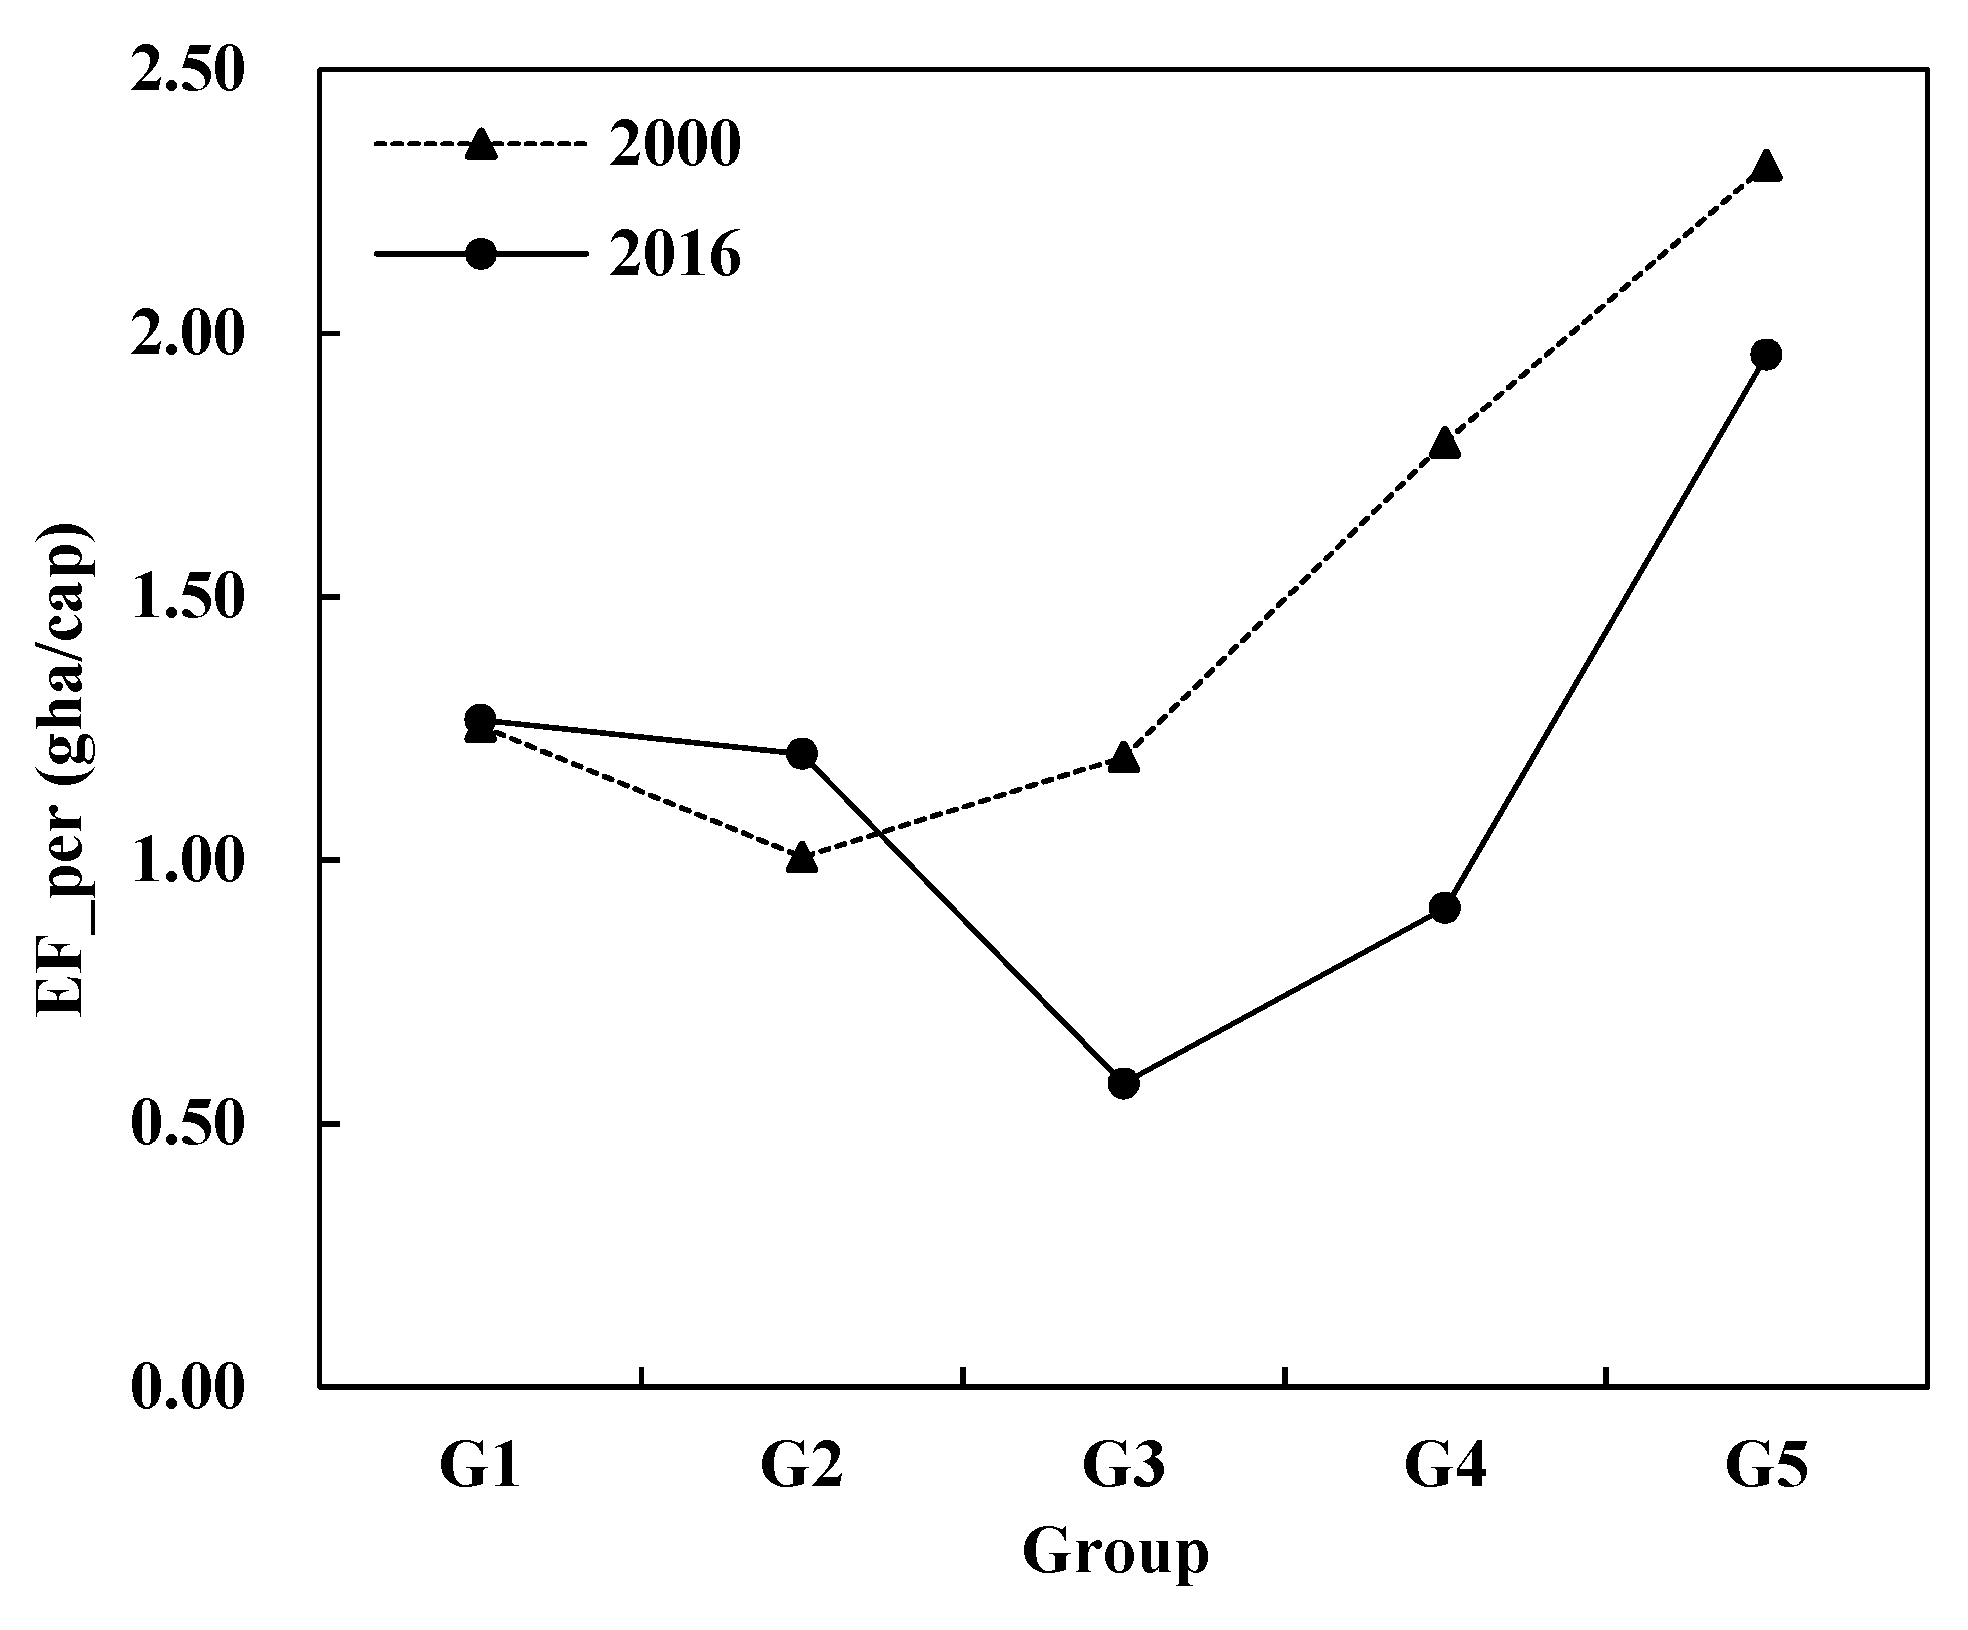
3.2. Household Classification

The study area is characterized by great differences in elevation, with levels ranging from 60 to 1240 m. We therefore established three elevation groups: low-elevation area (<500 m; LEA), medium-elevation area (500–1000 m; MEA), and high-elevation area (>1000 m; HEA). In the LEA, MEA and HEA, 86, 86, and 116 households, respectively, participated in the survey.

3.3. Demographic Characteristic

The selected demographic characteristic referred to the age structure. According to the existing research [30,31], the share of the working-age population per household was adopted as indicator of age structure. As defined by the World Bank, the working-age population is the population aged 15–64 years [32]. People under the age 15 were therefore not considered, and the impact of dependent children should be included in their parents’ age group [32]. This study divided the household into five groups, according to the share of the working-age population per household, namely G1 (0–25%), G2 (25–50%), G3 (50–75%), G4 (75–100%), and G5 (100%). This study defined G1 and G5 as the elderly population (population 65+) and the working-age population, respectively.

4. Results

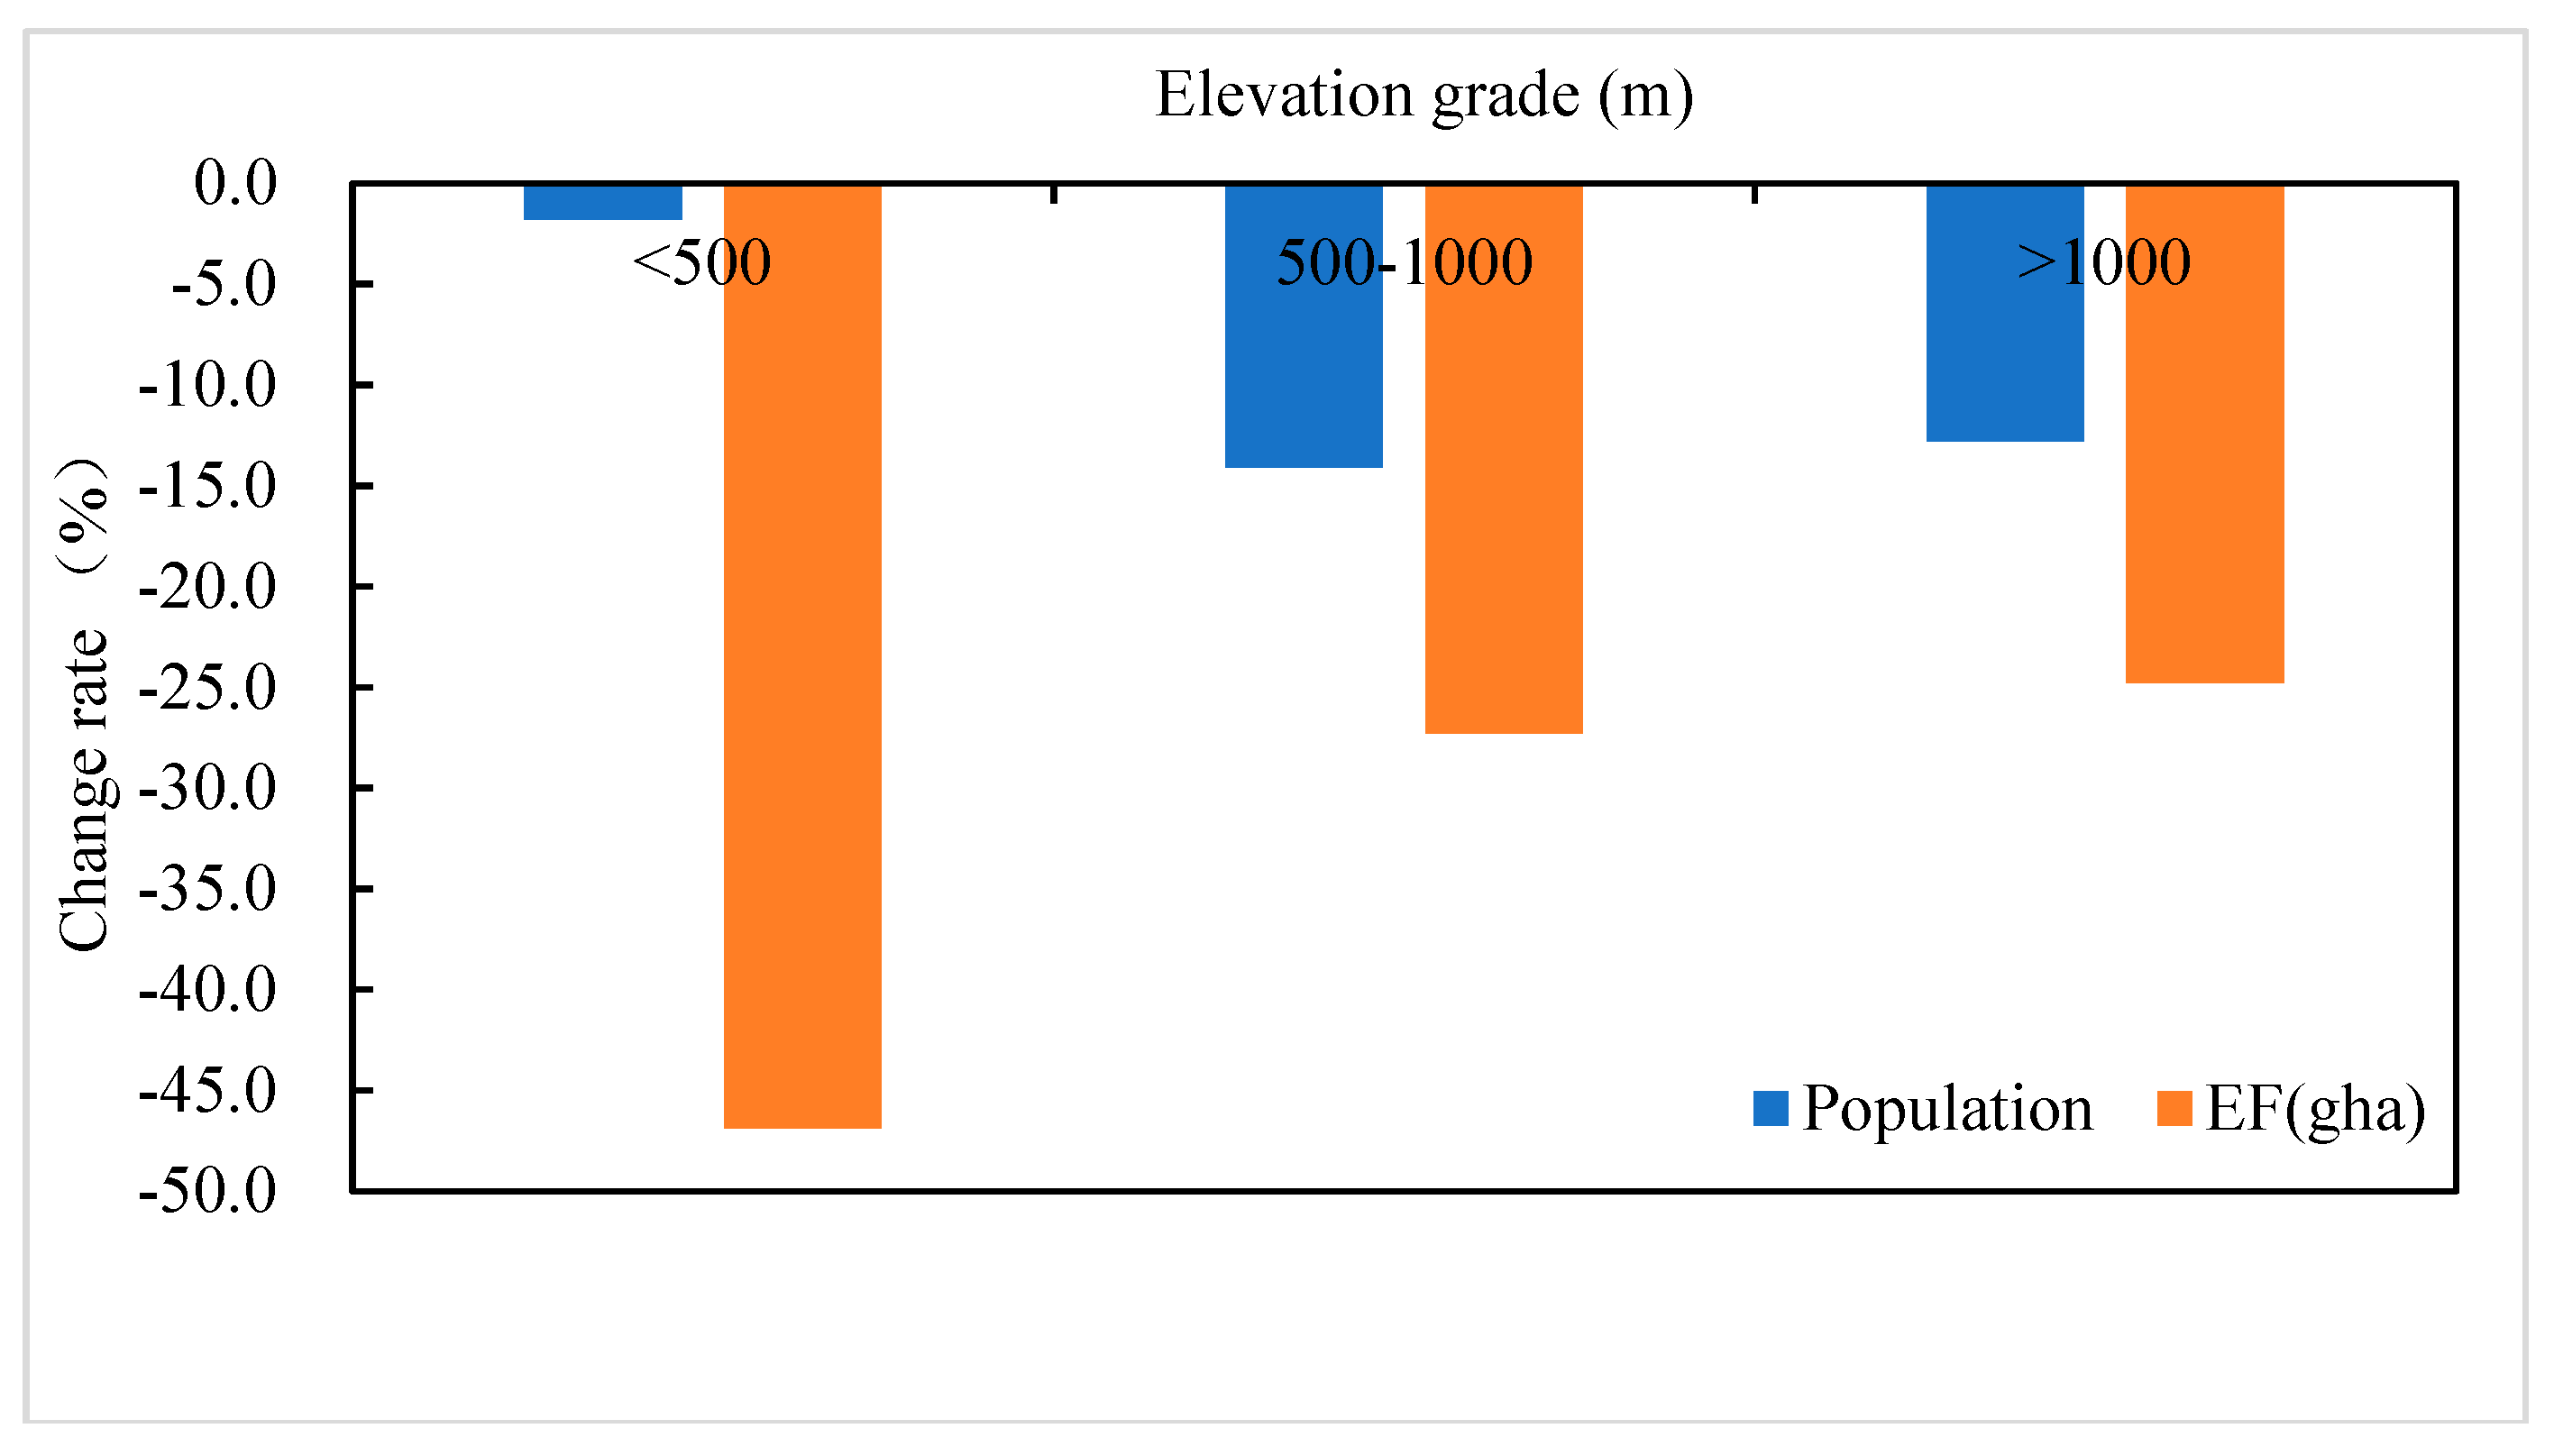
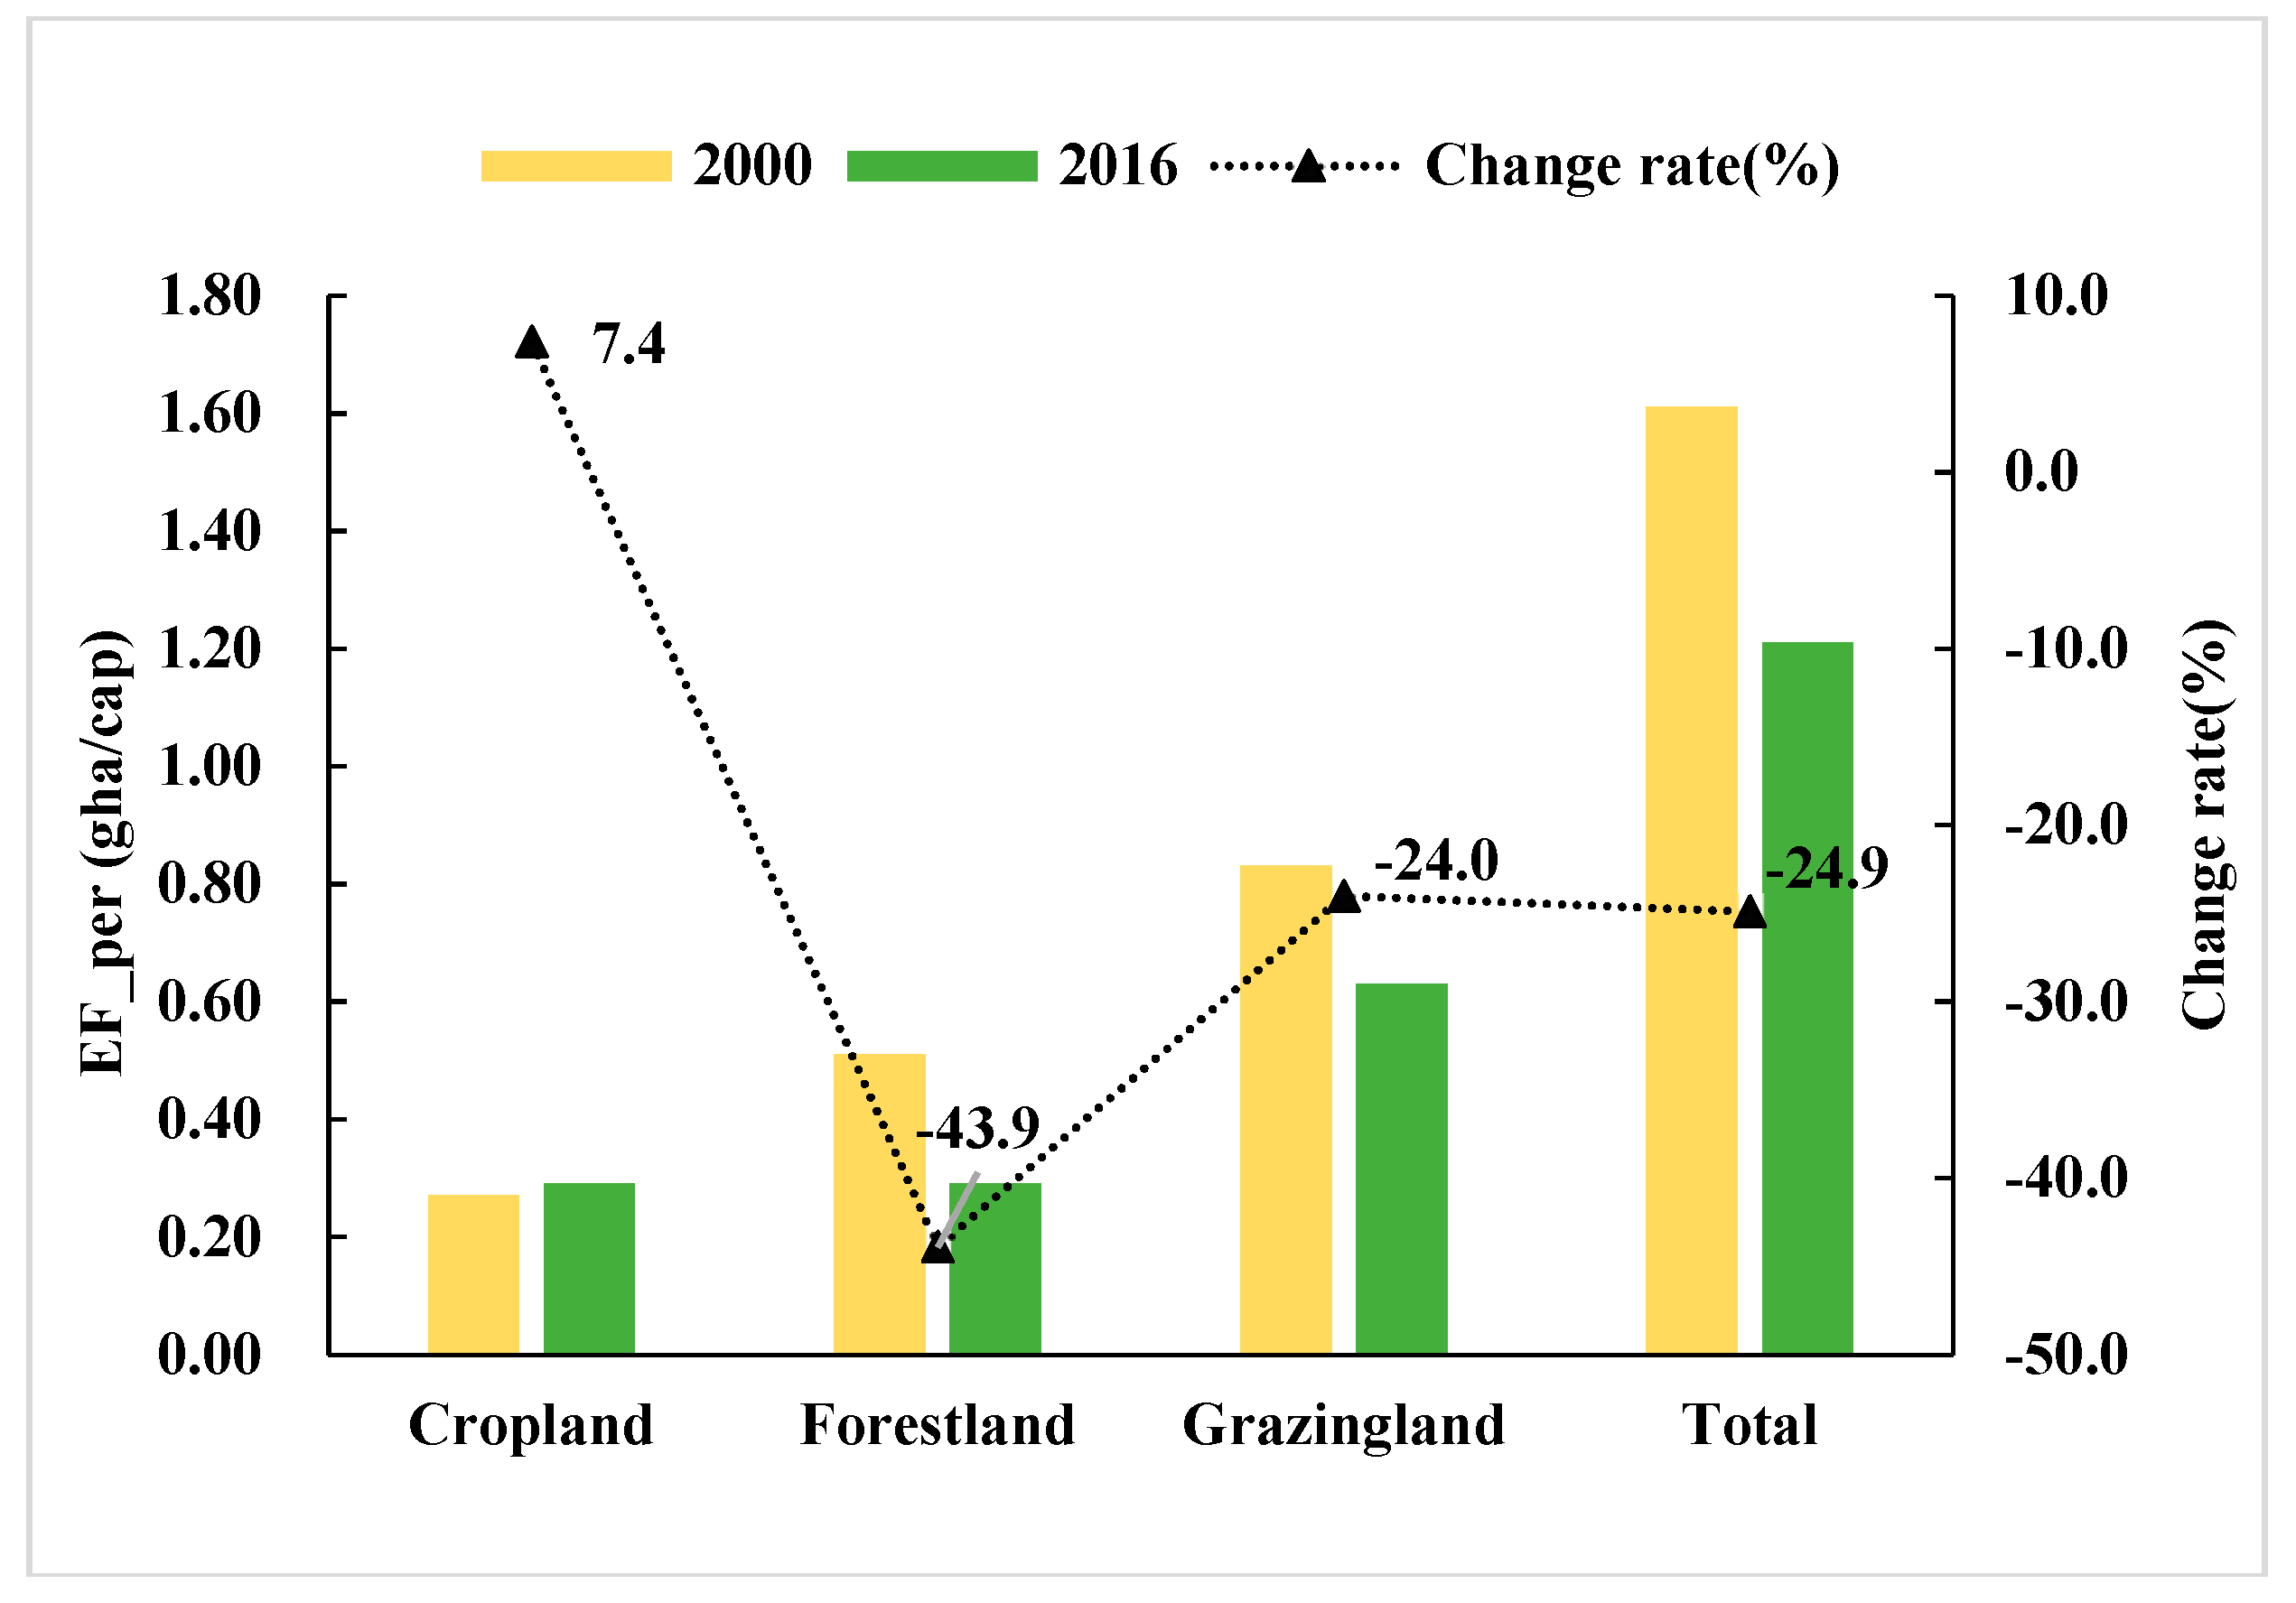
4.1. Changes in the Ecological Footprint and Ecological Footprint per Capita

According to our survey data based on 288 households, the population size in the study area decreased by 9.7%, while the total ecological footprint declined by 32.1% in the study areas. Both the population size and the ecological footprint varied across elevation grades. In the LEA, the MEA, and the HEA, the population size decreased by 1.8%, 14.1%, and 12.8%, respectively (Figure 2). Correspondingly, the ecological footprint decreased by 46.9%, 27.3% and 24.8%, respectively. This indicated that the ecological footprint per capita varied greatly across elevation grades.
Figure 3 indicates that the ecological footprint per capita has decreased from 1.61 gha/cap in 2000 to 1.21 gha/cap in 2016, which corresponds to a decreasing rate of 24.9%. The change rates of the EF_per were different at different elevation grades (Table 1). The decreasing rates of the EF_per decreased with increasing elevation. At the LEA and the HEA, the rates were −45.9% and −13.7%, respectively. This indicated that at lower elevations, households were less dependent on local resources.

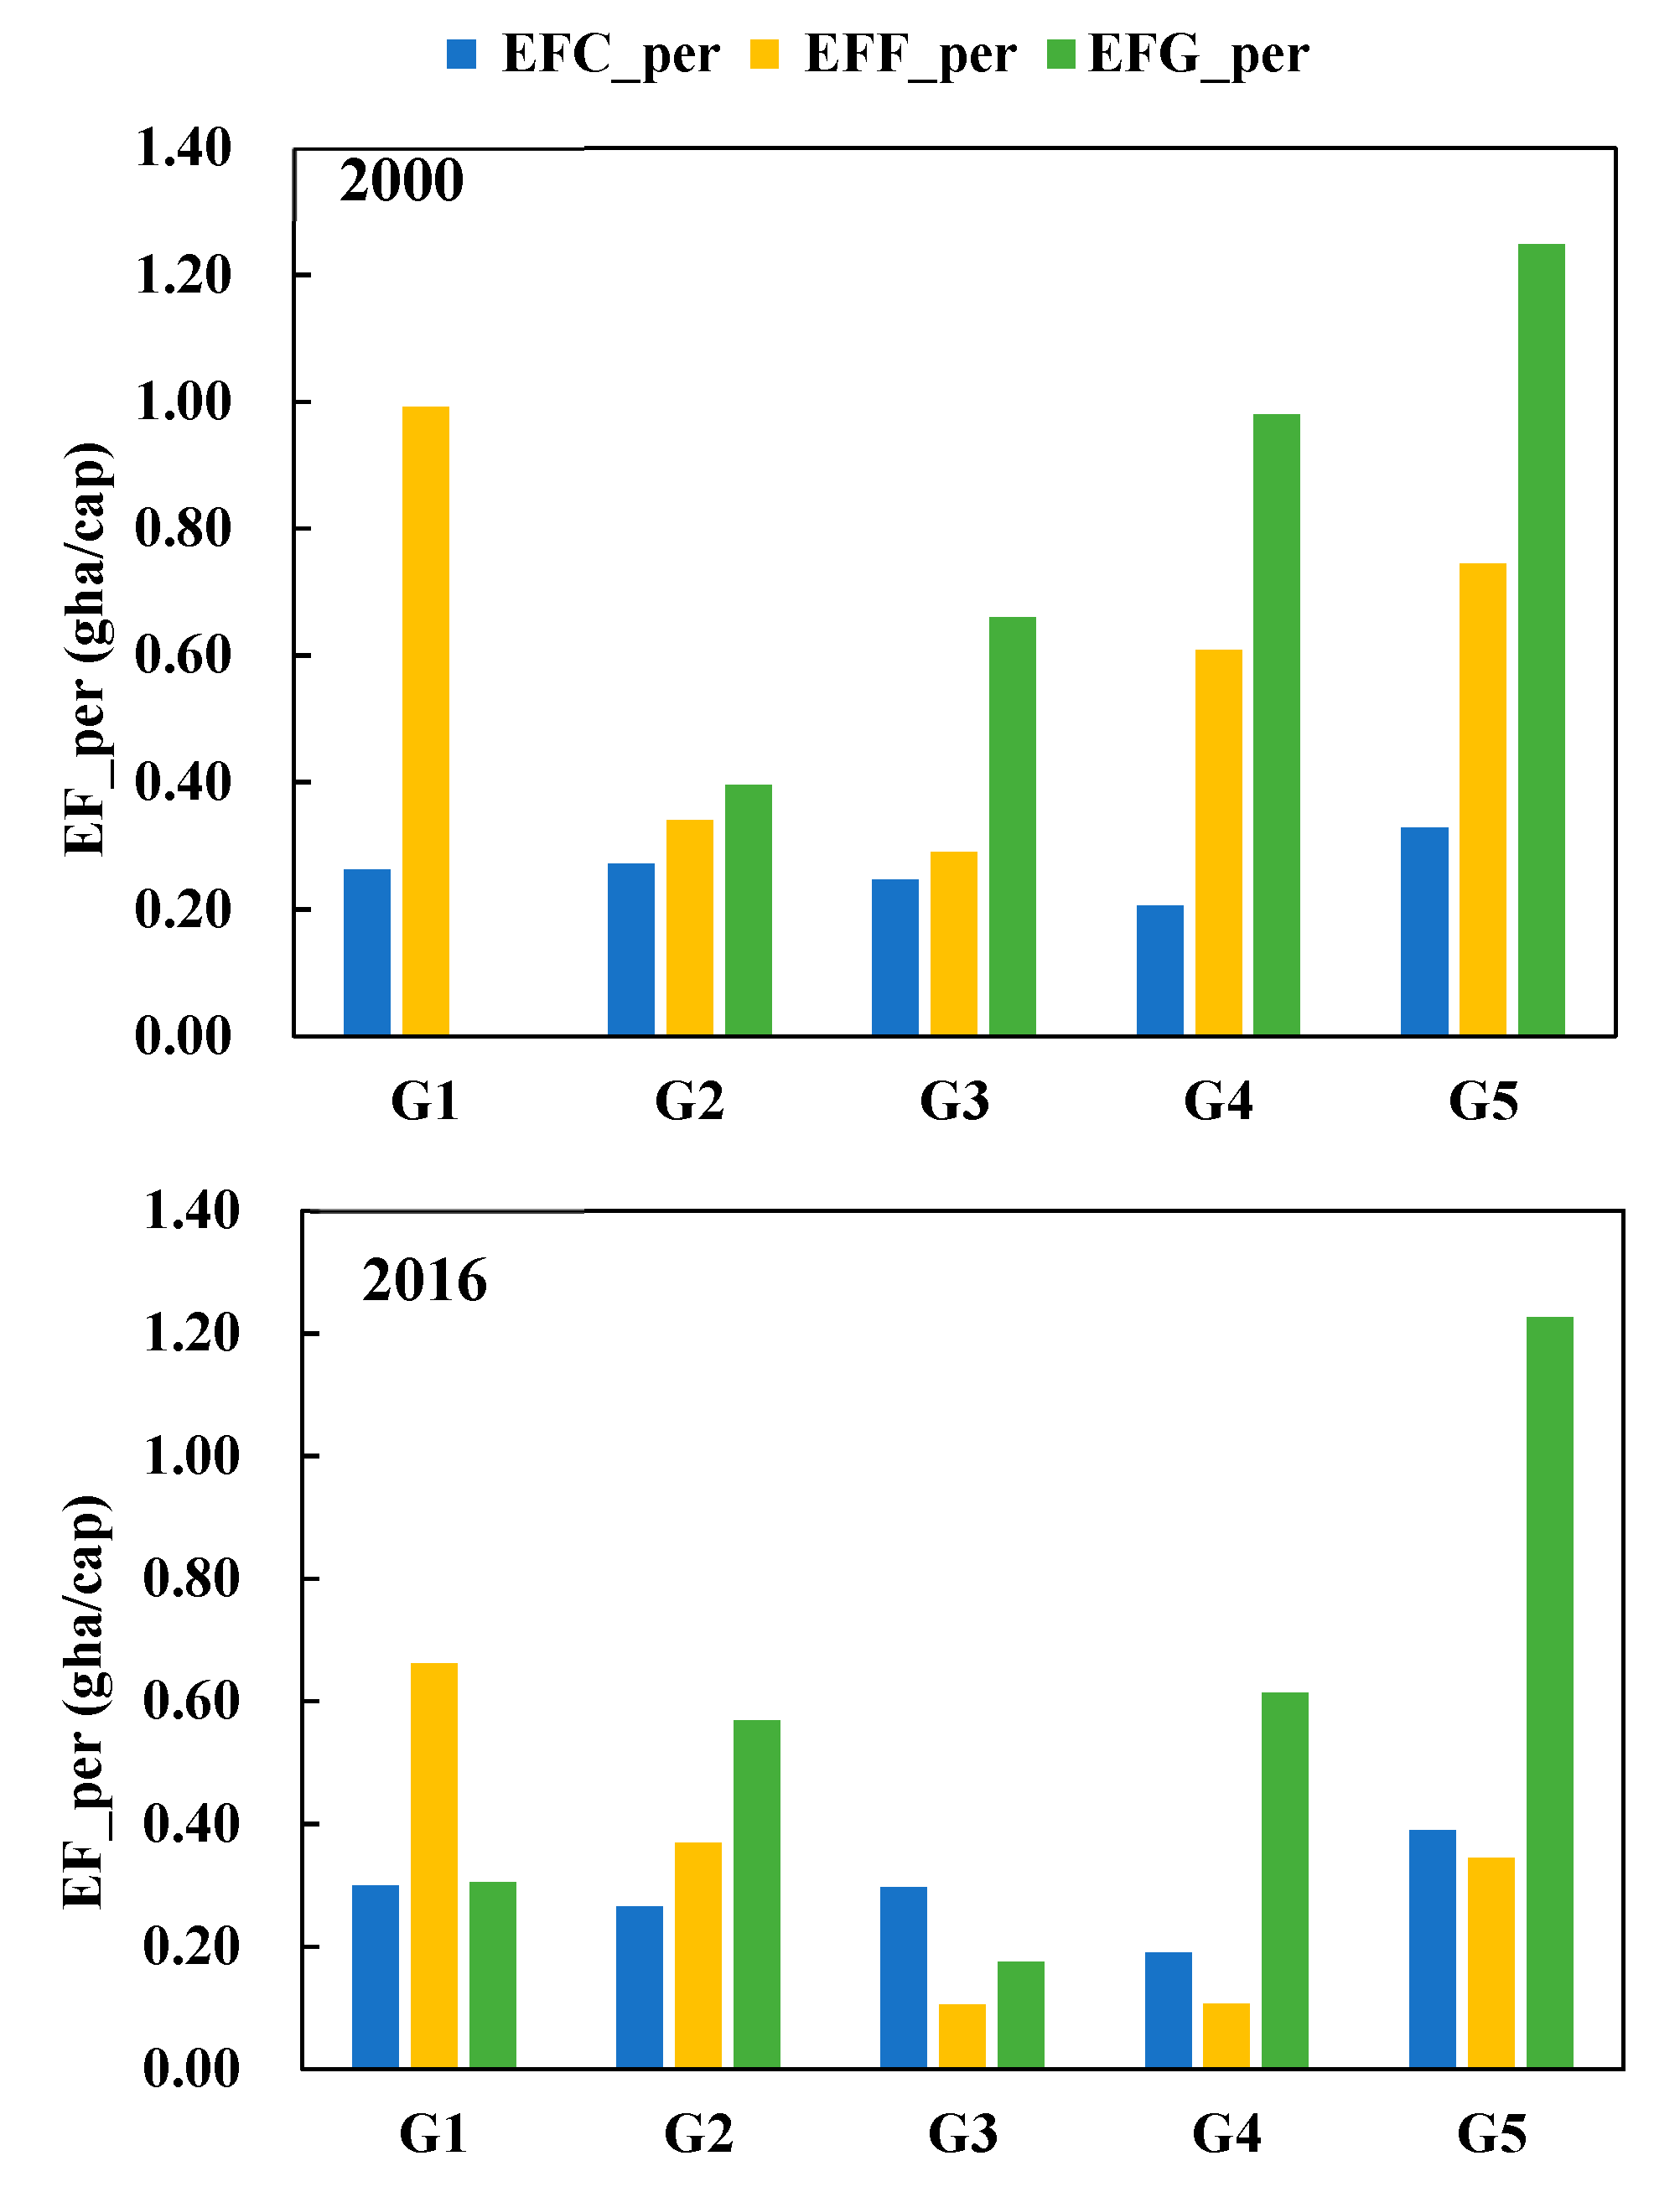
4.2. Changes in the Ecological Footprint per Capita of Cropland

During the period of 2000–2016, the EFC_per slightly increased by 7.4% (accounting for 16.9 and 24.2% of the EF_per, respectively) (Figure 3). In terms of elevation, the EFC_per in the LEA decreased by 23.1% during the experimental period, but increased by 25.1% and 43.8%, respectively, in the MEA and the HEA (Table 1).

4.3. Changes in the Ecological Footprint per Capita in Terms of the Forest Area

During the period 2000–2016, the EFF_per values decreased by 43.9% (Figure 3). In 2000 and 2016, the EFF_per accounted for 31.4% and 23.5% of the EF_per, respectively.
As shown in Table 1, the change rate of the EFF_per significantly differed between all groups. The area with an elevation below 500 m showed the largest decrease (65.6%), with a significant reduction in the demand for firewood. In the MEA and the HEA, the EFF_per decreased by 31.4% and 39.4%, respectively.

4.4. Changes in the Ecological Footprint per Capita on Grassland

Figure 3 shows that the EFG_per decreased by 24.0% during the study period of 2000–2016. In both years, the EFG_per accounted for 51.7% and 52.3% of the EF_per, respectively. Our data clearly showed that the households mainly occupied grazing land.
In areas below an elevation of 500 m, the change rate of the EFG_per was largest and was about 47.1% during the study period (Table 1). In the MEA and the LEA, the change rate of the EFG_per were 17.6% and 21.2%, respectively.

5. Discussion

The ecological footprint represents an important index for the evaluation of the consumed ecological assets. The changes in ecological footprint cover two aspects: changes in population and ecological footprint per capita. Previous studies have shown that the emigration of rural residents significantly influences the EF_per and is a major driver of EF_per changes at different levels [33,34]. In the study area, the population decreased by 9.7% between 2000 and 2016, and the decreasing rate of the EF_per was 2.6 times that of the population. This value was higher than the EF_per of Manali, a town in the Himalayan mountainous area, and the average value for China [17,35]. In the town of Manali, the change rate of EF_per of residents was 0.4 times that of the population. For China, Xu and Cheng (2005), using the STIRPAT model, assessed that a 1% change in population leads to a nearly equal percentage change in the EF_per [17]. In our study, the change rates of EFF_per and EFG_per were 4.5 and 2.5 times that of the population, respectively, while the absolute change rate of the EFC_per was 0.8 times that of the population.
In the LEA, the MEA, and the HEA, population size decreased by 1.8%, 14.1%, and 12.8%, respectively. Correspondingly, the decreasing rate of the EF_per was 45.9%, 15.4%, and 13.7%, respectively (Table 1). We therefore infer that in the MEA and the HEA, a 1% decrease in population induced a nearly equal percentage decrease in the EF_per. However, in the LEA, although population did not change obviously, the change rate of the EF_per decreased greatly.
In the LEA, the change rate of the EFC_per differed from that of the MEA and the HEA. According to the field data, 50.0% of the surveyed households in the LEA have participated in the Grain for Green Program (GGP), returning cropland for restoration purposes (Figure 4). The area of the returned land accounted for 25.1% of the total cropland area. Moreover, 3.5% of the households have abandoned their cropland, with abandoned land accounting for 3.3% of the total cropland area. Compared to the depopulation, the decrease in the EFC_per could mainly attributed to the GGP. Similar conclusions were made in previous studies. For example, in the Loess Plateau watershed of China, after the introduction of the GGP, the EFC_per decreased by 74.3% [36]. Furthermore, compared to other areas, areas at lower elevation offered more opportunities in terms of non-farming activities, resulting in a decline of the EFC_per [28]. In the low-elevation area, the proportion of income from agricultural activities of the total income was 11%, which was lower than that in the MEA (16%) and the HEA (18%). This showed that a combination of GGP implementation, land abandonment, and more non-agricultural job opportunities lead to a reduction in the EFC_per. In the MEA and the HEA, due to the rapid decrease in population and increase in yield of crop (increasing rate was 10.7%), EFC_per increased by 25% and 43.8%, respectively.
In 2000 and 2016, the EFF_per accounted for 31.4% and 23.5% of the EF_per, respectively. This indicated that the decrease in EFF_per led to the decrease in EF_per, while the contribution of EFF_per on the EF_per decreased during the study period. Throughout the studied period, the amount of firewood consumed decreased by 43.9%, which was caused by various factors. On one side, the implementation of forest conservation policies has greatly promoted afforestation and therefore reduced the amount of collected firewood. For instance, the Closing Hill for Afforestation Program had a remarkable impact on forest recovery in China. The impacts of the program include (1) restoring and developing forest vegetation based on plants′ natural abilities to seed and sprout after the former trees are cut down; and (2) closing the woodland and shrub woodland with low quality and low efficiency to improve the quality of the forest [37]. On the other hand, people gradually develop a higher awareness of environmental issues, and along with higher per capita incomes, the rate of firewood use has decreased. This supported the “energy ladder” hypothesis, which stated that economic development reduces the demand for fuelwood [38], as households switch to more sophisticated fuels as their economic conditions improve [39]. This hypothesis also can be proved by energy uses in different elevations. In 2016, the annual income per capita of LEA was 20,671 RMB/cap (3027.8 USD/cap), which was 1.3 and 1.2 times that of MEA and HEA, respectively. Correspondingly, in the LEA, rural households mainly used coal (40.0%), liquefied gas (30.2%), electricity (22.0%), coal +fuelwood (7.2%) and straw (0.6%) for cooking and heating, according to our field survey data. In the MEA and the HEA, the corresponding proportions were coal (68%), straw (12%), fuelwood (10%), and electricity (10%), respectively. This resulted in a higher EFF_per (see Table 1 and Figure 5).
In the study area, livestock rearing was an important activity of rural households. The EFG_per accounted for more than half of the EF_per. Thus, the decrease in EFG_per was critical to the decline of EF_per. Overall, the EFG_per decreased by 24.0% from 2000 to 2016, which was a result of the policy “Enclosure and Grazing Prohibition” (EGP). Within the scope of this policy, the local governments have actively guided farmers to use captive breeding methods and helped them engage in other industries. Such policies have also been implemented in other countries such as South Africa [40] and Iceland [41]. Furthermore, households who lack a workforce were likely not to have livestock [42]. In the LEA, due to the more non-agricultural jobs and high income, the EFG_per of households was lower than those in areas at medium and high elevations.
With the emigration of the labor force, rural aging is becoming more common, resulting in a remarkable change in age structure, with obvious effects on the EF_per of a given region. Figure 6 shows the results and its change from 2000 to 2016, according to the age structure. In the groups G1 and G2, the EF_per increased by 1.6% and 19.4% from 2000–2016. On the contrary, for G3, G4, and G5, the EF_per values decreased by 51.8%, 49.3%, and 15.5%, respectively. Overall, during the study period, all four groups were subject to decreases in population (Table 2). This was particularly evident for G5, with a population decrease of 20.3%.
As shown in Figure 7, in 2000 and 2016, the EFF_per values of elderly people were 0.99 and 0.66 gha/cap, respectively. The values were both the highest in all groups and may be a result of inherent consumption conceptions and lifestyle. To reduce household expenses, elderly people still maintain the habit of using firewood. Furthermore, the average yearly income in this age group was 12,950 RMB/cap (1895.2 USD/cap), which was considerably lower than that of the other groups G2, G3, G4, and G5: 16,165, 20,722, 13,000, and 21,217 RMB/cap (2365.7, 3032.5, 1902.1, 3104.3 USD/cap). Thus, according to the “energy ladder” hypothesis, they were apt to use firewood. For G5, the EFG_per of the working-age population was highest in all groups. This showed that rural laborers staying in the area were more dependent on animal husbandry than other groups. In brief, households containing more elderly people had higher EFF_per values, while those with more laborers had higher EFG_per values.
Lastly, the ecological impacts resulting from rural–urban migration are not easily measured only by a matter of calculating the ecological footprint. In mountainous areas of many countries, emigration is ongoing and has permanent environmental and socio-economic consequences. On the one hand, many existing studies have reported that rural emigration is a cause of the regrowth of native vegetation. For instance, in the mountainous area of Oaxaca, southern Mexico, during the period of 1980–2008, the dramatic fall in population exacerbated the rate of cropland abandonment, leading to forest recovery [43]. On the other hand, depopulating villages frequently lack basic infrastructure, such as roads, doctors, and schools. This affects the wellbeing and quality of life of its current inhabitants and creates incentives for current inhabitants to leave [44]. Overall, these apparently contradictory findings suggest that the ecological impacts caused by rural–urban migration are complex and worthy of further studies.

6. Conclusions

This study focused on the impacts of population migration on the ecological footprint in mountainous areas, using survey data from 288 households of the Taihang Mountain region, China. We mainly analyzed the changes in EF_per, EFC_per, EFF_per and EFG_per from 2000 to 2016 according to elevation and age structure.
During the period of 2000–2016, the population size in the study area decreased by 9.7%, while the total ecological footprint declined by 32.1%. This indicated that ecological footprint per capita decreased greatly. Among the changes in the EF_per, the EFC_per decreased in the low elevation area, and increased in areas at medium and high elevations. Unlike the changes in EFC_per, the EFF_per and EFG_per decreased dramatically in the whole study area. In the areas at a low elevation, the decreasing rates of EFF_per and EFG_per were considerably higher than those in areas at medium and high elevations. In addition, rural aging significantly affected the ecological footprint of the population. The EF_per of households with more elderly people was lower than those with more laborers.
Our paper showed that migration mitigated the impacts on environment pressure in mountainous areas, but also sparked the increase of urban ecological pressure from another perspective. Urbanization not only represents the flows of population, commodities, funds and information, but also a human ecological transformation. With the overwhelming trend of rural–urban migration, rural aging, inadequate land management, hollow rural inhabitants and other issues lead to rural decline. Our study provided evidence for policymakers to guide population migration reasonably and was of great practical significance for rural sustainable development. Reasonably guiding population migration can mitigate the loss of labor force and rural decline. The policies of EGP and Closing Hill for Afforestation have played important roles in the reduction of EF_per in part of our study area. Nevertheless, in some regions at medium and high elevations, these policies were not implemented strictly. This indicated that we should further enhance the implementation of policies in these regions. Moreover, the government should provide more non-agricultural jobs for households who stay at home to increase income for mitigating the pressure on natural resources.
This study has several limitations. First, we classified households according to elevation and analyzed the impacts of the demographic structure on the ecological footprint. However, the EF_per is influenced by a variety of factors, and further analyses are necessary, using more data from field surveys. Secondly, this paper mainly focused on the changes in ecological footprint locally, while ignoring the impacts of farmers′ trade with the outside world. Thus, in future research, we should consider this issue by collecting as much data as possible.

Author Contributions

Writing—original draft, X.X. and M.H.; Writing—review & editing, M.T., X.L. and W.L.

Funding

The Natural Science Foundation of China: 41771116. The National Program “Key Basic Research Project of China” (973 Program): 2015CB452700. The National Key Research and Development Program of China: 2016YFC0502103.

Acknowledgments

This work was supported by the Natural Science Foundation of China (41771116), the National Program “Key Basic Research Project of China” (973 Program) (2015CB452700), and the National Key Research and Development Program of China (2016YFC0502103).

Conflicts of Interest

The authors declare no conflict of interest.

References

  1. Rees, W.; Wackernagel, M. Urban ecological footprints: Why cities cannot be sustainable—And why they are a key to sustainability. Environ. Impact Assess. Rev. 1996, 16, 223–248. [Google Scholar] [CrossRef]
  2. Lall, S.; Selod, H.; Shalizi, Z. Rural-Urban Migration in Developing Countries: A Survey of Theoretical Predictions and Empirical Findings; The World Bank: Washington, DC, USA, 2006. [Google Scholar]
  3. Li, S.; Sun, Z.; Tan, M.; Li, X. Effects of rural-urban migration on vegetation greenness in fragile areas: A case study of Inner Mongolia in China. J. Geogr. Sci. 2016, 26, 313–324. [Google Scholar] [CrossRef]
  4. Tan, M.; Li, X.; Yan, J.; Xin, L.; Sun, L. Length of stay in urban areas of circular migrants from the mountainous areas in China. J. Mt. Sci. 2016, 13, 947–956. [Google Scholar] [CrossRef] [Green Version]
  5. Adger, W.N. Social and ecological resilience: Are they related? Prog. Hum. Geogr. 2000, 24, 347–364. [Google Scholar] [CrossRef]
  6. Li, A.; Wang, A.; Liang, S.; Zhou, W. Eco-environmental vulnerability evaluation in mountainous region using remote sensing and GIS—A case study in the upper reaches of Minjiang River, China. Ecol. Model. 2006, 192, 175–187. [Google Scholar] [CrossRef]
  7. Kräuchi, N.; Brang, P.; Schönenberger, W. Forests of mountainous regions: Gaps in knowledge and research needs. For. Ecol. Manag. 2000, 132, 73–82. [Google Scholar] [CrossRef]
  8. Walters, B.B. Migration, land use and forest change in St. Lucia, West Indies. Land Use Policy 2016, 51, 290–300. [Google Scholar] [CrossRef]
  9. Aide, T.M.; Grau, H.R. Globalization, Migration, and Latin American Ecosystems. Science 2004, 305, 1915–1916. [Google Scholar] [CrossRef] [PubMed]
  10. Xystrakis, F.; Psarras, T.; Koutsias, N. A process-based land use/land cover change assessment on a mountainous area of Greece during 1945–2009: Signs of socio-economic drivers. Sci. Total Environ. 2017, 587–588, 360–370. [Google Scholar] [CrossRef] [PubMed]
  11. Emi, U.; Jintao, X.; Rozelle, S. Grain for Green: Cost-effectiveness and Sustainability of China′s Conservation Set-Aside Program. Land Econ. 2005, 81, 247–264. [Google Scholar]
  12. He, W.; Yan, J.; Zhou, H.; Li, X. Influencing factors of rural household firewood consumption: Theoretical model and empirical research of typical area in Chongqing Municipality. Acta Ecol. Sin. 2016, 36, 1369–1379. [Google Scholar]
  13. Grau, H.R.; Aide, T.M. Are Rural–Urban Migration and Sustainable Development Compatible in Mountain Systems? Mt. Res. Dev. 2007, 27, 119–123. [Google Scholar] [CrossRef]
  14. Rees, W.E. Ecological footprints and appropriated carrying capacity: What urban economics leaves out. Environ. Urban. 1992, 4, 121–130. [Google Scholar] [CrossRef]
  15. Galli, A.; Wiedmann, T.; Ercin, E.; Knoblauch, D.; Ewing, B.; Giljum, S. Integrating Ecological, Carbon and Water footprint into a “Footprint Family” of indicators: Definition and role in tracking human pressure on the planet. Ecol. Indic. 2012, 16 (Suppl. C), 100–112. [Google Scholar] [CrossRef]
  16. Hoekstra, A.Y. Human appropriation of natural capital: A comparison of ecological footprint and water footprint analysis. Ecol. Econ. 2009, 68, 1963–1974. [Google Scholar] [CrossRef] [Green Version]
  17. Xu, Z.; Cheng, G. Impacts of population and affluence on environment in China. J. Glaciol. Geocryol. 2005, 27, 767–773. [Google Scholar]
  18. Lü, Y.; Zhang, L.; Feng, X.; Zeng, Y.; Fu, B.; Yao, X.; Li, J.; Wu, B. Recent ecological transitions in China: Greening, browning, and influential factors. Sci. Rep. 2015, 5, 8732. [Google Scholar] [CrossRef] [PubMed]
  19. Li, W.; Li, X.; Tan, M.; Wang, Y. Influences of population pressure change on vegetation greenness in China′s mountainous areas. Ecol. Evol. 2017, 7, 9041–9053. [Google Scholar] [CrossRef] [PubMed]
  20. Martínez-Zarzoso, I.; Bengochea-Morancho, A.; Morales-Lage, R. The impact of population on CO2 emissions: Evidence from European countries. Environ. Resour. Econ. 2007, 38, 497–512. [Google Scholar] [CrossRef]
  21. Li, X.; Gao, H.; Han, L.; Liu, J. Spatio-temporal variations in vegetation NPP and the driving factors in Taihang Mountain Area. Chin. J. Eco-Agric. 2017, 25, 498–508. [Google Scholar]
  22. Wackernagel, M.; Onisto, L.; Bello, P.; Callejas Linares, A.; Susana López Falfán, I.; Méndez Garcı́a, J.; Isabel Suárez Guerrero, A.; Guadalupe Suárez Guerrero, M. National natural capital accounting with the ecological footprint concept. Ecol. Econ. 1999, 29, 375–390. [Google Scholar] [CrossRef]
  23. Bicknell, K.B.; Ball, R.J.; Cullen, R.; Bigsby, H.R. New methodology for the ecological footprint with an application to the New Zealand economy. Ecol. Econ. 1998, 27, 149–160. [Google Scholar] [CrossRef] [Green Version]
  24. Lenzen, M.; Murray, S.A. A modified ecological footprint method and its application to Australia. Ecol. Econ. 2001, 37, 229–255. [Google Scholar] [CrossRef]
  25. Lin, D.; Hanscom, L.; Martindill, J.; Borucke, M.; Cohen, L.; Galli, A.; Lazarus, E.; Zokai, G.; Iha, K.; Wackernagel, M. Working Guidebook to the National Footprint Accounts; Global Footprint Network: Oakland, CA, USA, 2017. [Google Scholar]
  26. Xie, H.; Chen, X.; Yang, M.; Zhao, H.; Zhao, M. The ecological footprint analysis of 1 kg livestock product of China. Acta Ecol. Sin. 2009, 3264–3270. [Google Scholar]
  27. Graham, R.L.; Nelson, R.; Sheehan, J.; Perlack, R.D.; Wright, L.L. Current and Potential U.S. Corn Stover Supplies. Agron. J. 2007, 99, 1–11. [Google Scholar] [CrossRef]
  28. Hao, H.; Zhang, J.; Li, X.; Zhang, H.; Zhang, Q. Impact of livelihood diversification of rural households on their ecological footprint in agro-pastoral areas of northern China. J. Arid Land 2015, 7, 653–664. [Google Scholar] [CrossRef] [Green Version]
  29. Wang, L.; Gao, J. The ecological footprint of alpine pastures at the village-level: A case study of Hezuo in Gannan Autonomous Prefecture, China. Acta Ecol. Sin. 2012, 32, 3795–3805. [Google Scholar] [CrossRef]
  30. Cole, M.A.; Neumayer, E. Examining the Impact of Demographic Factors on Air Pollution. Popul. Environ. 2004, 26, 5–21. [Google Scholar] [CrossRef] [Green Version]
  31. York, R.; Rosa, E.; Dietz, T. Footprints on the Earth: The Environmental Consequences of Modernity. Am. Sociol. Rev. 2003, 68, 279–300. [Google Scholar] [CrossRef]
  32. Liddle, B.; Lung, S. Age-structure, urbanization, and climate change in developed countries: Revisiting STIRPAT for disaggregated population and consumption-related environmental impacts. Popul. Environ. 2010, 31, 317–343. [Google Scholar] [CrossRef]
  33. Dietz, T.; Rosa, E.A.; York, R. Driving the human ecological footprint. Front. Ecol. Environ. 2007, 5, 13–18. [Google Scholar] [CrossRef]
  34. Jia, J.; Deng, H.; Duan, J.; Zhao, J. Analysis of the major drivers of the ecological footprint using the STIRPAT model and the PLS method--A case study in Henan Province, China. Ecol. Econ. 2009, 68, 2818–2824. [Google Scholar] [CrossRef]
  35. Cole, V.; Sinclair, A.J. Measuring the Ecological Footprint of a Himalayan Tourist Center. Mt. Res. Dev. 2002, 22, 132–141. [Google Scholar] [CrossRef]
  36. Zhou, P.; Liu, G. The change in values for ecological footprint indices following land-use change in a Loess Plateau Watershed in China. Environ. Earth Sci. 2009, 59, 529–536. [Google Scholar] [CrossRef]
  37. Yu, X.; Niu, J.; Xu, J. Effects of closing mountain for forest restoration in the watershed of Miyun reservoir, Beijing. For. Stud. China 2004, 6, 28–35. [Google Scholar] [CrossRef]
  38. Knight, K.W.; Rosa, E.A. Household dynamics and fuelwood consumption in developing countries: A cross-national analysis. Popul. Environ. 2012, 33, 365–378. [Google Scholar] [CrossRef]
  39. Hosier, R.H.; Dowd, J. Household fuel choice in Zimbabwe: An empirical test of the energy ladder hypothesis. Resour. Energy 1987, 9, 347–361. [Google Scholar] [CrossRef]
  40. Rohde, R.F.; Moleele, N.M.; Mphale, M.; Allsopp, N.; Chanda, R.; Hoffman, M.T.; Magole, L.; Young, E. Dynamics of grazing policy and practice: Environmental and social impacts in three communal areas of southern Africa. Environ. Sci. Policy 2006, 9, 302–316. [Google Scholar] [CrossRef]
  41. Arnalds, O.; Barkarson, B.H. Soil erosion and land use policy in Iceland in relation to sheep grazing and government subsidies. Environ. Sci. Policy 2003, 6, 105–113. [Google Scholar] [CrossRef] [Green Version]
  42. Deaton, A.; Paxson, H.C. Patterns of Aging in Thailand and Cote D′Ivoire; University of Chicago Press: Chicago, IL, USA, 1990; Volume 81. [Google Scholar]
  43. Robson, J.P. Exploring some of the myths of land use change: Can rural to urban migration drive declines in biodiversity? Glob. Environ. Chang. 2011, 21, 844–854. [Google Scholar] [CrossRef]
  44. Visvizi, A.; Lytras, M. It′s Not a Fad: Smart Cities and Smart Villages Research in European and Global Contexts. Sustainability 2018, 10, 2727. [Google Scholar] [CrossRef]
Figure 1. Location of the study area and points of households.
Sustainability 10 03741 g001
Figure 2. Changes in population size and ecological footprint (EF) at different elevation grades.
Sustainability 10 03741 g002
Figure 3. Changes in ecological footprint per capita of three land use types. EF_per: ecological footprint per capita.
Sustainability 10 03741 g003
Figure 4. Returning cropland for forest at Nankao Village, Yi County (low-elevation area). Note: This picture was taken by an unmanned aerial vehicle.
Sustainability 10 03741 g004
Figure 5. Fuelwood collected by households at Liujiazhuang Village, Laiyuan County (high-elevation area).
Sustainability 10 03741 g005
Figure 6. Changes in ecological footprint per capita from 2000 to 2016, according to the age structure. Note: G1-G5 represent the share of the working-age population per household, namely G1 (0–25%), G2 (25–50%), G3 (50–75%), G4 (75–100%), and G5 (100%).
Sustainability 10 03741 g006
Figure 7. Ecological footprint per capita of cropland (EFC_per), forestland (EFF_per) and grazing land (EFG_per) in 2000 and 2016, according to the age structure.
Sustainability 10 03741 g007
Table 1. Changes in ecological footprint per capita of cropland (EFC_per), forestland (EFF_per) and grazing land (EFG_per) at different elevation grades.
Types of EF_per (Gha/Cap)EF perEFC_perEFF_perEFG_per
Elevation grade (m)<500500–1000>1000<500500–1000>1000<500500–1000>1000<500500–1000>1000
20000.741.041.310.260.200.320.320.510.660.170.340.33
20160.400.881.130.200.250.460.110.350.400.090.280.26
Change rate (%)−45.9−15.4−13.7−23.125.143.8−65.6−31.4−39.4−47.1−17.6−21.2
Table 2. Population of the five different household groups and the changes in population from 2000 to 2016, according to the age structure.
Group20002016Change Rate (%)
G12778188.9
G2268214−20.1
G3184176−4.3
G4138118−14.5
G5271216−20.3

