Perceptions, Risk Attitude and Organic Fertilizer Investment: Evidence from Rice and Banana Farmers in Guangxi, China


Abstract
:1. Introduction
2. Methods and Data
2.1. Methods
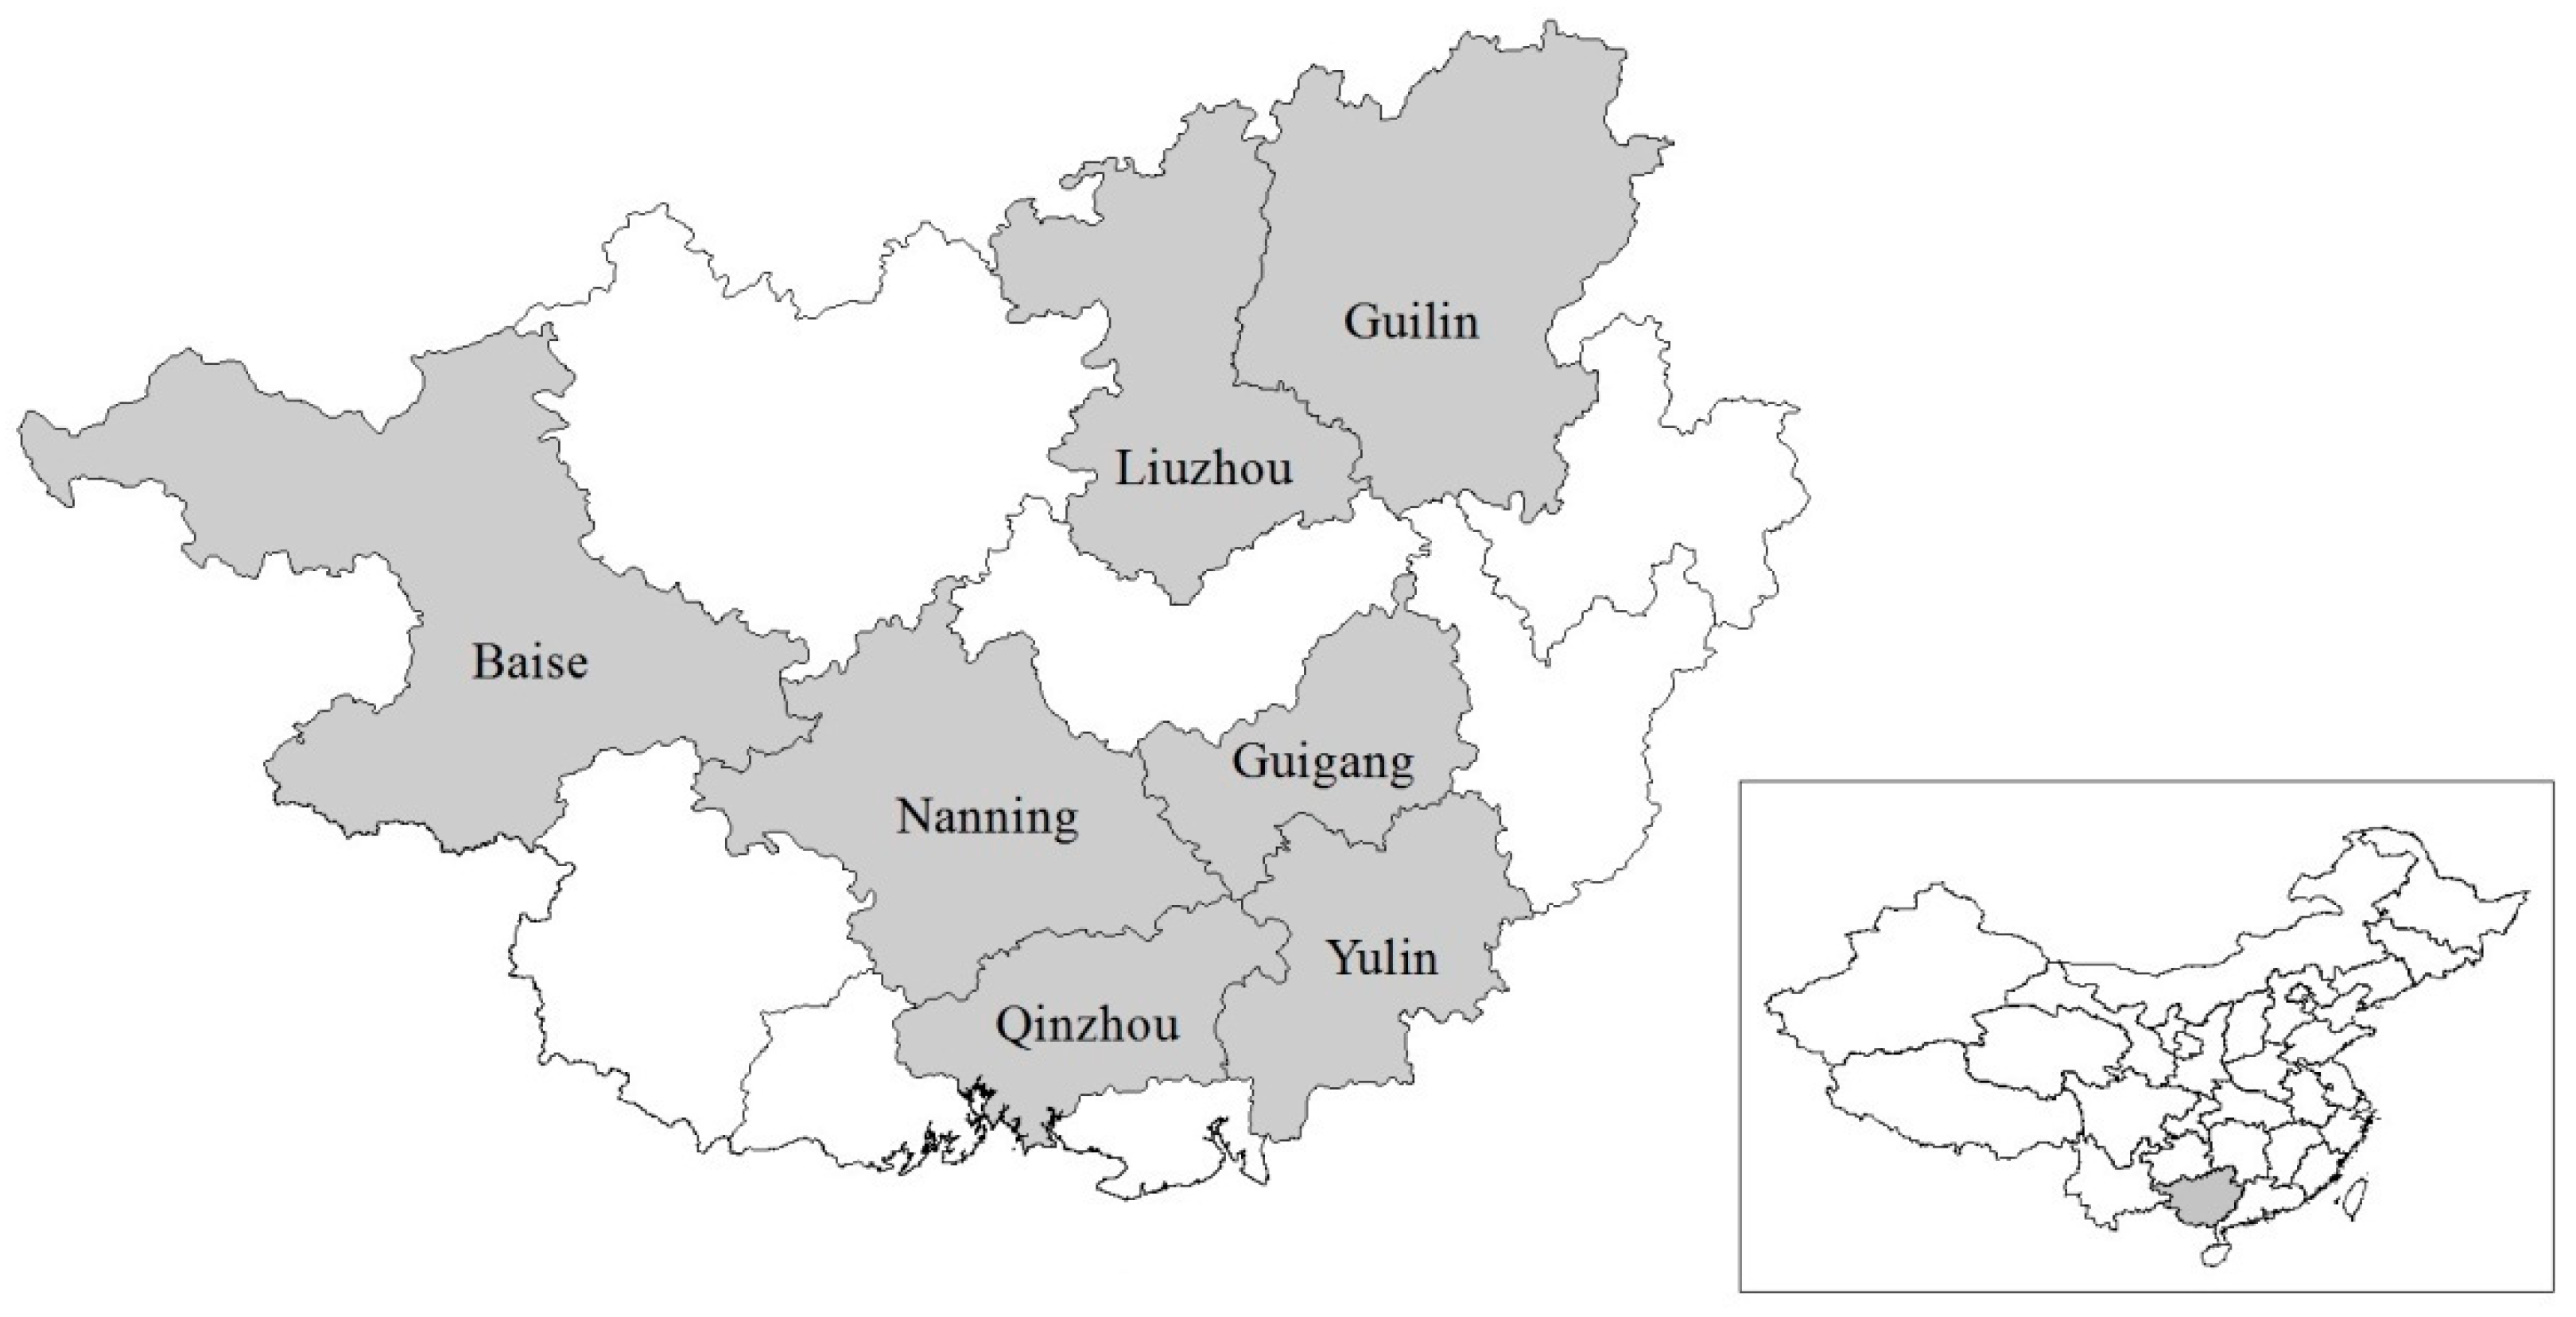
2.2. Survey and Data Description
3. Results
3.1. Determinants of Rice Farmers’ Organic Fertilizer Investment
3.2. Determinants of Banana Farmers’ Organic Fertilizer Investment
3.3. Robustness Check with Double-Hurdle Model
4. Discussion
5. Conclusions
Author Contributions
Funding
Conflicts of Interest
Appendix A. Risk Preference Estimation Using Lottery-Choice Experiment

| Decision | Option A | Option B |
|---|---|---|
| 1 | 10% of 10,000 Yuan, 90% of 8000 Yuan | 10% of 19,000 Yuan, 90% of 1000 Yuan |
| 2 | 20% of 10,000 Yuan, 80% of 8000 Yuan | 20% of 19,000 Yuan, 80% of 1000 Yuan |
| 3 | 30% of 10,000 Yuan, 70% of 8000 Yuan | 30% of 19,000 Yuan, 70% of 1000 Yuan |
| 4 | 40% of 10,000 Yuan, 60% of 8000 Yuan | 40% of 19,000 Yuan, 60% of 1000 Yuan |
| 5 | 50% of 10,000 Yuan, 50% of 8000 Yuan | 50% of 19,000 Yuan, 50% of 1000 Yuan |
| 6 | 60% of 10,000 Yuan, 40% of 8000 Yuan | 60% of 19,000 Yuan, 40% of 1000 Yuan |
| 7 | 70% of 10,000 Yuan, 30% of 8000 Yuan | 70% of 19,000 Yuan, 30% of 1000 Yuan |
| 8 | 80% of 10,000 Yuan, 20% of 8000 Yuan | 80% of 19,000 Yuan, 20% of 1000 Yuan |
| 9 | 90% of 10,000 Yuan, 10% of 8000 Yuan | 90% of 19,000 Yuan, 10% of 1000 Yuan |
| 10 | 100% of 10,000 Yuan, 0% of 8000 Yuan | 100% of 19,000 Yuan, 0% of 1000 Yuan |
| Choices Number | Range of Absolute Risk Aversion | Risk Aversion Class | Rice | Banana | ||
|---|---|---|---|---|---|---|
| Frequency | % | Frequency | % | |||
| 1 | ar < −0.11 | Highly risk loving | 2 | 0.55% | 6 | 2.50% |
| 2 | −0.11 < ar < −0.06 | Very risk loving | 9 | 2.47% | 16 | 6.67% |
| 3 | −0.06 < ar < −0.02 | Risk loving | 23 | 6.30% | 25 | 10.42% |
| 4 | −0.02 < ar < 0.03 | Risk neutral | 29 | 7.95% | 28 | 11.67% |
| 5 | 0.03 < ar < 0.07 | Slightly risk averse | 62 | 16.99% | 47 | 19.58% |
| 6 | 0.07 < ar < 0.11 | Risk averse | 95 | 26.03% | 56 | 23.33% |
| 7 | 0.11 < ar < 0.17 | Very risk averse | 81 | 22.19% | 44 | 18.33% |
| 8 | 0.17 < ar < 0.25 | Highly risk averse | 51 | 13.97% | 14 | 5.83% |
| 9–10 | 0.25 < ar | Stay in bed | 13 | 3.56% | 4 | 1.67% |
| Number of observations | 365 | 100% | 240 | 100% | ||
References
- Zhang, X.; Davidson, E.A.; Mauzerall, D.L.; Searchinger, T.D.; Dumas, P.; Shen, Y. Managing nitrogen for sustainable development. Nature 2015, 528, 51. [Google Scholar] [CrossRef] [PubMed]
- Wu, Y.; Xi, X.; Tang, X.; Luo, D.; Gu, B.; Lam, S.K.; Vitousek, P.M.; Chen, D. Policy distortions, farm size, and the overuse of agricultural chemicals in China. Proc. Natl. Acad. Sci. USA 2018, 7010–7015. [Google Scholar] [CrossRef] [PubMed]
- Yang, Q.; Liu, J.; Zhang, Y. Decoupling agricultural nonpoint source pollution from crop production: A case study of Heilongjiang land reclamation area, China. Sustainability 2017, 9, 1024. [Google Scholar] [CrossRef]
- Xie, H. Towards sustainable land use in China: A collection of empirical studies. Sustainability 2017, 9, 2129. [Google Scholar] [CrossRef]
- Dong, G.; Mao, X.; Zhou, J.; Zeng, A. Carbon footprint accounting and dynamics and the driving forces of agricultural production in Zhejiang Province, China. Ecol. Econ. 2013, 91, 38–47. [Google Scholar] [CrossRef]
- Miao, Y.; Stewart, B.A.; Zhang, F. Long-term experiments for sustainable nutrient management in China. A review. Agron. Sustain. Dev. 2011, 31, 397–414. [Google Scholar] [CrossRef]
- State-Statistical-Bureau. China Statistical Yearbook 2016; Statistical Press of China: Beijing, China, 2016.
- Food and Agriculture Organization (FAO). World Fertilizer Trends and Outlook to 2018; Annual Report 14; Food and Agriculture Organization of the United Nations (FAO): Rome, Italy, 2015; ISBN 978-92-5-108692-6. [Google Scholar]
- Zhang, D.; Wang, H.; Pan, J.; Luo, J.; Liu, J.; Gu, B.; Liu, S.; Zhai, L.; Lindsey, S.; Zhang, Y.; et al. Nitrogen application rates need to be reduced for half of the rice paddy fields in China. Agric. Ecosyst. Environ. 2018, 265, 8–14. [Google Scholar] [CrossRef]
- Li, X.; Gong, Q. Trend and direction of China’s development of regulatory policies preventing over-fertilization in farming. Res. Agric. Mod. 2016, 37, 877–884. (In Chinese) [Google Scholar] [CrossRef]
- Li, Q.; Yang, W.; Li, K. Role of social learning in the diffusion of environmentally-friendly agricultural technology in China. Sustainability 2018, 10, 1527. [Google Scholar] [CrossRef]
- Yang, Z.C.; Zhao, N.; Huang, F.; Lv, Y.Z. Long-term effects of different organic and inorganic fertilizer treatments on soil organic carbon sequestration and crop yields on the north China plain. Soil Tillage Res. 2015, 146, 47–52. [Google Scholar] [CrossRef]
- Ma, W.; Abdulai, A.; Goetz, R. Agricultural cooperatives and investment in organic soil amendments and chemical fertilizer in China. Am. J. Agric. Econ. 2017. [Google Scholar] [CrossRef]
- Wang, H.; Hu, R.; Chen, X.; Zhong, X.; Zheng, Z.; Huang, N.; Xue, C. Reduction in nitrogen fertilizer use results in increased rice yields and improved environmental protection. Int. J. Agric. Sustain. 2017, 15, 681–692. [Google Scholar] [CrossRef]
- Xu, H.; Huang, X.; Zhong, T.; Chen, Z.; Yu, J. Chinese land policies and farmers’ adoption of organic fertilizer for saline soils. Land Use Policy 2014, 38, 541–549. [Google Scholar] [CrossRef]
- Holden, S.T.; Deininger, K.; Ghebru, H. Impacts of low-cost land certification on investment and productivity. Am. J. Agric. Econ. 2009, 91, 359–373. [Google Scholar] [CrossRef]
- Quynh, H.; Kazuto, S. “Organic fertilizers” in Vietnam’s markets: Nutrient composition and efficacy of their application. Sustainability 2018, 10, 2437. [Google Scholar] [CrossRef]
- Huang, J.; Huang, Z.; Jia, X.; Hu, R.; Xiang, C. Long-term reduction of nitrogen fertilizer use through knowledge training in rice production in China. Agric. Syst. 2015, 135, 105–111. [Google Scholar] [CrossRef] [Green Version]
- Wang, Y.; Zhu, Y.; Zhang, S.; Wang, Y. What could promote farmers to replace chemical fertilizers with organic fertilizers? J. Clean. Prod. 2018, 199, 882–890. [Google Scholar] [CrossRef]
- Ministry-Of-Agriculture. National Agricultural Sustainable Development Plan of China (2015–2030); Ministry-Of-Agriculture: Beijing, China, 2015.
- Rakhshanda, K.; Awudu, A. Off-farm work, land tenancy contracts and investment in soil conservation measures in rural Pakistan. Aust. J. Agric. Resour. Econ. 2016, 60, 307–325. [Google Scholar] [CrossRef]
- Yusuf, M.; Mustafa, F.; Salleh, K. Farmer perception of soil erosion and investment in soil conservation measures: Emerging evidence from northern taraba state, Nigeria. Soil Use Manag. 2017, 33, 163–173. [Google Scholar] [CrossRef]
- Hasler, K.; Olfs, H.-W.; Omta, O.; Bröring, S. Drivers for the adoption of eco-innovations in the German fertilizer supply chain. Sustainability 2016, 8, 682. [Google Scholar] [CrossRef]
- Bai, Y.; Kung, J.; Zhao, Y. How much expropriation hazard is too much? The effect of land reallocation on organic fertilizer usage in rural China. Land Econ. 2014, 90, 434–457. [Google Scholar] [CrossRef]
- Jacoby, H.G.; Li, G.; Rozelle, S. Hazards of expropriation: Tenure insecurity and investment in rural China. Am. Econ. Rev. 2002, 92, 1420–1447. [Google Scholar] [CrossRef]
- Abdulai, A.; Owusu, V.; Goetz, R. Land tenure differences and investment in land improvement measures: Theoretical and empirical analyses. J. Dev. Econ. 2011, 96, 66–78. [Google Scholar] [CrossRef]
- Li, G.; Rozelle, S.; Brandt, L. Tenure, land rights, and farmer investment incentives in China. Agric. Econ. 1998, 19, 63–71. [Google Scholar] [CrossRef]
- Arcand, J.-L.; Ai, C.; Éthier, F. Moral hazard and marshallian inefficiency: Evidence from Tunisia. J. Dev. Econ. 2007, 83, 411–445. [Google Scholar] [CrossRef]
- Gao, L.; Huang, J.; Rozelle, S. Rental markets for cultivated land and agricultural investments in China. Agric. Econ. 2012, 43, 391–403. [Google Scholar] [CrossRef]
- Case, S.; Oelofse, M.; Hou, Y.; Oenema, O.; Jensen, L.S. Farmer perceptions and use of organic waste products as fertilisers—A survey study of potential benefits and barriers. Agric. Syst. 2017, 151, 84–95. [Google Scholar] [CrossRef]
- Adimassu, Z.; Kessler, A.; Yirga, C.; Stroosnijder, L. Farmers’ perceptions of land degradation and their investments in land management: A case study in the central rift valley of Ethiopia. Environ. Manag. 2013, 51, 989–998. [Google Scholar] [CrossRef] [PubMed]
- Hou, Y.; Velthof, G.L.; Case, S.D.C.; Oelofse, M.; Grignani, C.; Balsari, P.; Zavattaro, L.; Gioelli, F.; Bernal, M.P.; Fangueiro, D.; et al. Stakeholder perceptions of manure treatment technologies in Denmark, Italy, The Netherlands and Spain. J. Clean. Prod. 2018, 172, 1620–1630. [Google Scholar] [CrossRef]
- Binswanger, H.P. Attitudes toward risk: Experimental measurement in rural India. Am. J. Agric. Econ. 1980, 62, 395–407. [Google Scholar] [CrossRef]
- Holt, C.A.; Laury, S.K. Risk aversion and incentive effects. Am. Econ. Rev. 2002, 92, 1644–1655. [Google Scholar] [CrossRef]
- Yesuf, M.; Bluffstone, R.A. Poverty, risk aversion, and path dependence in low-income countries: Experimental evidence from Ethiopia. Am. J. Agric. Econ. 2009, 91, 1022–1037. [Google Scholar] [CrossRef]
- Monjardino, M.; McBeath, T.; Ouzman, J.; Llewellyn, R.; Jones, B. Farmer risk-aversion limits closure of yield and profit gaps: A study of nitrogen management in the southern Australian wheatbelt. Agric. Syst. 2015, 137, 108–118. [Google Scholar] [CrossRef]
- Wossen, T.; Berger, T.; Di Falco, S. Social capital, risk preference and adoption of improved farm land management practices in Ethiopia. Agric. Econ. 2015, 46, 81–97. [Google Scholar] [CrossRef]
- Nielsen, T.; Keil, A.; Zeller, M. Assessing farmers’ risk preferences and their determinants in a marginal upland area of Vietnam: A comparison of multiple elicitation techniques. Agric. Econ. 2013, 44, 255–273. [Google Scholar] [CrossRef]
- Isik, M. Resource management under production and output price uncertainty: Implications for environmental policy. Am. J. Agric. Econ. 2002, 84, 557–571. [Google Scholar] [CrossRef]
- Simtowe, F.; Mduma, J.; Phiri, A.; Thomas, A.; Zeller, M. Can risk-aversion towards fertilizer explain part of the non-adoption puzzle for hybrid maize? Empirical evidence from Malawi. J. Appl. Sci. 2006, 6, 1490–1498. [Google Scholar]
- Ramaswami, B. Production risk and optimal input decisions. Am. J. Agric. Econ. 1992, 74, 860–869. [Google Scholar] [CrossRef]
- Groom, B.; Koundouri, P.; Nauges, C.; Thomas, A. The story of the moment: Risk averse cypriot farmers respond to drought management. Appl. Econ. 2008, 40, 315–326. [Google Scholar] [CrossRef]
- Lamb, R.L. Fertilizer use, risk, and off-farm labor markets in the semi-arid tropics of India. Am. J. Agric. Econ. 2003, 85, 359–371. [Google Scholar] [CrossRef]
- Isik, M.; Khanna, M. Stochastic technology, risk preferences, and adoption of site-specific technologies. Am. J. Agric. Econ. 2003, 85, 305–317. [Google Scholar] [CrossRef]
- Bureau-Of-Guangxi-Statistical. Guangxi Statistical Yearbook; Statistical Press of China: Beijing, China, 2017.
- Cragg, J.G. Some statistical models for limited dependent variables with application to the demand for durable goods. Econom. J. Econom. Soc. 1971, 39, 829–844. [Google Scholar] [CrossRef]
- Binswanger, H.P.; Sillers, D.A. Risk aversion and credit constraints in farmers’ decision-making: A reinterpretation. J. Dev. Stud. 1983, 20, 5–21. [Google Scholar] [CrossRef]
- Lusk, J.L.; Coble, K.H. Risk perceptions, risk preference, and acceptance of risky food. Am. J. Agric. Econ. 2005, 87, 393–405. [Google Scholar] [CrossRef]
- Zhao, J.; Ni, T.; Li, J.; Lu, Q.; Fang, Z.; Huang, Q.; Zhang, R.; Li, R.; Shen, B.; Shen, Q. Effects of organic–inorganic compound fertilizer with reduced chemical fertilizer application on crop yields, soil biological activity and bacterial community structure in a rice–wheat cropping system. Appl. Soil Ecol. 2016, 99, 1–12. [Google Scholar] [CrossRef]
- Evanylo, G.; Sherony, C.; Spargo, J.; Starner, D.; Brosius, M.; Haering, K. Soil and water environmental effects of fertilizer-, manure-, and compost-based fertility practices in an organic vegetable cropping system. Agric. Ecosyst. Environ. 2008, 127, 50–58. [Google Scholar] [CrossRef]
- Lahav, E. Effect of different amounts of potassium on growth of the banana. Trop. Agric. 1972, 49, 321–335. [Google Scholar]
- Bezabih, M.; Sarr, M. Risk preferences and environmental uncertainty: Implications for crop diversification decisions in Ethiopia. Environ. Resour. Econ. 2012, 53, 483–505. [Google Scholar] [CrossRef]

| Variables | Definition | Mean (SD) | |
|---|---|---|---|
| Rice | Banana | ||
| Investment variables | |||
| Organic fert. adoption | 1 if farmer use organic fertilizer, 0 otherwise | 0.41 (0.49) | 0.61 (0.48) |
| Organic fert. investment | Expenditure on organic fertilizer (USD/ha) 1 | 64.02 (80.94) | 1103 (978.3) |
| Chem. fert. adoption | 1 if farmer use chemical fertilizer, 0 otherwise | 1.00 (0.00) | 1.00 (0.00) |
| Chem. fert. investment | Expenditure on chemical fertilizer (USD/ha) | 283.1 (59.91) | 2059 (418.9) |
| Farmers’ perceptions toward organic fertilizer (5-point scale: 1 = strongly disagree; 5 = strongly agree) | |||
| Environ. friendliness | Organic fertilizer is friendly to environment | 3.45 (1.07) | 3.54 (0.86) |
| Soil-improving | Using organic fertilizer can improve soil | 3.49 (0.97) | 3.65 (0.94) |
| Yield-increasing | Using organic fertilizer can increase yield | 2.59 (1.12) | 3.31 (1.13) |
| Quality-improving | Using organic fertilizer can increase quality | 2.67 (0.89) | 3.55 (1.05) |
| Cost-increasing | The use cost of organic fertilizer is high | 3.76 (0.91) | 3.53 (0.87) |
| Slow effect | The effect of organic fertilization is slow | 3.92 (1.10) | 3.57 (1.01) |
| Farmers’ risk preference | |||
| Risk aversion | Risk aversion coefficient estimated by experiment | 0.11 (0.10) | 0.06 (0.10) |
| Household-level and farm-level characteristics | |||
| Age | Age of household head (years) | 48.78 (8.83) | 48.10 (9.29) |
| Gender | Gender of household head (1 = male; 0 = female) | 0.91 (0.28) | 0.86 (0.35) |
| Education | Education of household head (years) | 7.77 (2.59) | 8.05 (2.39) |
| Household size | Number of household members | 4.39 (1.08) | 4.57 (1.24) |
| Farm size | Total farm size of rice/banana (ha) | 2.13 (3.28) | 5.89 (8.85) |
| Asset | 1 if rice farmer owns rotary cultivator or banana farmer owns four-wheel steering agricultural vehicles, 0 otherwise | 0.37 (0.48) | 0.48 (0.50) |
| Soil fertility | Farmers’ self-report about farm soil fertility (5-point scale: 1 = worst; 5 = best) | 3.29 (1.11) | 2.66 (1.00) |
| Tenure security | 1 if farmer perceives that land user rights will not change within next five years; 0 otherwise | 0.69 (0.45) | 0.62 (0.48) |
| Membership | 1 if farmer is a cooperative member, 0 otherwise | 0.32 (0.46) | 0.38 (0.48) |
| Training | 1 if farmer had received training in fertilization techniques, 0 otherwise | 0.38 (0.48) | 0.40 (0.49) |
| Distance to farm | Farmers’ self-reported distance between farm and home (1 = close; 2 = fair; 3 = far) | 2.03 (0.82) | 2.16 (0.80) |
| Variables | Rice | Banana | ||
|---|---|---|---|---|
| Adopter (n = 151) | Non-Adopter (n = 214) | Adopter (n = 146) | Non-Adopter (n = 94) | |
| Organic fert. investment | 154.7 (42.05) | 0.00 ** (0.00) | 1813 (530.1) | 0.00 ** (0.00) |
| Chem. fert. investment | 218.4 (25.14) | 328.7 ** (25.05) | 1878 (358.9) | 2340 ** (344.9) |
| Environ. friendliness | 3.64 (1.00) | 3.33 ** (1.09) | 3.69 (0.89) | 3.28 ** (0.76) |
| Soil-improving | 3.59 (0.98) | 3.41 (0.96) | 3.92 (0.73) | 3.21 ** (1.06) |
| Yield-increasing | 3.44 (0.99) | 1.99 ** (0.78) | 3.82 (0.98) | 2.52 ** (0.86) |
| Quality-improving | 3.25 (0.72) | 2.25 ** (0.76) | 4.15 (0.73) | 2.62 ** (0.75) |
| Cost-increasing | 3.24 (0.81) | 4.12 ** (0.78) | 3.08 (0.66) | 4.20 ** (0.73) |
| Slow effect | 3.96 (1.06) | 3.89 (1.14) | 3.61 (0.99) | 3.50 (1.04) |
| Risk aversion | 0.17 (0.12) | 0.06 ** (0.07) | 0.11 (0.08) | −0.01 ** (0.07) |
| Age | 49.22 (8.91) | 48.47 (8.78) | 46.81 (9.47) | 50.11 ** (8.67) |
| Gender | 0.88 (0.32) | 0.93 (0.25) | 0.84 (0.37) | 0.89 (0.31) |
| Education | 8.27 (2.56) | 7.42 ** (2.55) | 8.96 (2.33) | 6.63 ** (1.69) |
| Household size | 4.43 (1.14) | 4.37 (1.04) | 4.63 (1.32) | 4.49 (1.10) |
| Farm size | 1.64 (3.92) | 2.48 ** (2.69) | 7.45 (9.86) | 3.49 ** (6.35) |
| Asset | 0.51 (0.50) | 0.27 ** (0.45) | 0.61 (0.49) | 0.29 ** (0.45) |
| Soil fertility | 2.53 (0.89) | 3.82 ** (0.92) | 2.29 (0.89) | 3.23 ** (0.88) |
| Tenure security | 0.91 (0.28) | 0.55 ** (0.49) | 0.85 (0.35) | 0.27 ** (0.44) |
| Membership | 0.53 (0.50) | 0.17 ** (0.38) | 0.55 (0.49) | 0.12 ** (0.32) |
| Training | 0.60 (0.49) | 0.22 ** (0.42) | 0.53 (0.50) | 0.19 ** (0.39) |
| Distance to farm | 2.14 (0.81) | 1.95 * (0.82) | 2.13 (0.83) | 2.21 (0.76) |
| Variables | Rice (n = 365) | Banana (n = 240) | ||
|---|---|---|---|---|
| Organic (Tobit Model) | Chemical (OLS Model) | Organic (Tobit Model) | Chemical (OLS Model) | |
| Environ. friendliness | 3.657 (3.867) | 0.197 (1.643) | −3.353 (40.22) | −4.633 (22.59) |
| Soil-improving | 4.265 (4.216) | 0.192 (1.847) | 114.6 *** (44.20) | −58.60 *** (21.52) |
| Yield-increasing | 30.54 *** (5.337) | −15.55 *** (2.171) | 200.9 *** (40.34) | −57.30 *** (21.39) |
| Quality-improving | 39.43 *** (5.417) | −26.14 *** (2.345) | 368.3 *** (49.72) | −101.4 *** (25.50) |
| Cost-increasing | −13.61 ** (5.679) | 8.119 *** (2.356) | −240.8 *** (50.09) | 59.98 ** (26.75) |
| Slow effect | 3.266 (3.612) | −1.372 (1.564) | 65.28 * (34.68) | −31.58 * (18.64) |
| Risk aversion | 109.9 ** (45.90) | −73.14 *** (22.00) | 1625 *** (449.5) | 1228 *** (253.1) |
| Age | 0.277 (0.472) | −0.147 (0.202) | 2.768 (3.910) | −10.43 *** (2.232) |
| Gender | −11.41 (13.26) | 6.293 (6.175) | −119.2 (95.23) | 31.24 (54.23) |
| Education | 7.821 *** (1.684) | −2.590 *** (0.684) | 45.96 ** (18.35) | −47.11 *** (10.33) |
| Household size | −11.91 *** (3.958) | 1.864 (1.644) | −6.056 (27.34) | −6.451 (15.34) |
| Farm size | 2.891 ** (1.214) | −1.743 *** (0.613) | 0.953 (4.083) | 0.682 (2.442) |
| Asset | 5.316 (8.791) | −4.915 (3.917) | 78.59 (78.16) | 12.91 (43.04) |
| Soil fertility | −35.29 *** (5.023) | −1.534 (2.121) | −133.9 ** (52.73) | 13.98 (27.22) |
| Tenure security | 33.34 *** (11.29) | −13.51 *** (4.123) | 506.8 *** (85.30) | −89.79 ** (45.12) |
| Membership | 9.330 (9.091) | −7.587 * (4.205) | 132.9 (88.66) | −128.2 ** (51.60) |
| Training | 24.11 *** (8.709) | −12.78 *** (3.952) | 127.2 * (75.63) | −79.39 * (42.74) |
| Distance to farm | 2.045 (4.909) | −1.444 (2.142) | −23.17 (42.42) | −19.21 (23.64) |
| LR χ2 | 449.9 *** (0.00) | 431.3 *** (0.00) | ||
| F value | 49.74 *** (0.00) | 16.68 *** (0.00) | ||
| Variables | Rice (n = 365) | Banana (n = 240) | ||
|---|---|---|---|---|
| Decision Model | Investment Model | Decision Model | Investment Model | |
| Environ. friendliness | −0.011 (0.116) | 1.339 (1.161) | 0.298 (0.256) | 3.840 (18.18) |
| Soil-improving | 0.102 (0.134) | 1.181 (1.246) | 0.139 (0.209) | 50.56 ** (22.84) |
| Yield-increasing | 0.812 *** (0.193) | 12.51 *** (1.741) | 0.542 ** (0.224) | 75.13 *** (20.17) |
| Quality-improving | 1.205 *** (0.205) | 0.188 (1.743) | 1.200 *** (0.322) | 81.15 *** (25.65) |
| Cost-increasing | −0.489 *** (0.190) | −12.67 *** (1.887) | −0.757 *** (0.285) | −32.75 (24.94) |
| Slow effect | 0.122 (0.113) | −0.136 (1.072) | 0.183 (0.190) | 19.59 (16.52) |
| Risk aversion | 4.144 ** (1.941) | 59.12 *** (12.03) | 5.869 ** (2.816) | 1165 *** (199.7) |
| Age | 0.012 (0.014) | −0.058 (0.141) | 0.011 (0.024) | 2.456 (1.766) |
| Gender | −0.536 (0.423) | −0.995 (3.686) | −0.019 (0.470) | −9.869 (44.46) |
| Education | 0.178 *** (0.051) | 0.582 (0.523) | 0.125 (0.154) | 49.56 *** (8.379) |
| Household size | −0.174 (0.126) | 2.131 * (1.157) | −0.046 (0.141) | −0.677 (12.39) |
| Farm size | 0.083 *** (0.032) | −0.624 ** (0.330) | −0.006 (0.028) | −2.086 (1.755) |
| Asset | 0.078 (0.257) | 8.273 *** (2.532) | 0.629 (0.542) | 13.06 (35.43) |
| Soil fertility | −0.901 *** (0.158) | −10.478 *** (1.752) | −0.012 (0.282) | −225.1 *** (27.43) |
| Tenure security | 0.243 (0.268) | 4.661 (4.494) | 1.654 *** (0.443) | 41.82 (45.49) |
| Membership | 0.127 (0.294) | 7.860 *** (2.570) | −0.332 (0.607) | 163.4 *** (40.29) |
| Training | 0.523 ** (0.258) | 7.025 *** (2.565) | 0.421 (0.447) | 95.71 *** (33.84) |
| Distance to farm | 0.045 (0.147) | 0.685 (1.422) | −0.269 (0.227) | 20.14 (19.34) |
| Wald χ2 | 78.52 *** (0.000) | 39.91 *** (0.002) | ||
| Log likelihood | −682.4 | −885.2 | ||
© 2018 by the authors. Licensee MDPI, Basel, Switzerland. This article is an open access article distributed under the terms and conditions of the Creative Commons Attribution (CC BY) license (http://creativecommons.org/licenses/by/4.0/).
Share and Cite
Chen, X.; Zeng, D.; Xu, Y.; Fan, X. Perceptions, Risk Attitude and Organic Fertilizer Investment: Evidence from Rice and Banana Farmers in Guangxi, China. Sustainability 2018, 10, 3715. https://doi.org/10.3390/su10103715
Chen X, Zeng D, Xu Y, Fan X. Perceptions, Risk Attitude and Organic Fertilizer Investment: Evidence from Rice and Banana Farmers in Guangxi, China. Sustainability. 2018; 10(10):3715. https://doi.org/10.3390/su10103715
Chicago/Turabian StyleChen, Xinjian, Di Zeng, Ying Xu, and Xiaojun Fan. 2018. "Perceptions, Risk Attitude and Organic Fertilizer Investment: Evidence from Rice and Banana Farmers in Guangxi, China" Sustainability 10, no. 10: 3715. https://doi.org/10.3390/su10103715
APA StyleChen, X., Zeng, D., Xu, Y., & Fan, X. (2018). Perceptions, Risk Attitude and Organic Fertilizer Investment: Evidence from Rice and Banana Farmers in Guangxi, China. Sustainability, 10(10), 3715. https://doi.org/10.3390/su10103715