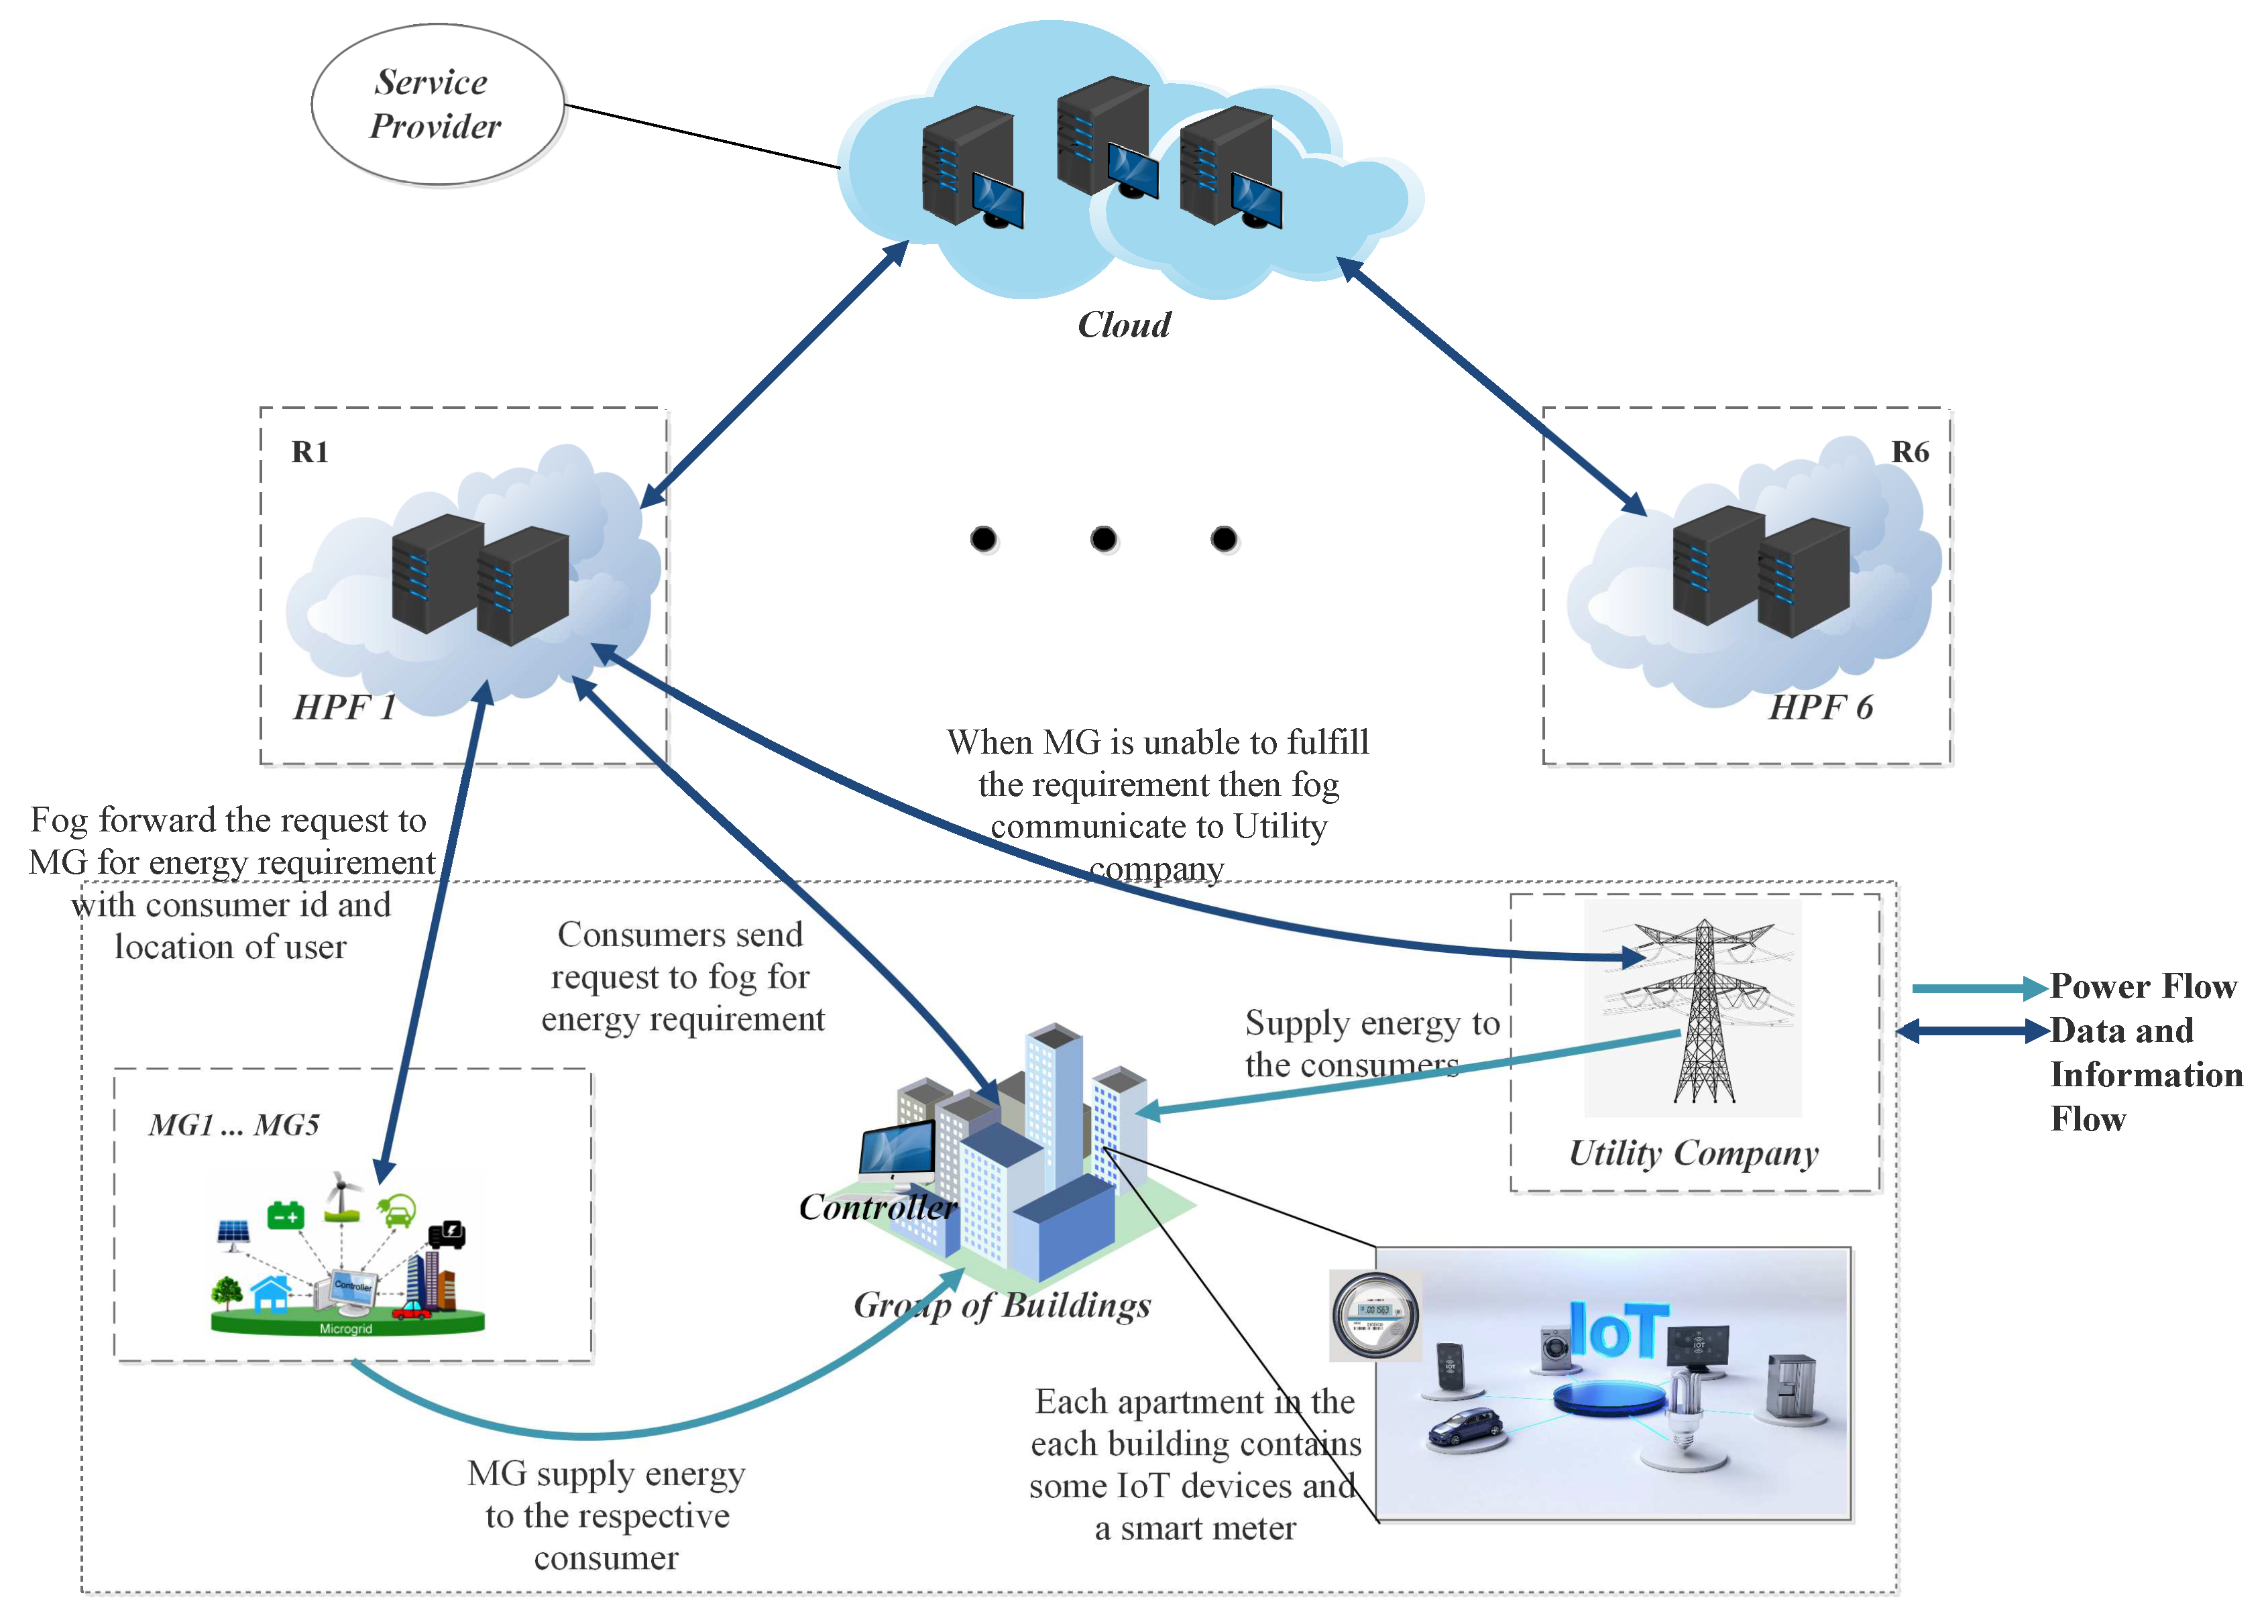
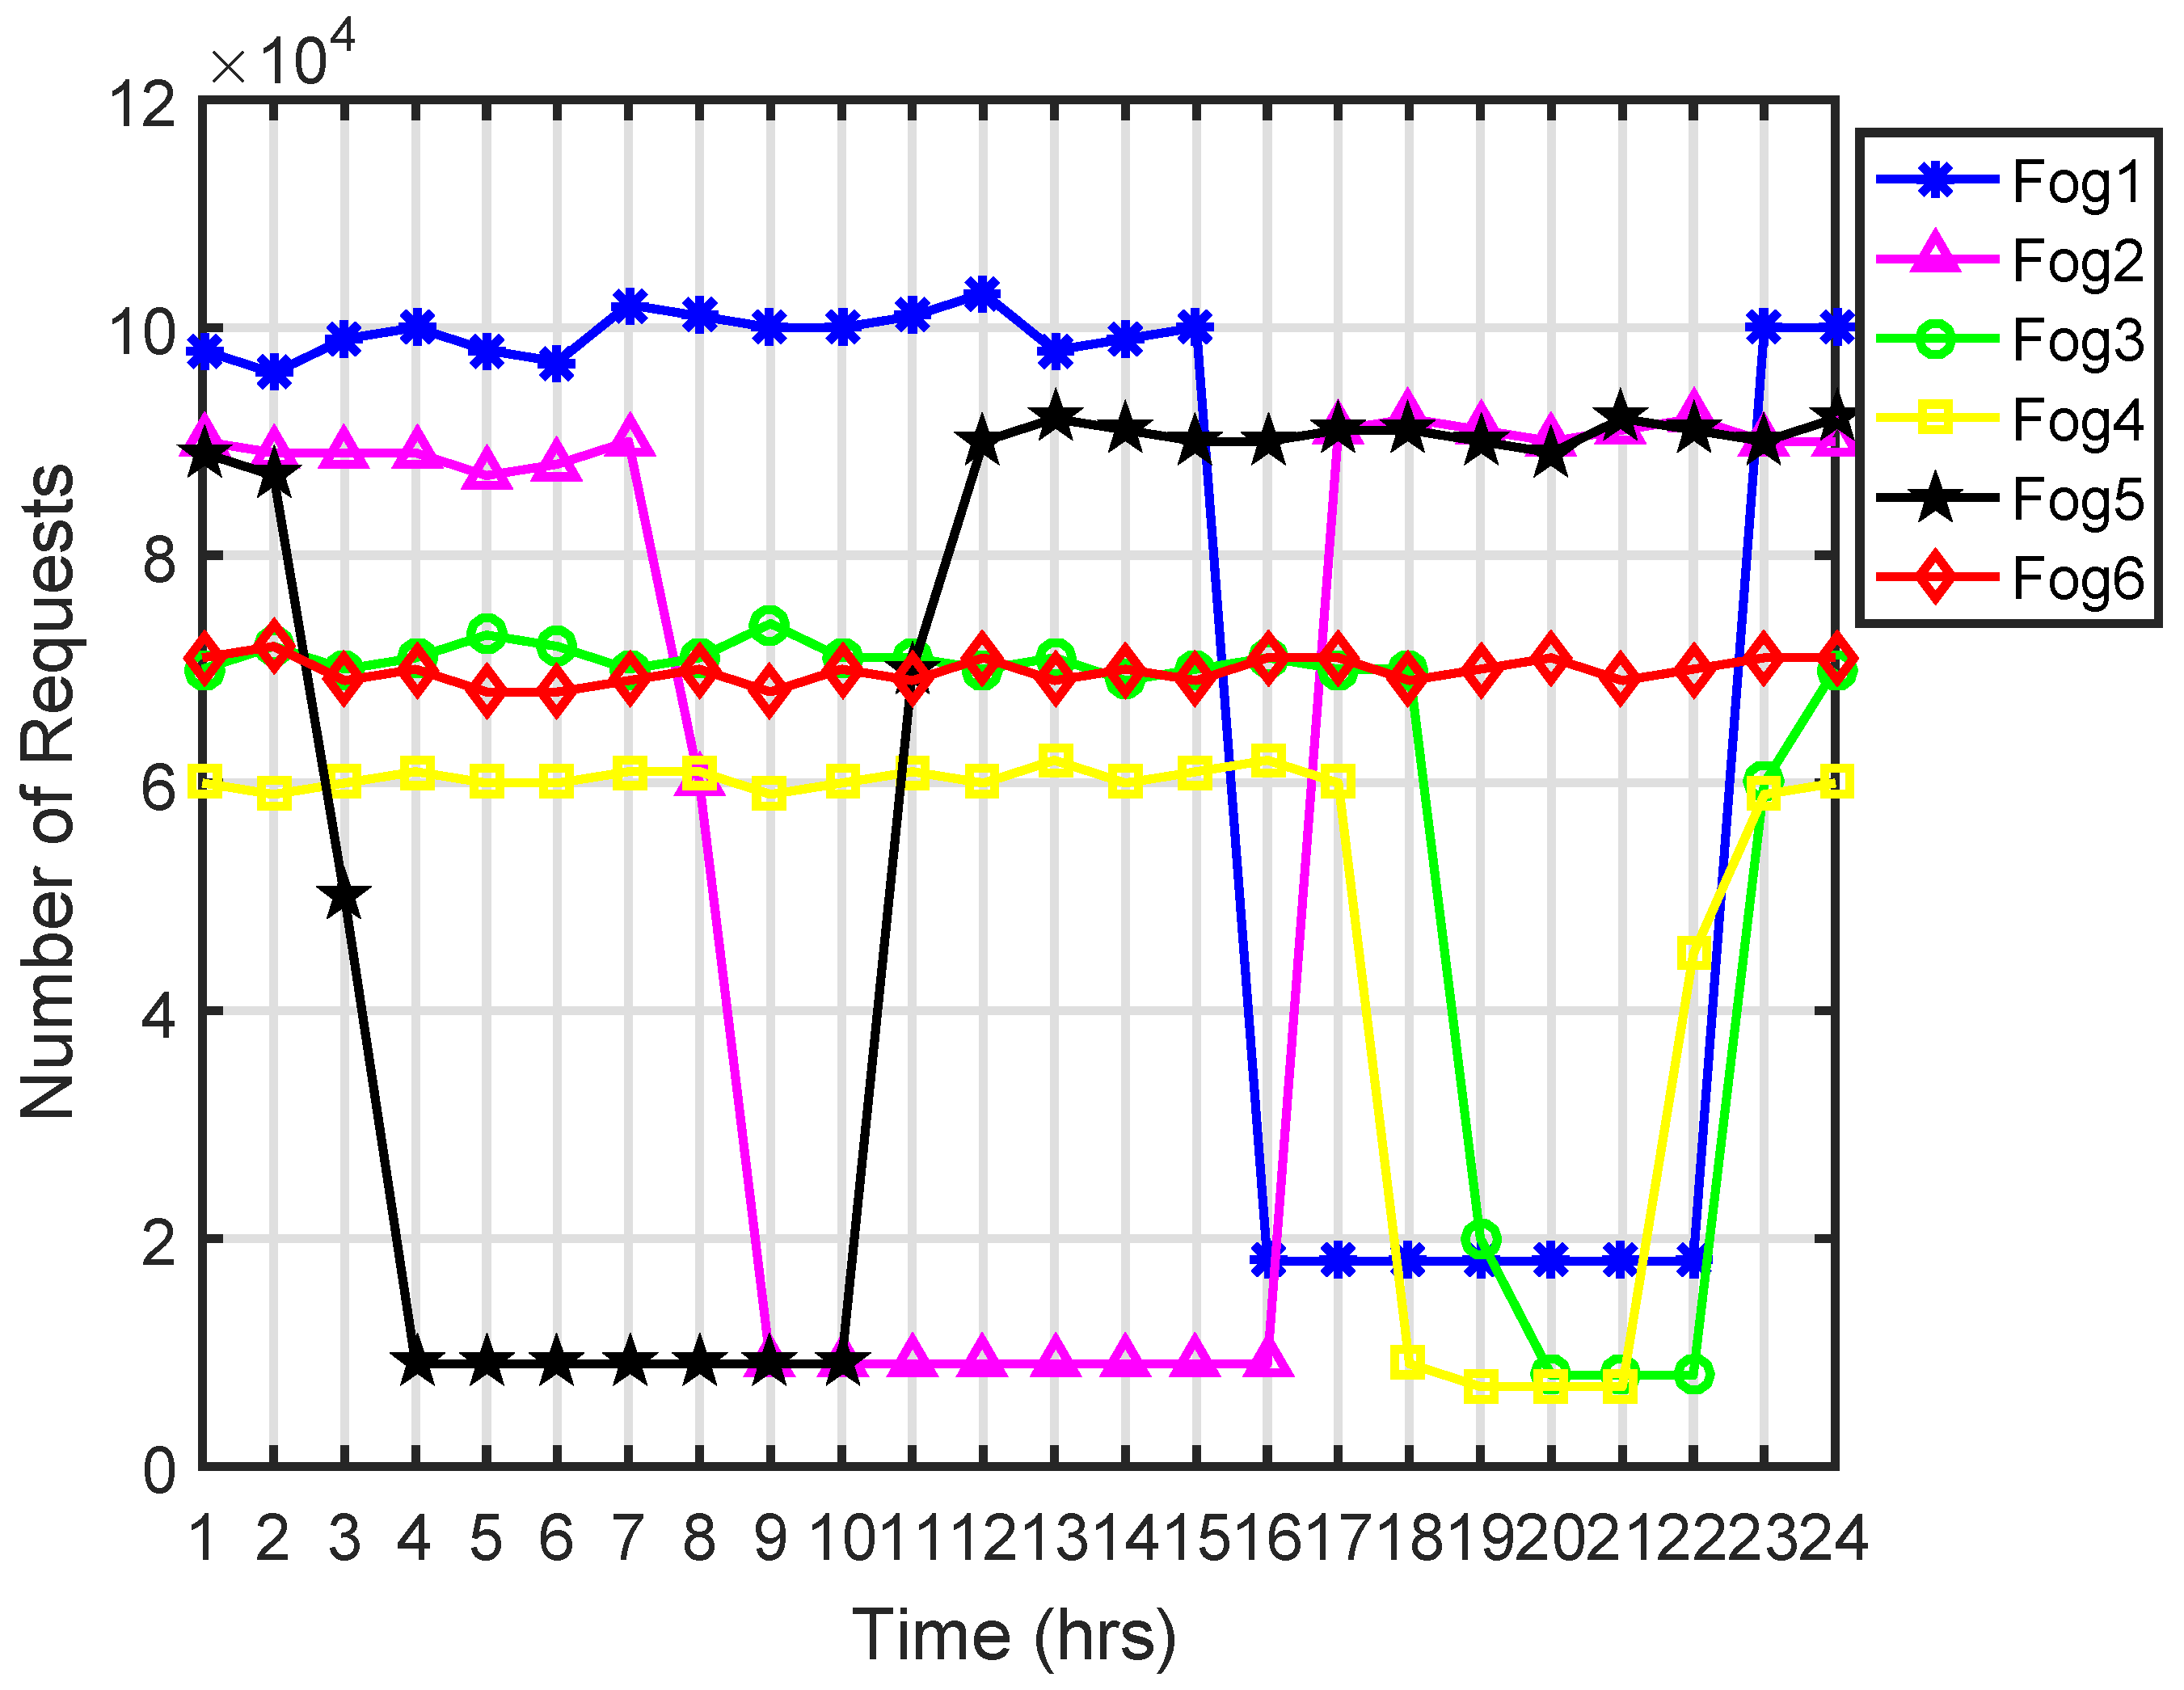
In this paper, ORTP selects the potential HPF or data center. Requests are assigned to VMs using FCFS and ACO algorithms. Three scenarios with 25, 50 and 100 VMs on the HPFs are considered. Every hour, a huge number of requests arrive at HPF, as shown in
Figure 2, which are allocated to VMs using FCFS and ACO. Each scenario is also implemented with the cloud-based centralized system. In the system, we consider all groups of buildings are connected with the cloud which has an equivalent number of requests and resources, as the sum of all HPFs.
5.1. Scenario 1
In the scenario, there are 25 VMs on HPFs with a group of buildings generating requests and send to HPFs every hour, as shown in
Figure 2. The requests are allocated on VMs using ACO and FCFS load balancing algorithms. The RT of the requests is measured in milliseconds for each group of buildings and their average, minimum and maximum RT is given in
Table 4 using the ACO algorithm.
The PT of each HPF with the given scenario using ACO algorithm is given in
Table 5. Average, minimum and maximum PT with 25 VMs of each HPF are also given in the table.
Similarly, for the same number of requests, the RT for each group of buildings has an average, minimum and maximum are given in
Table 6 using the FCFS algorithm.
The PT of each HPF for the requests of buildings generated in a day, allocated to VMs using FCFS, are given in
Table 7 with average minimum and maximum time.
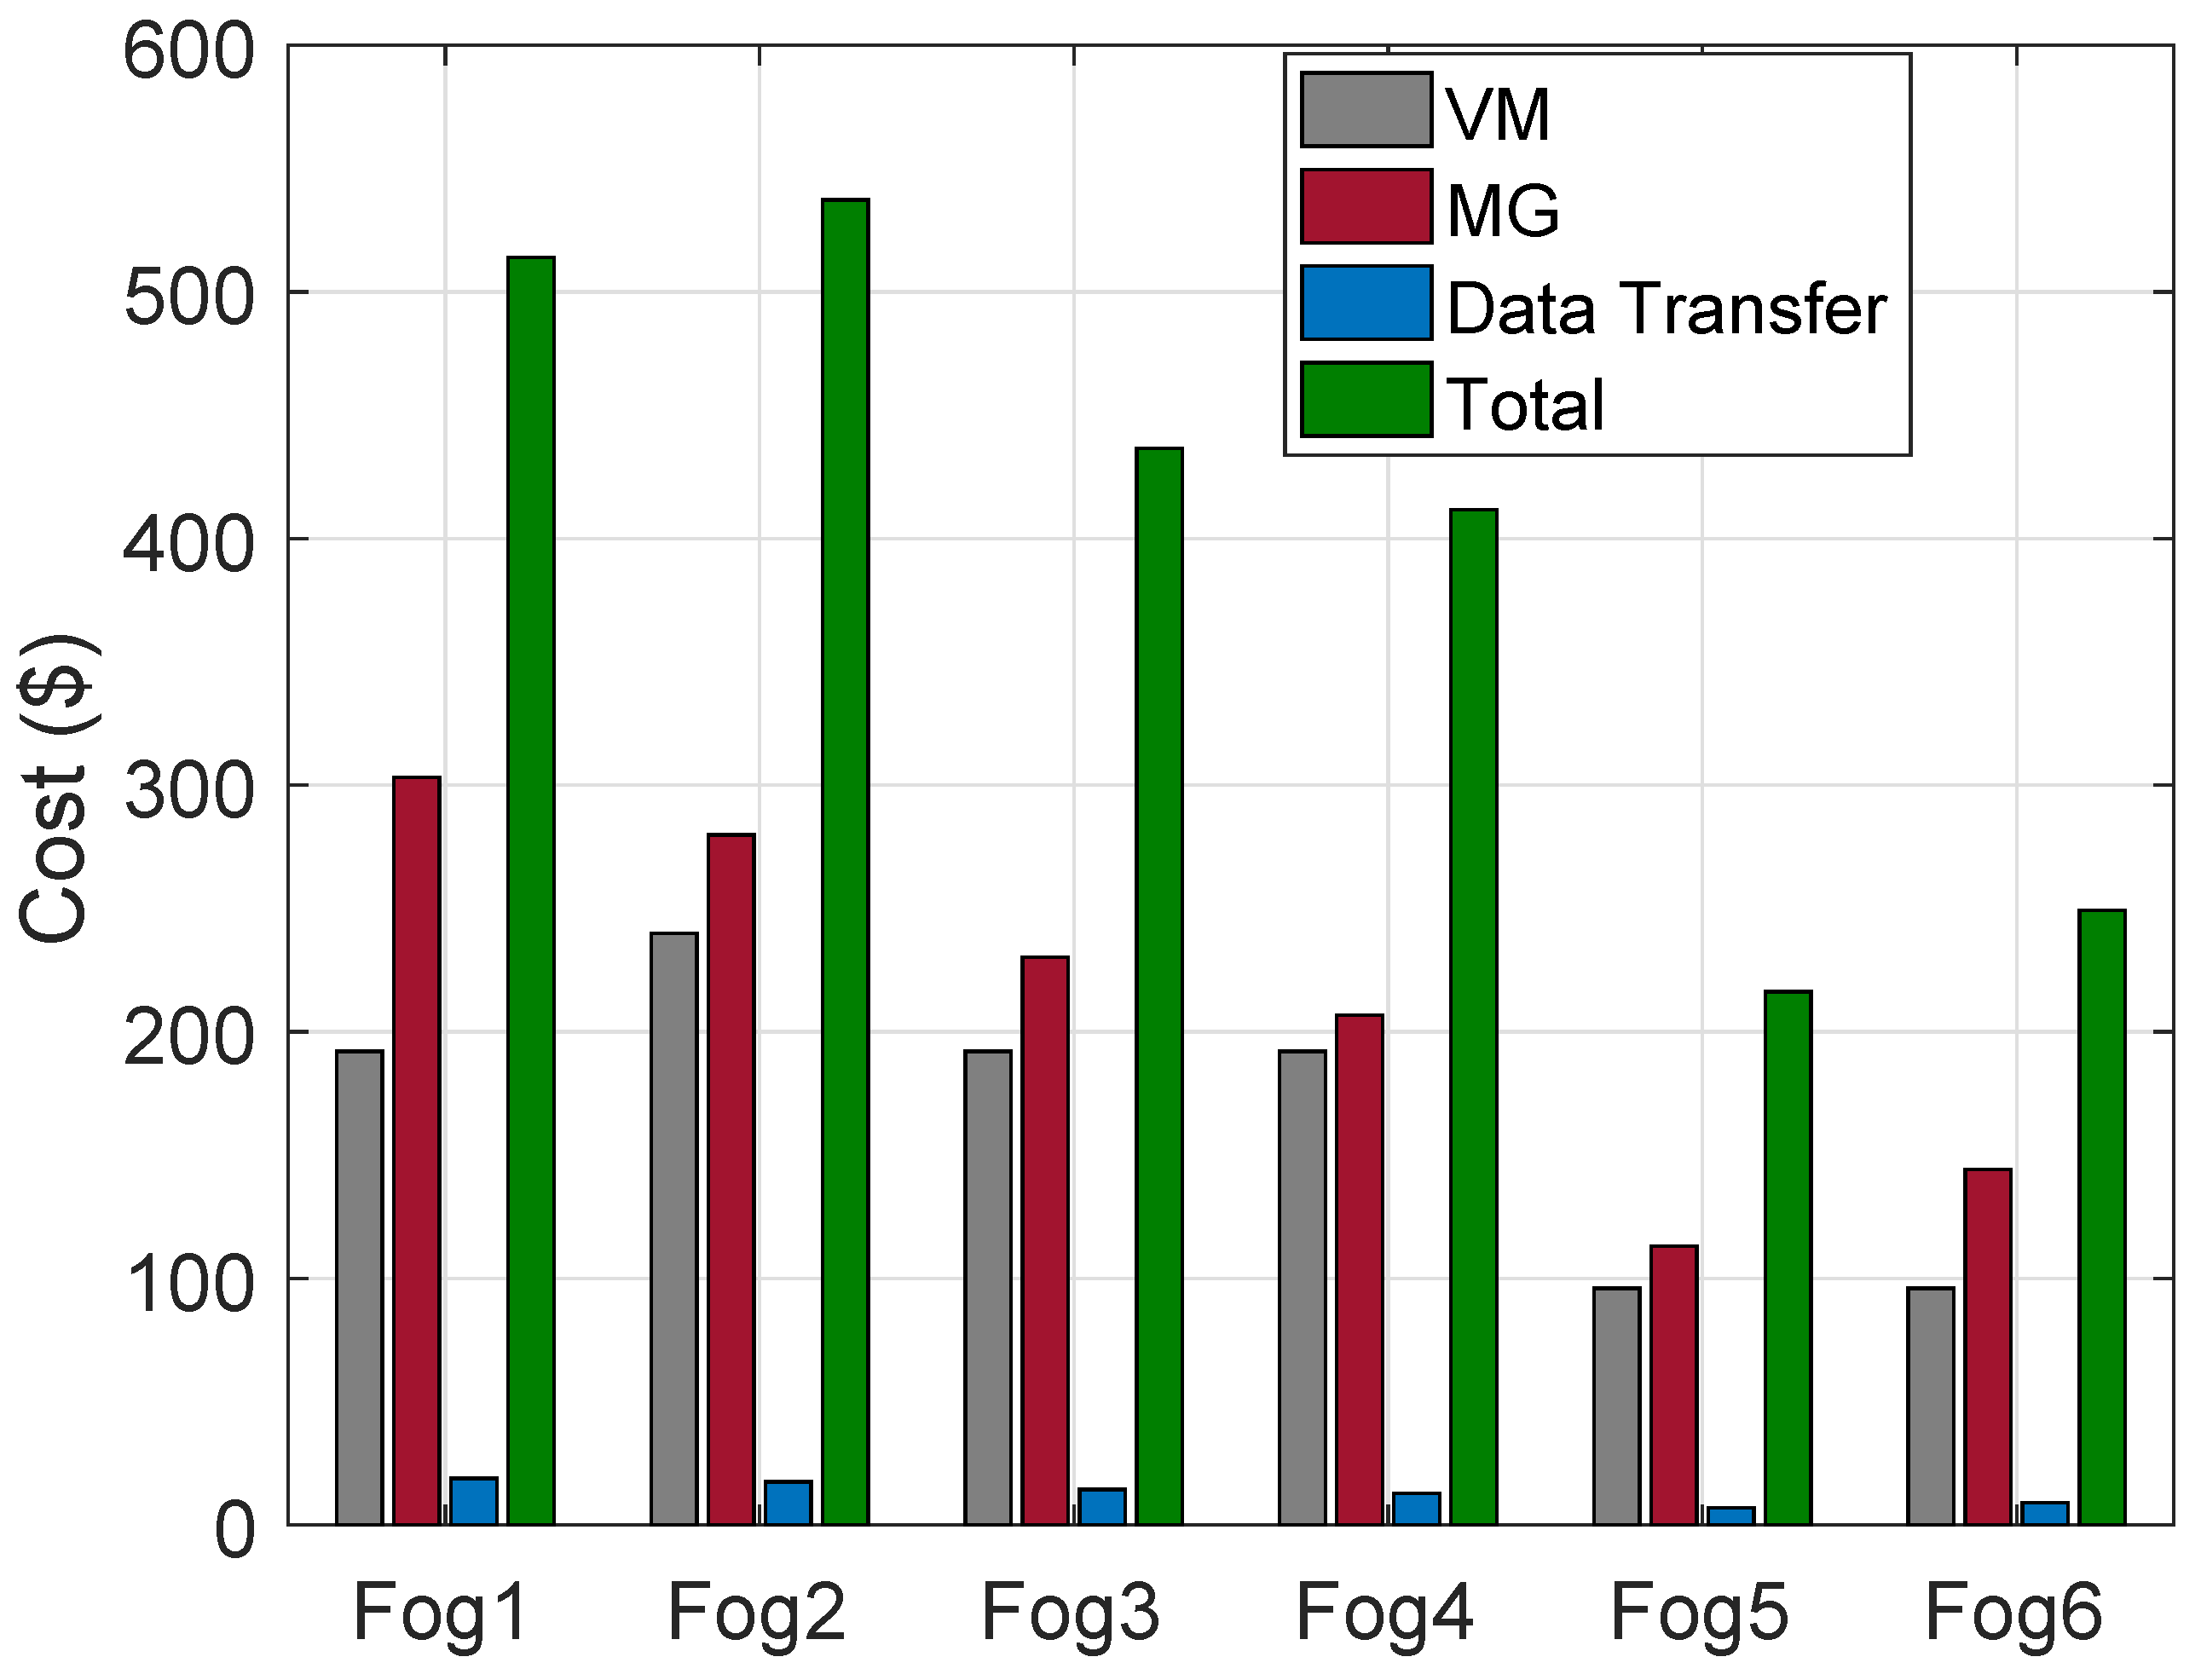
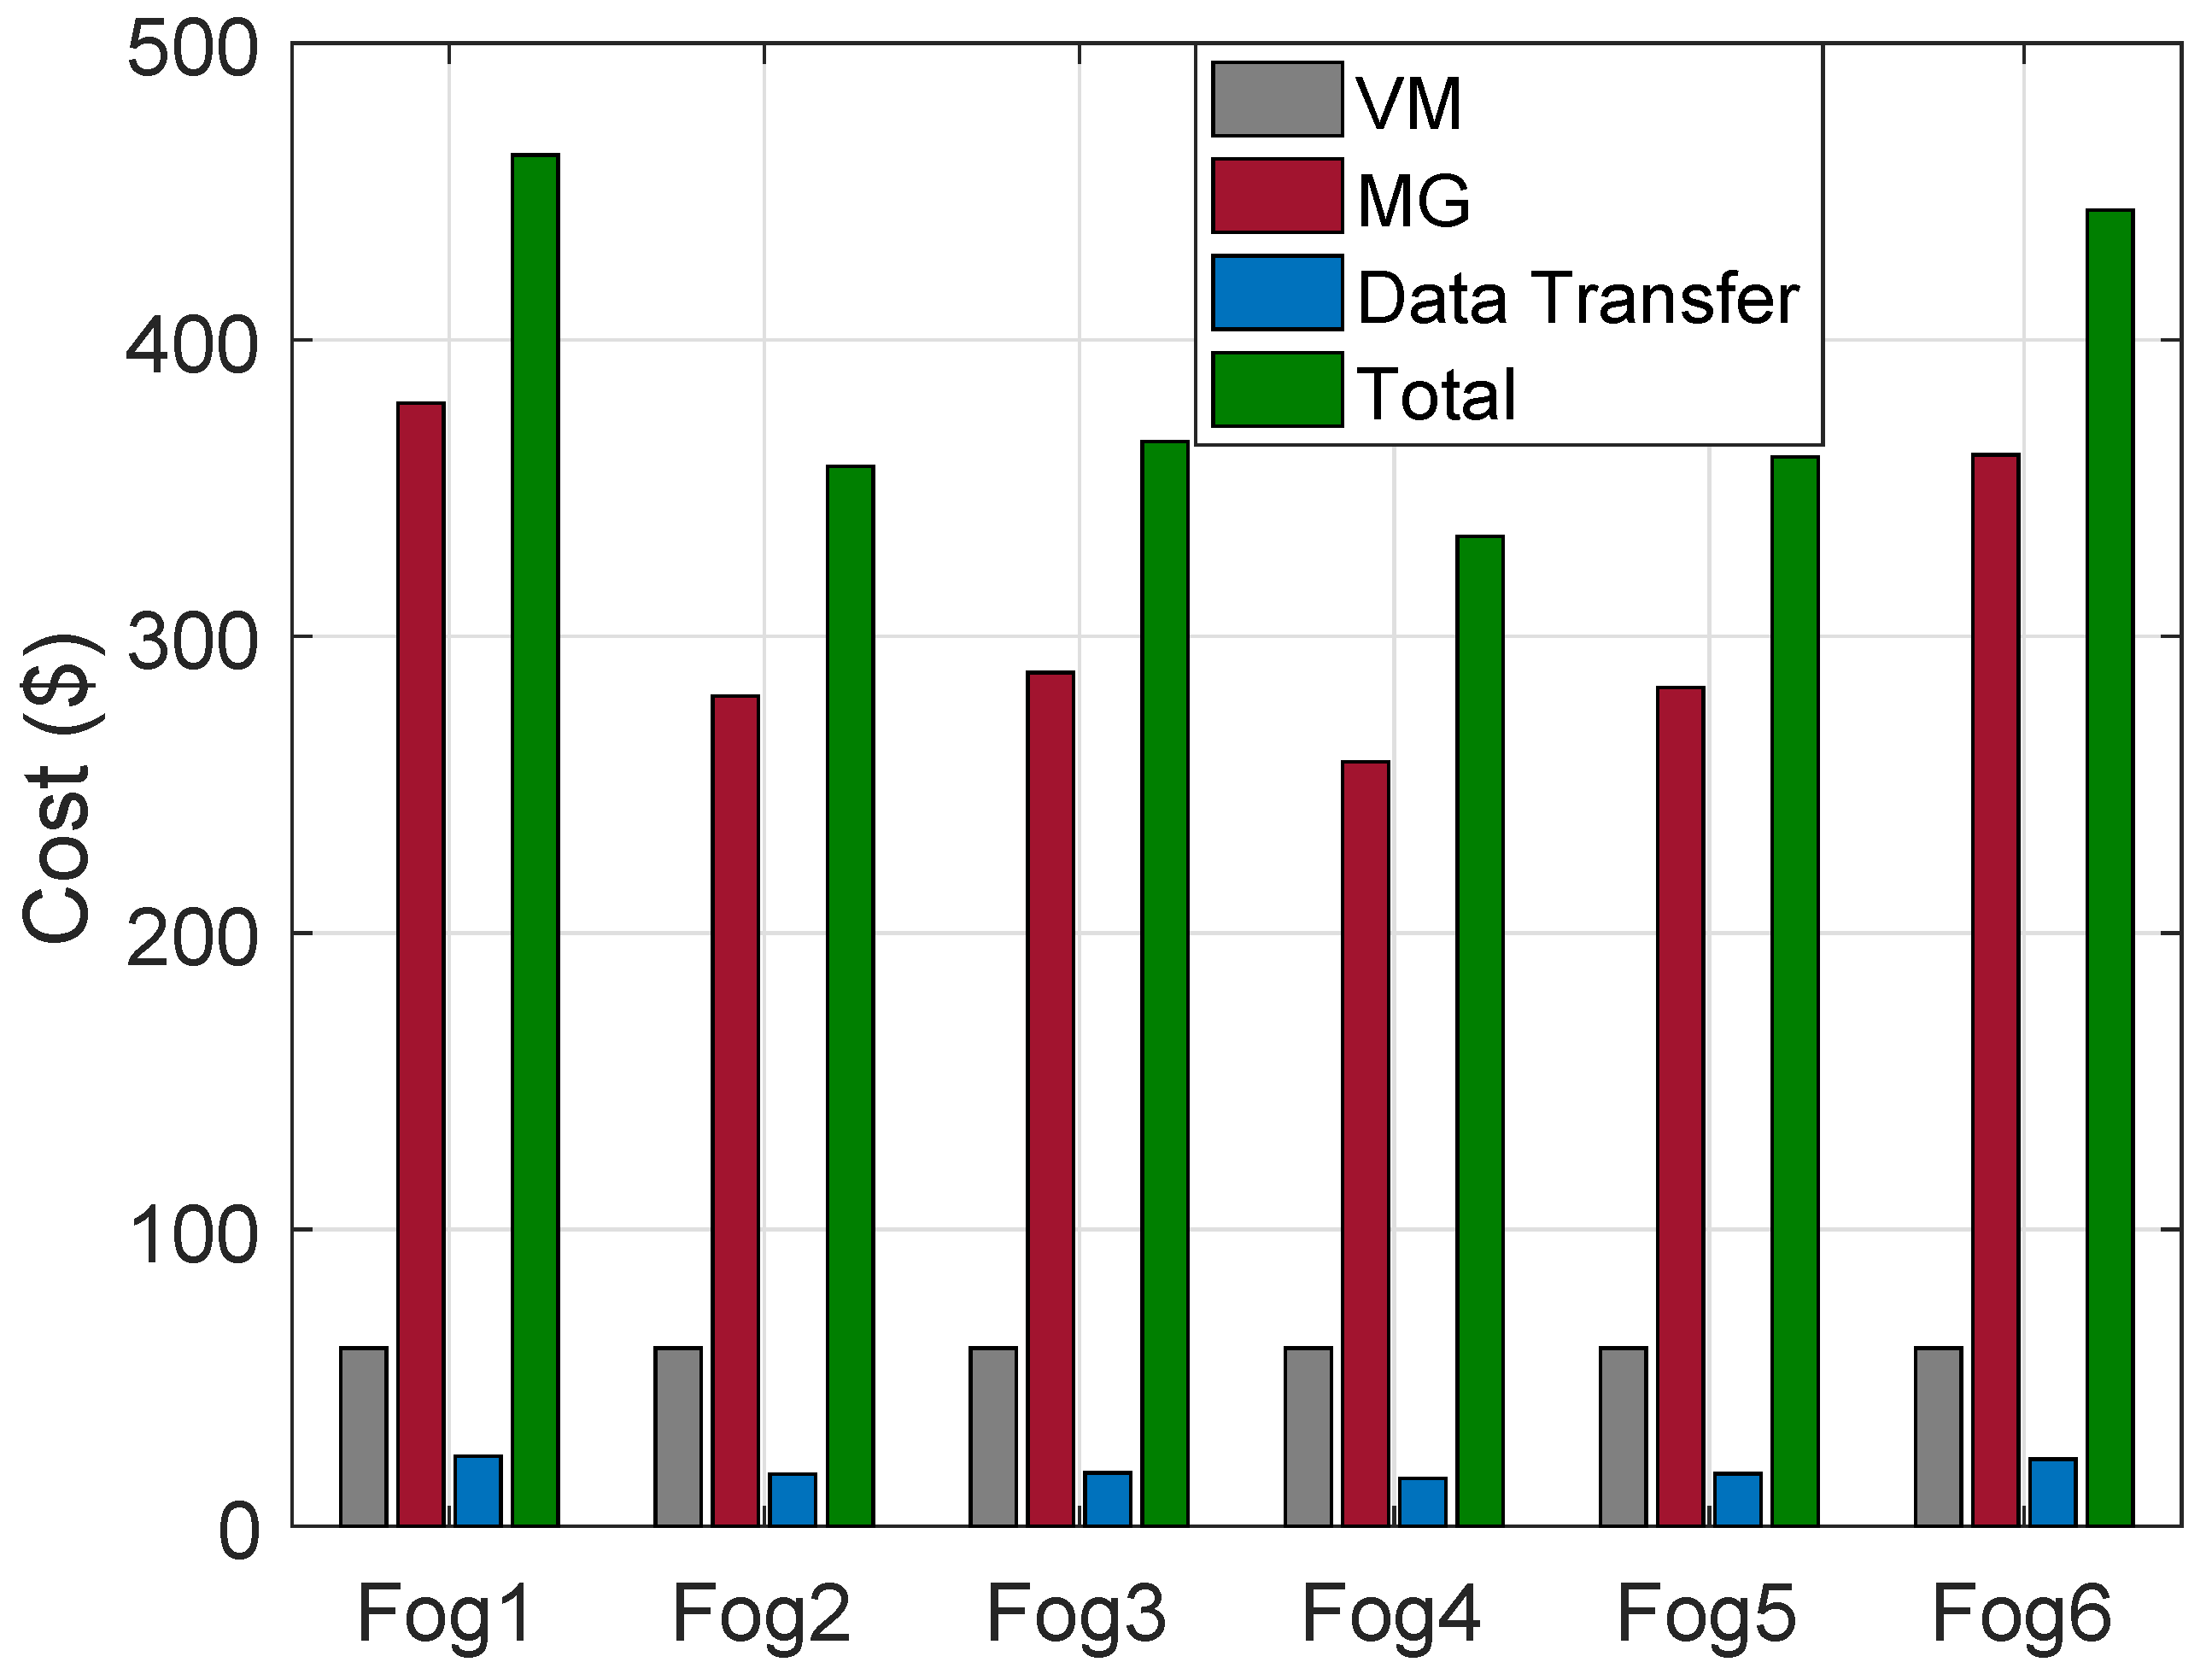
The simulation shows in
Figure 3 that total cost of VMs, MGs and DT using ACO and FCFS are the same. The operational cost of each region is associated with MGs, VMs of HPFs and DT. The “Fog4” has the least total cost due to being equivalent to the average number of requests being processed during most of the hours of the day.
The scenario is also implemented in the cloud based system. The cloud has a sum of requests of all HPFs with FCFS and ACO algorithms for allocation of requests to VMs along with ORT service broker policy for selection of data center. In
Table 8, the cloud based system has longer RT as compared to individual HPFs using ACO and FCFS load balancing algorithms. However, PT using ACO is longer as compared to FCFS for the requests of buildings from all the regions. The PT of cloud based system is efficient as compared to individual HPFs. The minimum and maximum RT and PT using ACO and FCFS algorithms are also given in the table. The delayed RT can affect the cost efficiency of energy consumers. For instance, electricity prices are updated at the cloud which may be responded to with a longer delay that compromise the total energy consumption cost for a day. Implementations of cloud based and cloud-fog based systems validate the performance of cloud-fog based system model as well as claim that the SG has time sensitive applications.
5.2. Scenario 2
In this scenario, 50 VMs are considered on HPFs. Huge requests are generated from groups of buildings in the regions and are sent to the HPFs every hour. ACO and FCFS load balancing algorithms allocate the requests on VMs. The RT for the scenario using ACO with average, minimum and maximum are given in
Table 9.
Time taken to process requests are also measured in milliseconds. Average, minimum and maximum time for processing of each HPF in a day using ACO algorithm is given in
Table 10.
Unlike
, RT of group of buildings with 50 VMs using FCFS is different from the ACO algorithm. The RT of the number of requests generated every hour from each group of building is given in
Table 11 with average, minimum and maximum time.
In the scenario, the number of VMs are twice the amount as compared to
. The number of requests in a day generated from the group of buildings in the regions are processed in respective HPF. Their average, minimum and maximum PT are given in
Table 12.
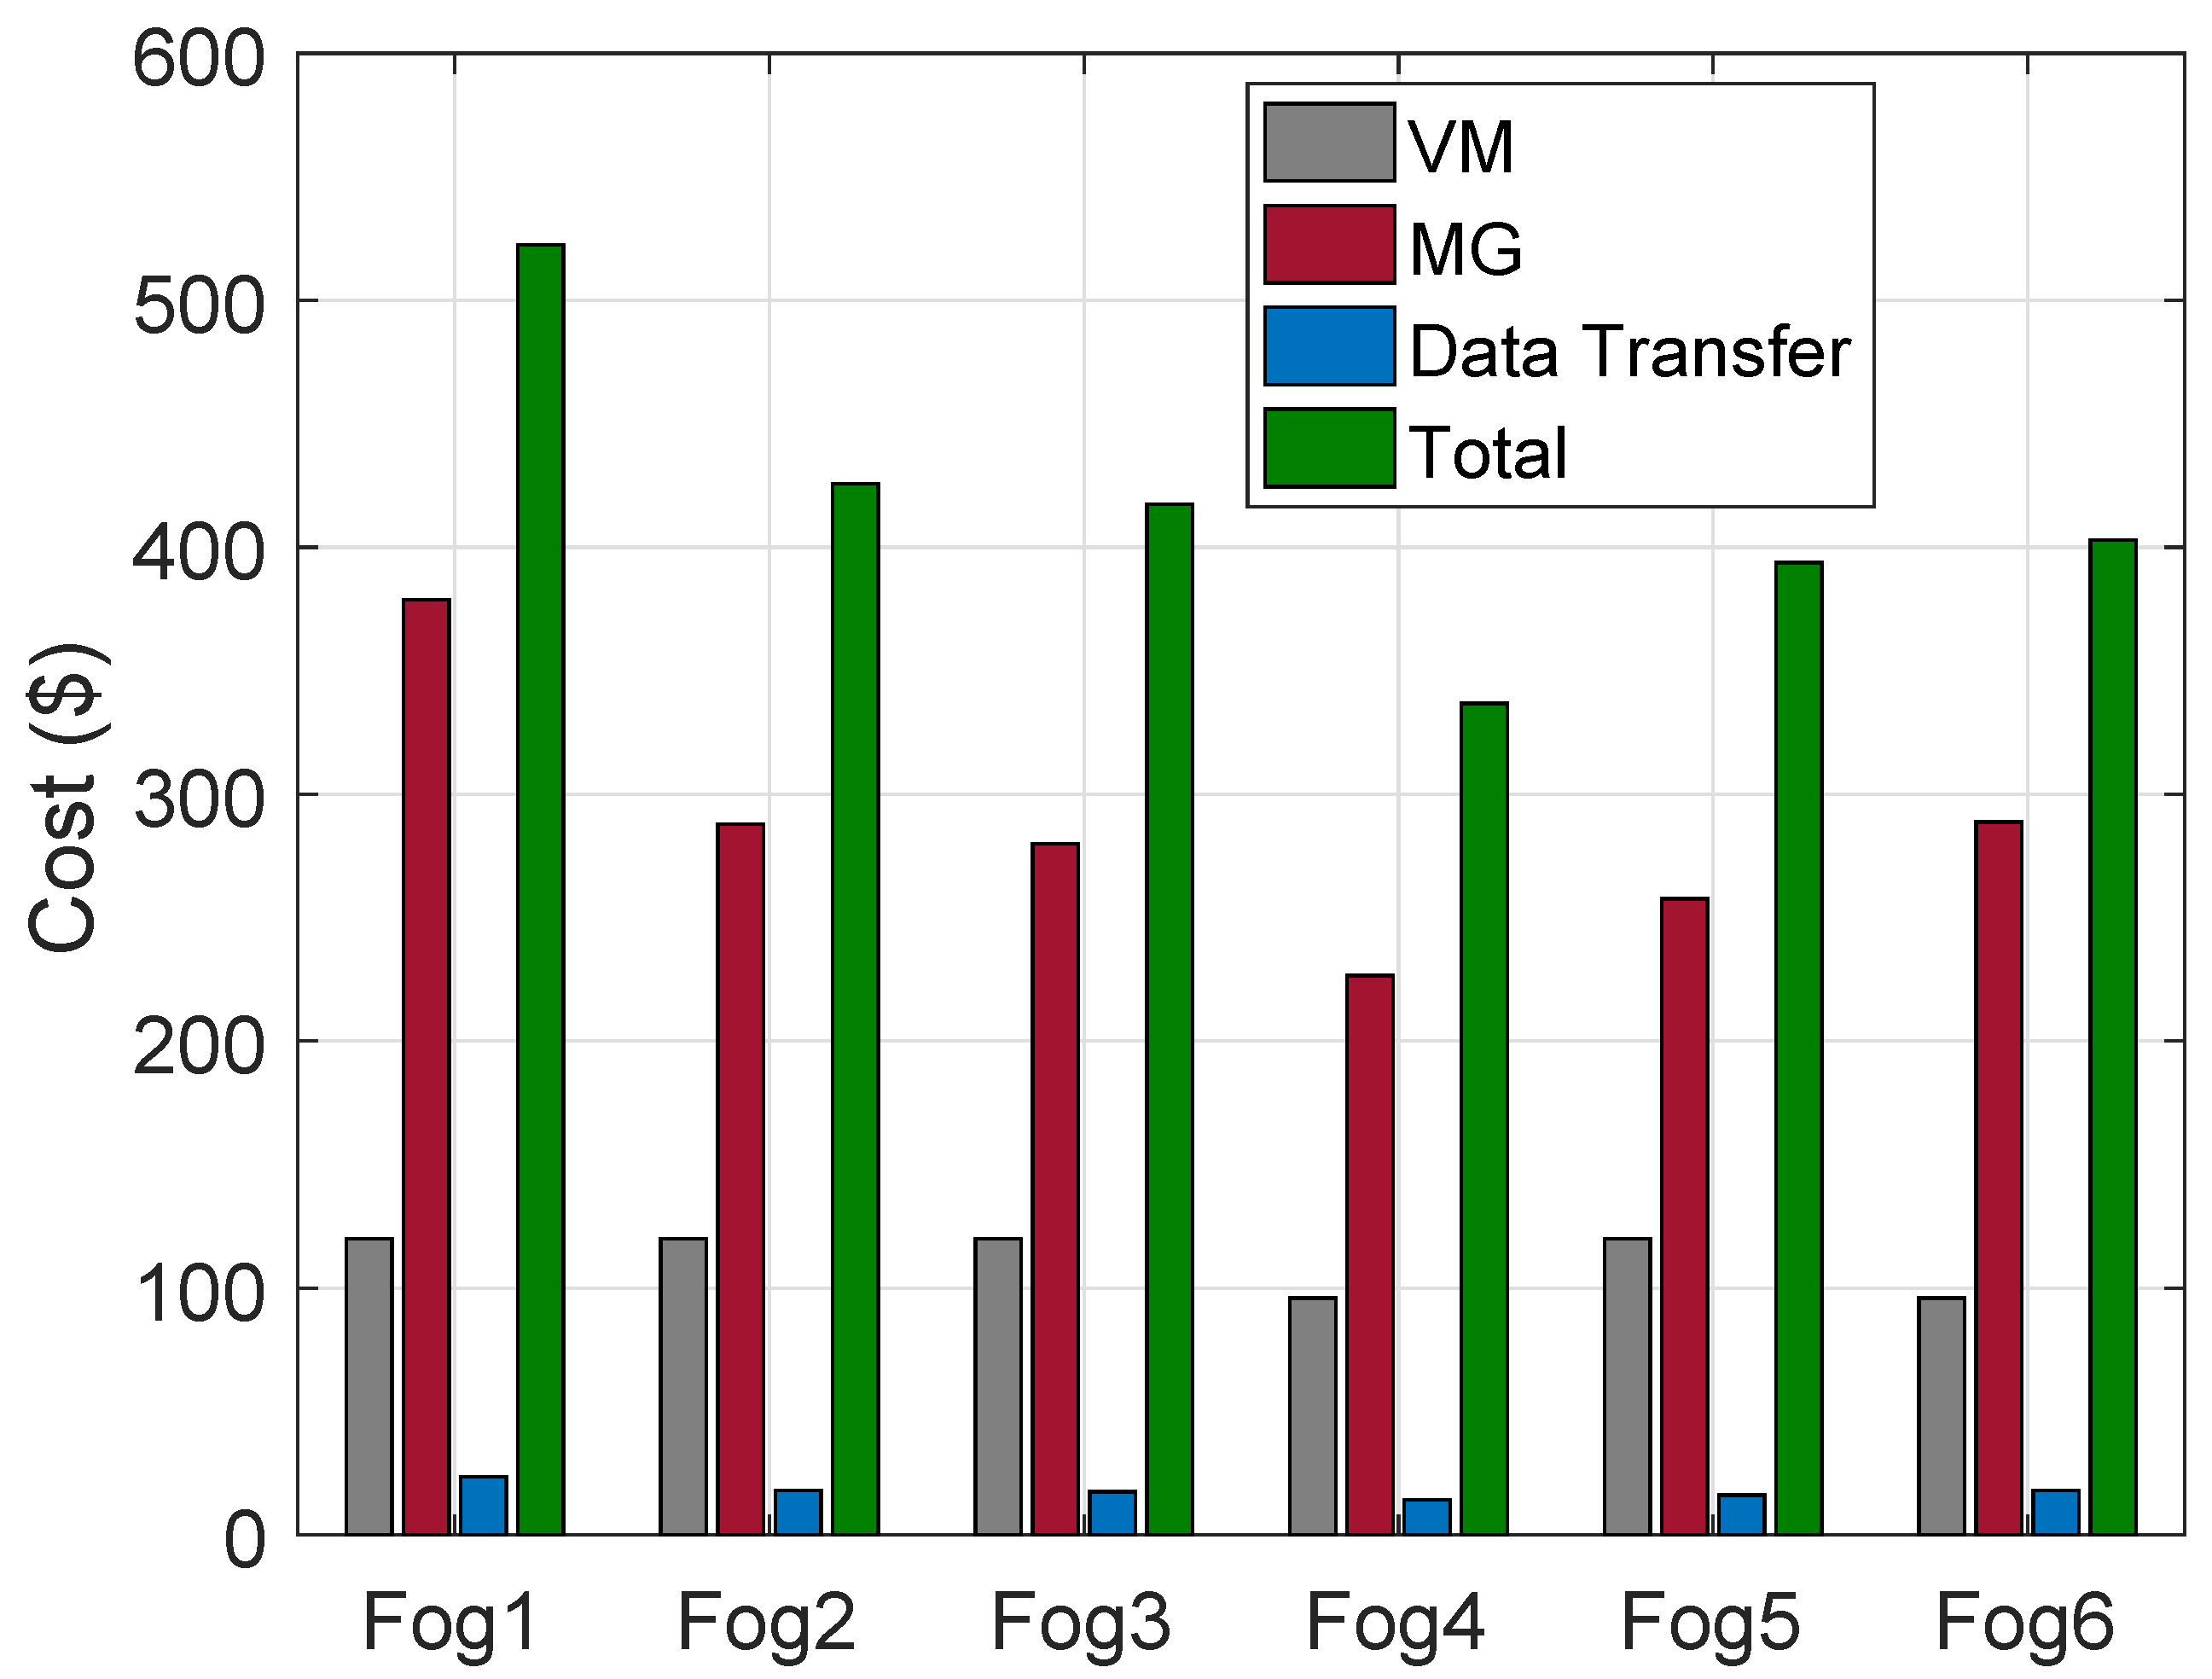
The cost of VMs on HPFs, MGs and DT in the regions are calculated. The cost using ACO is shown in
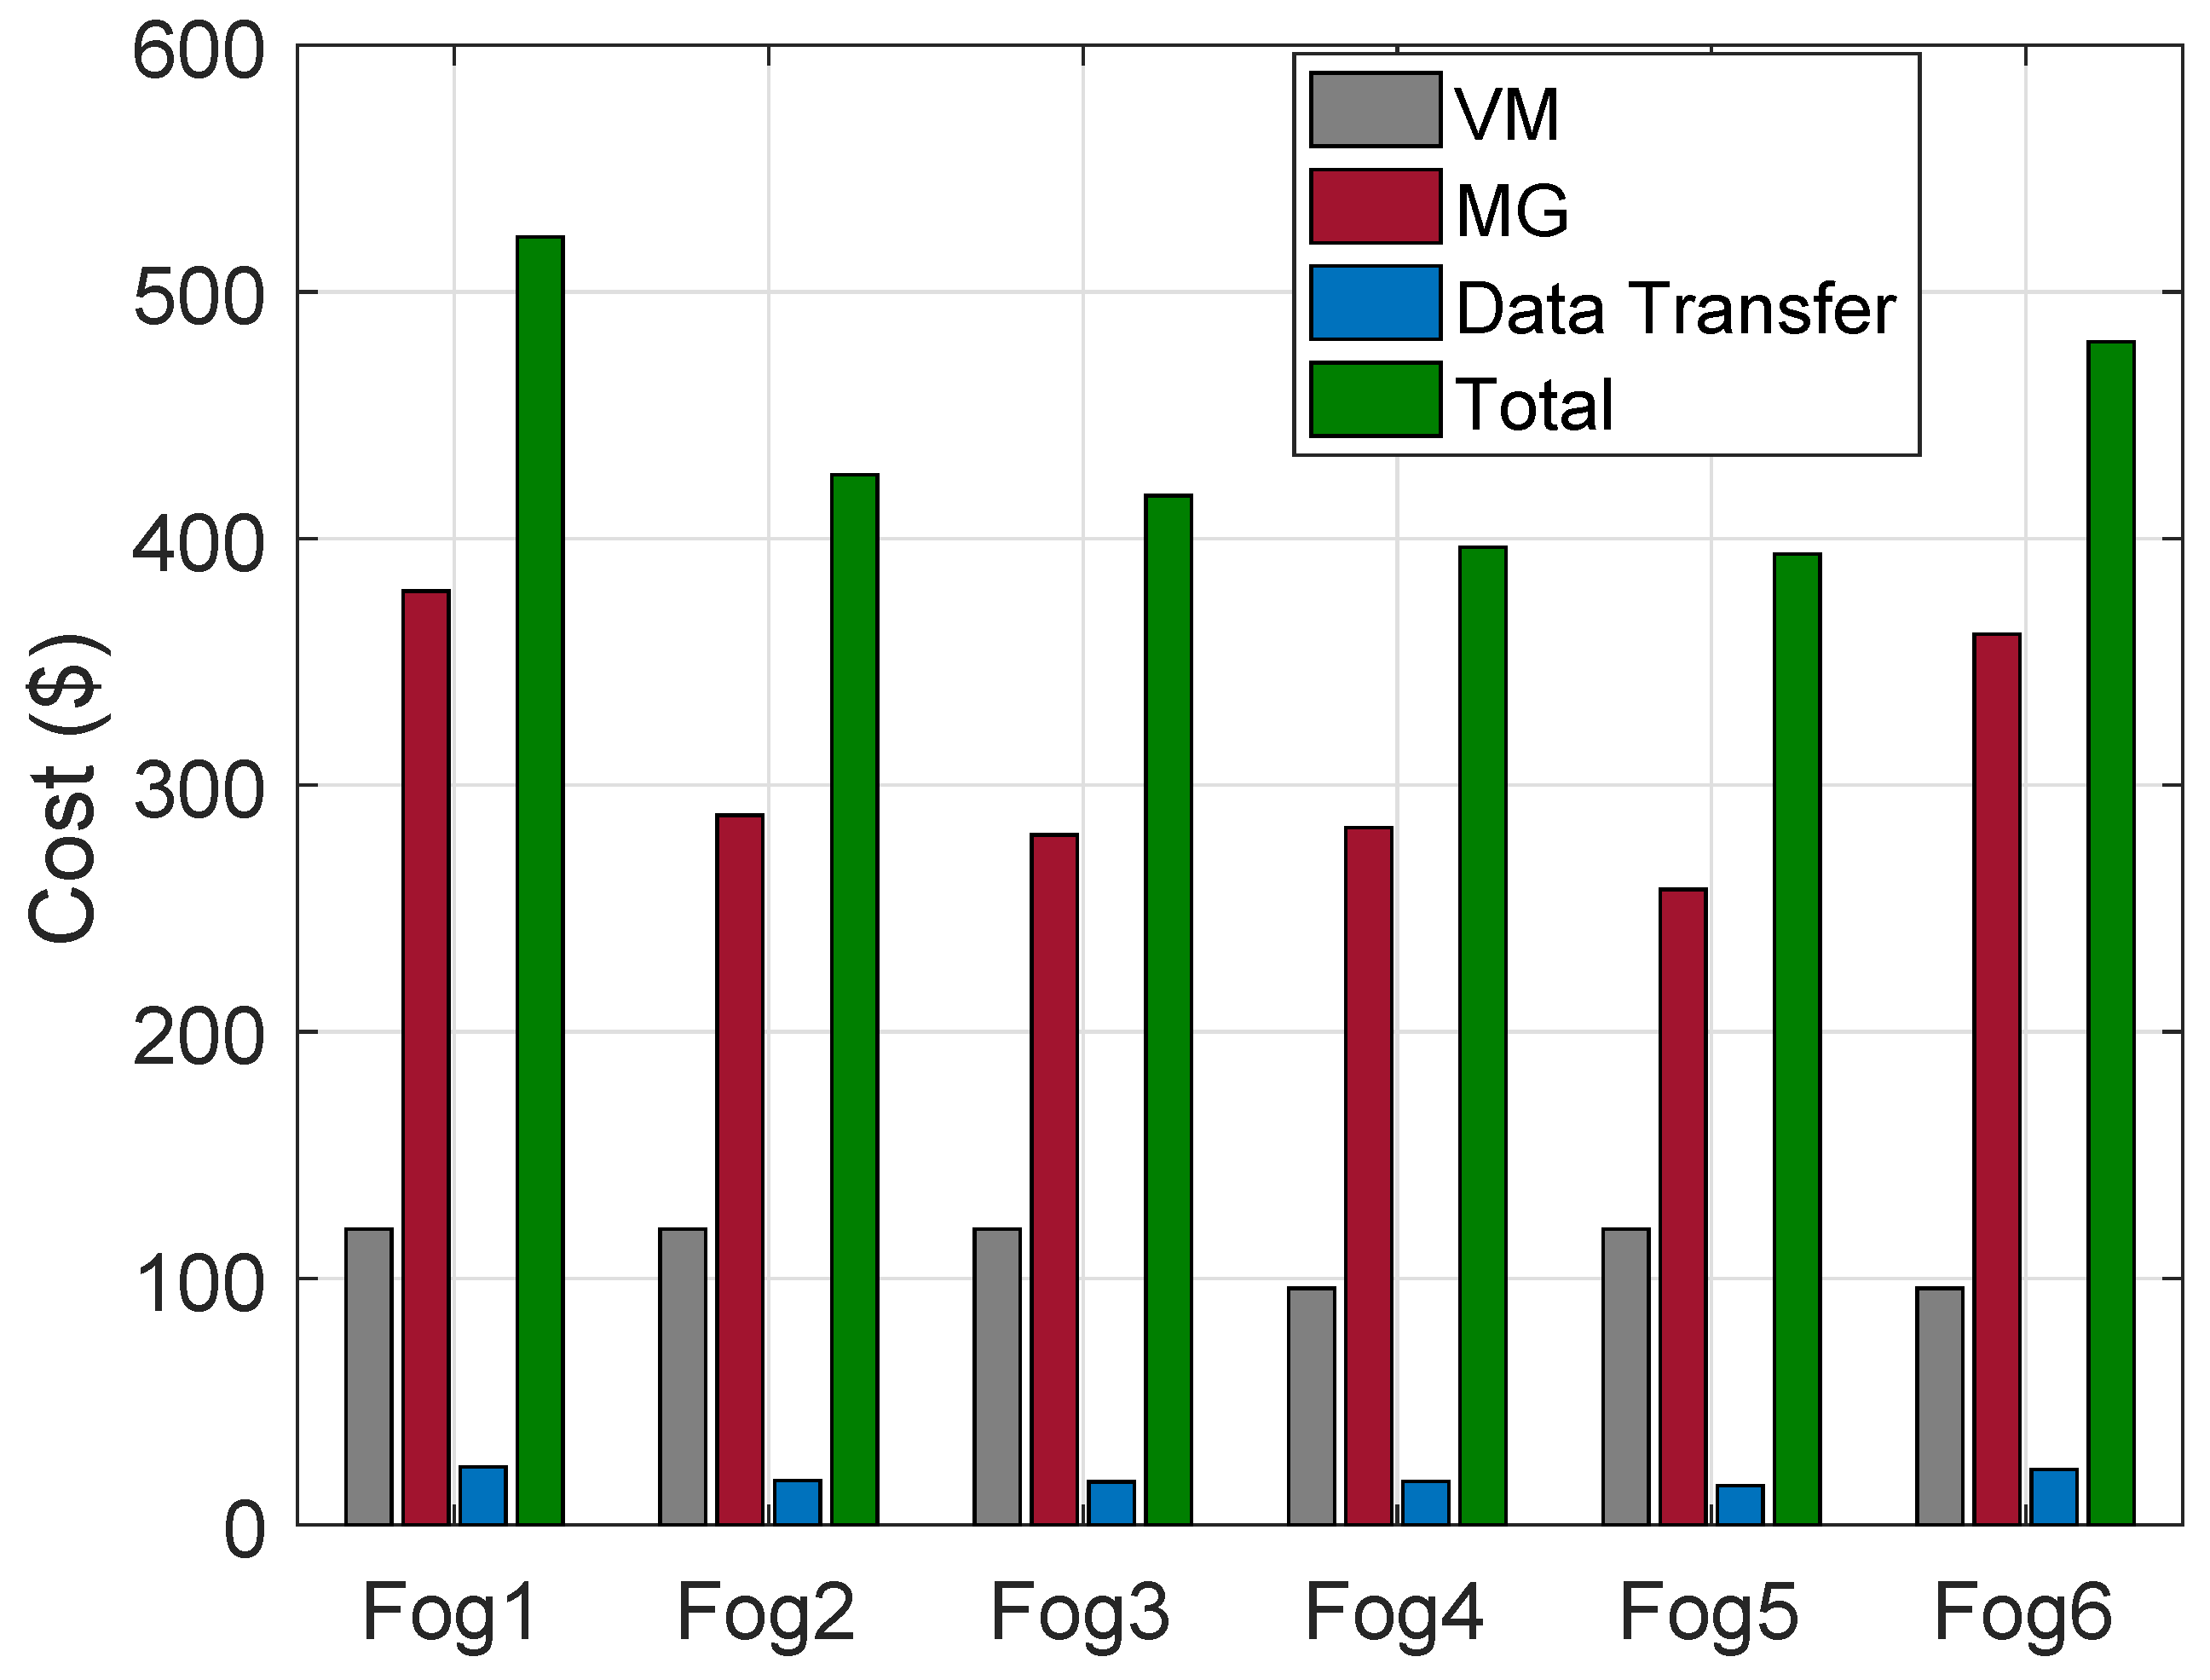
Figure 4. The “Fog4” has the lowest cost due to a lower number of requests being processed as compared to rest of the HPFs in the regions. Similarly, costs of VMs, MGs and DT using FCFS algorithms are shown in
Figure 5.
The scenario is also implemented using a cloud based system model. The cloud node has VMs equal to the sum of all VMs on HPFs with the sum of all requests from all the regions. Both FCFS and ACO algorithms are used for allocation of requests to VMs and ORTP is used for data center selection. In
Table 8, average RT with ACO algorithm for the cloud based system is longer than HPFs in the regions for the groups of buildings G1, G2, G3, G4, G5 and G6. Each building is entertained with a more delayed response as compared to the cloud-fog based system. Delayed responses for the buildings in the regions compromise the efficiency of energy consumption. For instance, if a building is consuming power with some cost that is updated with cheaper rates; however, delayed response keeps the consumers consume expensive energy for the delayed time. The PT in the cloud is affected with sub-delays like; allocation of requests due to a huge number of requests, evaluation for allocation of requests due to more number of VMs and creation of too many VMs which compromise the performance of physical resources etc. In a cloud based system, average RT and PT using the FCFS algorithm are higher as compared to ACO, which validates the efficiency of ACO. Similarly, variations can be observed for minimum and maximum RT and PT in the table with both ACO and FCFS algorithms. The cloud based system has high processing resources as compared to HPFs that reduce the evaluation time for ACO. Hence, ACO is a good load balancing algorithm; however, time and space complexity is higher as compared to FCFS. The summery of performance with ACO and FCFS is given in
Table 13.
5.3. Scenario 3
In this scenario, the number of VMs are twice the amount as compared to “Scenario 2”. Average, minimum and maximum RT of requests for a group of buildings in a day using ACO are given in
Table 14. The PT for the requests of buildings at each HPF for a day using ACO algorithm with average, minimum and maximum are given in
Table 15.
The RT for each group of buildings with average, minimum and maximum with the FCFS algorithm on HPFs for a day is given in
Table 16. Similarly, PT for the requests processed at each HPF using the FCFS algorithm for a day with average, minimum and maximum given in
Table 17.
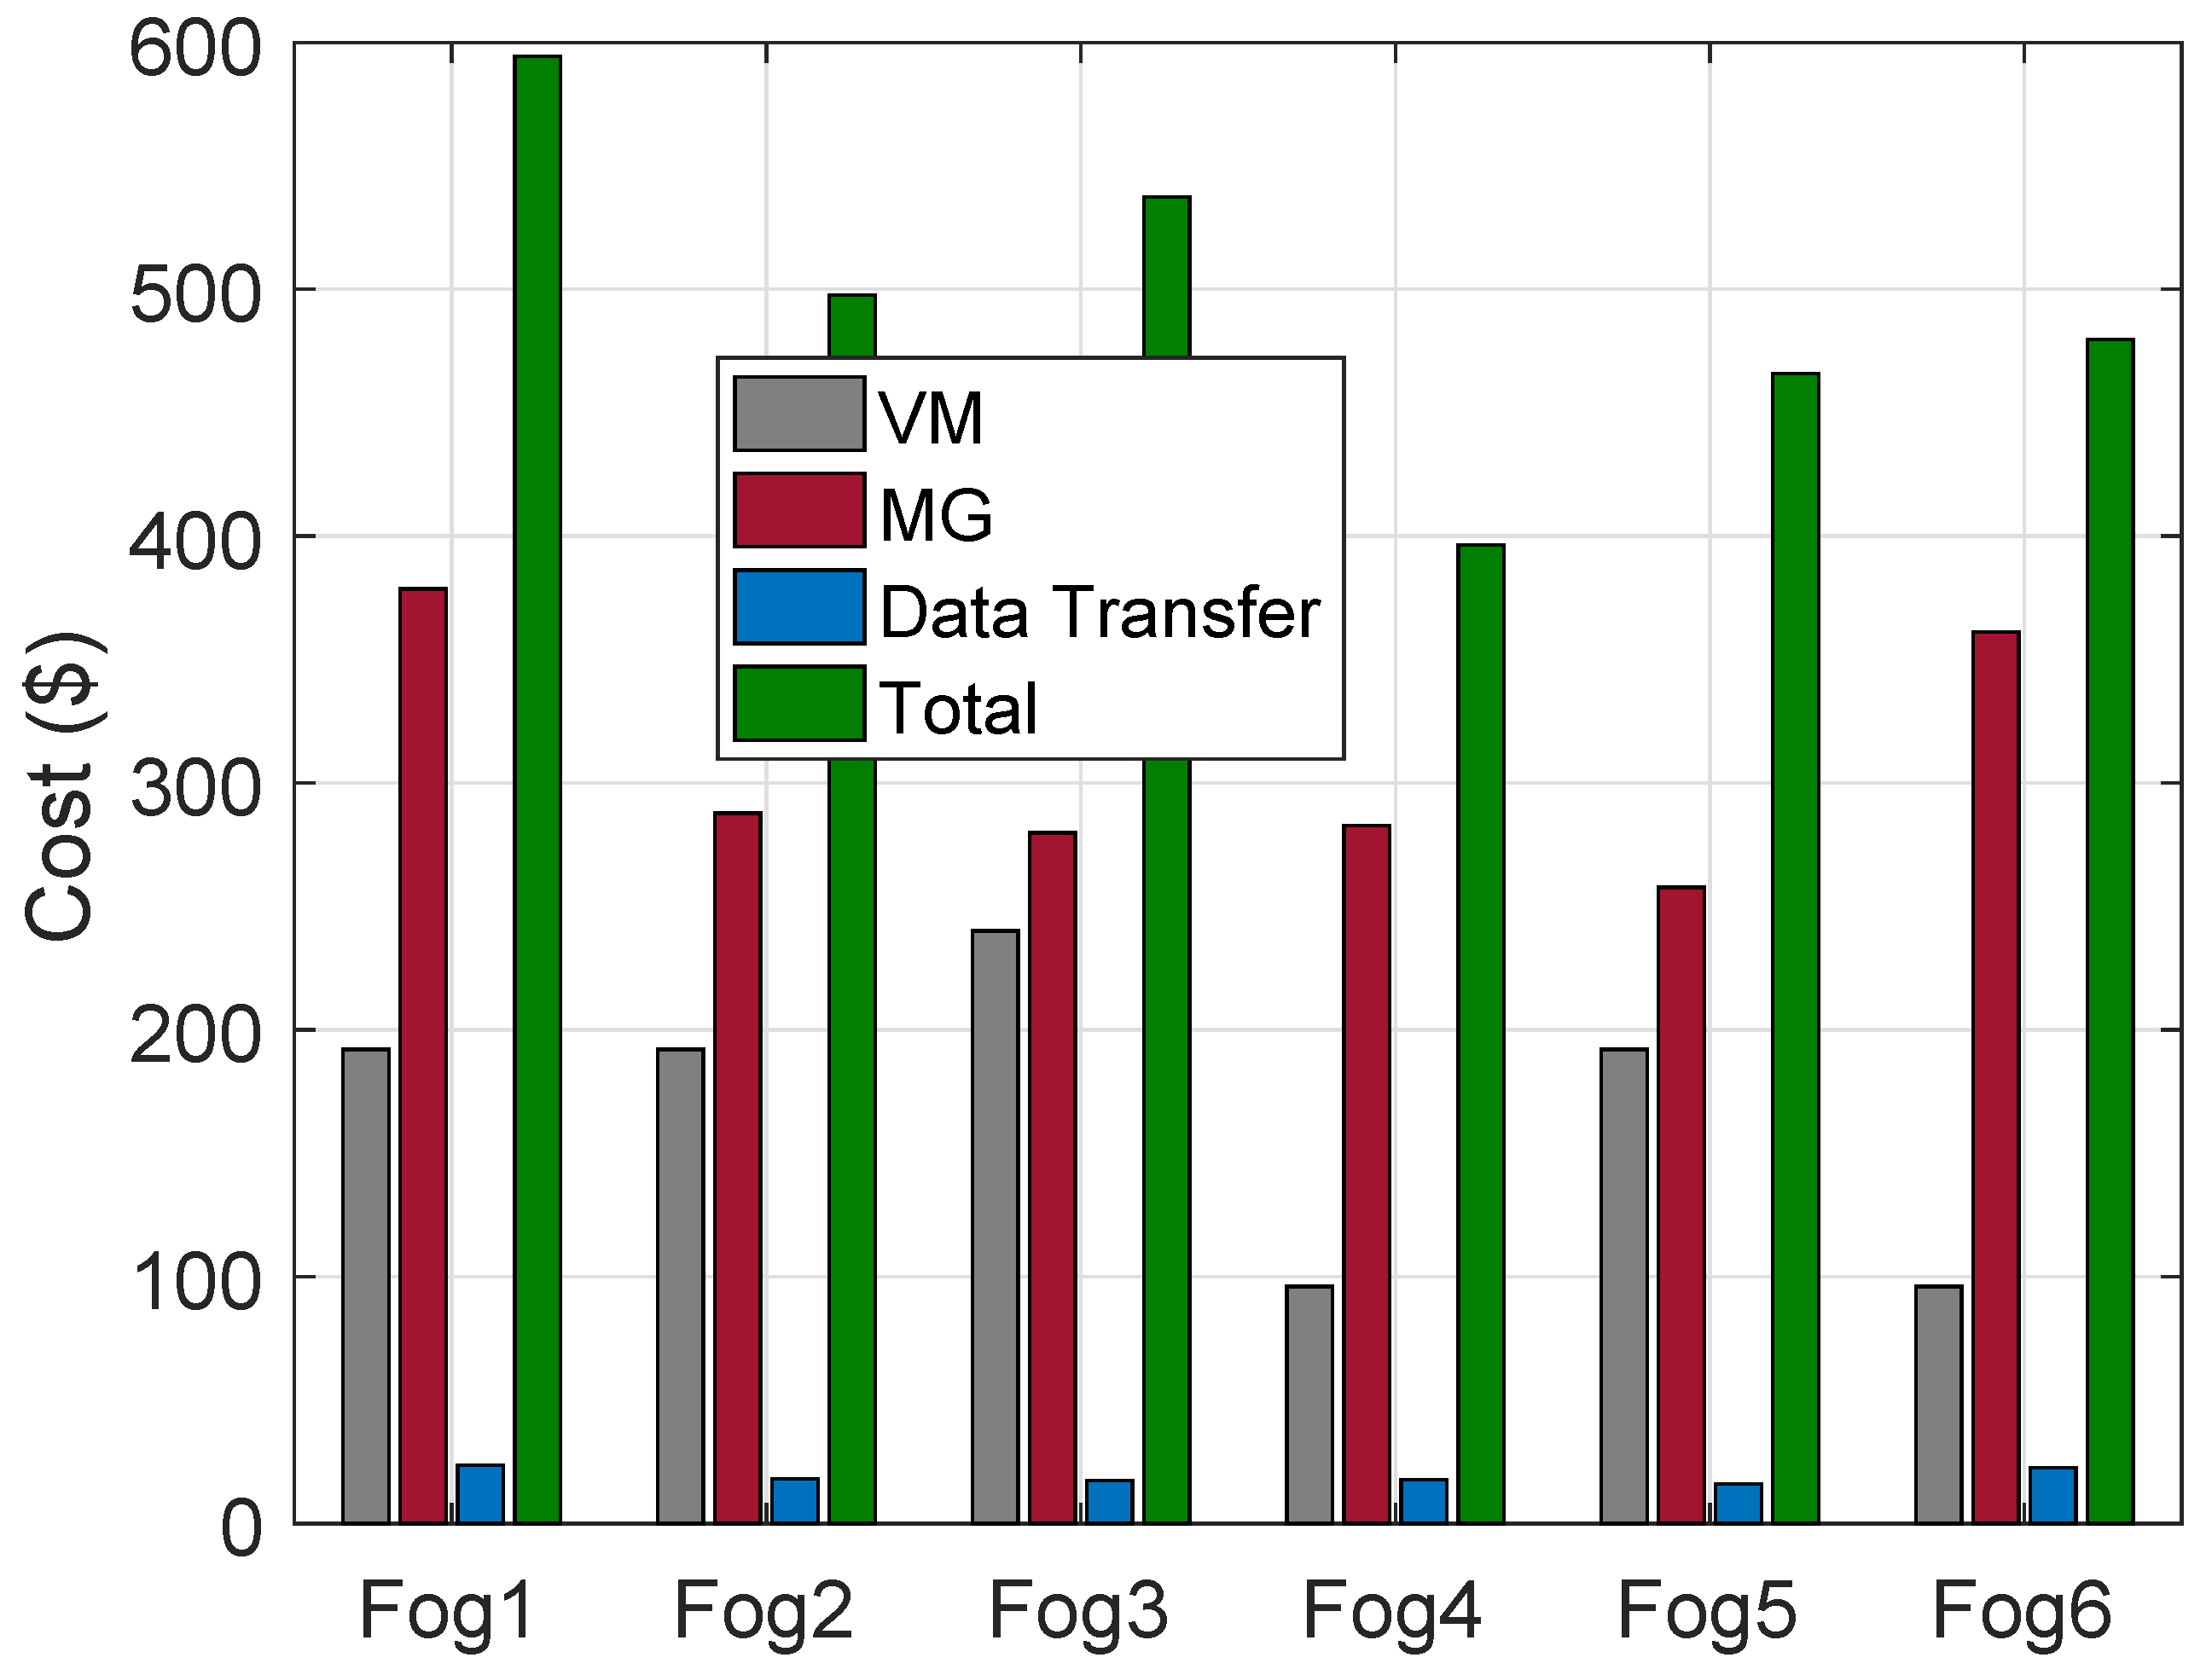
The cost of VMs on HPFs using the ACO algorithm for the allocation of requests of buildings, MGs and DT for a day is shown in
Figure 6. The cost of VMs using FCFS algorithm, MGs and DT for a day is shown in
Figure 7.
The scenario is also implemented in a cloud based system. The cloud has an equivalent number of VMs as those on all HPFs and the resources. The traffic of requests being routed to the data centers using ORTP and VMs are allocated with requests of buildings from all the regions using ACO as well as FCFS algorithms. The groups of all buildings are connected with the cloud and send a huge number of requests on the cloud for computation. Utility and MGs receive instructions from the cloud.
Table 18 shows that average RT for groups of buildings in all regions. The ACO is efficient as compared to FCFS algorithm. However, average RT of the cloud is longer than individual HPFs for the group of buildings in the regions which makes the cloud based system inefficient as compared to the HPFs based system. The size of computing resources of the cloud is equivalent to the sum of sizes of the computing resource of all HPFs. The closed based system of
is efficient as compared to this scenario due to too many VMs compromising the performance of physical resources of the cloud.
5.4. Comparative Analysis
Three scenarios have been implemented with 25, 50 and 100 VMs on each HPF. The groups of buildings in each region generate a huge number of requests and sent to HPFs. The implementation of the scenarios explained the performance parameters like RT, PT, cost of VMs, MGs and DT. ORTP is implemented for the routing of the requests to data centers. ACO and FCFS algorithms are used for VMs allocation to the requests.
The tables of RT and PT for the requests of buildings for a day with have the least values as compared to and using ACO and FCFS algorithms. VMs are computing resources that enhance the RT and PT by sharing the physical resource; however, too many VMs compromise the performance of physical resources that ultimately compromise the performance of the overall system. Hence, the performances of HPFs and the cloud of are ideal as compared to and . The number of VMs of are twice the amount of and the is twice the amount of . Hence, has the ideal number of VMs according to the specification of the physical resource as compared to and . The performances of HPFs and the cloud in the scenarios also affect the depending parameters like the cost of MGs, DT and VMs.
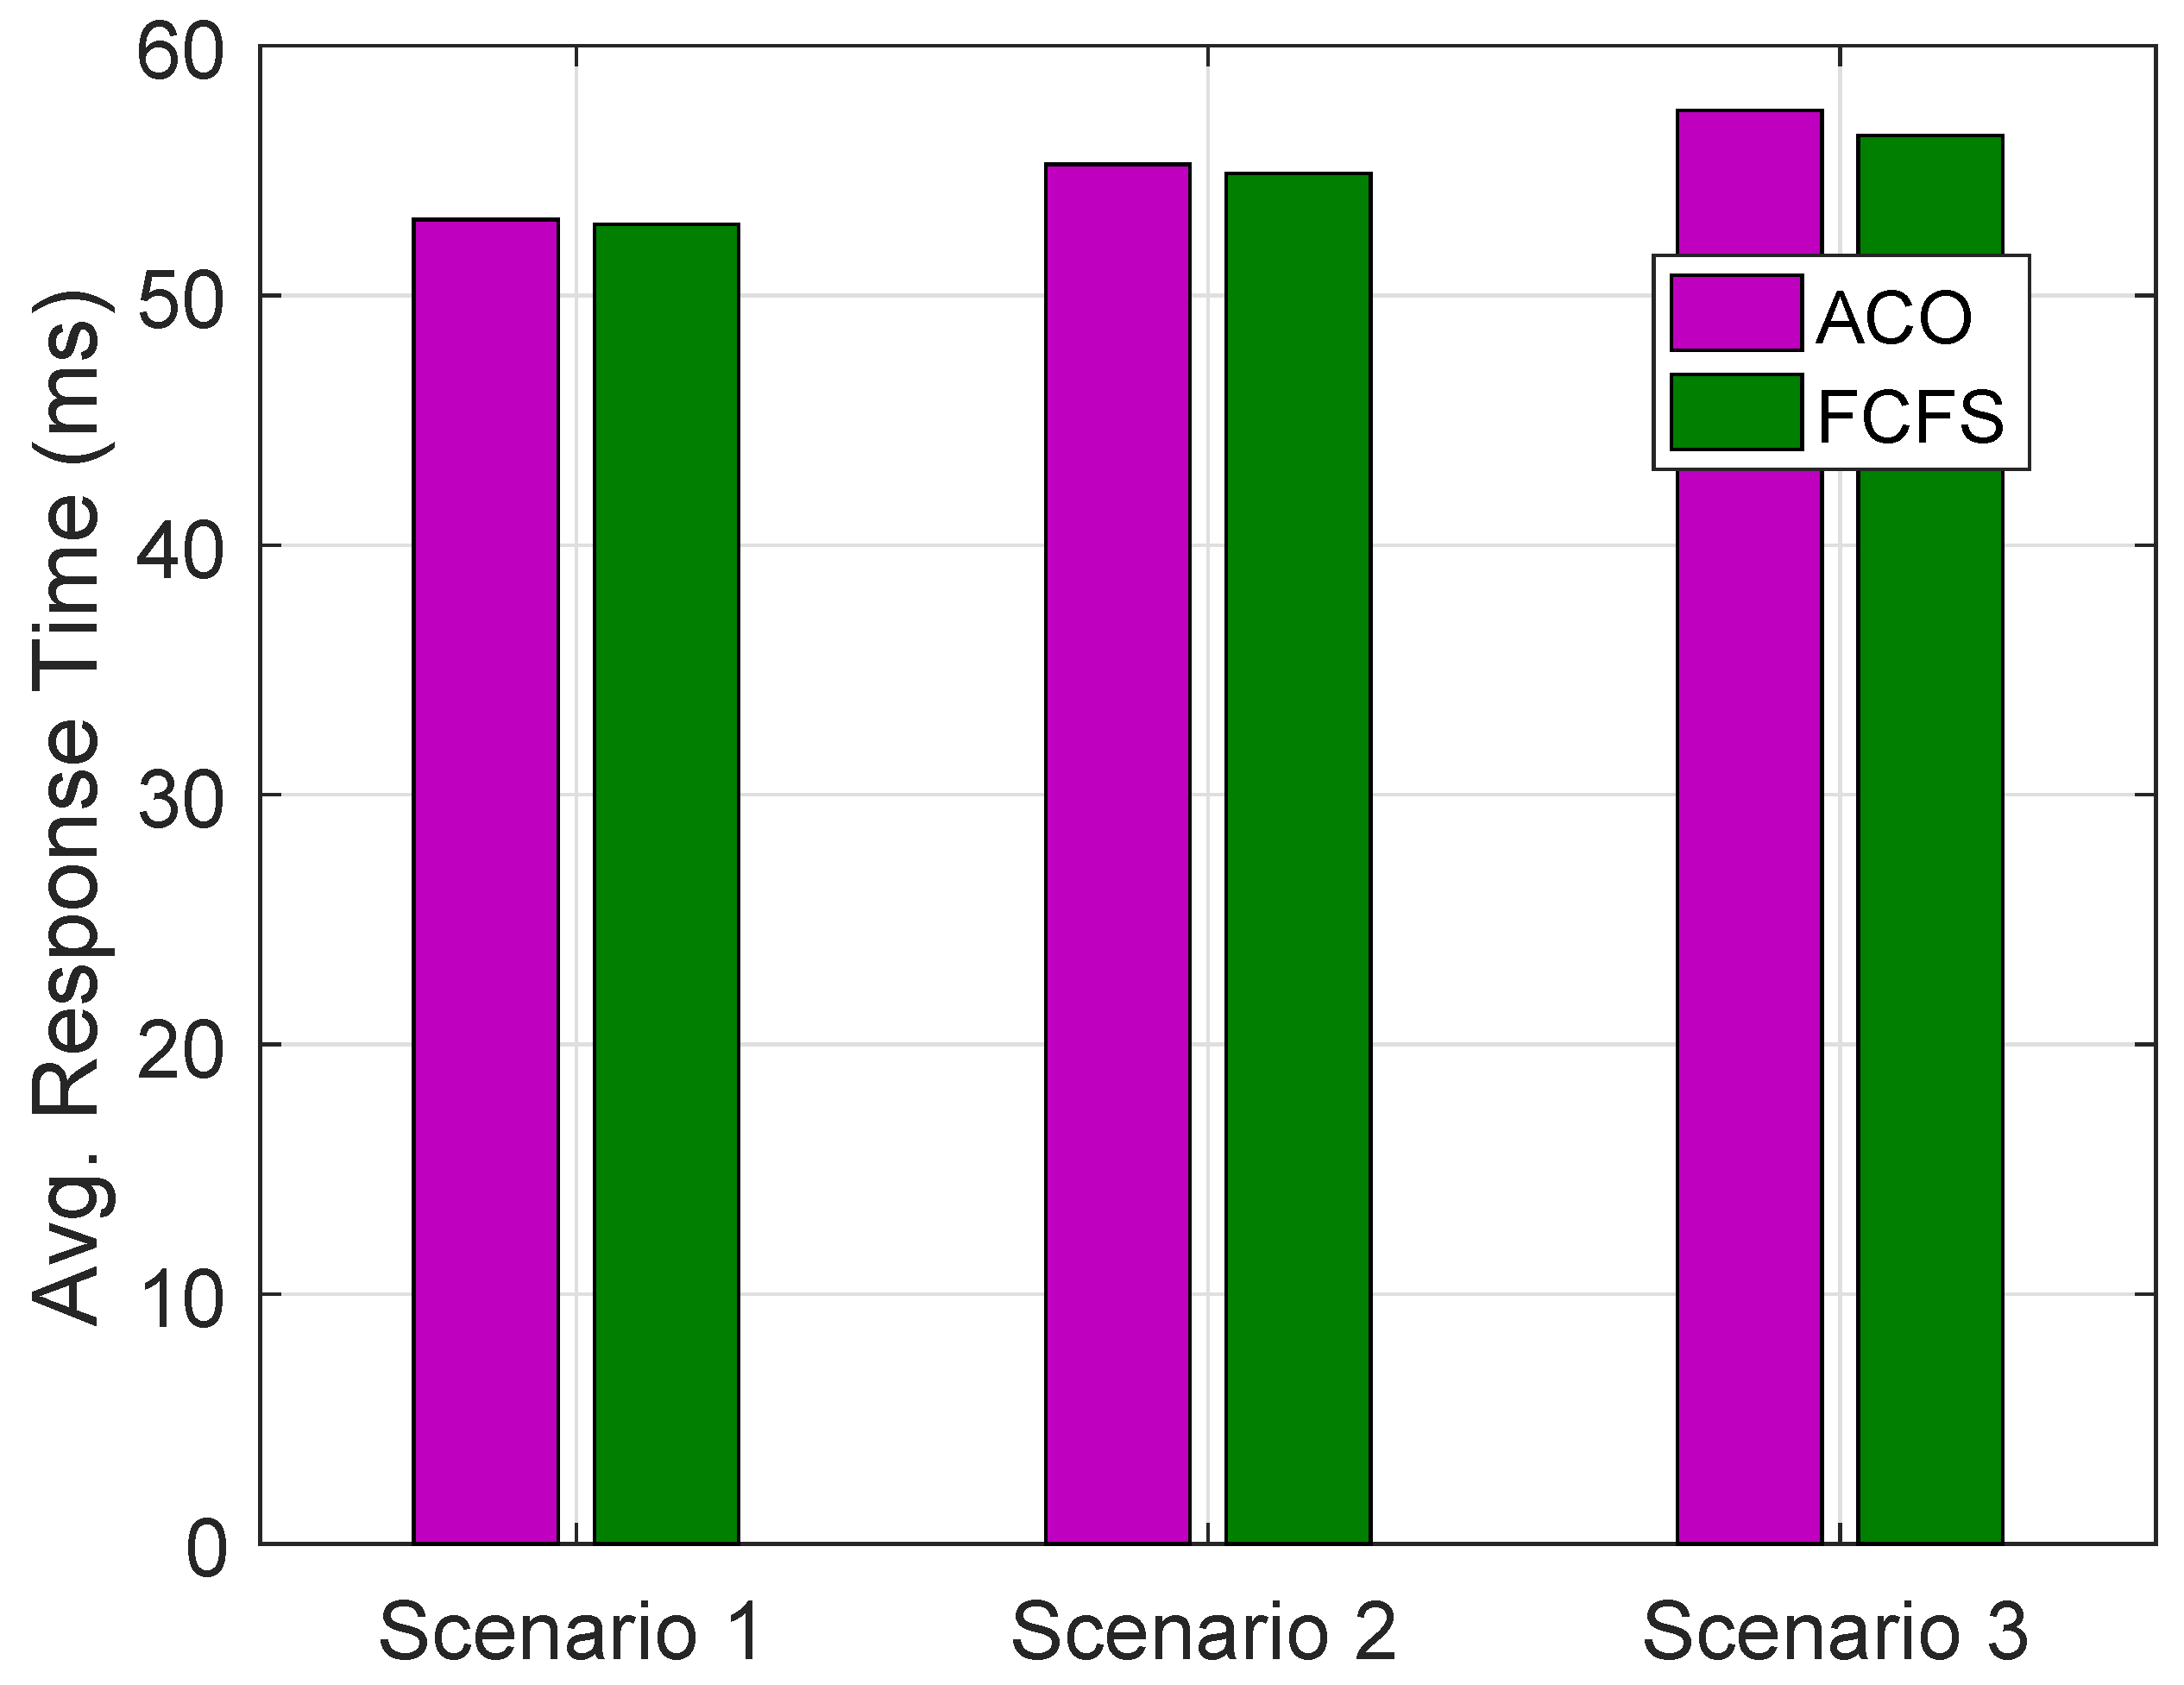
The comparative analysis of all scenarios verifies the claim. In
Figure 8, the average PTs for
,
and
are given. The RT in
has less graph representation as compared to
and
using ACO and FCFS algorithms for requests of groups of buildings in a day.
Average PT for all scenarios using ACO and FCFS algorithms for requests of buildings in a day on all HPFs are shown in
Figure 9.
has optimized average PT as compared to
and
while
has optimized PT as compared to
. Average PT using ACO is more optimized then FCFS in
and
while this is vice versa in
.
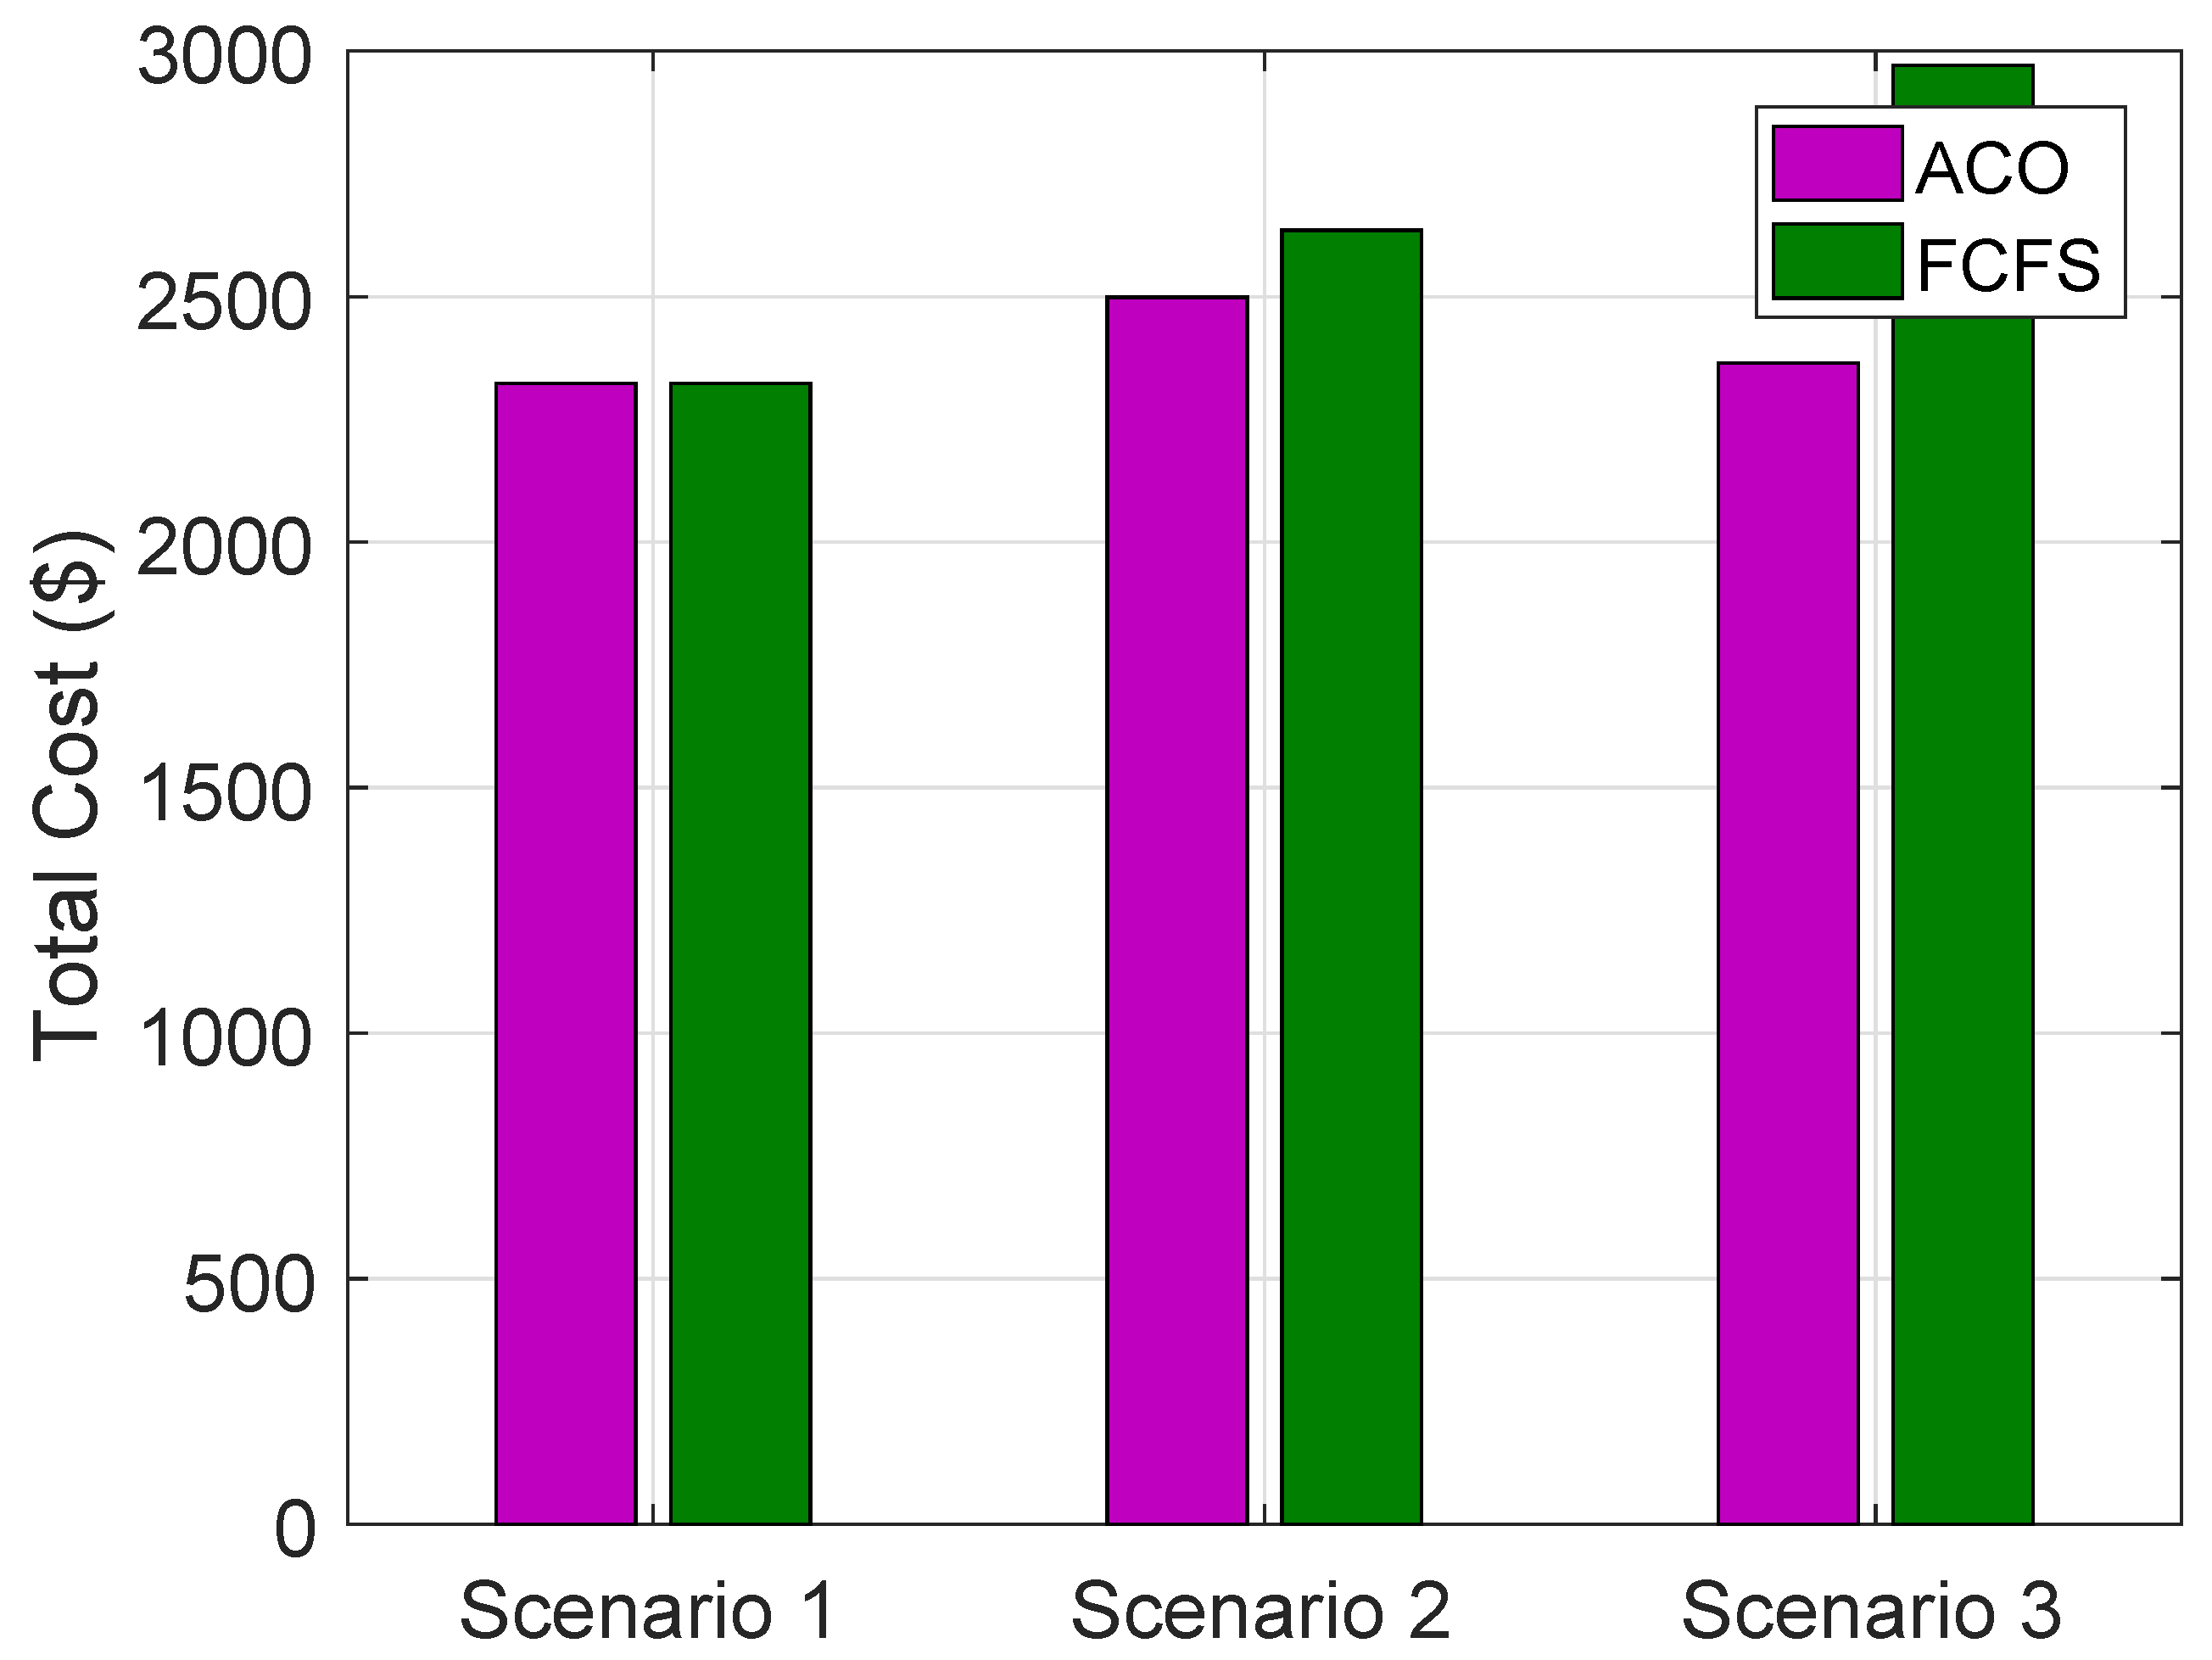
Total cost of VMs, MGs and DT for all scenarios using ACO and FCFS on HPFs for allocation of VMs to the requests of groups of buildings are shown in
Figure 10.
has the lowest cost as compared to
and
; however, overall cost with ACO is more optimized as compared to FCFS.
The increased number of VMs reduce the RT, PT and increase the cost; however, the simulation results show that RT, PT and cost are increased due to too many virtual resources on physical resources. Hence, too many virtual resources for physical resources compromise the system performance. The average RT and PT of Scenario 2 are longer than Scenario 1, while Scenario 3 has the longest RT and PT with the highest cost. Average RT using ACO of Scenario 3 is increased by 6.70% from and 5.05% from . Similarly, RT using ACO of is increased by 1.99% from . Average RT using FCFS of is increased by 3.28%, 4.23% from and , respectively. Similarly, average RT using FCFS of is increased by 1.10% from . Average PT using ACO in is increased by 43.87% and 21.07% as compared to and , respectively. Similarly, average PT using FCFS of is increased by 54.69% and 23.9% as compared to and , respectively. The cost using ACO for is the highest by 8.8% and 4.4% from and . However, using FCFS, the cost in is increased by 23.62% and 9.55% from and , respectively. Similarly, cost in using FCFS is increased by 15.55% from . The higher time complexity of ACO is due to the number of iterations performed to find an appropriate solution; hence, ACO is problem-oriented and take a longer time for request allocation and FCFS is simple, timely and an availability based load balancer. Moreover, too many virtual resources on physical resource affect the cost and performance.
The simulations of the scenarios show that cloud-based systems are very slow as compared to the cloud-fog based systems. The cloud based system has 41.72% to 44.14%, 63.40% to 66.98% and 81.71% to 82.81% slower response as compared to the cloud-fog based system in , and , respectively. Similarly, 46.21% to 49.46%, 66.21% to 69.23% and 81.14% to 82.66% the cloud based system has a slower response as compared to a cloud-fog based system using an FCFS load balancer in , and , respectively. RT using ACO of is 37.78% and 67.38 more efficient as compared to and , respectively, similarly, 40.05% and 67.56% using FCFS. The PT of using ACO and FCFS are 52.13% and 52.71% more efficient as compared to . Similarly, PT using ACO and FCFS of are 73.07% and 63.29% more efficient as compared to .

 ,
, 


