Article

The Economic Feasibility of Passive Houses in Korea

1
Department of Civil and Environmental System Engineering, Sungkyunkwan University, 2066, Seobu-ro, Jangan-gu, Suwon 16419, Korea
2
Department of Architectural Engineering, Sungkyunkwan University, 2066, Seobu-ro, Jangan-gu, Suwon 16419, Korea
3
Center for Built Environment, Sungkyunkwan University, 2066, Seobu-ro, Jangan-gu, Suwon 16419, Korea
*
Authors to whom correspondence should be addressed.
Sustainability 2018, 10(10), 3558; https://doi.org/10.3390/su10103558
Submission received: 29 August 2018 / Revised: 30 September 2018 / Accepted: 1 October 2018 / Published: 4 October 2018

Abstract

:
The number of passive houses and zero-energy buildings being developed is increasing, as measures to reduce the rapidly increasing building energy consumption. While government building policies focus on energy savings, investors and the building market emphasize the initial investment cost. These conflicting perspectives obstruct the development of passive houses in the building market. In this study, a series of building energy analyses, including the effect of energy saving measures and economic information considering long-term economic benefit and incentives policy, will be presented. Analyses were performed on the energy-saving measures needed to improve the performance of single-family houses in Korea to that of the passive house standard, as well as the energy saving effect and increased cost. The application of energy saving measures for passive house implementation resulted in an additional cost of 1.85–4.20% compared to the conventional reference house. In addition, the proposed passive house alternative shows a short payback period and life cycle cost (LCC) result, compared to a conventional building’s life cycle period. The possibility of passive house implementation is high, and developing the passive house is affordable for the investor or end user in Korea.

1. Introduction

The building sector accounts for more than one-third of the total global energy consumption, and the projected increase in total energy use will be increased more than two-fold in the near future. Consequently, global building energy consumption could increase by 50% by 2050 [1]. Most countries have national policies and regulations to reduce building energy consumption and promote the passive house in the building market. The term passive house generally refers to a type of low-energy house [2,3]. Recently, the subdivided criteria of passive house are suggested according to the reducible energy demand by applying renewable energy sources and improved appliances [4]. Among the various definitions of the passive house, the most widely known concept of passive house is the 1.5 L house. It means that the heating energy requirement of the passive house should be less than 15 kWh/m2·year, with a heating load of less than 10 W/m2 [5]. The concept of the passive house has been adopted by more than 40 countries and institutions, and it is the basis of the building energy policies in the world [6,7,8,9]. Moreover, the physical performance criteria of the zero-energy building, a building with zero net energy consumption, is proposed as an intensified building energy-saving measures based on the physical standards of the passive house [10]. Therefore, the implementation of the passive house is a key issue in achieving the international goal of reducing carbon emissions in the building sector.
In order to reduce building energy at the national level, general action plans in the building market for passive house implementation have been devised. The aims of these action plans are as follows: (1) to strengthen the performance of the building envelope [11,12,13,14,15], (2) to apply energy-efficient HVAC systems [16,17,18,19,20], and (3) to apply renewable energy systems [21,22,23,24]. With the efforts and policies for building energy saving at the national level and active global discussions on energy issues, the interest by builders and investors in the passive house has also increased in the building market. However, the construction status of the world’s passive house construction by year [25] is static despite an increase in policy and social interest; i.e., investors have major barriers to overcome when investing in passive house projects.
Previous studies [26,27,28,29,30,31] revealed that the reason why the spread of passive houses in the building market is so slow is that the passive house [32], although suggested as having only a “slightly higher investment cost”, actually involves excessive investment costs, which is a major barrier [33]. Zhang et al. [29] mentioned that the implementation of green elements for property development projects involves various barriers that are absent in conventional buildings, such as the higher cost of green appliance design and energy-saving materials, lengthy planning and approval process for new green technologies and recycled materials, and the lack of familiarity with green technologies, resulting in delays in the design and construction process. Overall, the high additional cost is considered to be the strongest barrier for applying green technologies in China. With similar results, Osmani et al. [31] carried out a questionnaire survey and in-depth semi-structured interviews with the major UK housing developers, with results showing that the lack of data relating to the cost of zero carbon homes and a shortage of financial incentives were recognized by 78% and 71% of the survey participants, respectively, as being significant or major barriers to delivering zero carbon homes in England.
In most countries, an incentive policy is established to encourage the participation of investors in implementing passive houses [8]. Despite the energy-saving advantages of building a passive house, high investment costs, ambiguous investment cost information, and limited incentive policies result in deterring investor participation in passive house projects.
The main goal of the building energy policy in many countries is the reduction of building energy. Therefore, most newly constructed buildings are designed to satisfy only the energy performance of the building as required by the building code [34]. In addition, the amount of available economic information, which plays an important role in the decision-making of the investor and end user, is inefficient [35]. In the market, investors and end users make economy-based decisions, and their role in green building activity is gradually increasing [36]. Therefore, providing reasonable investment cost and appropriate cost information is critical for increasing investor participation in the low-energy building market [37,38].
Actually, the initial investment cost of the passive house varies greatly depending on the region according to the energy consumption status, climatic conditions, and national financial environment [39]. Also, the initial investment cost of the passive house varies greatly even in the same area, depending on the energy reduction technologies proposed by the builder. Therefore, a valuation of an energy performance feature of the passive house or zero-energy building is needed to determine total cost occurred during whole life cycle period on building. The importance of including the energy certification of buildings in property valuation may, in turn, motivate an improvement in energy efficiency in housing and an improvement in the environment in general [40].

2. Building Energy State in South Korea

South Korea is the ninth largest energy consuming country in the world, accounting for 2% (6th) of the global CO2 emissions [41]. The building sector accounts for about 26% of the total energy consumption [42] and half (50.6%) of the building energy consumed is used in residential building sectors in Korea [43]. The energy consumption rate of a residential building in Korea is very high [44], and its projected energy consumption rate is the fastest-increasing among the Asia-Pacific region [43]. The Korean government planned a national energy-saving roadmap aimed at achieving a passive house standard by 2017, and a zero-energy building standard to be introduced in 2025 [45].
An action plan called the Building Design Criteria for Energy Saving (BDCES) is a mandatory regulation for new construction of buildings in Korea. BDCES comprises sets of energy-saving design criteria as follows: 1 Construction Design Criteria (thermal insulation and heat resistance requirement for the building envelope); 2 Machinery design (indicators for calculating heating/cooling capacity design, district heating connections, and installed pump or fan performance); 3 Electric Facility (use of efficient transformers, motors, and lighting); and 4. Renewable Energy Facility Design (installation of renewable technologies) [46]. BDCES was first proposed in 2001 and is now mandatory for all types of buildings where high energy consumption is expected. The BCDES plan has been continuously strengthened for achieving the passive house and zero-energy building criteria, and the applications have been extended. The requirements for achieving a zero-energy building standard in Korea as follows [47];
a.
Prerequisite: Buildings that require zero-energy building certification must be buildings with an energy efficiency rating of 1++ or 1+++ (Table 1).
b.
Level: Zero-energy building (ZEB) level is divided into five levels according to the ratio of renewable (primary) energy rate for the required primary energy (kW/m2·year), as shown in Table 2.
Along with the BCDES, the Korean government is disseminating passive houses through obligation and incentive policies [48]. Despite the government policy and growing public interest in the green building market [49], the participation of end users in the Korean building market is low (Figure 1). The main reason is the limit of the building energy policy, which does not reflect the requirements of the Korean building market. The design criteria and energy-saving materials, as green technologies used to implement the passive house in the Korean building market, are not fully prepared at this point. This results in a strong dependency of foreign high-efficiency energy reduction technologies and results in high initial investment costs in implementing the passive house project in Korea [50]. Another obstacle to the dissemination of passive houses in the Korean housing market is the very short life span of Korean building. The average useful life of building is 26 years in Korea. Also, while long-term economic saving is generated by the reduction of building energy cost in a passive house, the high initial investment cost renders it difficult to ensure cost recovery during the building’s life cycle in Korea [51,52].
For this reason, developers tend to construct a building at the level that meets the regulatory performance, rather than at the passive house level. Also, compliance with the building energy performance regulation (BDCES) is only mandatory for buildings with a floor area of 500 m2, or more, in Korea. Therefore, single or detached family houses, which consume a high level of energy and account for about 36 percent of all buildings in Korea [54], are not subject to BDCES. Since the sensitivity of initial investment cost is high in the Korean building market, it is very important for consumers to provide information on economic efficiency based on accurate energy analysis in passive house projects in Korea.

3. Research Method

The purpose of this study is to present the information required in the decision-making process for constructing a passive house from the viewpoint of the client. The analytical method determines the energy performance of various energy-saving measures for achieving a passive house and its economic benefits. By analyzing the building energy consumption at reference building, the proper energy-saving measures for achieving passive house standard will be suggested. Economic analysis is performed of the initial investment cost, long-term energy cost saving effect, and incentive.

3.1. Energy Performance Analysis

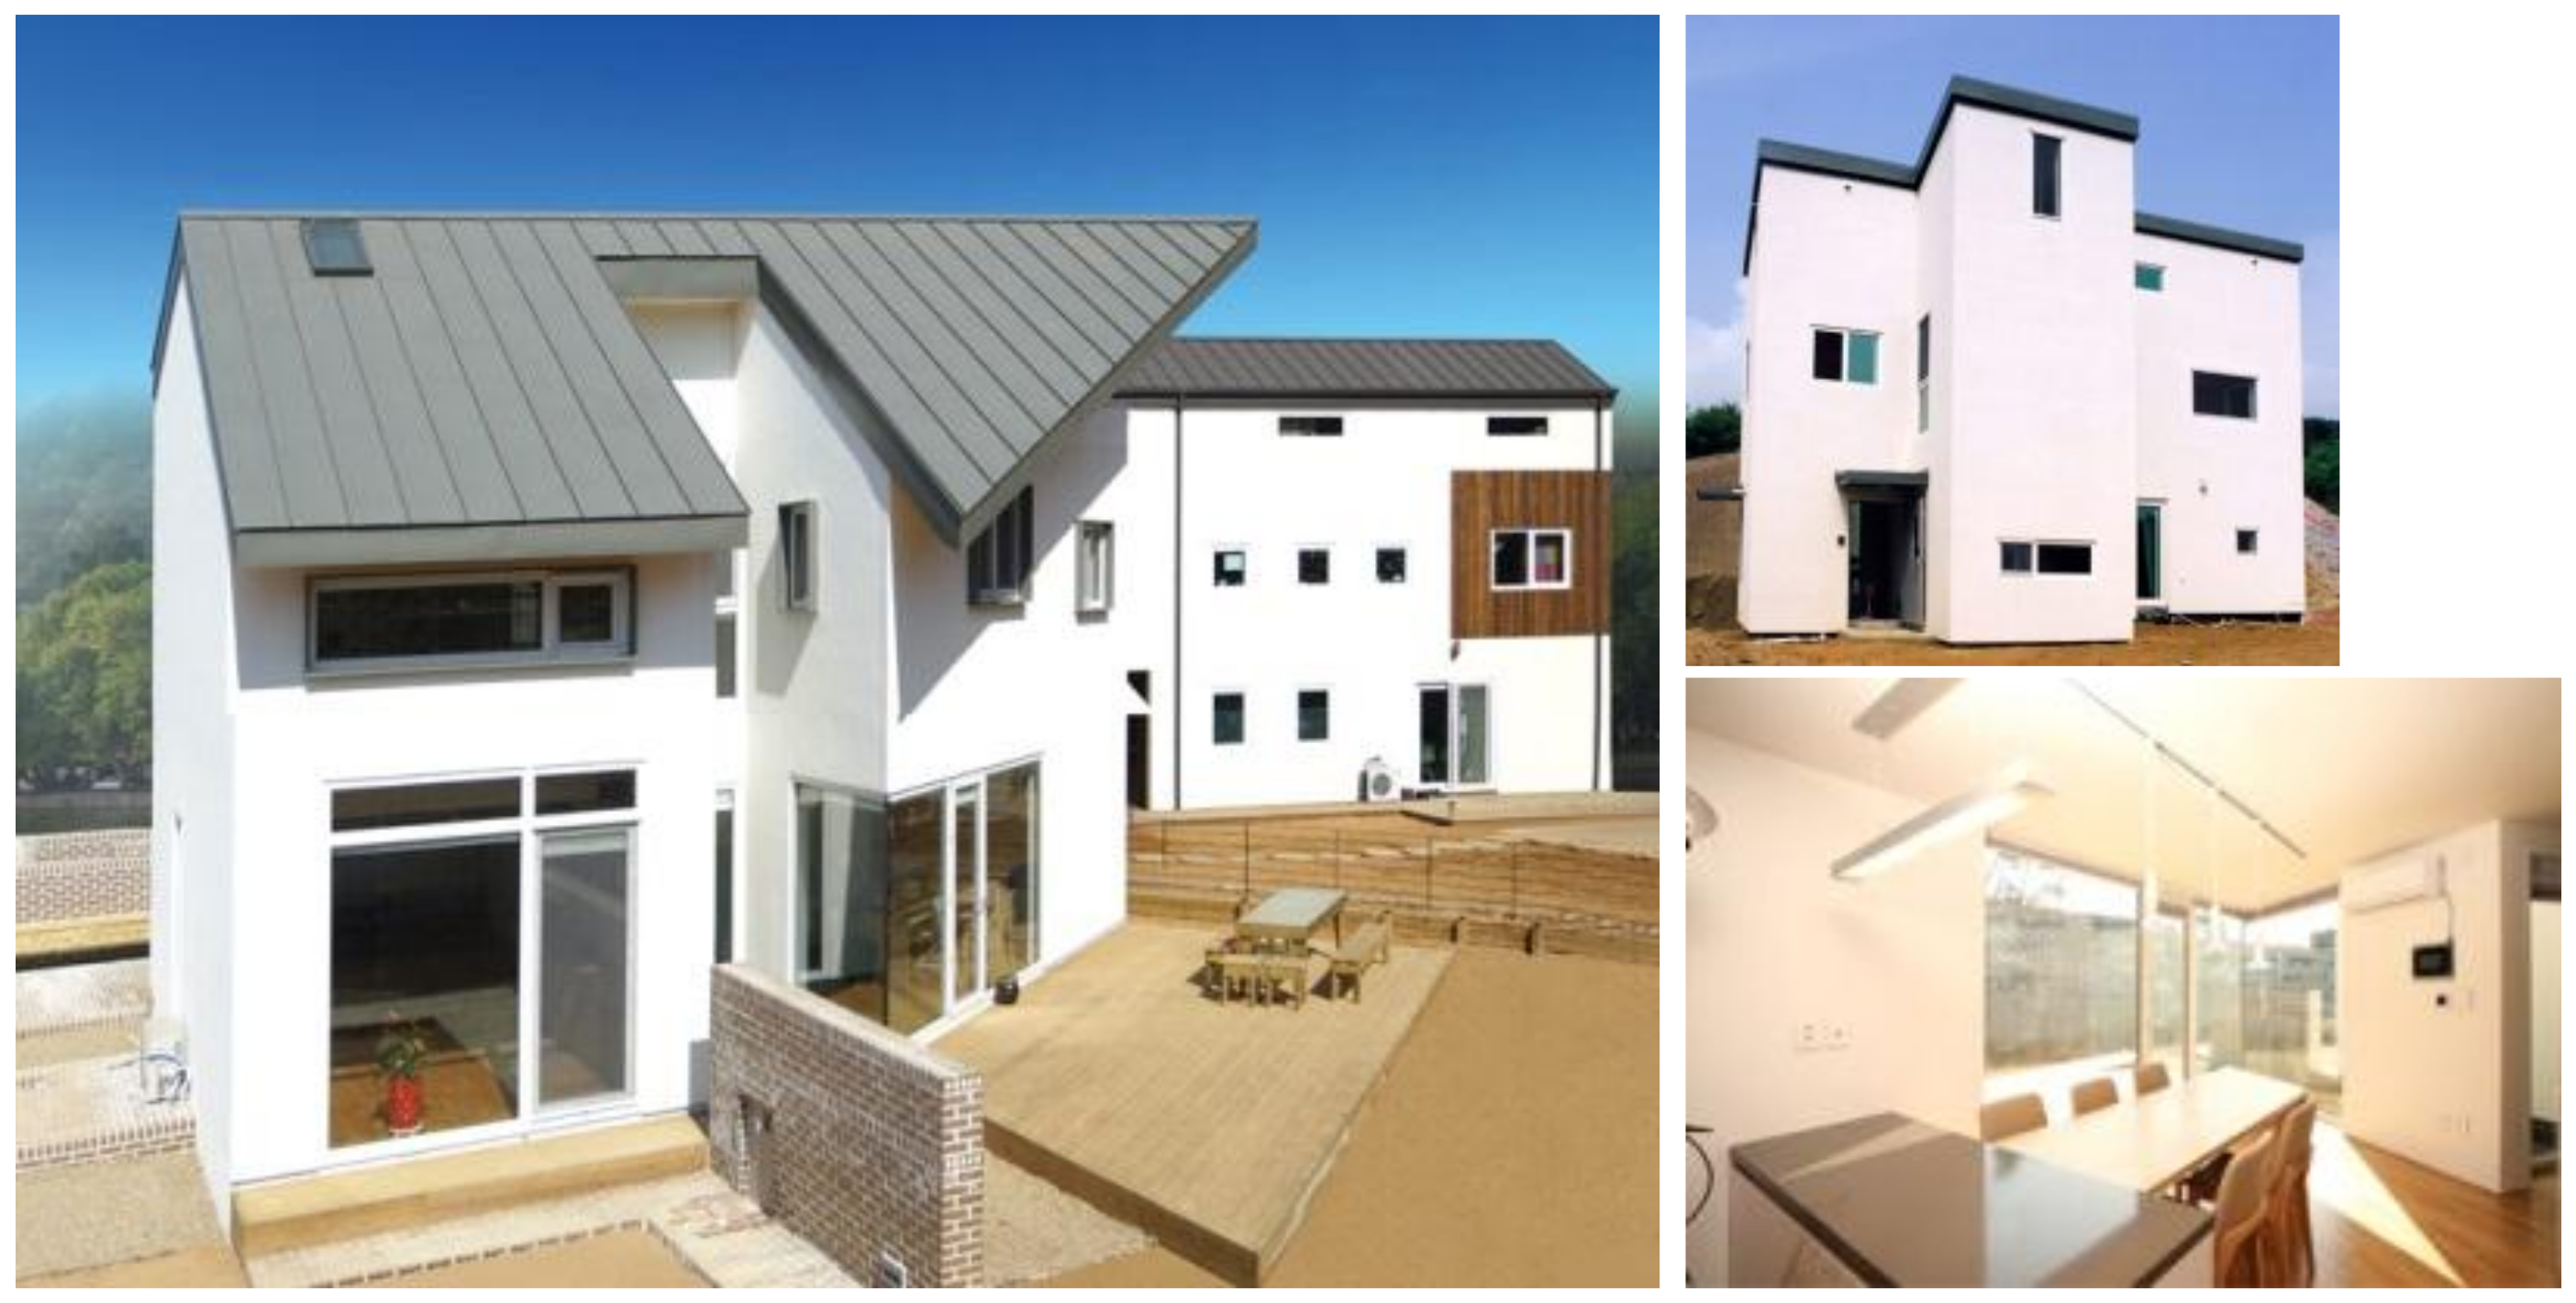
Analysis was carried out on the energy-saving effect of various measures to improve the performance of the single family house to reach that of the passive house in the Korean building market. The reference building to be analyzed is a single family (4 person) detached house, completed in 2014, and consists of one basement floor and two ground floors, located in Yangpyeong, Gyeonggi province, South Korea (Figure 2). The reference building faces south and has a total floor area of 177.98 m2. The residential building in Korea should be satisfied building thermal performance criteria [47]. The thermal performance of the reference building is good compared to the existing residential building in Korea (Table 3). Initial investment costs were USD 194,161, excluding land costs.
The building energy performance analysis was conducted by EnergyPlus [55]. A typical weather data in Yangpyeong is used for analyzing with the building energy simulation. The input data for the simulation are shown in Table 3. The internal heat gain is based on the heat level data of the residential building provided by the Ministry of Land, Infrastructure, and Transport of Korea. The intensity and operating time of the lighting were sourced from the lighting intensity data of residential buildings provided by ASHRAE [56]. The infiltration rate of the reference building is based on a previous study [57] based on the measurement data of new-construction buildings in Korea. The ventilation system is not installed in the reference building, because ventilation system is not obligatory in single family or detached houses in Korea. The insulation performance of the reference building and the HVAC system were input data based on the design and construction data of the reference building.

3.2. Economic Feasibility

Various energy-saving measures are applied to implement the passive house. In the long term, as the energy reduction rate increases, the economic feasibility increases, but the excessive initial cost increases, hindering the spread of passive house constructions. The decision-making process according to the appropriate financial level, between the economic advantage in the short term and that in the long term, is important in a building market centered on passive houses. Therefore, information on the economic feasibility features of the passive house should be provided for the end-user’s decision making. This information includes the short-term investment-cost change and the long-term economic advantage due to the application of energy-saving measures for building passive houses.
A variety of building economics analysis methods have been proposed and applied [2,60,61]. In this study, economic analysis was used based on past economic fluctuation information, which has been used for 5 years [62] in the building industry, and can be easily understood by the end user [63]. The economic analysis method based on building energy-saving measures was carried out using a payback period analysis showing the result of the principal payback period and the life cycle cost (LCC) analysis showing the financial advantage generated during the building life cycle.
LCC analysis should consider the economic fluctuation per period, which consists of interest, energy inflation rate, and core producer price. Economic fluctuation information should be reflected, along with the appropriate price information. However, because it is difficult to predict the future economic fluctuation due to various influences, economic fluctuation data were based on historical data. Table 4 shows the general conditions for analyzing economic feasibility of a passive house in Korea. The energy inflation rate is divided into electricity and natural gas. The interest value was set at 1.5%, reflecting the change in interest rates over the last five years in Korea [64], and the electricity inflation rate was similarly set at 3.3% [65]. The natural gas charge in Korea varies depending on the season, whereby the natural gas inflation rate increases in winter and decreases in summer. The natural gas inflation rate was 3.76% based on the average inflation rate over the past 5 years [66]. The core producer price measures the change in the selling price of goods and services sold by producers, and is used to reflect price fluctuation rate of products in the LCC analysis. The core producer price rate was estimated to be 1.5% based on the change in the origin price index of Korea in the last five years [67].

4. Energy Performance Analysis

4.1. Energy Consumption Status at the Reference Building

The energy consumption and peak heating loads of the reference buildings were analyzed to compare the passive house performance criteria [5]. The simulation results were compared with the actual heating energy consumption data of the reference building.
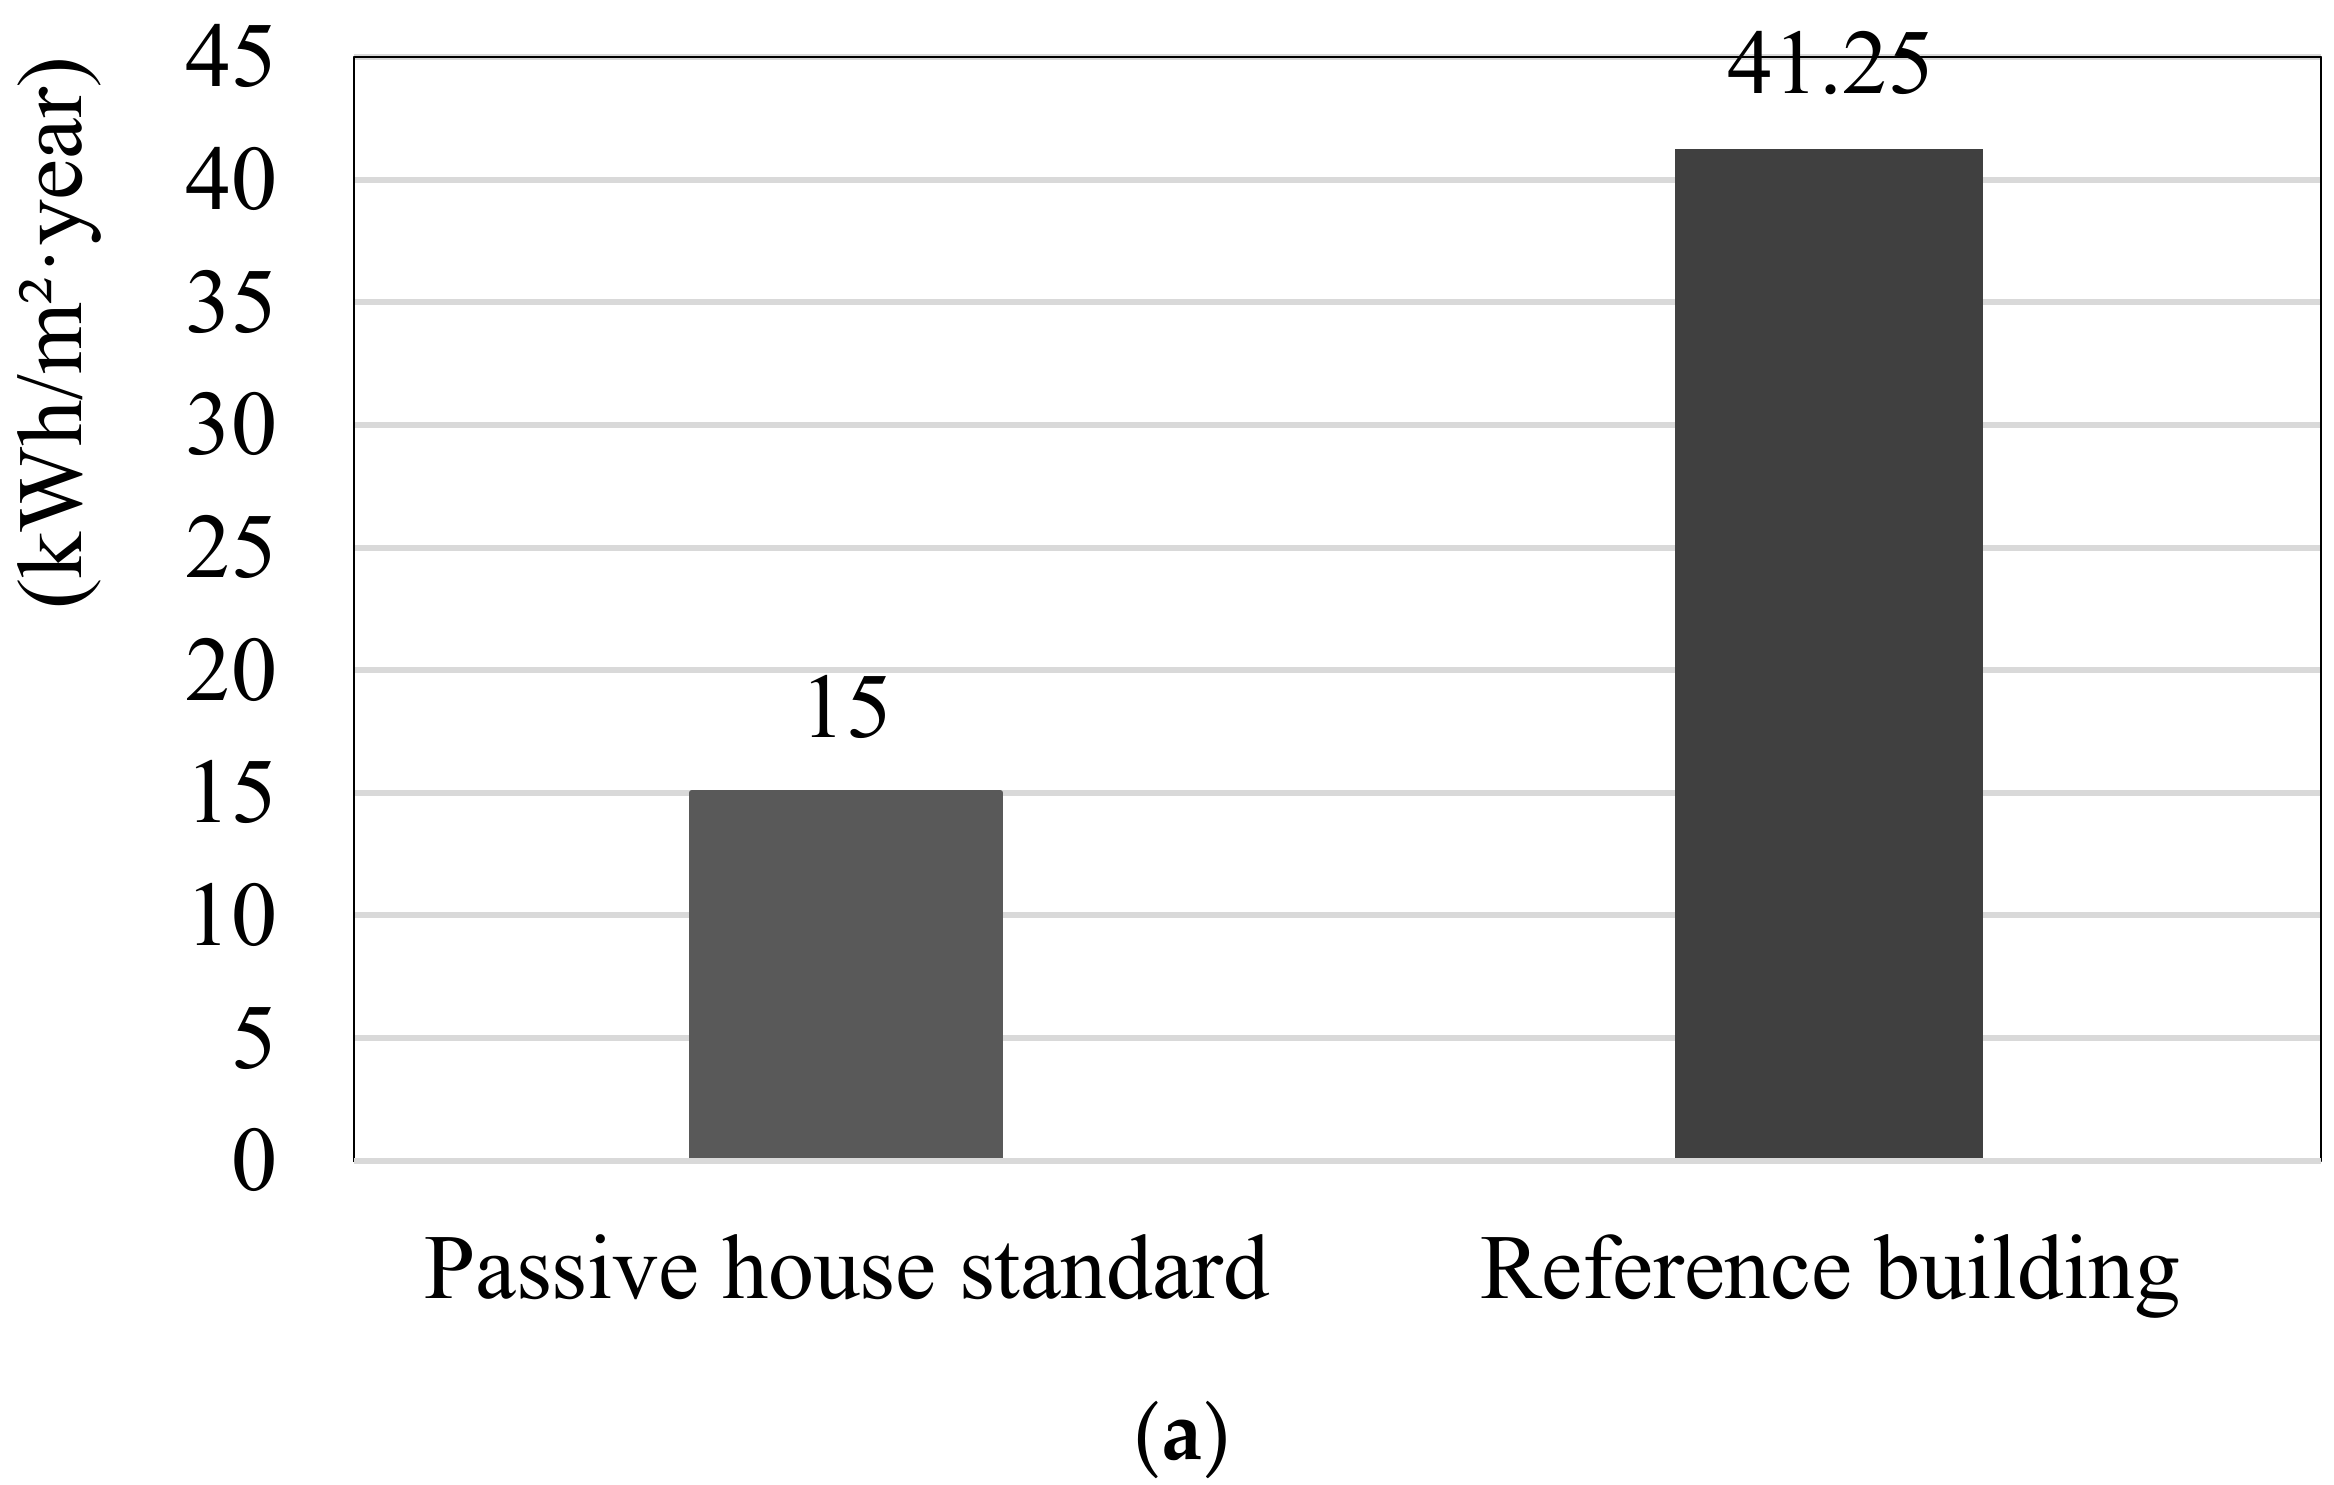
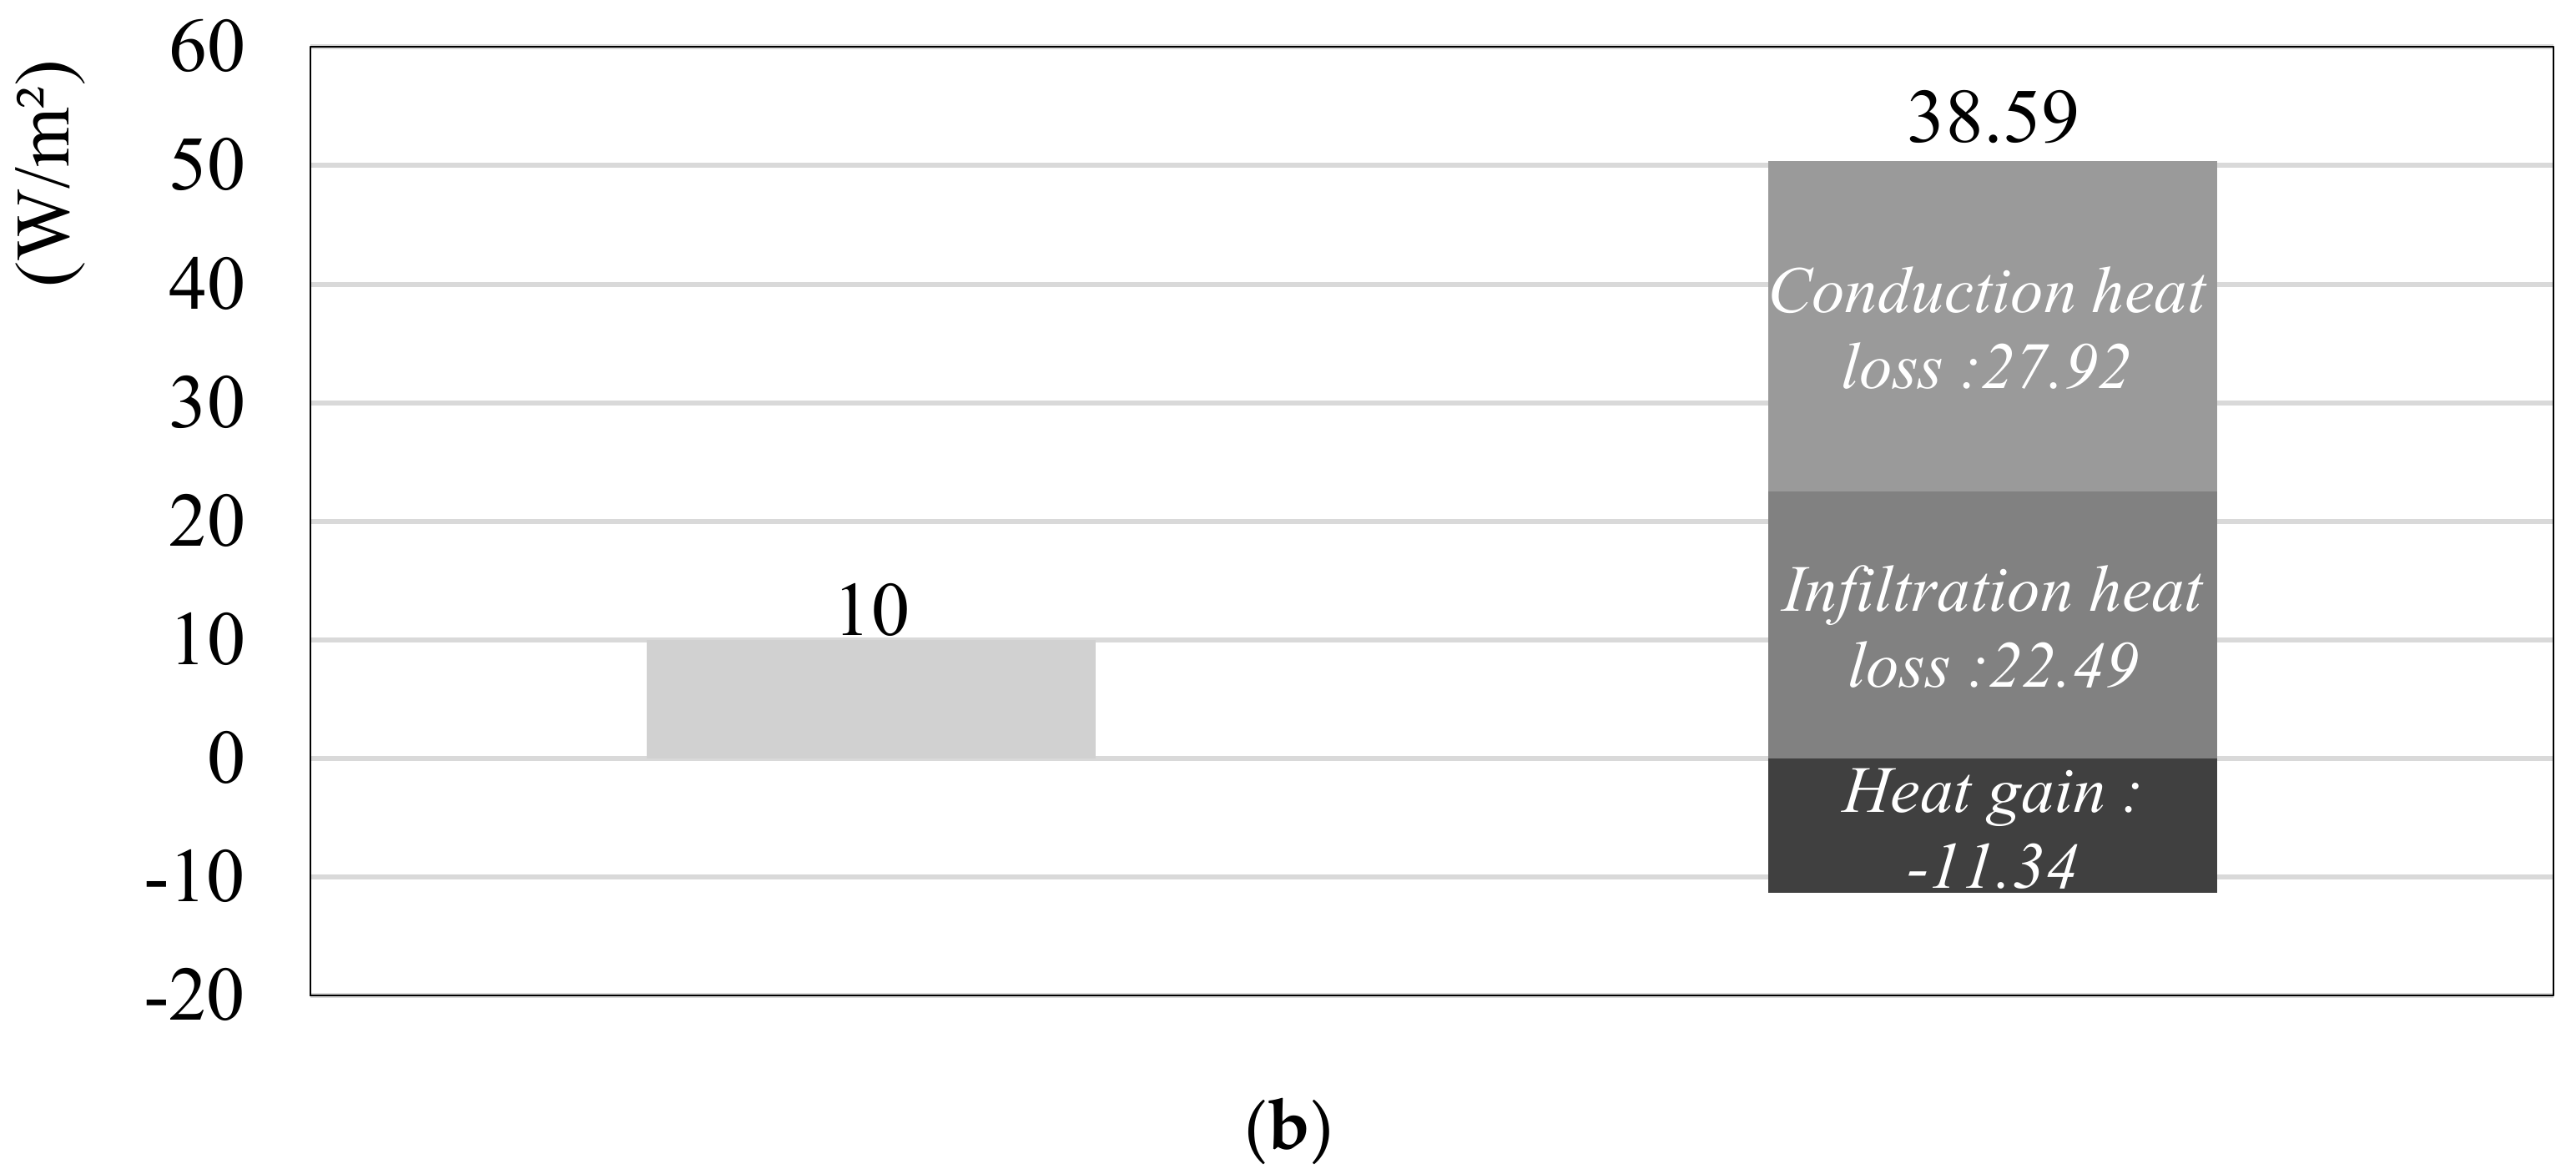
The annual heating energy consumption of the reference building is estimated at 41.25 kWh/m2·year. The average heating energy consumption of the reference building is reduced by 41% compared to the average heating energy demand of the residential building in Korea (98.50 kWh/m2·year). This is 2.75 times higher than the passive house standard (15 kWh/m2·year), as shown in Figure 3a. The peak heating load of the reference building is 38.95 W/m2, which is 3.9 times higher than the passive house standard (10 W/m2). Although the thermal performance of the envelope in the reference building is superior to that in the existing residential building in Korea, it shows higher heating energy consumption and peak heating load than the passive house standard. About 45% of the peak heating load was caused by infiltration, as shown in Figure 3b.
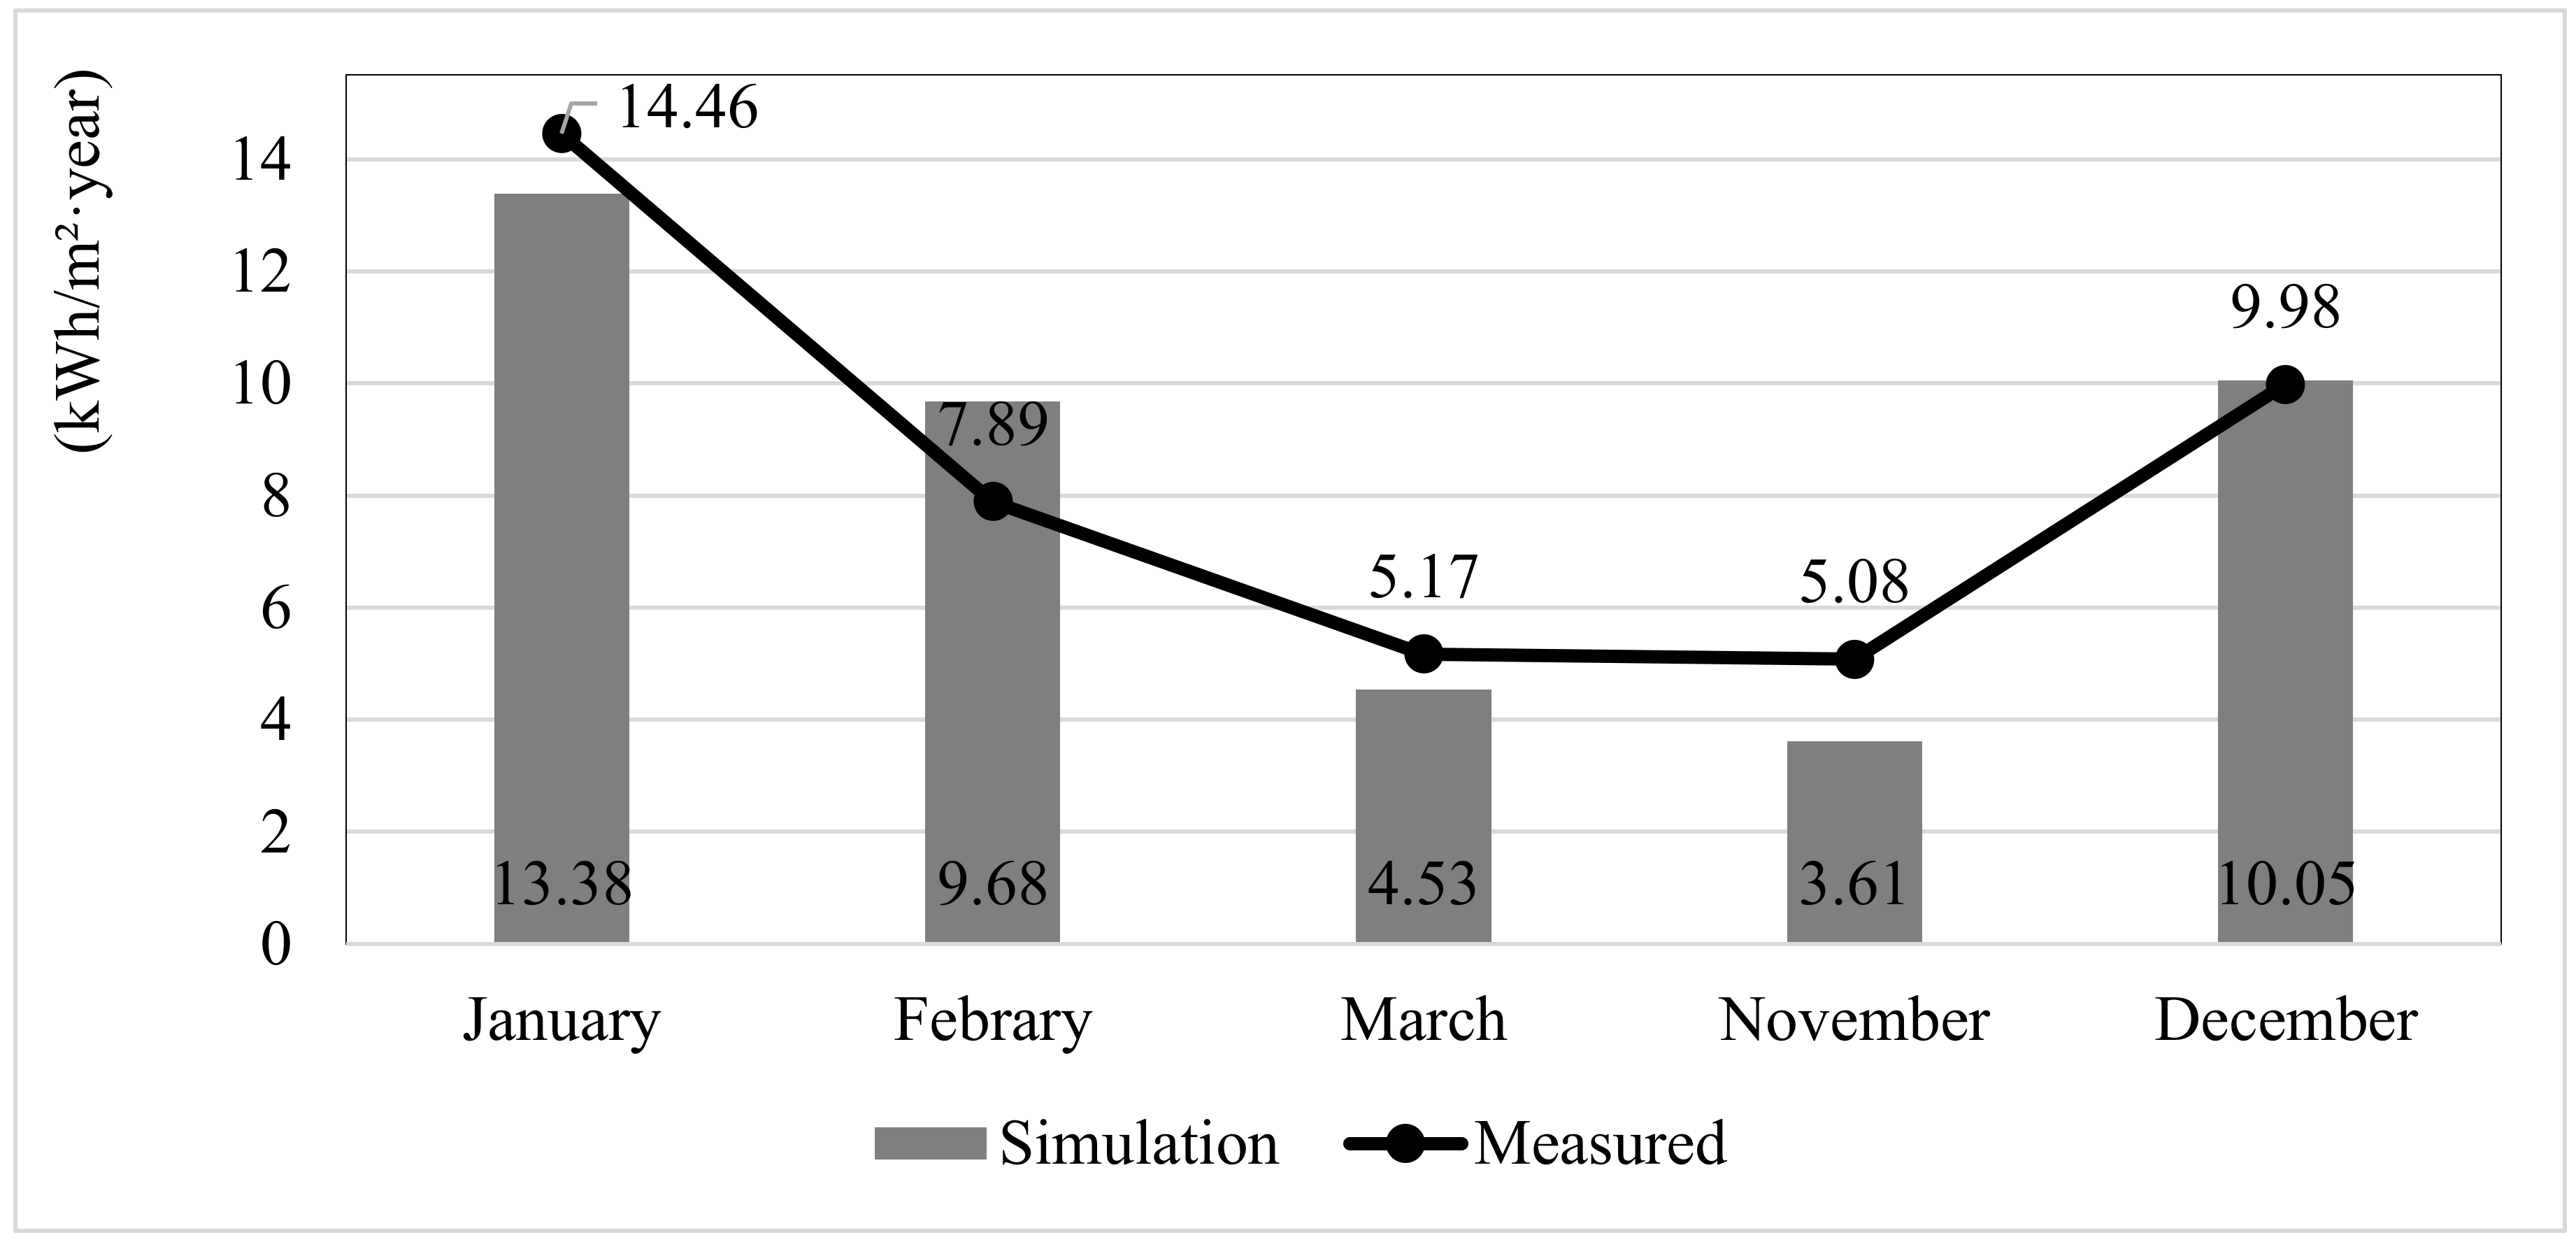
Building energy models must be calibrated to closely represent the actual performance of modeled buildings. Calibration can significantly improve the validity of and confidence in energy models, while being used to compare the cost-effectiveness of energy conservation measures (ECMs) in the design stage. Building energy simulation models are considered “calibrated” if they meet the internationally accepted criteria defined by ASHRAE Guideline 14 [68,69]. The actual heating energy use of the reference building for 5 months (November to March) was measured to calibrate the building energy model in this study. The predicted heating energy demand and actual usage are shown in Figure 4. When the mean bias error (MBE) is within ±5%, and the coefficient of variance of root mean squared error (CVRMSE) is less than 15%, the simulated result is seen as reliable. The MBE between the measured value and the predicted value of the reference building is 3.1%, and the CVRMSE is 13.8%. The energy prediction results, based on the simulation in this study, are reliable.

4.2. Energy-Saving Effect of the Measures

The analysis case is based on the energy-saving measures used to improve the level of energy performance of the referenced houses to reach that of the passive house (Table 5). The energy-efficient technology employed in the analyzed cases involved the enhancement of the airtightness and the installation of the energy recovery ventilator because the airtightness of the reference building is poor compared to that of the passive house.
Case 1 represents the current state of the reference building. Case 2 is the case where the airtightness performance is improved. Case 3 assumes the installation of an energy recovery ventilator. Case 3-1 represents the energy recovery ventilation (ERV) system currently applied in Korea and Case 3-2 represents the ERV system proposed in the passive house standard. In Case 3, the infiltration rate is not considered because positive air pressure is generated during the operation of the ventilation system.
Figure 5 shows the results of the heating energy demand according to analyzed cases with energy conservation measures. In Case 2, the heating energy demand is 29.26 kWh/m2·year. By enhancing airtightness performance in Case 2, the heating energy demand can be reduced by about 29% compared to the existing buildings (Case 1). However, more than 14 kWh/m2·year of heating energy demand is required, compared to the passive house standard. Cases 3-1 and 3-2 showed heating energy demands of 8.72 kWh/m2·year and 8.47 kWh/m2·year, respectively, and the heating energy demand is reduced by about 79%. Consequently, the heating energy demand of the reference building can be reduced under the passive house standard through the application of the technology of Case 3-1 and 3-2, where the ERV installation and proper ventilation rate are controlled.

5. Economic Analysis of ECMs

5.1. Payback Period and LCC Analysis

The details of the initial cost of each case are described here and shown in Table 6. In general, the cost of applying passive house technology can vary depending on the builder. In this study, additional cost data with application of each energy-saving measure are applied through consultation of the Passive House Institute Korea [74].
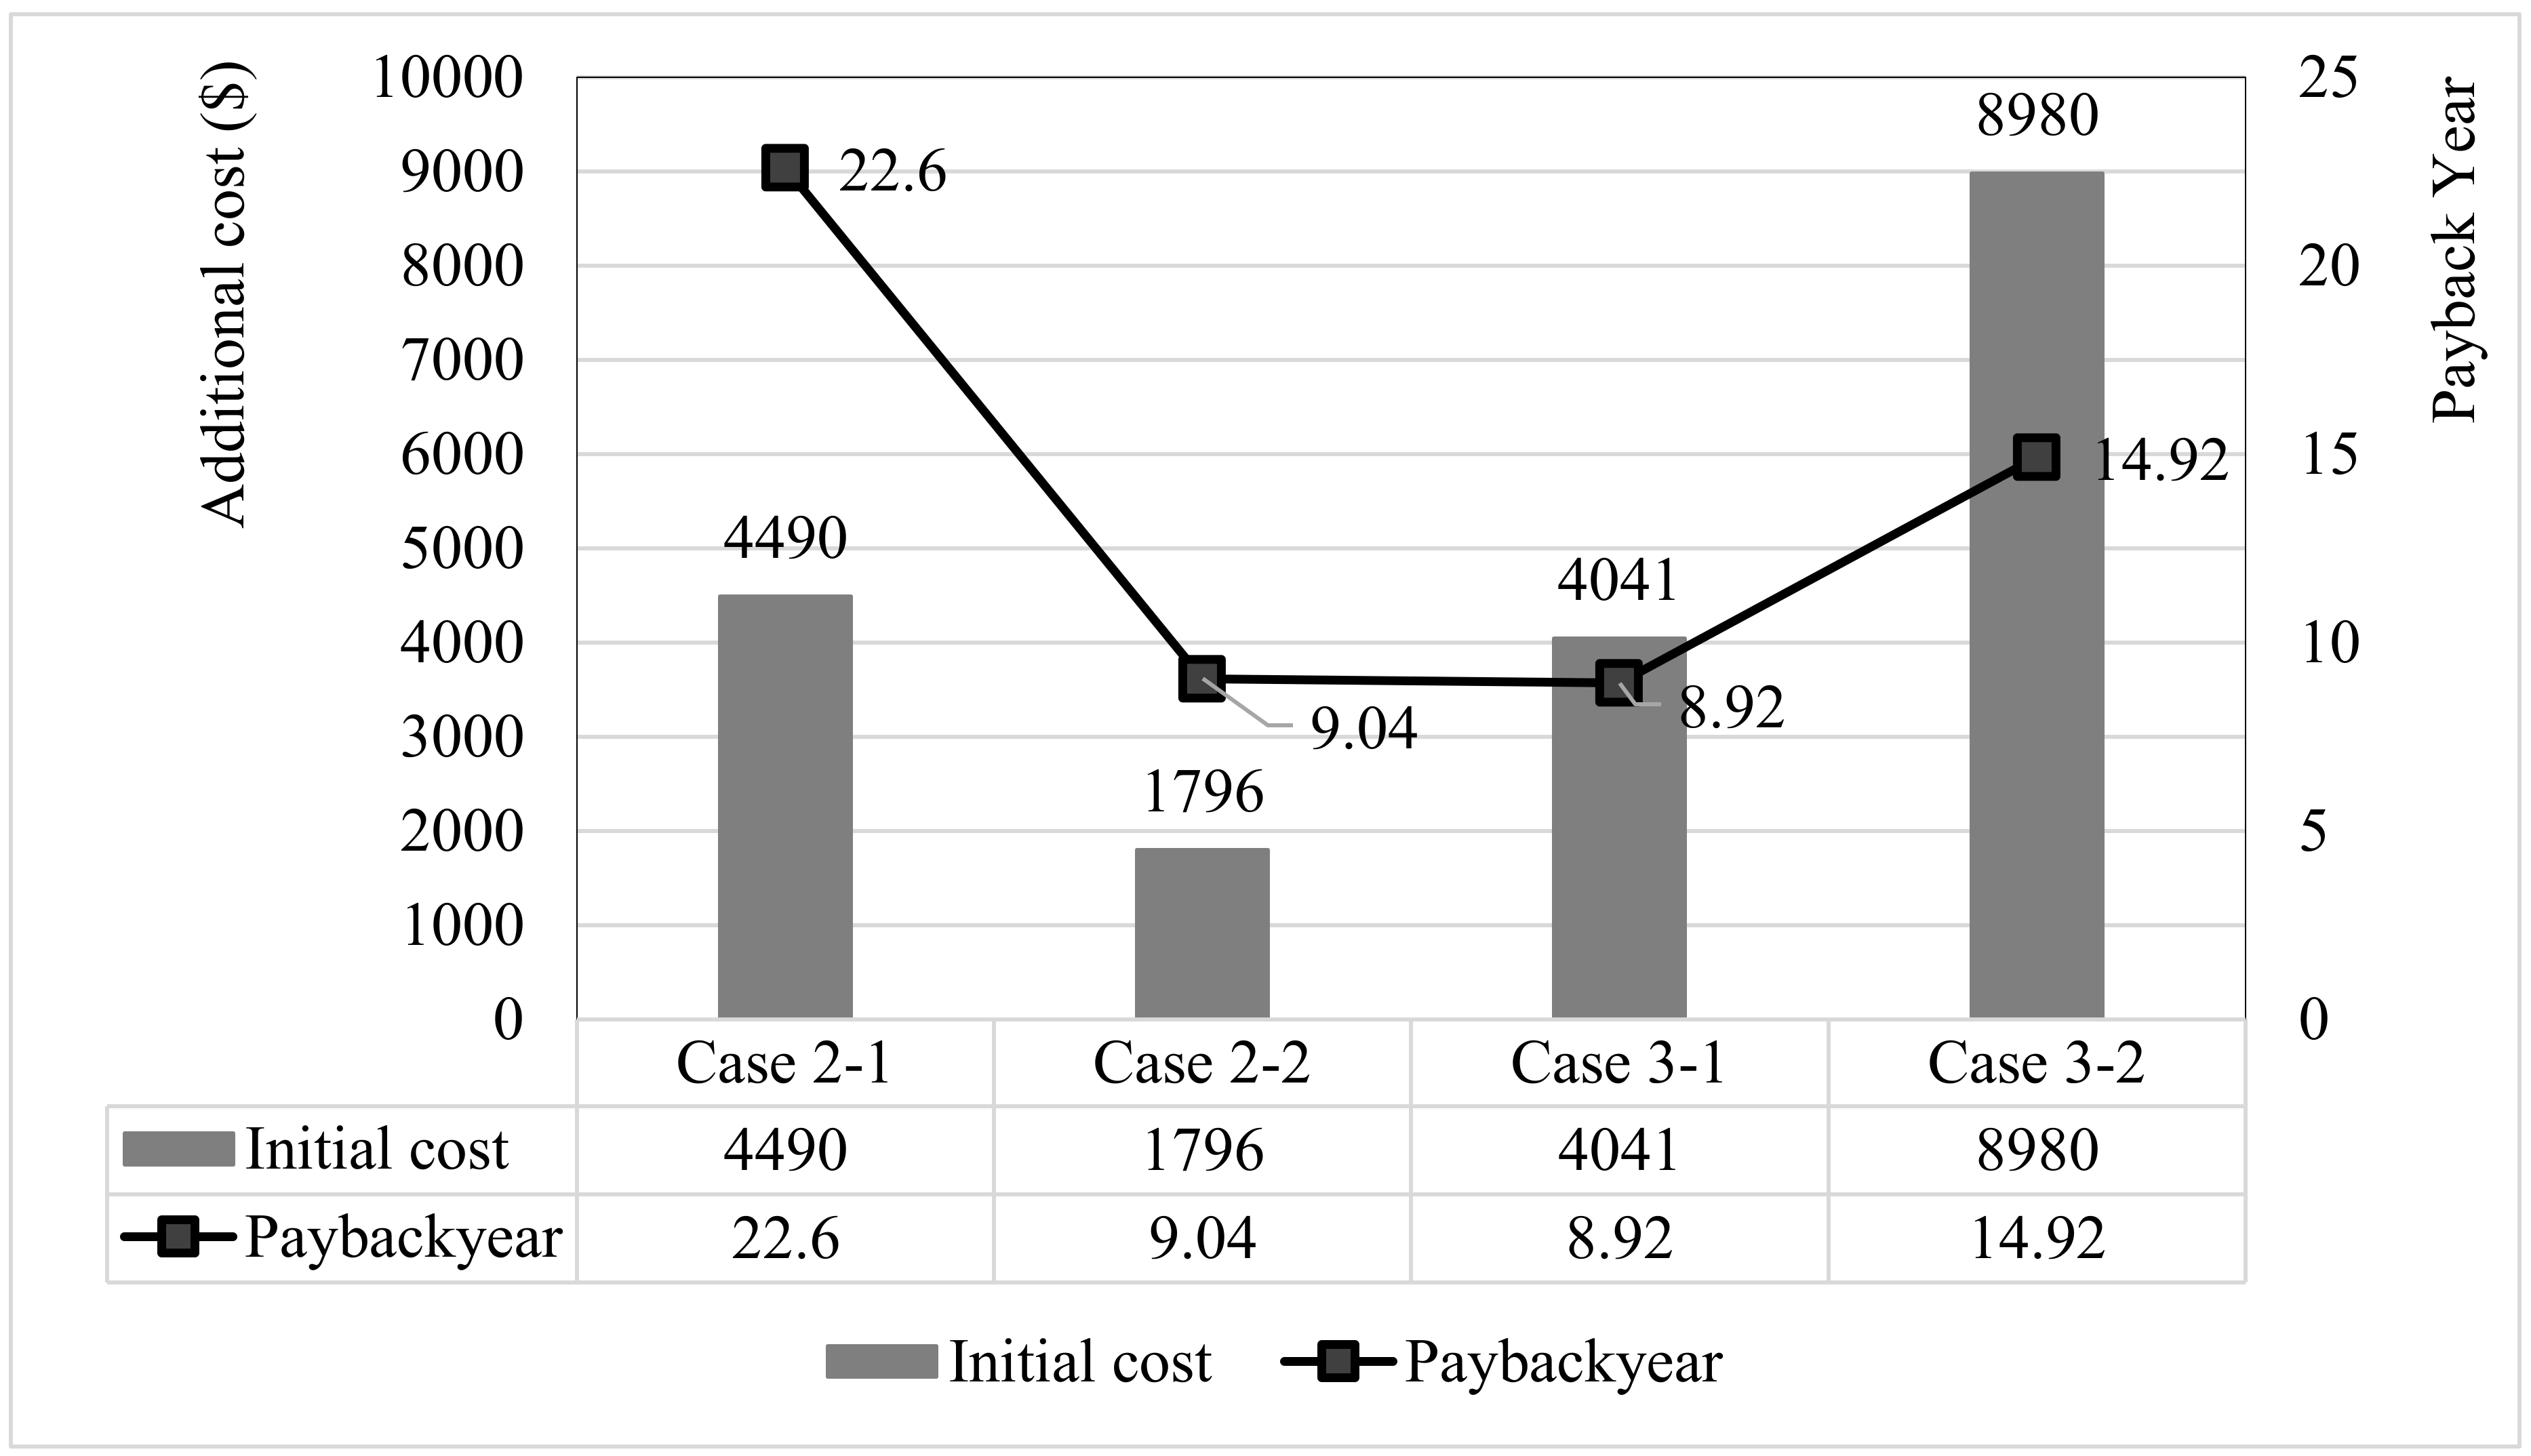
The operation period of the reference building was set at 27 years with reference to the average life cycle period of residential buildings in Korea [75]. The value of the building’s final disposal cost is set at 10% of the residual value [76]. The input data for the averaged maintenance costs are collected by the Korean government [77]. Case 3-2, with an ERV system satisfying the passive house performance criteria, showed the highest initial additional cost of USD 8980. The additional cost of Case 3-1, which satisfies the passive house performance criteria, was USD 4401. Since the ERV system satisfying the passive house criteria is not supplied in Korean market, most of the high-efficiency ERV system is imported from Germany. It imposes high additional cost for achieving passive house in Korea. The additional cost of Case 2-1, which shows improved airtightness compared to the reference building with its wooden structure, exceeds that of Case 3-1, with an additional cost of USD 4490, but does not satisfy the heating performance standard of the passive house. When the airtightness is improved by 0.6 ACH at 50 Pa of the concrete structure, the additional cost is the lowest at USD 1796, but the performance of the passive house is not satisfied.
Figure 6 shows the payback period based on the relationship between the additional investment cost and the energy cost reduction that is incurred according to the energy-saving measures of each case analyzed. Case 2-1 shows the longest payback period of 22.6 years. Case 2-2 showed the same energy reduction rate as that of Case 2-1, but the payback period was relatively short at 9.04 years, due to the low additional investment cost. In Case 3-1, assuming the Korean standard ERV system installation, the cost-saving rate by period was 35%, and the payback year was 8.92 years. Case 3-2, in which the passive house standard ERV system was used, showed a high cost saving rate (44%), but the payback period was 14.92 years due to the high additional investment cost.
The above results show that it is necessary to conduct a payback period analysis based on the cost savings considering the long-term as well as the initial investment cost, in order to make a reasonable decision about the energy-saving measures needed to achieve a passive house.
Table 7 shows the results of the LCC analysis according to the energy-saving measures of the reference building. Economic analysis results can be derived for LCC analysis by numerically converting the economic advantage that incurs during the life cycle of the building. Case 2-1, which only shows an improved wooden structure and airtightness, was the least efficient in terms of LCC (USD −71.18) as a result of economic advantage, due to low energy reduction compared to the initial excess investment cost. Case 2-2, which shows the same energy performance as that of Case 2-1 but assumes concrete construction, achieves a final economic saving of USD 9105, due to the low investment cost level of 1/3 compared to that of Case 2-1. Case 3, in which the ERV system is installed, showed a relatively high additional investment cost, but achieved a high building energy reduction, resulting in a high economic saving level during the building operation period. The application of the Korean ERV system (Case 3-1) (which requires an additional investment cost of half that of the ERV system proposed in the passive house standard (Case 3-2)), offers the best economic advantage (USD 10,556). Among the analyzed measures, the measure (Case 3-1) controlling the ventilation rate through the installation of the Korean ERV system is the best strategy in terms of building energy performance and economic analysis.

5.2. Assessment of Incentive Policies

According to the Building Energy Efficiency Certification (BEEC) of Korea [78], the certification ranging from grade 7 to grade 1+++ (total of 10 levels), depending on the primary energy consumption of the building and the financial incentives for energy-efficient buildings is applied to buildings satisfying Grade 1 (less than 120 kWh/m2·year). Financial incentives of a 15% reduction in acquisition tax and a 3% reduction in property tax are provided when Grade 1 of the building energy efficiency criteria is met [79].
The effect of the incentive of energy-saving measures analyzed in this study was limited to the case of a primary energy consumption under 120 kWh/m2·year (1st grade of BEEC). Therefore, Case 2 was excluded. The incentive analysis was limited to the investment cost of the building. The reference building acquisition tax is 2.8% (USD 5436) of the initial investment cost, and the property tax calculated based on the tax base is USD 146.48. The end user would need to pay a total of USD 199,738.5.
Figure 7 shows the result of calculating the initial investment cost (including investment cost and tax) according to each energy-saving measure and the short-term economic advantage based on the acquisition of incentive. The figure shows the financial information about the costs borne by the end user by calculating the initial investment cost, taking into account the taxes and incentives of building construction. In Case 3-1, which is included in the incentive acquisition category, the total cost can be reduced by about 0.4% (USD 838.5) if incentive is supported. Consequently, Case 3-1 is classified as a passive house with an additional initial cost of about 1.85% (USD 3690) compared to the total cost of the reference building of Case 1. Incentive can be acquired in Case 3-2, in which the ERV system is installed, satisfying the passive house standard at a relatively high price in the Korean building market. The incentive benefit of USD 857.8 when compared to the initial cost, including the existing tax, provides a total initial cost of USD 208,120 for implementing Case 3-2. Practically, for the implementation of Case 3-2, the additional initial cost increase is USD 8381.8 (4.21%) compared to the total cost of the reference building.
Willingness to pay (WTP) represents the payable range by investors. According to the results for WTP for low-energy buildings by Dapaah et al. [80] in Singapore, the results indicate that a stated WTP for low-energy buildings of 5% extra investment can be considered a rational decision. The additional cost of the analysis cases, reaching the passive house standard reviewed in this study (Cases 3-1 and 3-2), was about 1.85%–4.20%. This result indicates that the two cases are within the range the end users are willing to pay. Passive house implementation requires a higher initial investment cost than that of a conventional building, but reasonable initial cost through incentive economic saving will enhance end-user participation.

6. Discussion and Conclusions

The number of passive houses and zero-energy buildings being constructed in Korea is growing at the government level and in the green building market as a measure to reduce the rapidly increasing consumption of building energy. This study reveals the limited ability of the government building energy policy to accommodate the requirement of the building market. In Korea, the building market emphasizes the initial investment cost and, consequently, hinders the expansion of the number of passive houses that represents low-energy building. The building market is affected by the government policy and the investors’ interests. The absence of economic information required by the investor for decision-making is the most significant obstacle to the implementation of the passive house. Since the improvement of the physical performance of a building to reduce building energy consumption affects the increase of investment cost, the optimization of both energy saving and economy is needed [81].
Energy-saving measures based on building energy consumption are needed to derive appropriate energy reduction and investment cost optimization. Based on this information, investors require information on the investment costs of developing passive houses, economic information considering long-term economic benefit, and incentives policy.
In this study, the energy-saving measures needed to improve the performance of single-family houses in Korea to the level of the passive house standard, and the energy saving and cost increase were analyzed. In addition, the economic feasibility of various passive house energy-saving measures was analyzed in terms of the life cycle of the building.
The annual heating energy consumption of the reference single-family house in this study is 2.75 times higher than that of the passive house standard (15 kWh/m2·year). The application of energy-saving measures for passive house implementation resulted in an additional initial cost of 1.85%–4.20% compared to the reference building. In addition, the proposed passive house alternatives show a short payback period and LCC result compared to the reference building’s life cycle period. The possibility of passive house implementation is high, and the passive house is acceptable, considering the WTP of Korean investors or end users.

Author Contributions

J.S. analyzed the research and wrote the draft preparation. D.S. conceived and supervised the project. J.K. reviewed and edited the preparation.

Acknowledgments

This research was supported by a grant (PJ012215042017) from the Cooperative Research Program for Agriculture Science and Technology Development funded by the Rural Development Administration of the Korean government.

Conflicts of Interest

The authors declare no conflict of interest.

References

  1. Dulac, J.; LaFrance, M.; Trudeau, N.; Yamada, H. Transition to Sustainable Buildings: Strategies and Opportunities to 2050; International Energy Agency (IEA): Paris, France, 2013; pp. 22–45. ISBN 978-92-62-20241-2. [Google Scholar]
  2. Audenaert, A.; De Cleyn, S.H.; Vankerckhove, B. Economic analysis of passive houses and low-energy houses compared with standard houses. Energy Policy 2008, 36, 47–55. [Google Scholar] [CrossRef]
  3. Mahdavi, A.; Doppelbauer, E. A performance comparison of passive and low-energy buildings. Energy Build. 2010, 42, 1314–1319. [Google Scholar] [CrossRef]
  4. Passive House Institute. Criteria for the Passive House, EnerPHit and PHI Lower Energy Building Standard. Available online: https://passiv.de/downloads/03_building_criteria_en.pdf (accessed on 9 September 2018).
  5. Passive House Institute. About Passive House—What is a Passive House? Available online: www.passiv.de (accessed on 8 July 2018).
  6. Bowerbank, A. SmartMarket Report: Global Green Building Trends-Market Growth and Perspectives from around the World; McGraw Hill Construction: New York, NY, USA, 2008; pp. 2–29. ISBN 978. [Google Scholar]
  7. Wei, X.; Shicong, Z. APEC 100 Best Practice Analysis of Nearly/Net Zero Energy Building; Asia-Pacific Economic Cooperation (APEC): Singapore, 2017; pp. 15–59. ISBN 978-981-11-3511-8. [Google Scholar]
  8. International Energy Agency (IEA). Modernising Building Energy Codes: To Secure Our Global Energy Future. Available online: www.iea.org (accessed on 8 July 2018).
  9. Hinge, A.; Cullen, A.; Neely, B.; Taylor, C. Building Energy Rating Schemes Around The World: What Do We Know? In Proceedings of the ACEEE Summer Study on Energy Efficiency in Buildings, Pacific Grove, CA, USA, 17–22 August 2014. [Google Scholar]
  10. PassREg Brochure. Defining the Nearly Zero Energy Building: Passive House + Renewables—Municipalities Lead the Way. Available online: www.passivehouse-international.org (accessed on 10 July 2018).
  11. Sadineni, S.B.; Madala, S.; Boehm, R.F. Passive building energy savings: A review of building envelope components. Renew. Sustain. Energy Rev. 2011, 15, 3617–3631. [Google Scholar] [CrossRef]
  12. Sozer, H. Improving energy efficiency through the design of the building envelope. Build. Environ. 2010, 45, 2581–2593. [Google Scholar] [CrossRef]
  13. Mwasha, A.; Williams, R.G.; Iwaro, J. Modeling the performance of residential building envelope: The role of sustainable energy performance indicators. Energy Build. 2011, 43, 2108–2117. [Google Scholar] [CrossRef]
  14. Aditya, L.; Mahlia, T.M.I.; Rismanchi, B.; Ng, H.M.; Hasan, M.H.; Metselaar, H.S.C.; Muraza, O.; Aditiya, H.B. A review on insulation materials for energy conservation in buildings. Renew. Sustain. Energy Rev. 2017, 73, 1352–1365. [Google Scholar] [CrossRef]
  15. Biswas, K.; Shrestha, S.S.; Bhandari, M.S.; Desjarlais, A.O. Insulation materials for commercial buildings in North America: An assessment of lifetime energy and environmental impacts. Energy Build. 2016, 112, 256–269. [Google Scholar] [CrossRef]
  16. Wang, Y.; Kuckelkorn, J.; Zhao, F.Y.; Liu, D.; Kirschbaum, A.; Zhang, J.L. Evaluation on classroom thermal comfort and energy performance of passive school building by optimizing HVAC control systems. Build. Environ. 2015, 89, 86–106. [Google Scholar] [CrossRef]
  17. Wang, Y.; Kuckelkorn, J.M.; Zhao, F.Y.; Mu, M.; Li, D. Evaluation on energy performance in a low-energy building using new energy conservation index based on monitoring measurement system with sensor network. Energy Build. 2016, 123, 79–91. [Google Scholar] [CrossRef]
  18. Figueiredo, A.; Figueira, J.; Vicente, R.; Maio, R. Thermal comfort and energy performance: Sensitivity analysis to apply the passive house concept to the Portuguese climate. Build. Environ. 2016, 103, 276–288. [Google Scholar] [CrossRef]
  19. Dodoo, A.; Gustavsson, L.; Sathre, R. Primary energy implications of ventilation heat recovery in residential buildings. Energy Build. 2011, 43, 1566–1572. [Google Scholar] [CrossRef]
  20. Fouih, Y.E.; Stabat, P.; Riviere, P.; Hoang, P.; Archambault, V. Adequacy of air-to-air heat recovery ventilation system applied in low energy buildings. Energy Build. 2012, 54, 29–39. [Google Scholar] [CrossRef]
  21. Badescu, V.; Staicovici, M.D. Renewable energy for passive house heating model of the active solar heating system. Energy Build. 2006, 38, 129–141. [Google Scholar] [CrossRef]
  22. Chan, H.Y.; Riffat, S.B.; Zhu, J. Review of passive solar heating and cooling technologies. Renew. Sustain. Energy Rev. 2010, 14, 781–789. [Google Scholar] [CrossRef]
  23. Badescu, V. Economic aspects of using ground thermal energy for passive house heating. Renew. Energy 2007, 32, 895–903. [Google Scholar] [CrossRef]
  24. Chel, A.; Janssens, A.; Paepe, M.D. Thermal performance of a nearly zero energy passive house integrated with the air-air heat exchanger and the earth-water heat exchanger. Energy Build. 2015, 96, 53–63. [Google Scholar] [CrossRef]
  25. Passive House Database. Certified Buildings Map. Available online: https://database.passivehouse.com/buildings/map/ (accessed on 10 July 2018).
  26. Williams, K.; Dair, C. What is stopping sustainable building in England? Barriers experienced by stakeholders in delivering sustainable development. Sustain. Dev. 2007, 15, 135–147. [Google Scholar] [CrossRef]
  27. World Wide Fund (WWF). Building towards Sustainability: Performance and Progress among the UK’s Leading Housebuilders. Available online: https://www.wwf.org.uk (accessed on 12 July 2018).
  28. Dowson, M.; Poole, A.; Harrison, D.; Susman, G. Domestic UK retrofit challenge: Barriers, incentives and current performance leading into the Green Deal. Energy Policy 2012, 50, 294–305. [Google Scholar] [CrossRef] [Green Version]
  29. Zhang, X.; Platten, A.; Shen, L. Green property development practice in China: Costs and barriers. Build. Environ. 2011, 46, 2153–2160. [Google Scholar] [CrossRef]
  30. Baek, C.; Park, S. Policy measures to overcome barriers to energy renovation of existing buildings. Renew. Sustain. Energy Rev. 2012, 16, 3939–3947. [Google Scholar] [CrossRef]
  31. Osmani, M.; O’Reilly, A. Feasibility of zero carbon homes in England by 2016: A house builder’s perspective. Build. Environ. 2009, 44, 1917–1924. [Google Scholar] [CrossRef] [Green Version]
  32. International Passive House Association (iPHA). Active for More Comfort: Passive House. Available online: www.passivehouse-international.org (accessed on 10 July 2018).
  33. Coyle, D. An Investigation into the Cost Optimality of the Passive House Retrofit Standard for Irish Dwellings Using Life Cycle Cost Analysis. J. Sustain. Des. Appl. Res. 2016, 4, 5–14. [Google Scholar]
  34. Pitts, A. Passive House and Low Energy Buildings: Barriers and Opportunities for Future Development within UK Practice. Sustainability 2017, 9, 272. [Google Scholar] [CrossRef]
  35. Gillingham, K.; Newell, R.G.; Palmer, K. Energy Efficiency Economics and Policy. Annu. Rev. Resour. Econ. 2009, 1, 597–620. [Google Scholar] [CrossRef] [Green Version]
  36. DODGE Data & Analytics. World Green Buildings Trends 2016: Developing Markets Accelerate Global Green Growth. Available online: www.construction.com (accessed on 15 July 2018).
  37. Halil, F.M.; Nasir, N.M.; Hassan, A.A.; Shukur, A.S. Feasibility Study and Economic Assessment in Green Building Projects. Procedia Soc. Behav. Sci. 2016, 222, 56–64. [Google Scholar] [CrossRef]
  38. Bause, K.; Radimersky, A.; Iwanicki, M.; Albers, A. Feasibility Studies in the Product Development Process. In Proceedings of the CIRP 24th Design Conference 2014, Milan, Italy, 14–16 April 2014. [Google Scholar]
  39. Frappe-Seneclauze, T.P.; Heerema, D.; Wu, K.T. Accelerating Market Transformation for High-Performance Building Enclosures: State of Market, Policy Developments, and Lessons Learned from the Passive House Movement; PEMBINA Institute: Calgary, AB, Canada, 2016; pp. 21–93. [Google Scholar]
  40. Berry, S.; Davidson, K. Zero energy homes—Are they economically viable? Energy Policy 2015, 85, 12–21. [Google Scholar] [CrossRef]
  41. BP Statistical Review of World Energy June 2016. Available online: http://www.bp.com (accessed on 11 July 2018).
  42. McNamara, K.; Robertson, A.; Cameron, R.; Nishida, Y.; Tonai, A.; Yabumoto, A. Energy Policies of IEA Countries: The Republic of Korea; International Energy Agency (IEA): Paris, France, 2012; pp. 15–48. ISBN 978. [Google Scholar]
  43. Nejat, P.; Jomehzadeh, F.; Taheri, M.M.; Gohari, M.; Majid, M.Z.A. A global review of energy consumption, CO2 emissions and policy in the residential sector (with an overview of the top ten CO2 emitting countries). Renew. Sustain. Energy Rev. 2015, 43, 843–862. [Google Scholar] [CrossRef]
  44. Korea Energy Economics Institute. Analysis of Building Energy Efficiency Elements in Market and Suggestion of Improvement Plan. Available online: http://www.keei.re.kr/ (accessed on 13 August 2018). (In Korean).
  45. Schuetze, T. Zero Emission Buildings in Korea-History, Status Quo, and Future Prospects. Sustainability 2015, 7, 2745–2767. [Google Scholar] [CrossRef]
  46. Evans, M.; Chon, H.; Shui, B.; Lee, S.E. Country Report on Building Energy Codes in Republic of Korea; Pacific Northwest National Laboratory: Oak Ridge, TN, USA, 2009; pp. 1–13. [Google Scholar]
  47. Korea Energy Agency. Available online: www.energy.or.kr/ (accessed on 16 August 2018).
  48. NRDC. Paris Climate Conference: South Korea. Available online: www.nrdc.org/ (accessed on 15 July 2018).
  49. Korean Government. Five-Year Plan for Green Growth. Available online: www.climate.go.kr/ (accessed on 17 July 2018).
  50. Vallentin, G.; Cho, Y.B. Cooperation passive house between planners in Korea and Germany. In Proceedings of the Internationale Passivhaustagung 2011, Innsbruck, Austria, 27–29 May 2011. [Google Scholar]
  51. Kim, S.W.; Cho, J.H.; Kwon, W.; Son, B.S.; Chun, J.Y. Status and Making Strategies for Comparative Analysis of the Domestic Passive House. Korea J. Constr. Eng. Manag. 2012, 11, 517–518. (In Korean) [Google Scholar]
  52. Construction & Building Technologies Korea Market Study. Available online: www.eu-gateway.eu (accessed on 17 July 2018).
  53. The Certified Status of Building Energy Rating System in 2017. Available online: www.molit.go.kr/ (accessed on 11 July 2018).
  54. Korean Statistical Information Service (KOSIS). Housing Type and Unit per Housing Area. Available online: www.kosis.kr/eng/ (accessed on 13 July 2018).
  55. Energyplus. Available online: https://www.energyplus.net (accessed on 10 July 2018).
  56. ASHRAE. ANSI/ASHRAE/IES Standard 90.1-2013, Energy Standard for Buildings Except Low-Rise Residential Buildings; American Society of Heating, Refrigerating and Air-Conditioning Engineers: Atlanta, GA, USA, 2013; pp. 87–103. [Google Scholar]
  57. Ahn, N.; Cho, M.G.; Choi, J.M. A study on airtightness performance analysis of low-energy house in Korea. J. Korean Sol. Energy Soc. 2013, 4, 334–338. (In Korean) [Google Scholar]
  58. Ministry of Land. Infrastructure and Transport. Building Design Criteria for Energy Saving. Available online: building.energy.or.kr (accessed on 20 July 2018). (In Korean)
  59. Ministry of Land. Infrastructure and Transport, the Regulation of Building Energy Efficiency Rating System: Residential Building and Non-Residential Building Usage Profile. Available online: https://www.energy.or.kr (accessed on 20 July 2018). (In Korean)
  60. Galvin, R. Are passive houses economically viable? A reality-based, subjectivist approach to cost-benefit analyses. Energy Build. 2014, 80, 149–157. [Google Scholar] [CrossRef]
  61. Badea, A.; Baracu, T.; Dinca, C.; Tutica, D.; Grigore, R.; Anastasiu, M. A life-cycle cost analysis of the passive house “POLITEHNICA” from Bucharest. Energy Build. 2014, 90, 542–555. [Google Scholar] [CrossRef]
  62. Raustad, R. Developing Natural Gas Cost Escalation Rates for the Associated Gas Distributors of Florida; Florida Solar Energy Center: Cocoa, FL, USA, 2010; pp. 1–16. [Google Scholar]
  63. Janis, R.; Tao, W. Mechanical and Electrical Systems in Buildings, 4th ed.; Pearson: New York, NY, USA, 2008; pp. 15–20. ISBN 978-0135130131. [Google Scholar]
  64. The Bank of Korea. Available online: www.bok.or.kr (accessed on 20 July 2018).
  65. Korea Electric Power Corporation (KEPCO). Available online: home.kepco.co.kr (accessed on 20 July 2018).
  66. Korea District Heating Corporation. Available online: www.kdhc.co.kr (accessed on 20 July 2018).
  67. Korea National Statistical Office. Consumer Price Index. Available online: http://www.index.go.kr (accessed on 20 July 2018).
  68. Hong, T.; Langevin, J.; Sun, K. Building simulation: Ten challenges. Build. Simul. 2018, 11, 871–898. [Google Scholar] [CrossRef] [Green Version]
  69. ASHRAE. ASHRAE Guideline 14-2002: Measurement of Energy and Demand Savings; American Society of Heating, Refrigerating and Air-Conditioning Engineers: Atlanta, GA, USA, 2002; pp. 10–21. [Google Scholar]
  70. Feist, W.; Schnieders, J.; Dorer, V.; Haas, A. Re-inventing air heating: Convenient and comfortable within the frame of the Passive House concept. Energy Build. 2005, 37, 1186–1203. [Google Scholar] [CrossRef]
  71. DIN. DIN 1946-6:2009-05: Raumlufttechnik—Teil 6: Lüftung von Wohnungen; Beuth: Berlin, Germany, 2009; pp. 1–125. ISBN 9783410252139. [Google Scholar]
  72. Policies Related to Energy-Using Machinery. Equipment or Materials and Energy-Related Machinery, Equipment or Materials. Available online: http://www.data.go.kr/ (accessed on 20 July 2018).
  73. Pfluger, R.; Hasper, W.; Feist, W.; Rojas-Kopeinig, G. Energy and Cost Efficient Ventilation Systems with Heat Recovery-State of the Art and Enhancement (DE-13-021). In Proceedings of the 2013 ASHRAE Annual Conference, Denver, CO, USA, 22–26 June 2013. [Google Scholar]
  74. Passive House Institute Korea. Available online: http://www.phiko.kr/ (accessed on 15 July 2018).
  75. KICT. The Research about Building Life Cycle and Management Strategies. Available online: http://www.ndsl.kr/ (accessed on 16 July 2018). (In Korean).
  76. Woodward, D.G. Life Cycle costing-theory, information acquisition and application. Int. J. Proj. 1997, 15, 335–344. [Google Scholar] [CrossRef]
  77. Korea Apartment Management System. Comparison of the Whole Country and Average Value. Available online: http://www.k-apt.go.kr (accessed on 15 July 2018).
  78. Korea Energy Agency. Available online: http://www.energy.or.kr/ (accessed on 22 July 2018).
  79. Korea Productivity Center Quality Assurance. Available online: http://www.kpcqa.or.kr (accessed on 22 July 2018).
  80. Zalejska-Jonsson, A. Stated WTP and rational WTP: Willingness to pay for green apartments in Sweden. Sustain. Cities Soc. 2014, 13, 45–56. [Google Scholar] [CrossRef]
  81. Hsu, D. How much information disclosure of building energy performance is necessary? Energy Policy 2014, 64, 263–272. [Google Scholar] [CrossRef]
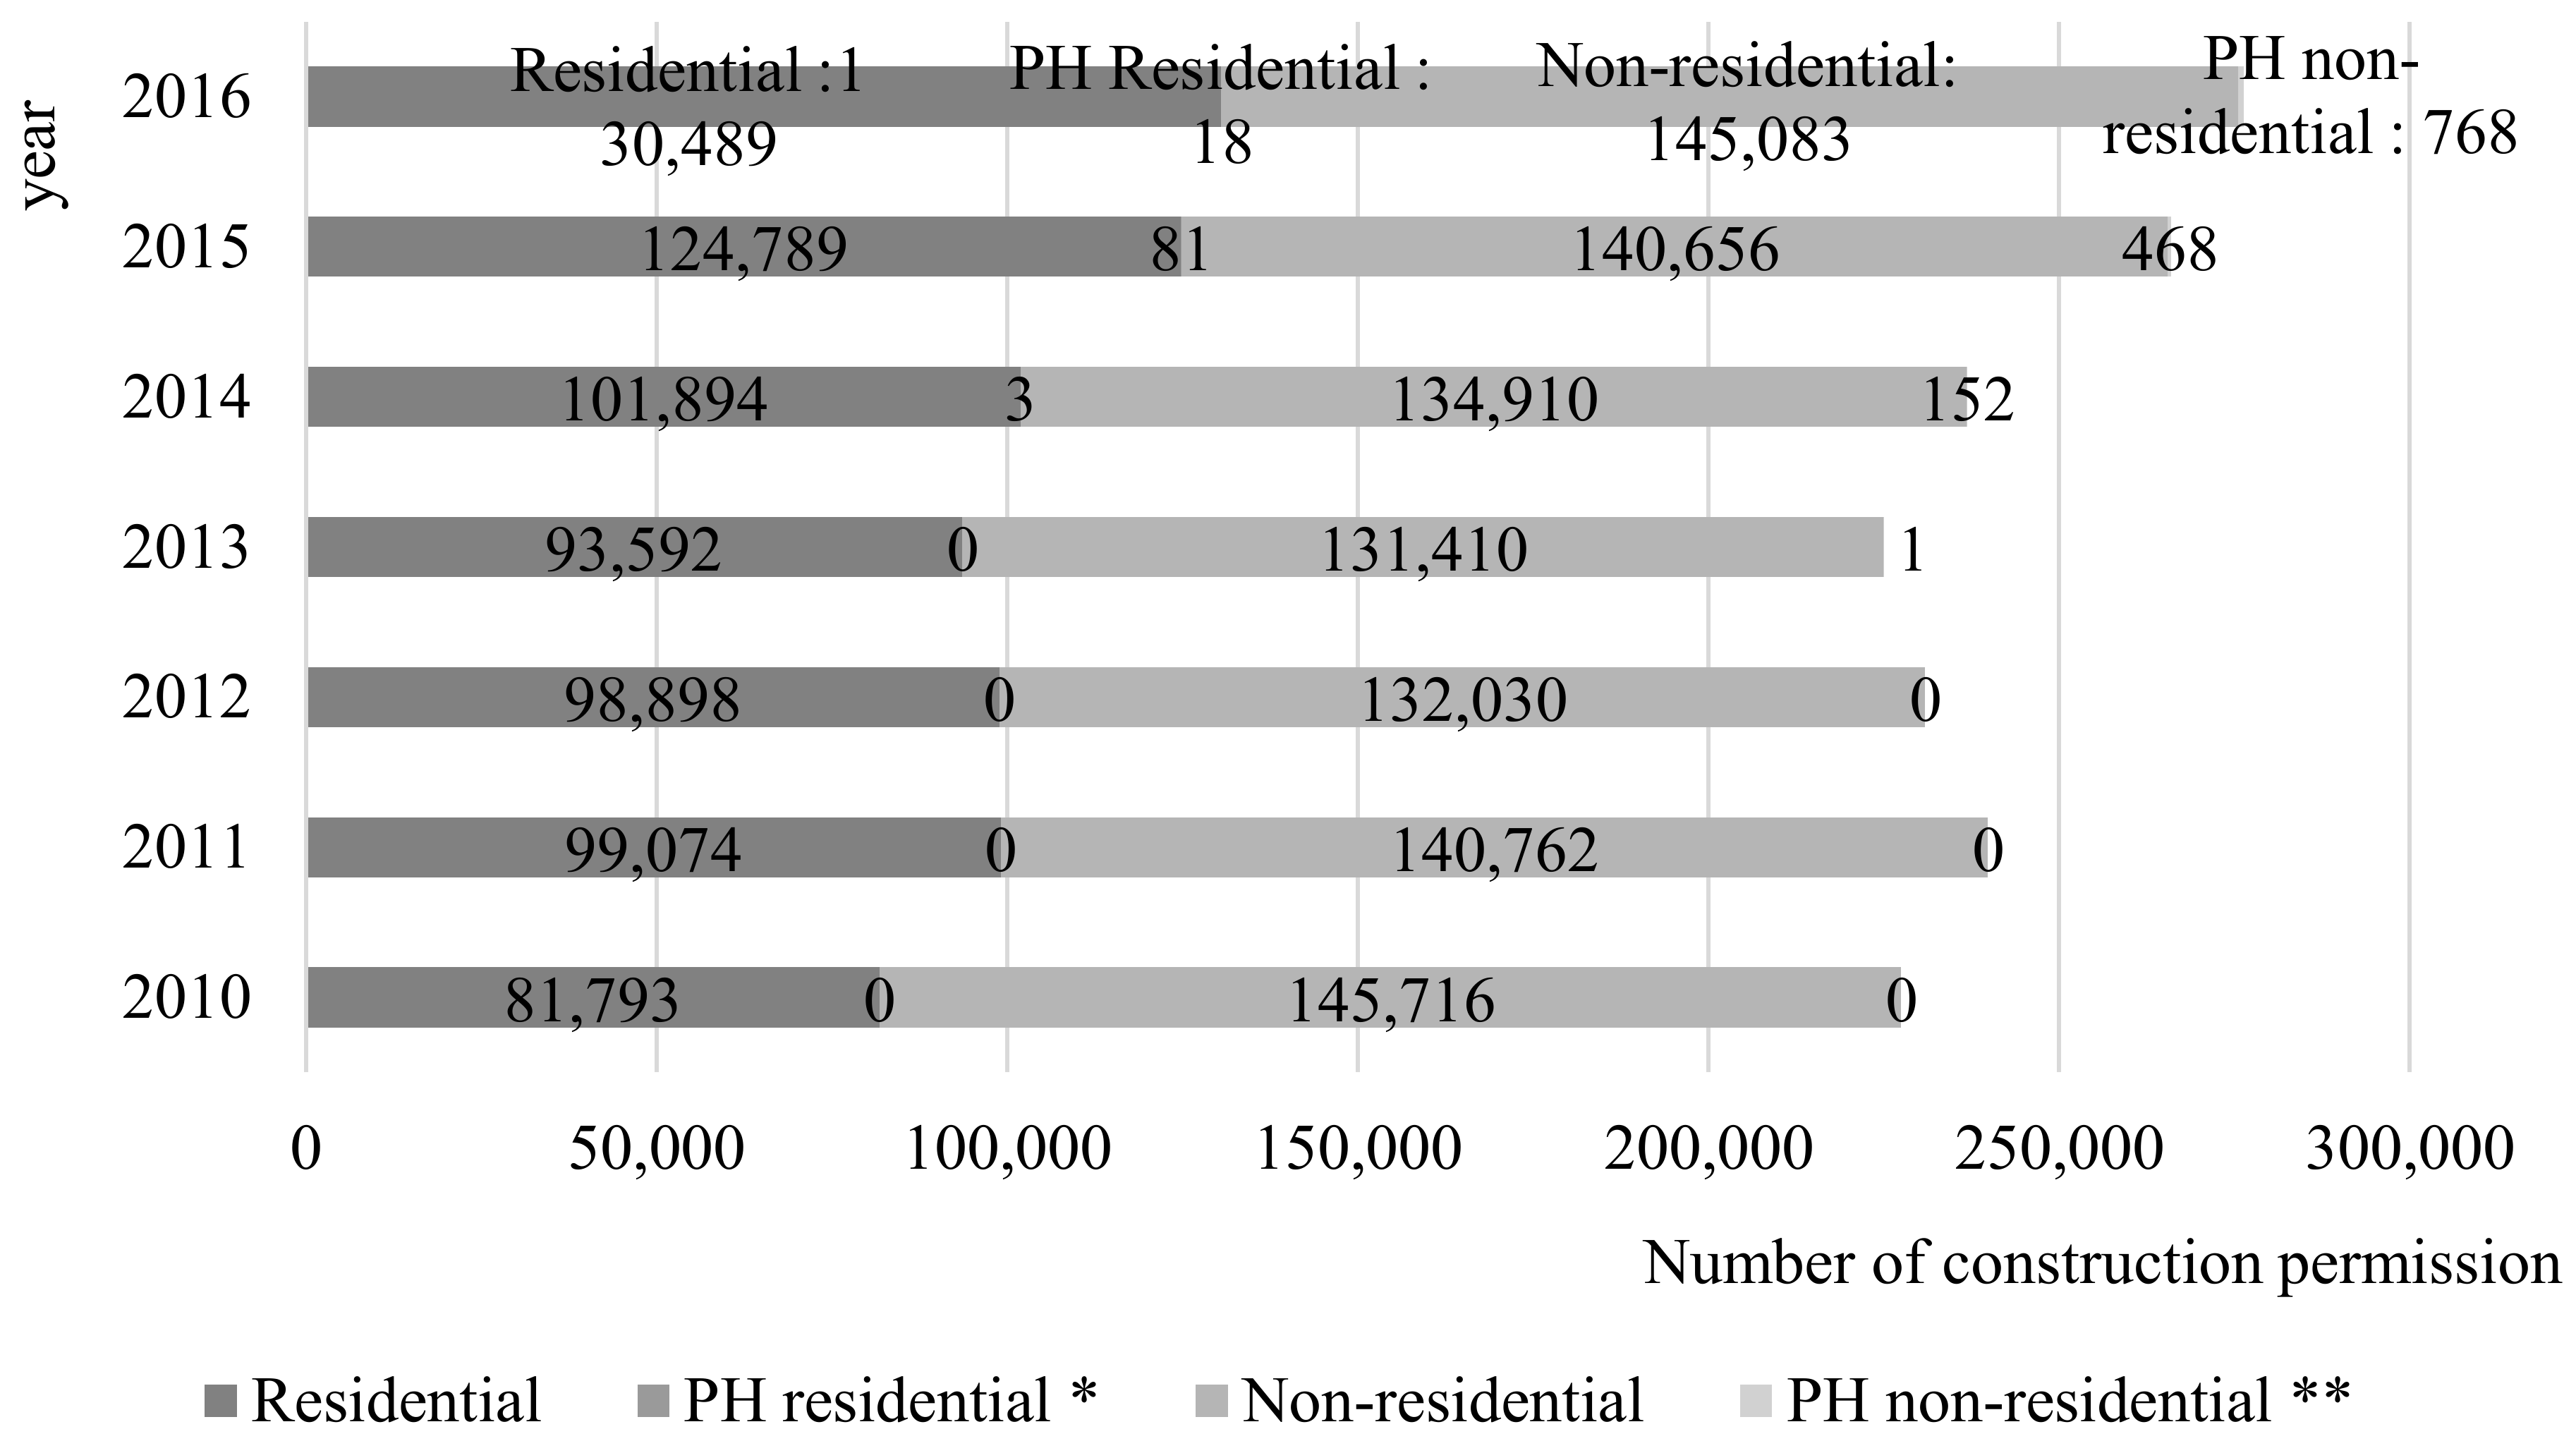
Figure 1. Number of construction permits in Korea (2010~2016) [53]: PH residential* is a number of residential building using primary energy consumption less than 120 kWh/m2·year, PH non-residential** is a number of non-residential building using primary energy consumption less than 200 kWh/m2·year.
Sustainability 10 03558 g001
Figure 2. Photo of the reference building.
Sustainability 10 03558 g002
Figure 3. Result of heating energy demand and peak heating load: (a) Result of heating energy demand; (b) Result of peak heating load.
Sustainability 10 03558 g003aSustainability 10 03558 g003b
Figure 4. Comparison of predicted and measured heating energy demand.
Sustainability 10 03558 g004
Figure 5. Heating energy demand for the energy conservation measures (ECMs).
Sustainability 10 03558 g005
Figure 6. Additional cost and payback periods of ECMs to achieve passive house.
Sustainability 10 03558 g006
Figure 7. Total initial cost including tax and incentive.
Sustainability 10 03558 g007
Table 1. Building Energy Efficiency Certification.
LevelResidential BuildingsExcept Residential Buildings
Required primary energy per unit area per year (kWh/m2·year)
1+++<60<80
1++60~9080~140
Table 2. ZEB (Zero-Energy Building) Certification.
LevelRenewable (Primary) Energy Rate (%) = (Renewable Primary Energy Generation per Unit Area per Year (kWh/m2·year)/Required Primary Energy per Unit Area per Year (kWh/m2·year × 100
1>100
280~100
360~80
440~60
520~40
Table 3. Simulation conditions of the reference building.
Outdoor conditionMax/minAverage
Dry-bulb temp (°C)35/−14.712.15
Relative humidity (%)100/1168.98
Wind speed (m/s)6.4/01.22
Solar irradiance (MJ/m2)3.03/0.030.55
Designed indoor thermal condition [58]summerwinter
Dry-bulb temp (°C)2620
Relative humidity (%)5050
Internal heat gain [59]Lighting (W/m2): 5.5 [56]
Equipment (Wh/m2∙day): 52
People (Wh/m2∙day): 53
Infiltration rate [57]1.0 ACH at 50 Pa
Ventilation systemuninstalled
Building componentMaterial (mm)Heat capacity [J/kg · K]U-value [W/m2K]
Exterior wallExpanded polystyrene (50)12100.160
Oriented strand board (11)1260
Glass wool (140)960
Gypsum board (19)1090
Inner wallGypsum board (19)10900.175
Glass wool (140)960
Gypsum board (19)1090
Ground floorStrip flooring (8)16300.171
Plain concrete (64)920
Extruded polystyrene (50)1210
Concrete (300)920
Extruded polystyrene (100)1210
Blinding concrete (60)920
1st floorStrip flooring (8)16300.114
Plain concrete (64)920
Extruded polystyrene (50)1210
Glass wool (235)960
Gypsum board (19)1090
RoofOriented strand board (11)14600.146
Glass wool (235)960
Gypsum board (19)1090
WindowGlass2.71
Frame1.59
Area (m2)36.65
SHGC0.47
HVAC SystemRadiant floor heating with thermostat control, Gas-fired (Efficiency: 83%)
Shape factor0.698
Table 4. Conditions for economic analysis.
TypeInterest Electricity Inflation Rate Natural Gas Inflation RateCore Producer Price
Rates1.5% [64]3.3% [65]3.76% [66]1.5% [67]
Table 5. Analysis cases of energy conservation measures (ECMs).
ECMsInfiltration RateVentilation SystemERV
(Energy Recovery Ventilator)
Construction
PerformanceElectricity Demand
Case 1-1.0 [57]withoutwithoutConc.
Case 2-1Strengthen air-tightness0.6 [70]Wooden
Case 2-2Conc.
Case 3-1Install ERV00.295 ach [71] Cooling-effic.: 45%,
heating-effic.: 70% [72]
2.15 kWh/m2·yearConc.
Case 3-2Enthalpy heat-effic.: min 75%
Elec. power cons.: 0.45 W/m2h [73]
1.34 kWh/m2·year
Table 6. Additional cost according to the ECMs.
CasesECMsStructuresAdditional Cost (USD)
Case 1-Concrete0
Case 2-1Strengthen the airtightnessWooden4490
Case 2-2Concrete1796
Case 3-1Install ERVConcrete4041
Case 3-2Install high performance ERVConcrete8980
Table 7. Economic analysis according to the ECMs.
Base CaseCase 2-1Case 2-2Case 3-1Case 3-2
Initial cost (USD)204,963(+4490)(+1796)(+4041)(+8980)
Energy cost savings (USD/year)N/A198198452602
Energy cost saving rate (%)N/A17%17%35%44%
Economic metrics
LCC savings (USD)N/A−71.18910510,5567410
LCC saving rate (%)N/A−0.03%4.39%5.13%3.54%
Payback period (year)N/A22.6 year9.04 year8.92 year14.92 year