1. Introduction
Developing sustainable cities is a valid social aim that leads to greater population concentrations in urban areas than in rural areas, and sustainable development is a global goal [
1]. Among the three dimensions of sustainability of the economy, social equity, and environment, socio-economic development has brought about the need for environmental development that aims to satisfy the life quality of inhabitants. In green space planning, the concept of green infrastructure is known as a helpful approach to furnish advantages to citizens through integrated green space system toward the aim of developing sustainable cities and to meet the ecological demand for of the urban population [
2,
3,
4,
5]. This paper focuses on the sustainable environment aspect based on theories of ecology landscape to support sustainable development through green infrastructure planning in urban regions.
It is clear that urbanization has changed the city and brought various benefits, if it has a good management, and can reach higher productivity and growth by positive agglomeration effects such as larger, more efficient labor markets, lower transaction costs and easier knowledge spreading over. However, urbanization in Vietnam is different from that in other countries that focus on the urbanization of land, reducing urban population density and suppressing productivity gains. The current land conversion-based urban development with industrial zones developed ahead of demand and resulted in a proliferation of small-scale, fragmented urban expansion. The urbanization process of land is believed to be the cause of the devastation of the natural environment which brings benefits for human and animal habitats. Indeed, after the 1980s, when the “opening up” policy was launched, cities in Vietnam developed rapidly, which led to environmental problems that caused a lack of green space in the metropolitan area [
6]. Da Nang is a city with the highest growth rate in recent years in Vietnam. According to the strategy development planning of Da Nang city by 2030, it is forecasted that the land allocated for agriculture such as cropland, special-use forest and protection forest will decrease due to the transition to non-agricultural land for infrastructure development. Accordingly, land for central urban construction will increase by 280% in 2020, and 528% in 2030 compared to 2005. Construction of the suburbs, compared to 2005, will also witness an increase of 200% by 2020 and of 300% by 2030. Therefore, the land transition from rural to urban areas has proceeded at unprecedented rates, creating notably negative impacts on the natural function of the ecosystem [
7,
8]. In order to mitigate the effects of this process, urban and landscape architects attempt to apply ecological principles to urban areas in different ways and scales.
The most early of these is Howard’s Garden City [
9], followed by the idea of the park according to the urban pattern of Frederick Law Olmsted [
10], the ideas of developing land mosaic for the metropolitan area of Forman, and the ideas about constructing green buildings on a human scale [
11,
12]. All these efforts are aimed at sustainable urban development.
Beatley believes that a sustainable structure that can contain elements of urbanization is as a compressed city because distance and fragmentation between urban areas are reduced and more optimal [
13]. Urban green space is one of the criteria for evaluating the quality of urban life [
14]. Green space promotes physical activity, psychological well-being, and the general public health of urban residents [
15]. A good urban green space design contributes to the environmental quality and sustainable urban development. In this context, landscape metrics is a useful tool for evaluating urban green space spatial patterns [
16]. Landscape metrics also support the assessment of residents’ satisfaction with the green space structure [
17]. There are many approaches to interpreting the urban landscape in a context of land-use/land cover change. Recently, the urban–rural gradient approach has been effective for studying urban ecology. The values of the four independent measures of urbanization (index combined), people per urban land cover landscape shape index and dominant land cover were analyzed to assess their effect on species richness [
18]. To test different landscape metrics’ abilities to delineate the gradient change of landscape along the selected transect, six metrics were selected: percentage of the landscape, Shannon’s diversity index, patch density, contagion, area coefficient of variation and perimeter-area fractal dimension [
19].
Landscape ecology theory has contributed important knowledge to the social-scientific approach aiming to guide urban sustainable development in the context of high-density urban expansion [
20,
21]. Landscape ecology provides methods and approaches to understand the dynamics of urban green space. Ecological theory has been used to test “archipelagoes” of urban green spaces including biogeography [
22]. The positive relationship between species richness and patch size may propose the theory of island biogeography; it can be an appropriate scheme for the study of urban landscape ecology [
23]. The metapopulational theory appears to provide a framework that is promising for urban ecological research [
24]. Scattered greeneries in urban areas play a central role in the metapopulational theory. The extent of the greenery and its connection are an important factor in creating the species diversity in the urban landscape [
25]. Research based on the theory of landscape ecology can provide guidelines for planning and urban management, namely connectivity between the green spaces that can improve and create movement corridors and greenways. However, corridors and greenways cannot replace the natural green space in urban landscapes [
26].
One of the lessons worth considering is that greenways are applied as a corridor for the movements in urban areas of human beings and animals therein to help reinforce the link between urban areas [
27,
28], and the linkage between the parks and public gardens at a settlement scale [
29,
30,
31,
32,
33,
34]. Indeed, ecological landscape planning is an appropriate solution. This is an oriented solution, applying the latest knowledge and experience of developed countries in practice with the aim of building a modern city without facing problems of industrialization and urbanization on a large-scale [
35]. It allows optimizing the use of space to deal with the preservation and improvement of the urban environment [
36]. The rules relating to theories of biogeography [
22] are also applied. In architecture and urban landscape planning, the spatial concept has been accepted and widely implemented [
37]. Most recently, the concept of green infrastructure has emerged as a promising way to transfer the key landscape ecology principles into urban region. Its definition covers the large range of our world’s natural life-support system including an interconnected network of waterways, wetlands, woodlands, wildlife habitats, and other natural areas; greenways, parks, and other conservation lands; crop fields and forests; wildlife that support local species, and so on that all contribute to the health and quality of life for communities and humans [
38]. Green infrastructure provides environmental, social, and economic functions for human benefits at different scales [
2,
5,
39]. Although the study of transferring landscape ecology principles via green infrastructure planning has been conducted all around the world included Asian cities, nevertheless, green infrastructure needs to be strategically planned and designed with the guidelines and landscape ecology principles in mind and a systems approach to green infrastructure as an integrated whole is necessary [
4,
40,
41].
In Vietnam, the landscape ecology approach is a quite new field, with sustainable development proposed by Vietnamese scholars such as developing a compact city through the combination of open space; controlling urban land density; developing the traffic infrastructure and public traffic systems. Green open space in urban regions [
42] seems to be general and be limited according to oriented/theoretical proposals that lack practical, systematic and concrete guidelines. Hence, the green space system planning is proposed here based on the intuitive idea of designers and planners.
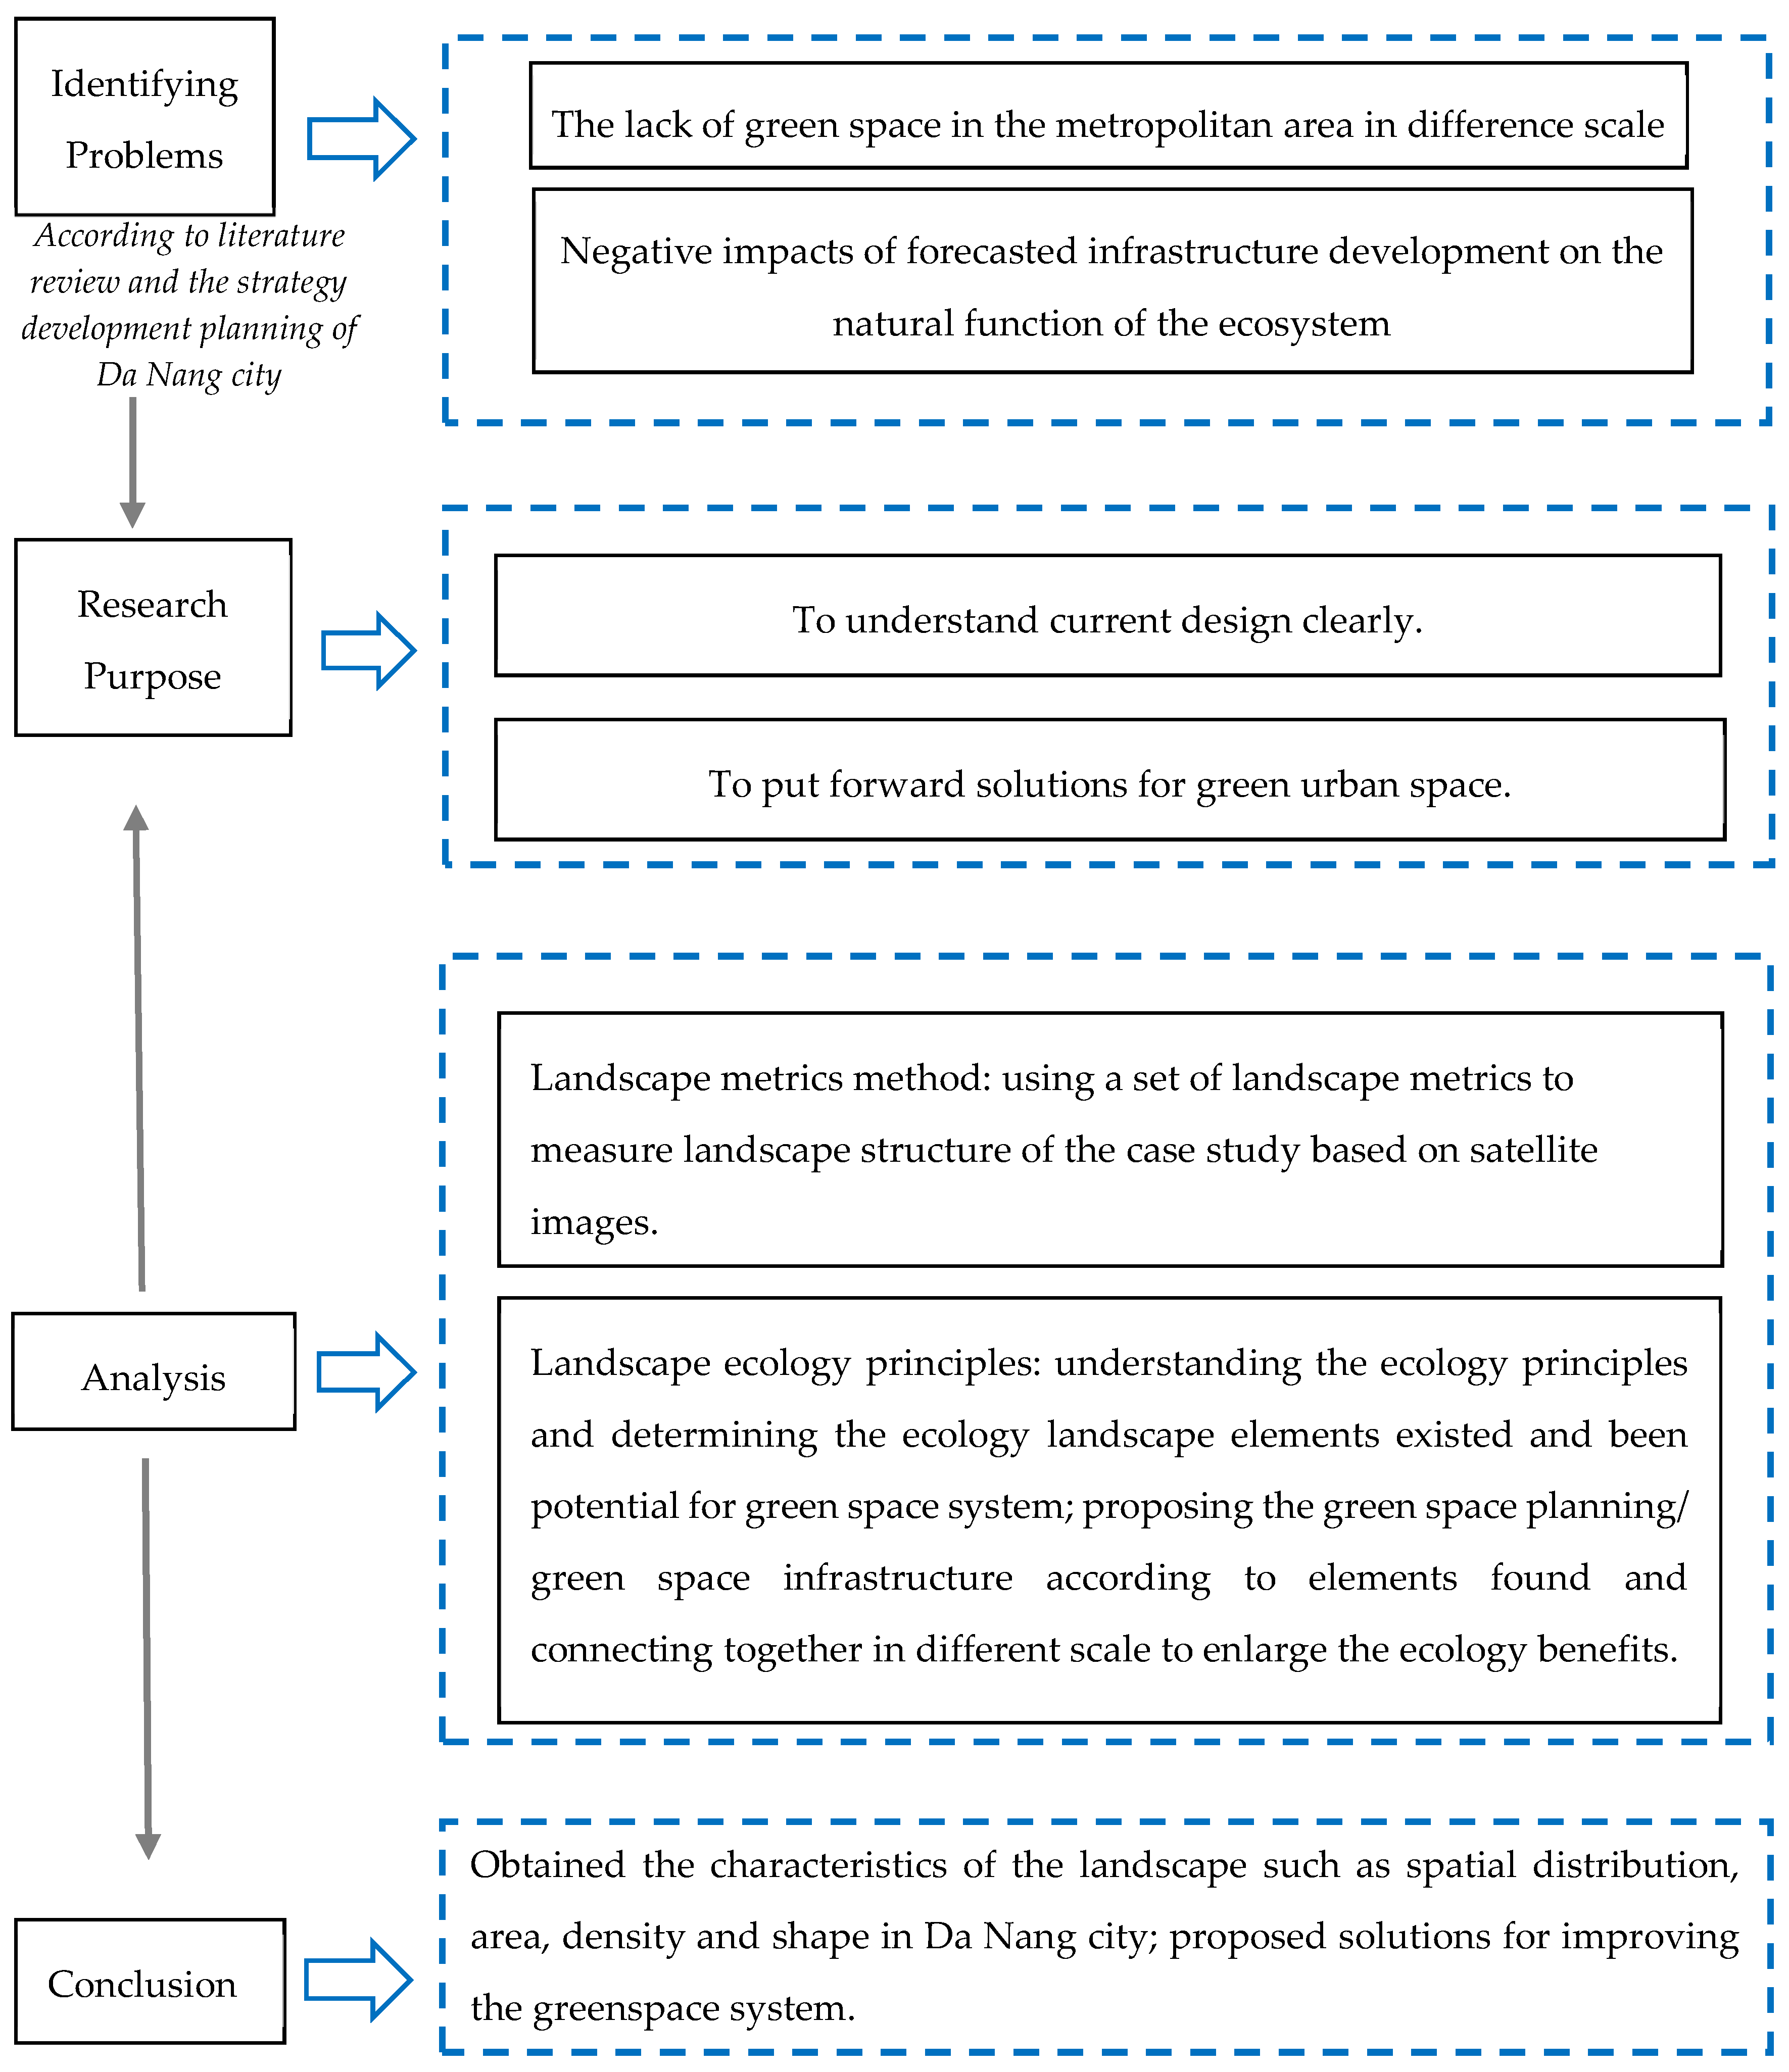
Landscape ecology is a science that helps clarify interactions between environment and organisms through landscape structural elements. Understanding the landscape structure will help planners to design and control land use in urban development. The following framework (
Figure 1) gives a brief description of the paper’s structure, objective and processes. Indeed, the aim of this study is to explore the potential of applying landscape ecology principles through a green infrastructure approach to Vietnamese cities. Although there have already been studies on the application of the landscape ecology principles in Asian cities, Vietnam still lacks systematic application of landscape ecology in green space planning. Based on the case study, this paper assesses current green space system characteristics and urban planning proposals of Da Nang city, specific recommendations for ecological landscape planning in Da Nang city are proposed to help to solve the green space planning problems. It is argued that using landscape ecology principles for green infrastructure planning can help protect the natural and fragile green spaces, mitigate natural disasters, and create the entire green space system for a city facing lots of problems of uncontrolled urban sprawl, pollution, lack of green open space, overpopulation and so on. This approach has a significant potential to become a reasonable green space planning tool in Vietnamese cities to create sustainable cities and to provide a reference basis for planners, and policymakers on transferring the landscape ecology principles to cities.
2. Materials and Methods
2.1. Identification of the Case Study
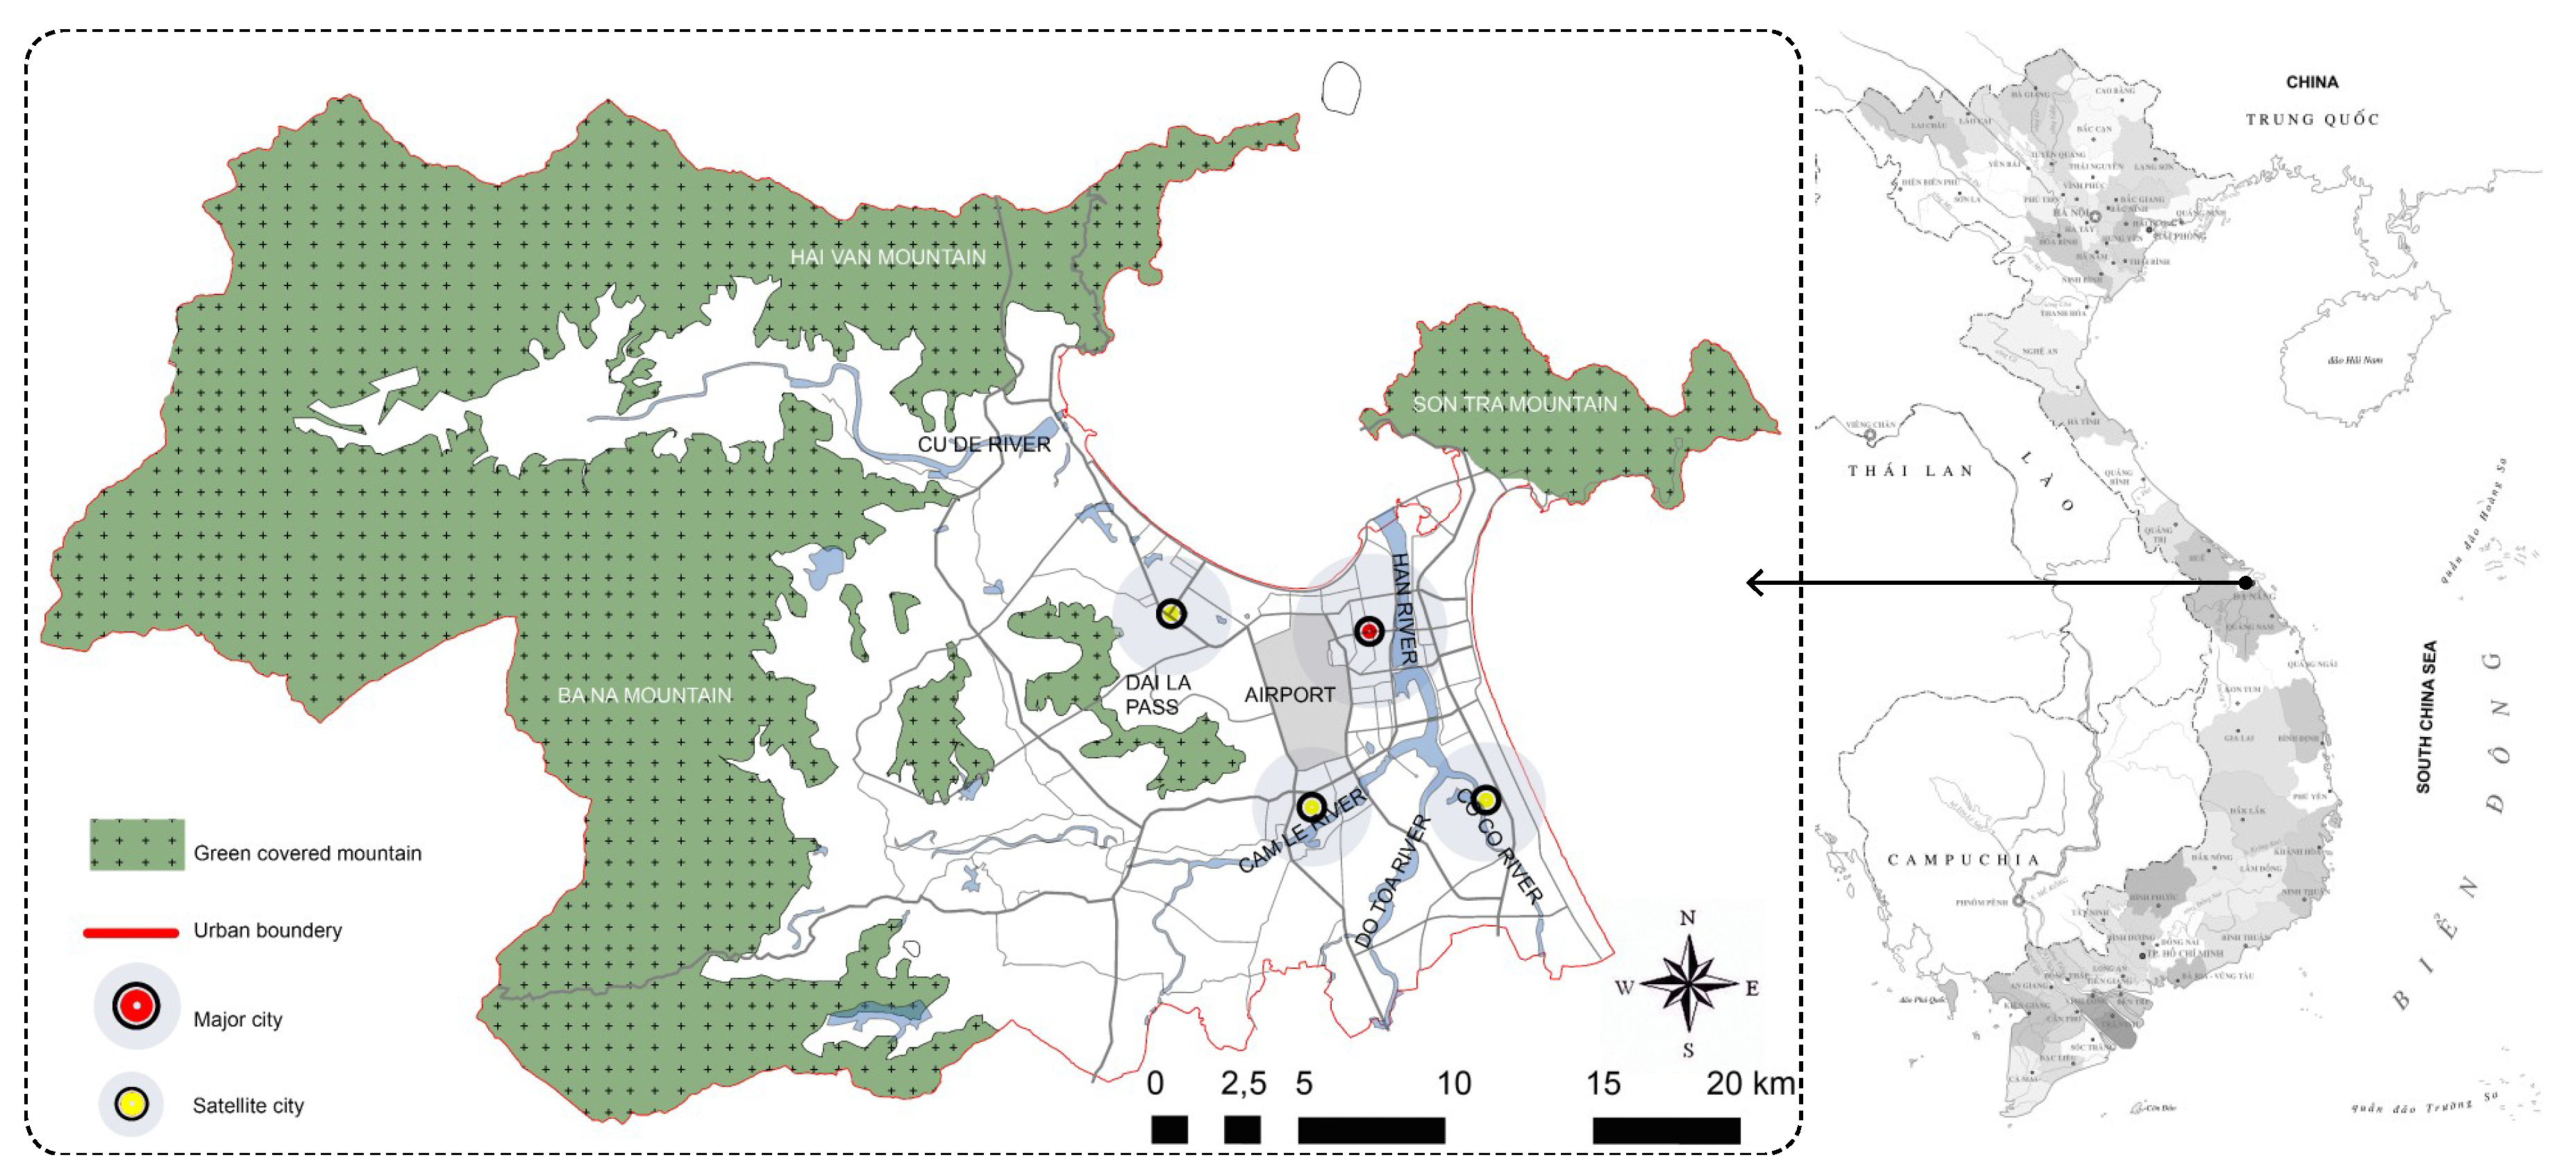
Da Nang is an important harbour city of Vietnam, the third largest city in the country (
Figure 2). With potential economic development, the population is predicted to double by 2030 (about 2 million). Da Nang city has a natural area of 1283.42 km
2, of which the central districts occupy an area of 241.51 km
2, and the suburban districts occupy an area of 1041.91 km
2. Da Nang is located at 15°55′ to 16°14′ North, 107°18′ to 108°20′ East. Da Nang has a tropical climate dominated by a dry season that lasts roughly from April to August and a wet season from September to March. The humidity rarely drops below 60% in the city, averaging roughly 80% and the mean annual temperature is 25.9 °C [
43].
2.2. Material and Method
To conduct green space planning that is an optimal approach for transferring landscape ecology principles into urban region and to propose guidelines and solutions for sustainable development in Vietnamese cities, the landscape ecology principles’ application for green space system planning is conducted through two steps (1) diagnosing spatial structures and patterns of green space in qualitative and quantitative terms; (2) applying ecology landscape into green space planning; proposing the solutions for green space system planning for urban region at different scales and its connectivity; and proposing guidelines for urban planners and authorities.
For quantitative analysis, because studying the spatial structure and pattern of green space is known as an important way to evaluate the quality of urban areas [
16], it is necessary to use a set of landscape metrics to measure landscape structure of the case study based on satellite images and detailed on data collecting and processing chapter. Indeed, landscape structures are evaluated in a unit through characteristics such as size, shape, type, heterogeneity, and boundary [
35]. Through these characteristics, a set of metrics is used to evaluate the composition and spatial distribution of landscapes, so-called landscape metrics. Landscape metrics are commonly used in the characterization, assessment and prediction of variation in landscape structures [
44,
45,
46,
47]. Landscape metrics also support the assessment of residents’ satisfaction with the green space structure [
17]. There are many approaches to interpreting the urban landscape in the context of land-use/land-cover change. Recently, the urban–rural gradient approach has been effective for studying urban ecology. The values of the four independent measures of urbanization (index combined), people per urban land cover landscape shape index and dominant land cover were analyzed to assess their effect on species richness [
18]. To test different landscape metrics’ abilities to delineate the gradient change of landscapes along the selected transect, six metrics were selected: percentage of the landscape, Shannon’s diversity index, patch density, contagion, area coefficient of variation and perimeter-area fractal dimension [
19].
In terms of qualitative analysis, because the complexity of the city, which contains lots of tangible and intangible elements, needs to be preserved such as urban form, culture, historic, geomorphology, and its nature. In addition, understanding the current and oriented planning of the city is quite important before proposing the green space planning solution as well. Hence, the qualitative analysis was conducted based on an assessment matrix with the historical photo, plans and field surveys. In this part, understanding urban form and expansion was conducted based on the historical plans and satellite images. To comprehend the landform and urban context that are able to catch the entire picture of local ecosystems, culture elements, conversation elements and ideas of oriented planning, an investigation were conducted based on government materials and local experts in urban design.
2.3. Data Collecting and Procedures
Two Landsat 8OLI (Operational Land Imager) image datasets which are from the United States Geological Survey were used in the analysis. Landsat-8 was launched on 11 February 2013 with two Earth imaging sensors onboard. The Operational Land Imager (OLI) with a 16-day repeat cycle, referenced to the Worldwide Reference System-2 (WRS-2). These images were acquired on 14 April 2016 with WRS path/row is 124/49 and on 7 February 2017 with WRS path/row is 125/49. The OLI sensor contains 8 optical spectral bands with a 30-m spatial resolution and 1 panchromatic band with a 15-m resolution. The map of land use types on a scale of 1:50,000 was published by Da Nang Urban Planning Institute in 2015. The detailed map of 22 different functional areas allowed us to analyze the differences based on the characteristic of greenery spaces.
This map was used as a reference for land-use classification. Besides, a visible interpretation was conducted based on the high-resolution images through Google Earth that provided a sample set to assess the classification accuracy.
2.3.1. Classification of Green Space
First, The Landsat 8 data were corrected for radiometry to convert from digital number to radiance value using the equation given by Nischal Mishra (2014) [
42]:
where
Lλ: TOA (Top of the Atmosphere) radiance (Watts/m2 × srad × μm)
ML: Band-specific multiplicative rescaling
AL: Band-specific additive rescaling factor
Qcal: Quantized and calibrated standard product pixel values (DN- Digital Number).
After that, the range of bands from 2 to 7 with a 30-m resolution was combined with band 8 with a 15-m resolution for fusion to create a new range of optical bands with 15-m resolution. The method of Gram–Schmidt spectral sharpening (GS) was used to sharpen multispectral data using high spatial resolution data as mentioned by Laben (2000) [
48]. The GS method has two main advantages over previous pan-sharpening techniques. First, there is no limit to the number of bands that can be processed at one time using this technique. Secondly, the spectral characteristics of the lower spatial resolution multispectral data are preserved in the higher spatial resolution, pan-Sharpened multispectral data [
48].
These data were reprojected to geographic coordinates with WGS 84 datum by using the land-use map in Da Nang city. Then, these new bands were analyzed for a supervised classification. The method of classification was performed by a support vector machine with kernel basis function through a training dataset. The training data was collected in images of all classes. After classification, the accuracy of classification was assessed using reference data. The reference data including a total of 221 random points were selected from high-resolution images provided by Google Earth based on interpretation of data by visual analysis (
Figure 3). To ensure representativeness, samples are collected throughout the study area and the selected samples must be homogeneous objects in shape, brightness, colours, pattern and texture. For an urban area, the samples are denser than a forestry area because there is a strong variation in spatially. The accuracy was evaluated by some indicators such as Kappa, overall accuracy, producer’s accuracy, and user’s accuracy.
Land-use types could be observed through Landsat 8 images as a list below (
Table 1):
- (1)
Water bodies: rivers, lakes, inlets, streams, ponds, etc.
- (2)
Impervious surface: huge buildings, cemeteries, transportation.
- (3)
Impervious with greenery: a mixture of residential areas with plants.
- (4)
Forest: natural forest and plantation.
- (5)
Agricultural area: rice fields, and crops.
- (6)
Other greenery: parks, lawns, etc.
- (7)
Bare soil: ground without vegetation.
The classified images were then used to calculate the total of greenery space. With the map of land-use types in 2015, the greenery spaces were discriminated into sub-classes with 22 different functional areas in the whole city. Finally, these results were delivered to be input data for evaluation by the landscape metrics method.
2.3.2. Analysis of Landscape Metrics
To evaluate the characteristics of the landscape, many sets of landscape metrics was proposed to use. Leitao et al. recommended a set of 9 indicators for sustainable landscape planning [
49]. For the purpose of landscape monitoring, Cushman et al. selected a set of 49 metrics in class level and 54 metrics in landscape level [
50]. In this paper, to analyse the characteristics of land use patterns, a set of spatial metrics was given in
Table 2 as follows.
The group of area metrics preforms background information of landscape and represent the coverage area, fragmentation and dominant of patches. A fragmented landscape provides less connectivity, greater isolation and the higher percentage of edge area in patches. To evaluate the fragmentation, the indicators such as a number of patches and mean patch size are proposed to perform. A high number of patches and low mean patch size reinforce an interpretation of a fragmented landscape condition [
49].
The shape metrics represents the geometric complexity of the landscape. Natural landscapes are often complex and irregular shapes while artificial landscapes correspond to the shape of the basic geometry. The distance metrics such as the mean shape index and the mean Euclidean distance neighbor represents the compactness and continuity of landscape. The low SHAPE and GYRATE value are indicative of compaction, whereas higher metric values indicate elongation [
44]. The analysis of landscape metrics was processed using the tool of Fragstat version 4.2.1 developed and supported by Dr. McGarigal and Dr. Cushman with programming by Eduard Ene. FRAGSTATS is a computer software program designed to compute a wide variety of landscape metrics for categorical map patterns.
2.4. Landscape Ecology Principles
Landscape ecology has emerged in the last few decades, becoming both useful and important to planners and landscape architects.
Despite the diversity and variation of the term ‘landscape ecology’ since it appeared in the 1950s, its most widely accepted definition until now is as follows: ecology is defined as research on the interaction between organisms and their environment, and a landscape is a large mosaic over which certain local ecosystems and landuses recur. In brief, landscape ecology is simply ecology of landscapes, and regional ecology is the ecology of regions [
51].
Rules of landscapes and regional ecosystems could be applied in any land mosaic. This system is like an organism, and it has three broad characteristics as structure, functioning and change. Landscape structure is a spatial pattern or an organization of landscape elements. Functioning is movements of animals, plants, water, wind, materials and energy through the structure. Finally, change is the dynamics or alternation on spatial pattern and functioning over time.
The structural pattern of a landscape is comprised of three factors: patches, corridors and matrix. Such elements are key to land-use planning, landscape architecture and even control over movements of organisms and change [
36].
Landscape ecology for green infrastructure that can provide a theoretical perspective and the analytical tools to understand the complexity and diversity of landscapes, including urban areas, function with respect to ecological processes [
52]. Three important principles of landscape ecology that transfer into green infrastructure are (1) a multi-scale approach; (2) the pattern and process; (3) connectivity.
Thus, applying the rules of basic landscape ecology, landscape and regions; patches and corridors; mosaics can be built and combine various green spaces into a green space system to make a sustainable landscape environment for an urban area.
3. Results and Discussion
3.1. Analysis of Urban Form and Expansion
Geometry structure of urban municipality is determined by linear, centralized and chessboard cities. A linear city form develops along the main backbone and may expand to two perpendicular axes in a certain limit, while the urban grid format is interwoven forms of urban structure levels according to two manners that thereby form a checkerboard city, a form that is popular in America and some Asian countries. If it developed to a limit, green space has no place to exist, became separated and was not concise [
53]. Unlike the above forms, a concentrated decentralization structure shifts from a monocentric to a polycentric structure based on the densification and activity intensification of selected sub-centres, connected by transport and development corridors [
54].
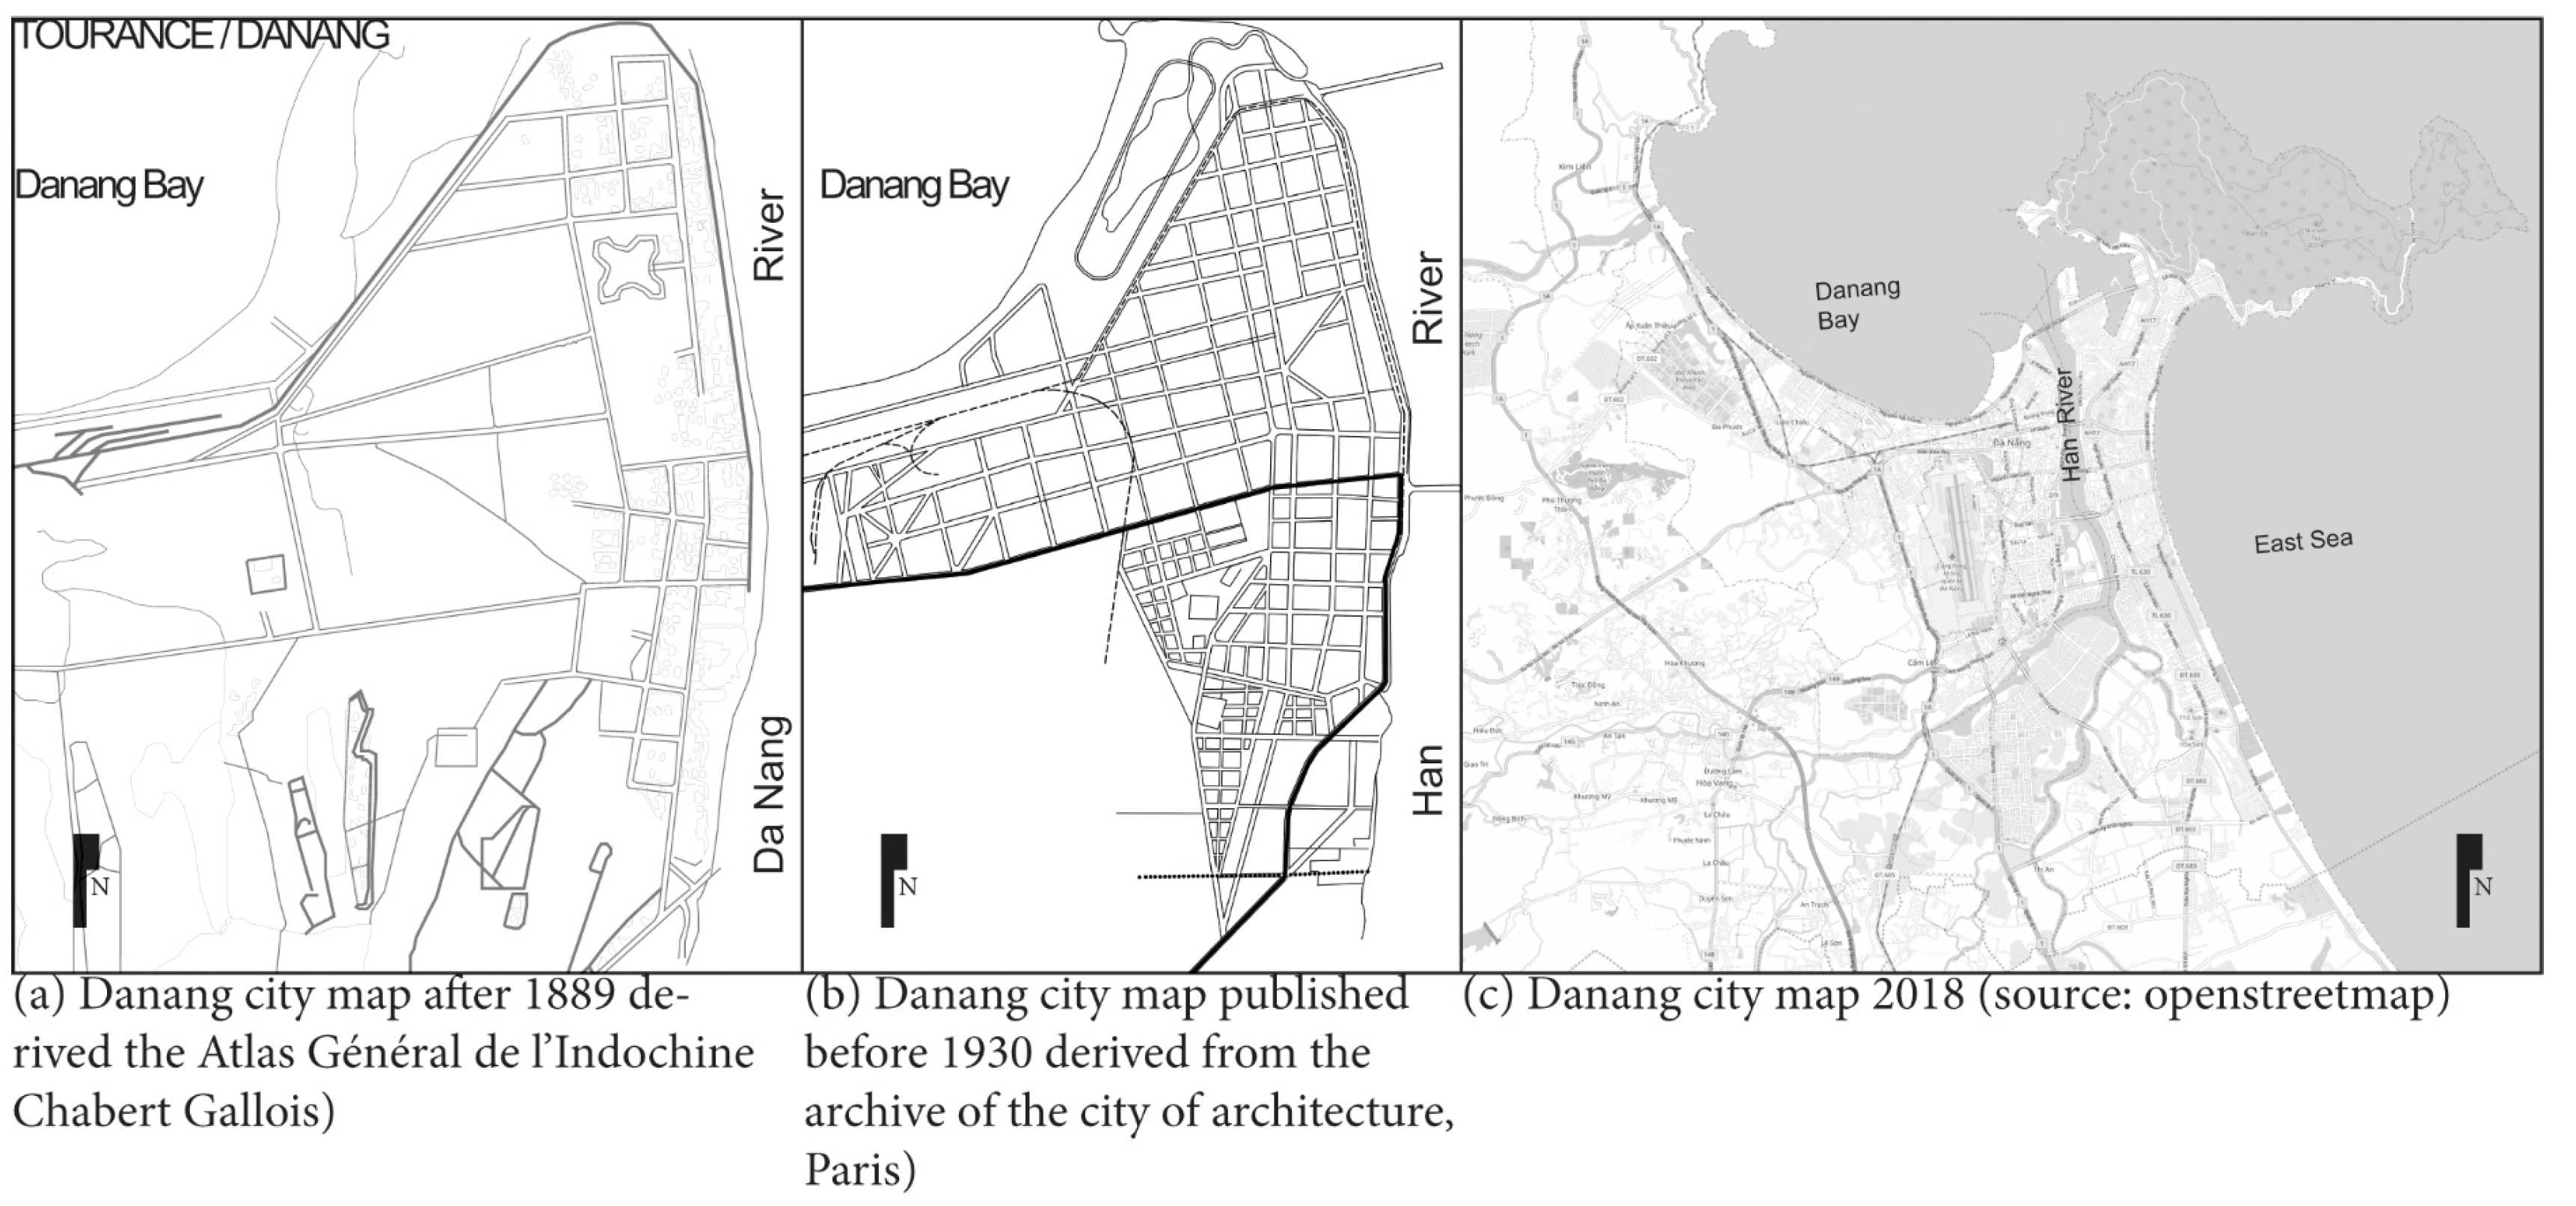
As can be seen in
Figure 4, the urban structure of Da Nang city has changed over different periods, however, the original structure of the city that constructed in the city centre has remained and expanded. Because of the influence of various factors such as culture, geomorphology, and climate, the urban structure of Da Nang is formed based on the synthesis or adoption of basic geometry structures. The first three blocks were planned in the west of the Han River, which also set up the metropolitan centre of Da Nang, by the French after 1889 (
Figure 4a). Indeed, these blocks take a role as an administration area/public area with lots of trees in the past, moreover, morphological residence seems to be very different compared with others where it is dominant as rows of houses. This feature has a potential to create a great place for human and organism movements.
On one hand, urban expansion with short-term plans and various theoretical planning methods leads to the mixture of urban forms and unreasonable connection between different urban areas and functions. On the other hand, due to Vietnamese conceptions regarding owning property in housing, the row-house form has been popular and leads to the over-exploitation of land, hence, green and public land in these areas is limited. To respond to the housing requirements of people, the urban development has been implemented toward various directions by the form of rowhouse that adhesive into the collector streets, major arterials; this situation was considered as the main cause of incoherent green space
Figure 4c.
To sum up, Da Nang’s urban structure is a mixture of different basic forms; this kind of urban pattern can exploit the complexity of urban geomorphology, can create the unique of a city containing some points as follows. For the old structure planned by French (
Figure 4a), it is an advantage for developing the green patches or corridors that serve public space; however, a disadvantage was found in less accessibility between the city centre and surroundings. Urban expansion can be considered as the main reason for urban fragmentation during urbanization.
3.2. The Classification of Green Space in Da Nang City
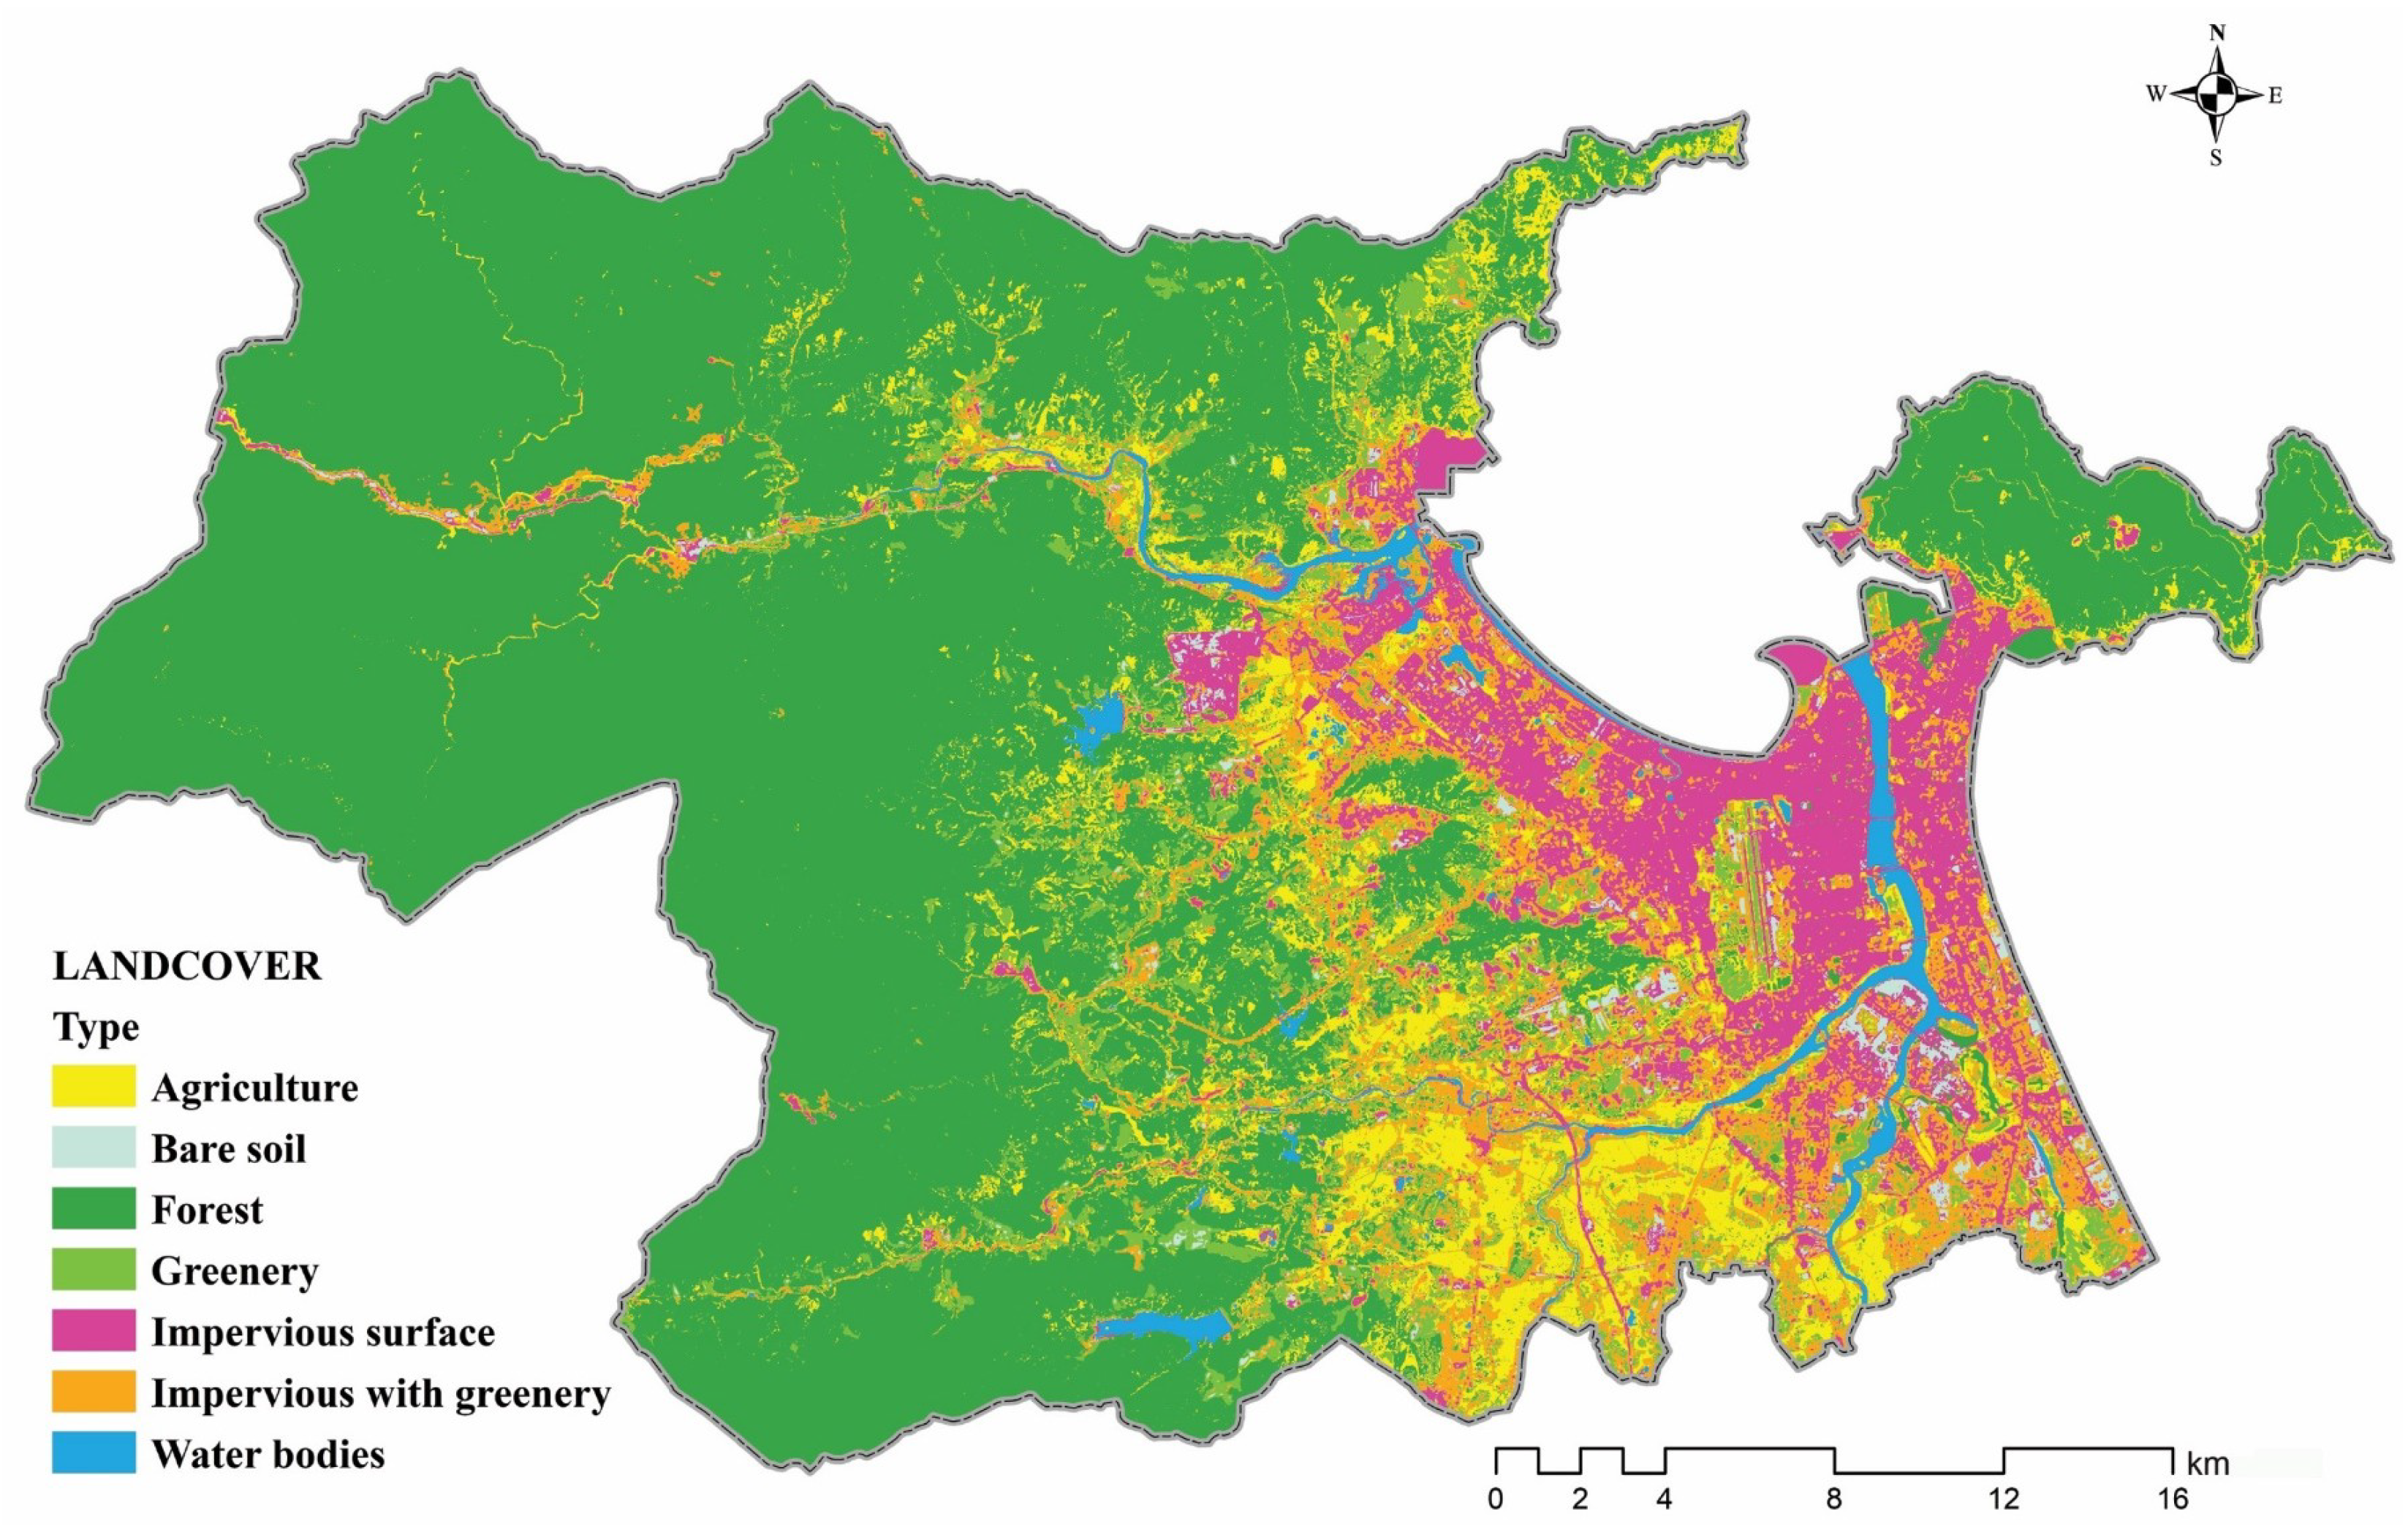
The classification was conducted by the method of support vector machine with kernel basis function.
Figure 5 performed the classification result of land-cover in 6 major classes, including agriculture area, bare soil, forest, impervious surface, impervious surface with greenery, other greenery, and waterbody. An assessment of the accuracy of the classified images (
Table 3) showed that the Kappa coefficient was 0.79 and the overall accuracy was 82.70%.
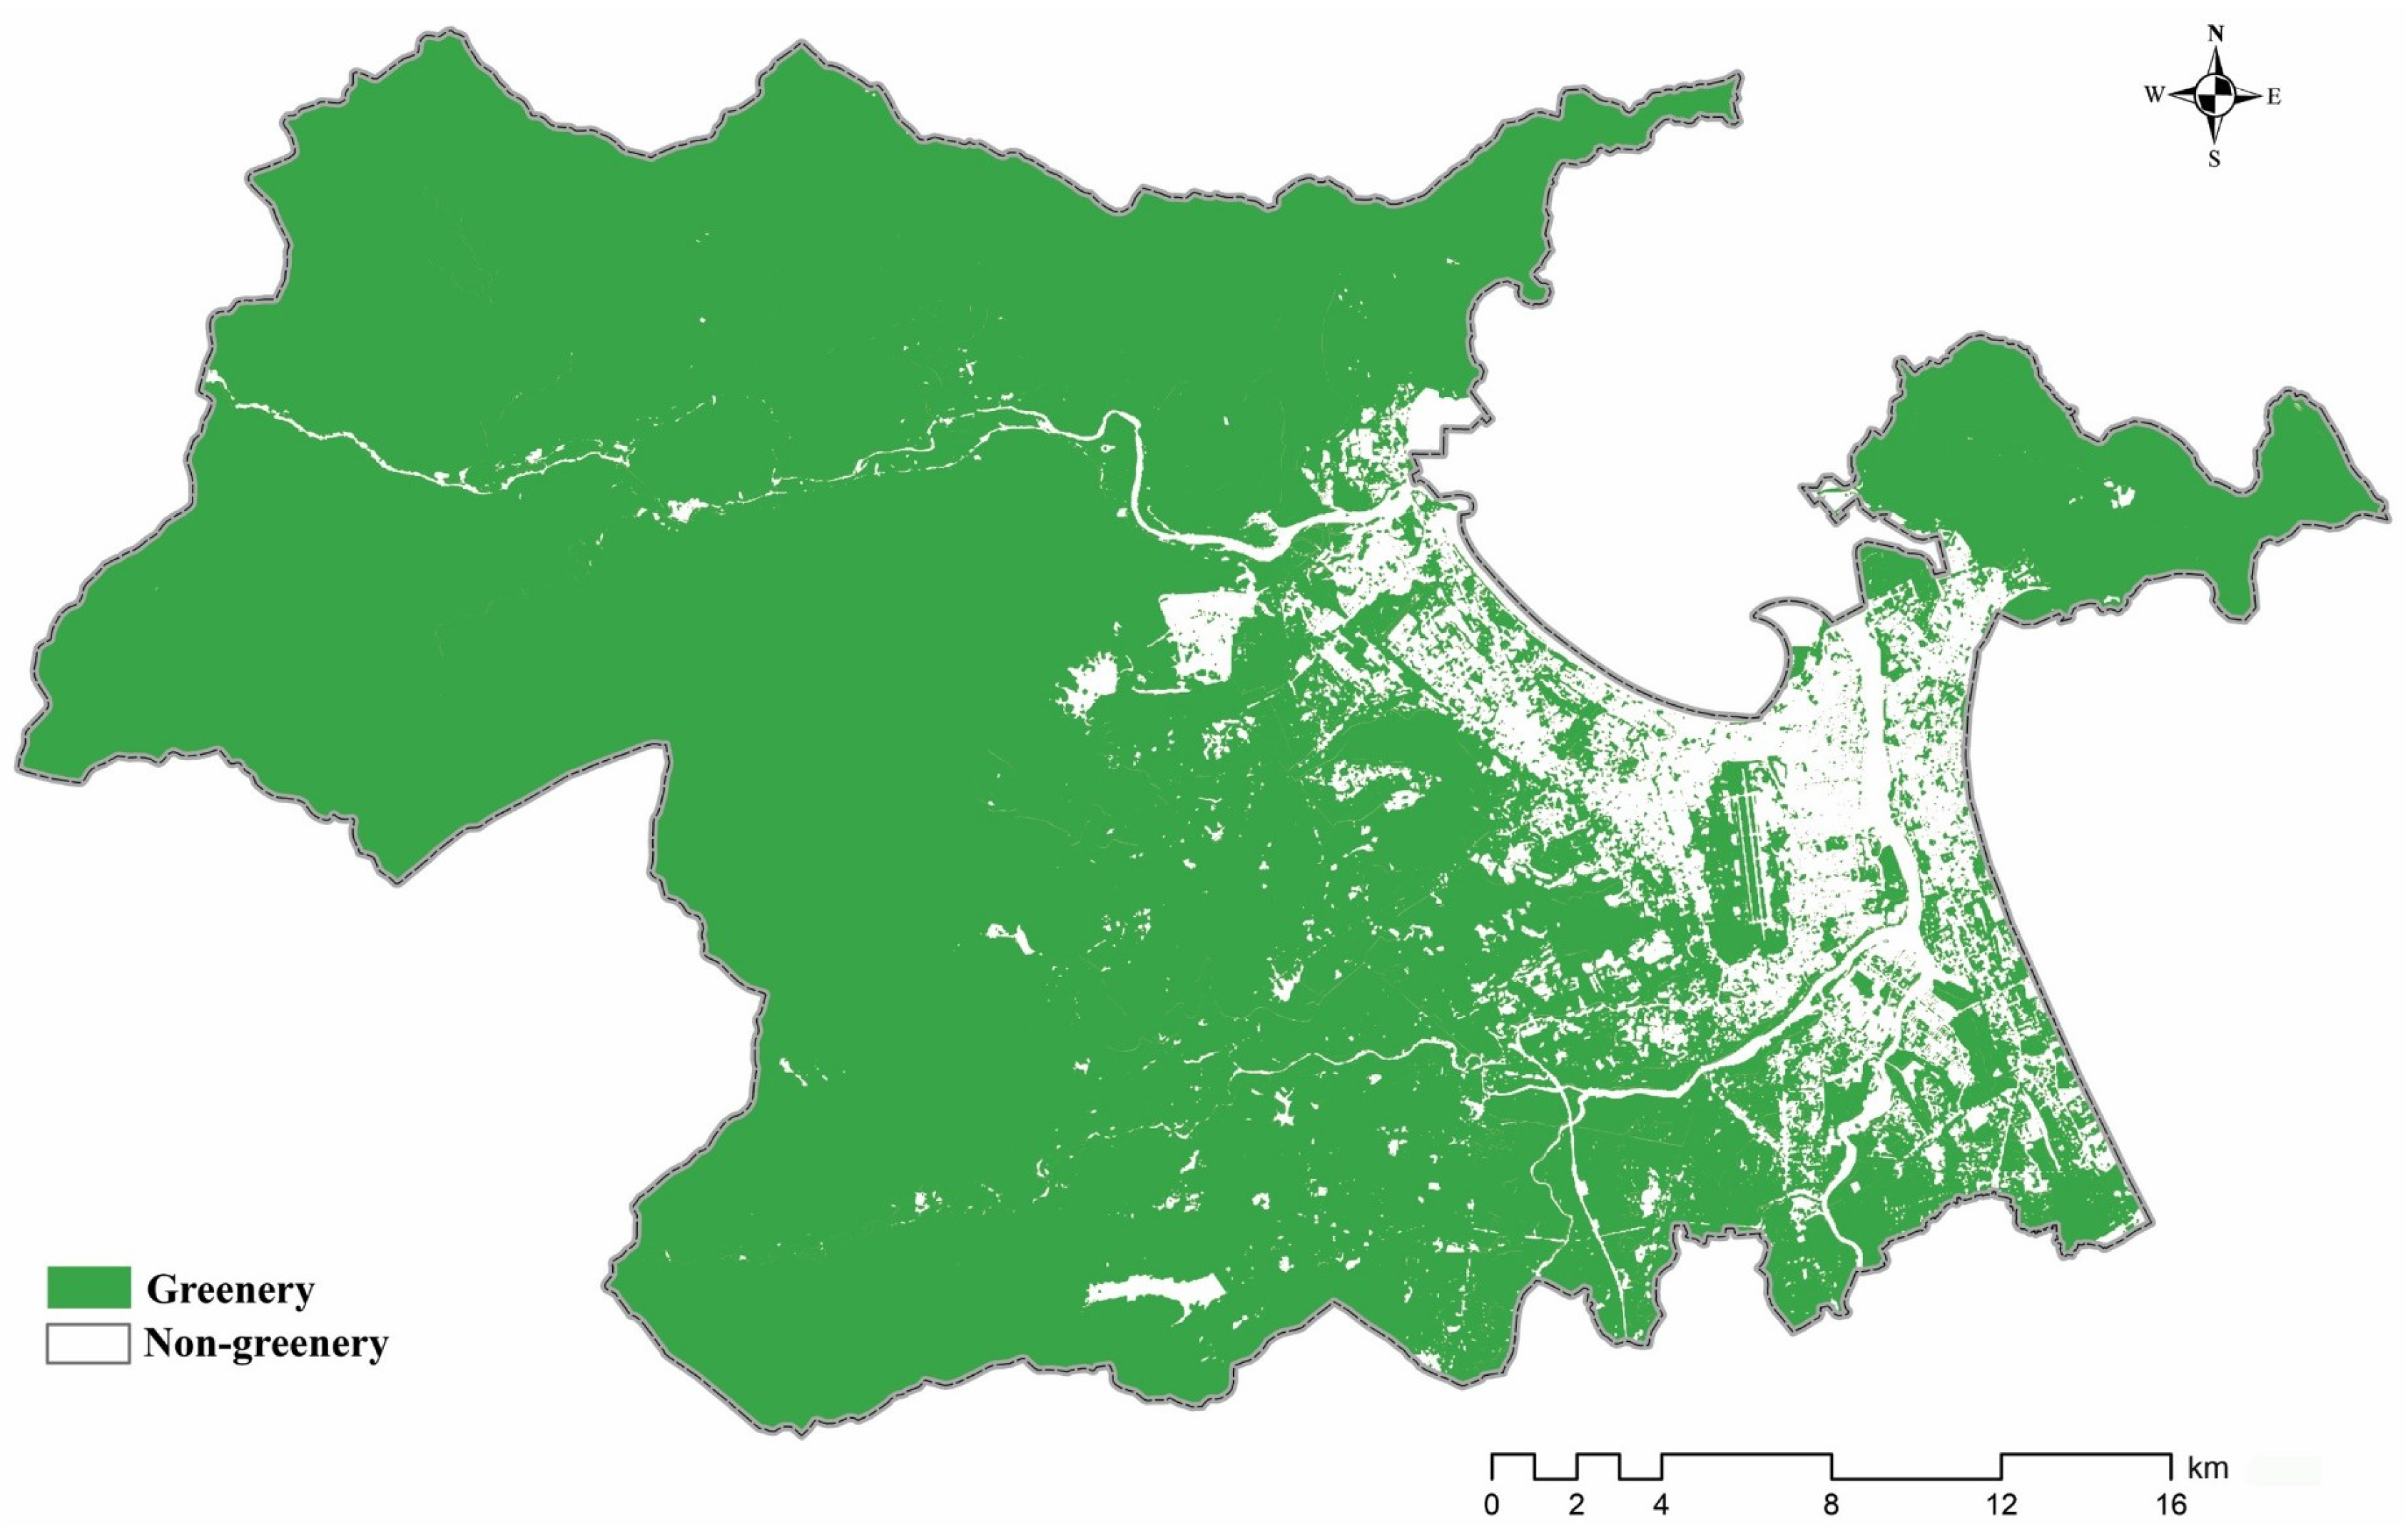
Generally, the coverage of green space in Da Nang city in 2017 was 84,458.7 ha and accounted for 65.73% of the total area (
Figure 6). The main green space in Da Nang city is dominant by forest in the west of the city and a small area in Son Tra Peninsula. The urban area, represented by an impervious surface, is situated along the coastal area.
3.3. Da Nang City Green Space Landscape Pattern Analysis and Evaluation
Figure 7 shows the area of greenery in various land-use types in Da Nang city based on the index of CA (ha). Of the total area, the forest has the coverage rate is over 51%. The special purpose forest occupies the largest area with PLAND of 40.45%, followed by protection forest and production forest and agriculture with PLAND of 10.52% and 22.85%, respectively. The special purpose forest has a mean patch area (AREA_MN) of 1220.24 ha and patch density (PD) of 0.033 patches/100 ha. The percentage of the landscape (PLAND) of some special function areas located in urban occupies a smaller area such as harbour, waste-water treatment land, and cemetery with PLAND of 0.014%, 0.044% and 0.12% respectively. The PD almost has the similar rank with the value of under 1, indicating their higher degree of aggregation.
Except for forest and agriculture areas, greenery park is dominant in urban zone with the highest value of PLAND as 9.81% and has a high AREA_MN and largest patch size (LPI) as well (
Table 4). Together with public green space, they are essential for protecting the environment in the city.
The areas of the new residential area and old residential areas are 2137.68 ha and 883.35 ha with a PLAND of 2.53% and 1.05%, respectively (
Table 4). The larger area of new residential types compared to the old ones demonstrates an increase in housing demand in recent years. Green space around the residential area is very important for shadowing, reducing pollution and noise, protecting the health inhabitant and it is one of the indices to quantify the satisfaction level of inhabitants. However, the new residential area has a high NP with a low LPI of 0.11%, which proves that it has a high fragmentation with the composition of small patches.
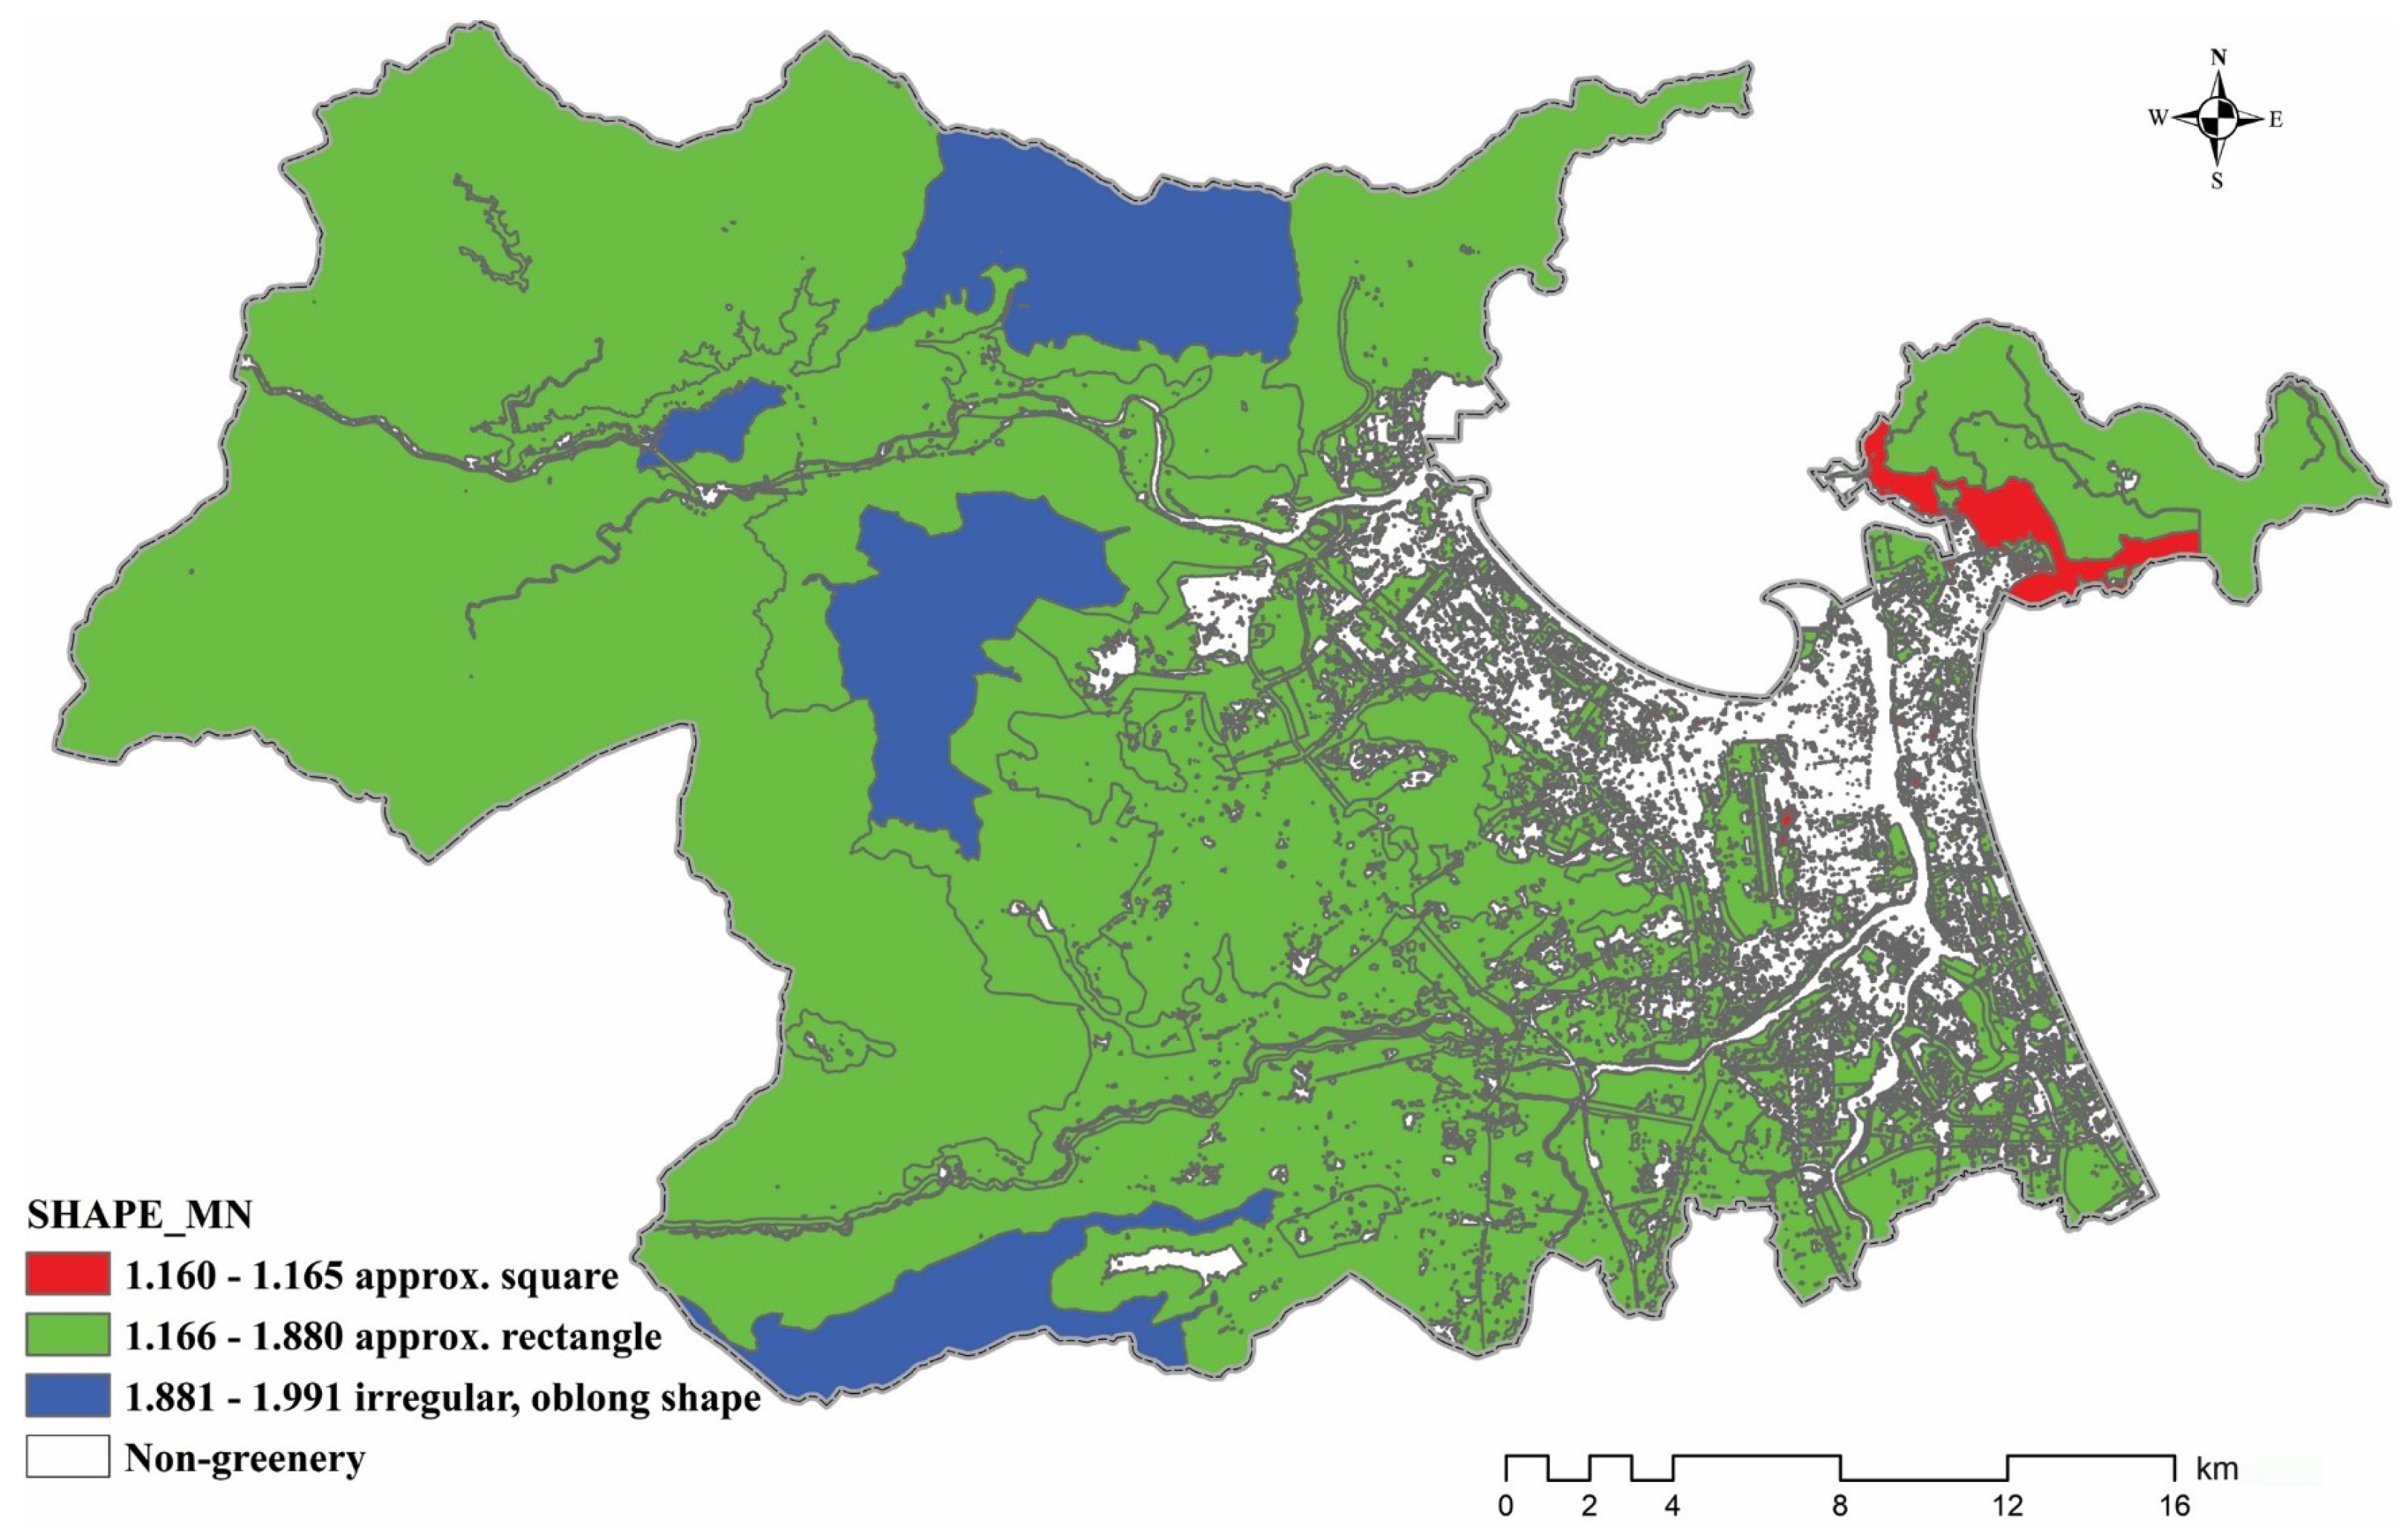
The shape index (SHAPE_MN) is significant for analyzing the geometrical and spatial structure of the landscape (
Figure 8). The higher the SHAPE value, the more complex the shape of the patch. If a patch has a low value, it corresponds to the shape of the basic geometry, commonly found in an artificial landscape. Greenery areas in urban areas such as parks, industrial, and other functional areas usually have the shape of a square or rectangle, equivalent to the index of 1.16 to 1.6. Natural landscapes are often complex and irregular, such as special-use forests, natural protection forests, and water bodies with SHAPE values higher than 1.8. If a patch shape is as close to a circle, it shows a compaction. On the other hand, this compaction exhibits the impact of this patch. Thus, the shape index can evaluate a landscape that is strongly influenced by humans.
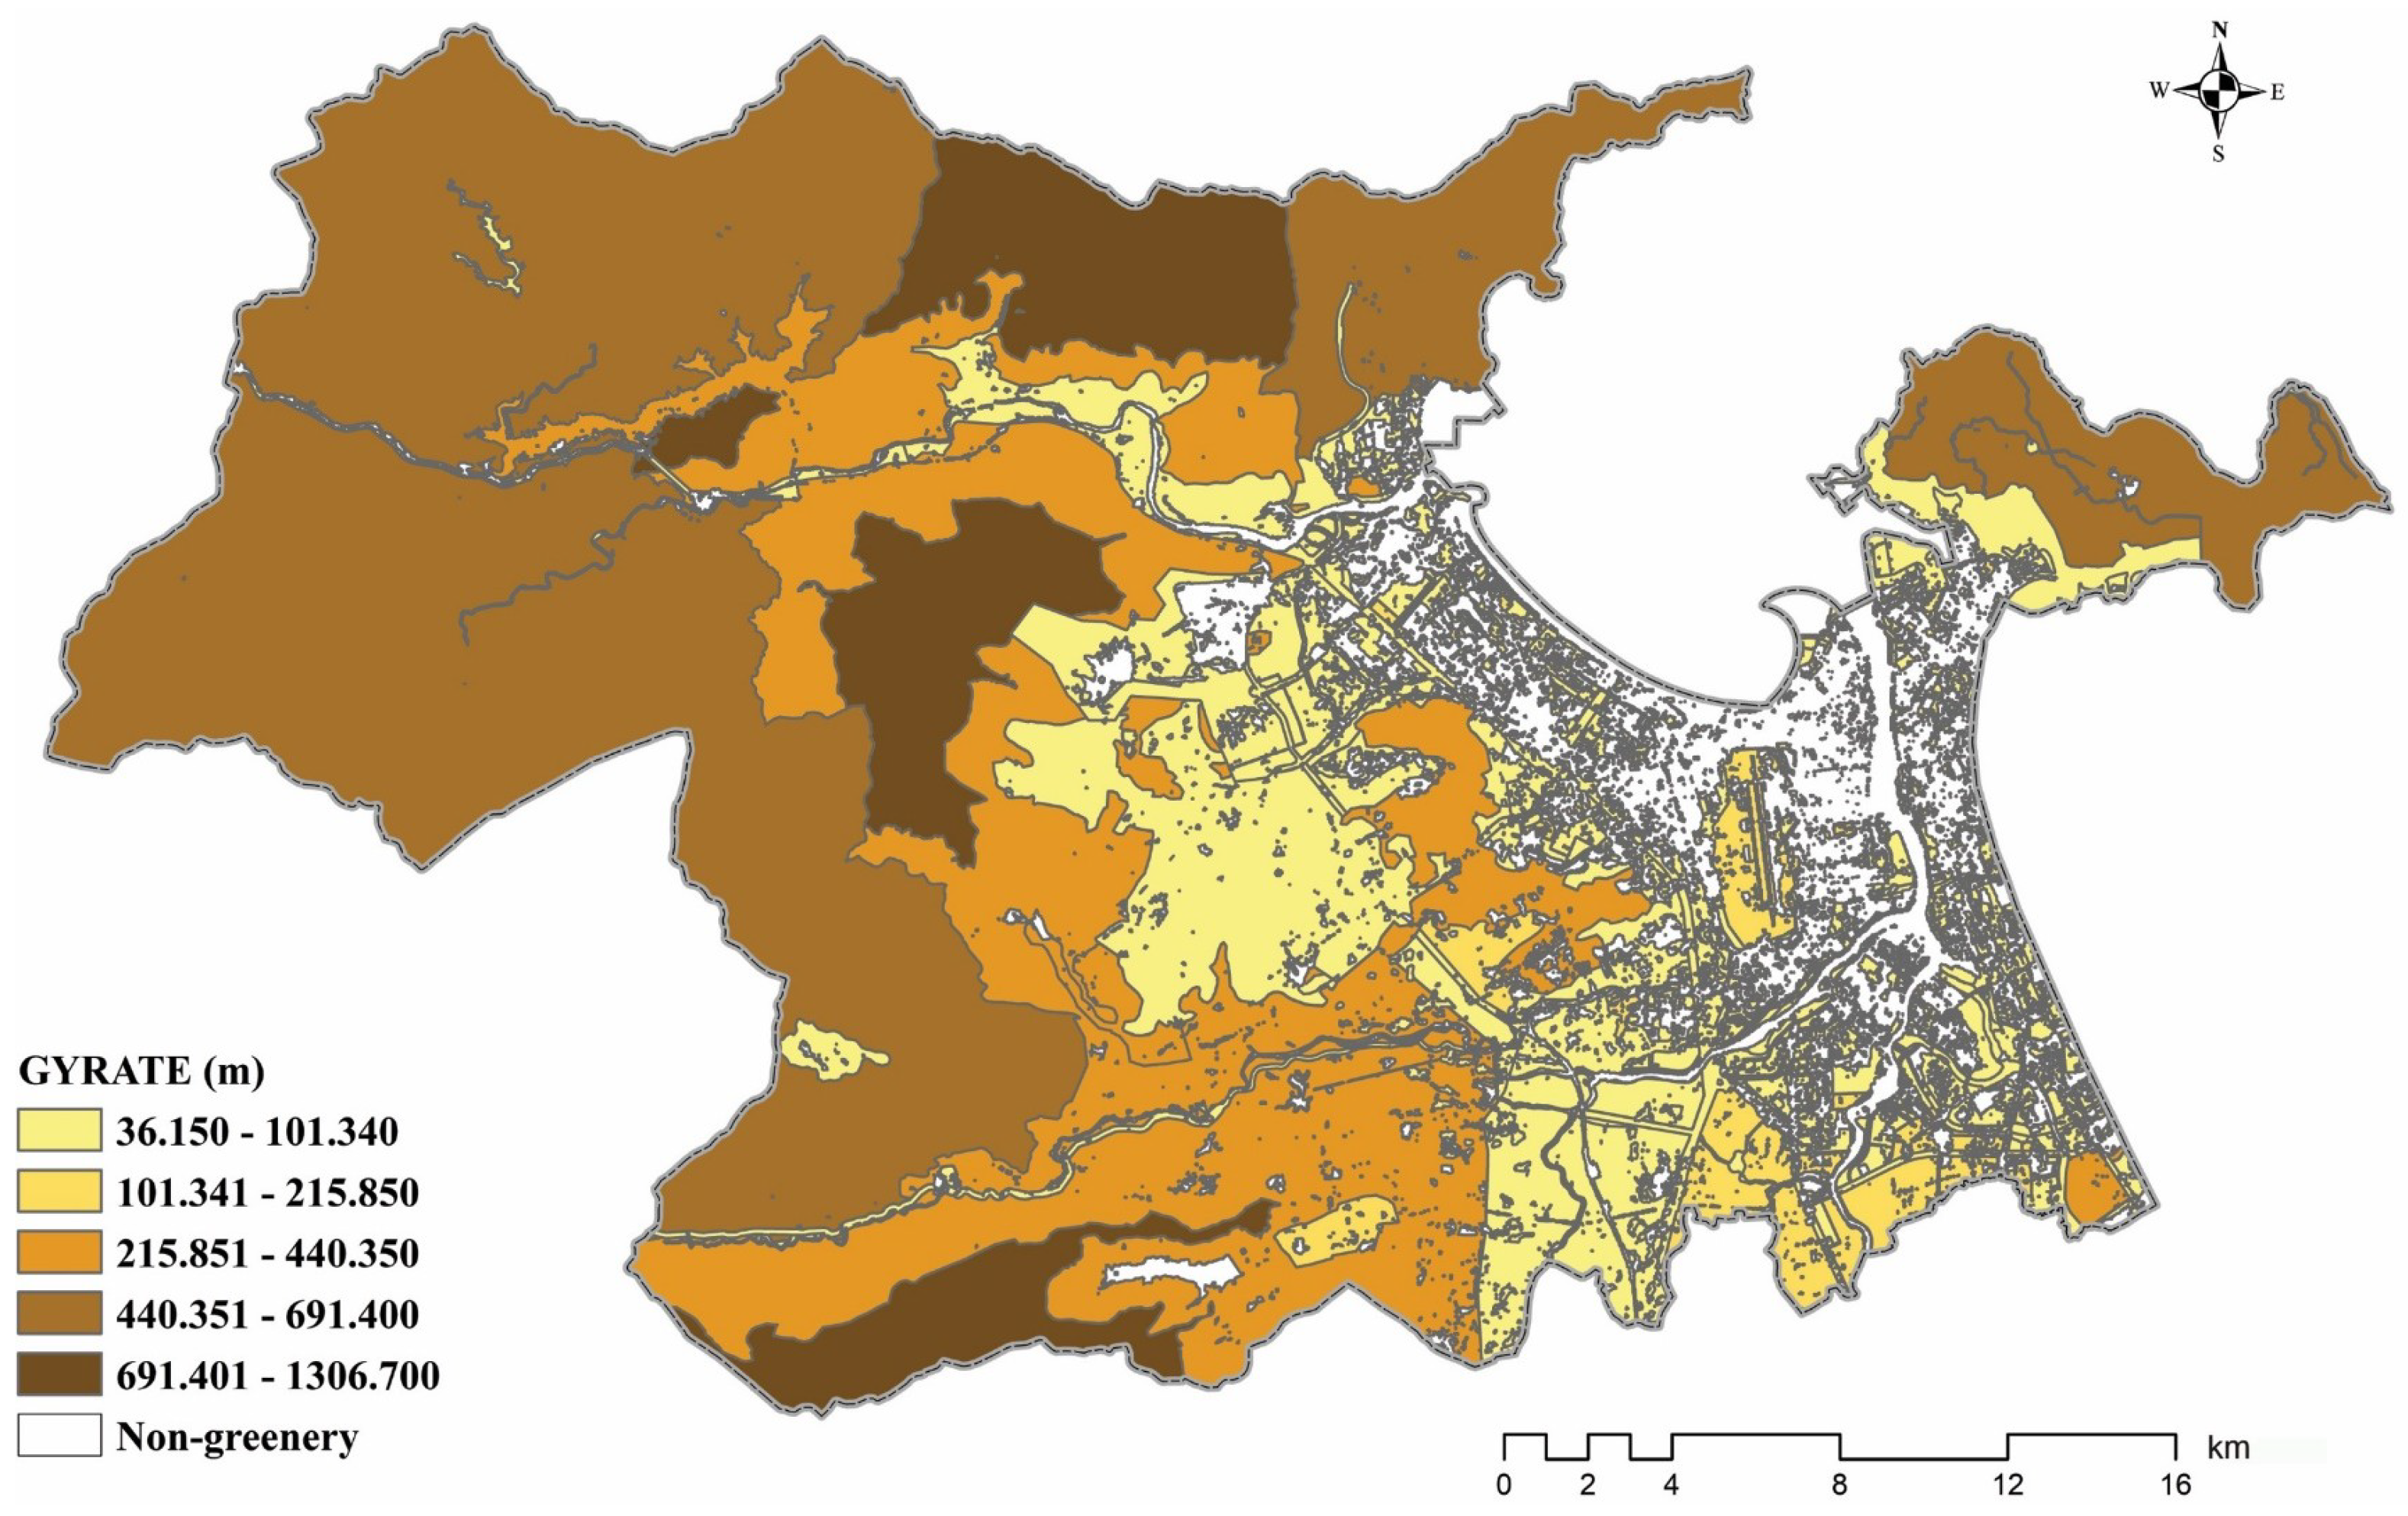
GYRATE is an indication of the average distance from the patch centroid to the cell in that patch (
Figure 9). The combination of GYRATE, number of patches, and SHAPE can express the compaction of the patch.
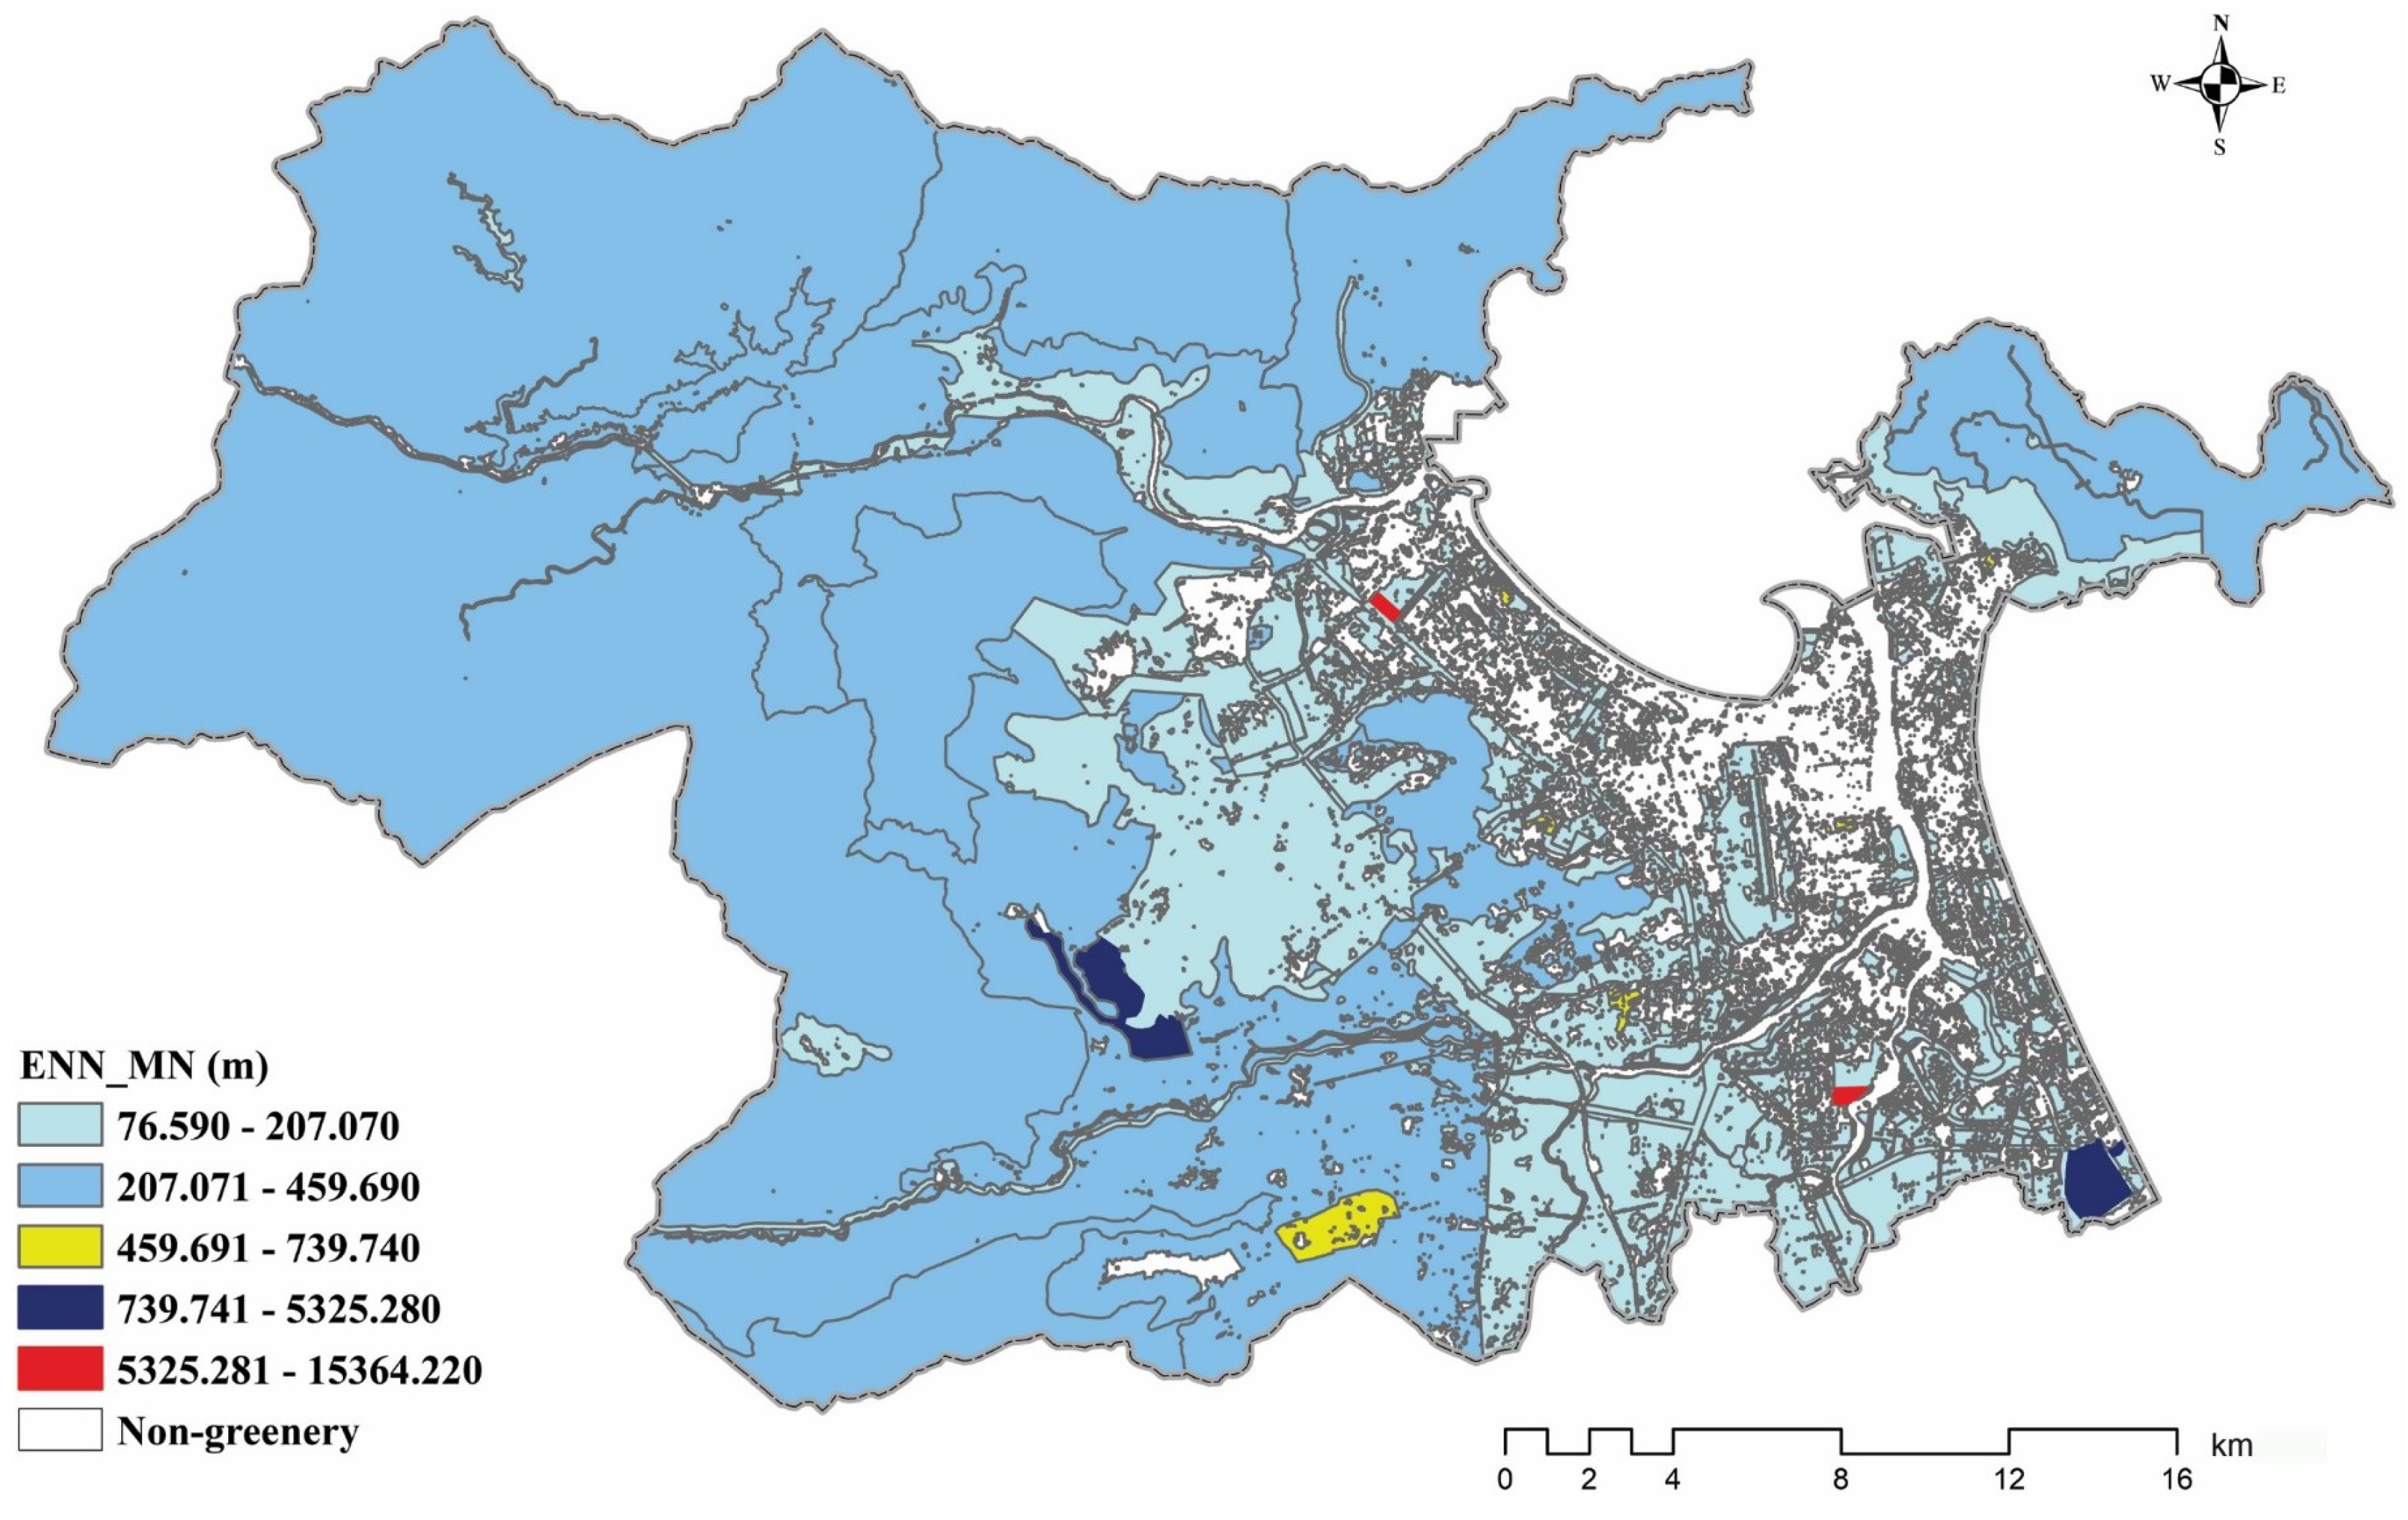
Mean Euclidean distance neighbour (ENN) is an indicator of the average distance between two patches in a landscape. The higher the distance, the more fragmented the patches in that landscape. In Da Nang City, waste-water treatment land has the highest ENN index of 15,364.22 m (
Figure 10). The distribution of greeneries in residential areas shows quite a high continuity with an ENN distance of 109.96 m for old residential areas. For the new residential areas, this index reduces to 88.42 m. In addition, the greenery in the new residential area has an average NP of 3.5 times higher but its AREA_MN is 0.7 times smaller than the old residential area. That indicates an increase in the density of greenery but scattered and low continuity. The contrast in the spatial structure of green space in urban and rural areas is also evident, with close proximity and higher density of urban green spaces.
Generally, the landscape shows spatial changes in a West–East direction. Western Da Nang city displays a low contrast landscape with a presence of the special purpose forest, protection forest, production forest, and agriculture. Sometimes, these areas of greenery are divided by water bodies and stream corridors, and the edges of the forest show a high efficiency with agricultural activities and rural residential areas. However, overall, they still have high connectivity. By contrast, there is a high contrast in the eastern part of the city with the presence of landscapes influenced by human beings such as harbour, high technology area, industrial zone, residential, cemetery and etc. The greenery here randomly contributes small patches. The easternmost part of the city is the Son Tra peninsula with the dominant distribution of special purpose forest, being completely isolated to the forest in the west. The anthropogenic influence reveals clearly the presence of harbour, residential area and the forest that are commonly shared by transportation and tourism areas.
Based on the evaluation of spatial structure such as size, area, density, and shape of patches, we were able to use landscape metrics to survey the geometrical shape, connectivity, and dispersion of greenery areas corresponding to various land uses in Da Nang city.
3.4. Da Nang Landform Assessment
Da Nang contains topographical features, landform diversity, like rivers, seas, low and high mountains, peninsula, wetlands, lakes, which make up a diverse ecosystem, as an ideal green space. In the north, the Hai Van mountain range reaches out to the sea, forming the Cu De River that flows into Da Nang Gulf; in the west, the Truong Son mountain, Ba Na and low hills are lower toward the East, one of which was invaded by urbanization; and in the east, there is the Son Tra Peninsula with a natural conservation area; in the South, there is Ngu Hanh Son Mountain forming the spiritual relic. Son Tra natural conservation area has a total natural area of 4439 ha; Ba Na area has a total area of 8437 ha; the city has a few parks with only more than 20 hectares but the 29-3’s park is large and the oldest park with a greenery system and lakes being relatively full.
River, lake and sea systems have created a natural drainage system for Da Nang city, creating a diverse landscape and wetland ecosystem. Two main tributaries flowing through urban areas are the Han River and Cu De River: the Han River is the confluence of three small tributaries, as Cam Le River, Do Toa river, and Co Co river with a total length of 204 km; the Cu De River is the confluence of three rivers: the Nam River, Bac River and Truong Dinh River, originating from the south-west of Hai Van Pass with 38 km in length. In general, they have some characteristics of the central coast region with limited length, steep slope, water level fluctuation, large water flow, and poor silt. The Da Nang beach bears tide up to twice a day, with the fluctuation range of about 0.6 m [
52].
In brief, the Da Nang has diversified landform that brings the great benefits for sustainable development. Hills and mountains represent a large green patch in the urban area with various species; coastline ecosystems help to improve micro-climate conditions and a natural corridor; rivers and lakes provide a great natural drainage system for city and contribute to river corridors for green infrastructure; moreover, the wetland supports the diversity in urban green space and organisms. However, the negative impacts on this feature gradually occurred by the time due to the limitation in management and planning.
3.5. Urban Context Analysis
By review the government documents and planning projects proposed by Da Nang urban planning institute regarding urban context, there are two points relevant to population distribution and function distribution that need to be considered.
In the centre of the city, population density is higher than in the neighborhood with the highest population distribution of up to 19,064.85 persons/km
2. The suburban area has a total natural area of 241.51 km
2, equivalent to 19% of the natural land area of a whole city [
55]. The old urban areas bring administrative offices together, while the north of the city mainly includes industrial zones and schools. The urban features of Vietnam in general and in Da Nang, in particular, are that the urban category is different from that in western countries, and the separation between the public functional areas out of the private function is very fragile. The row houses are filled in all parts of the municipality to meet residential needs, leading to the scarcity of green space in urban areas (
Figure 11).
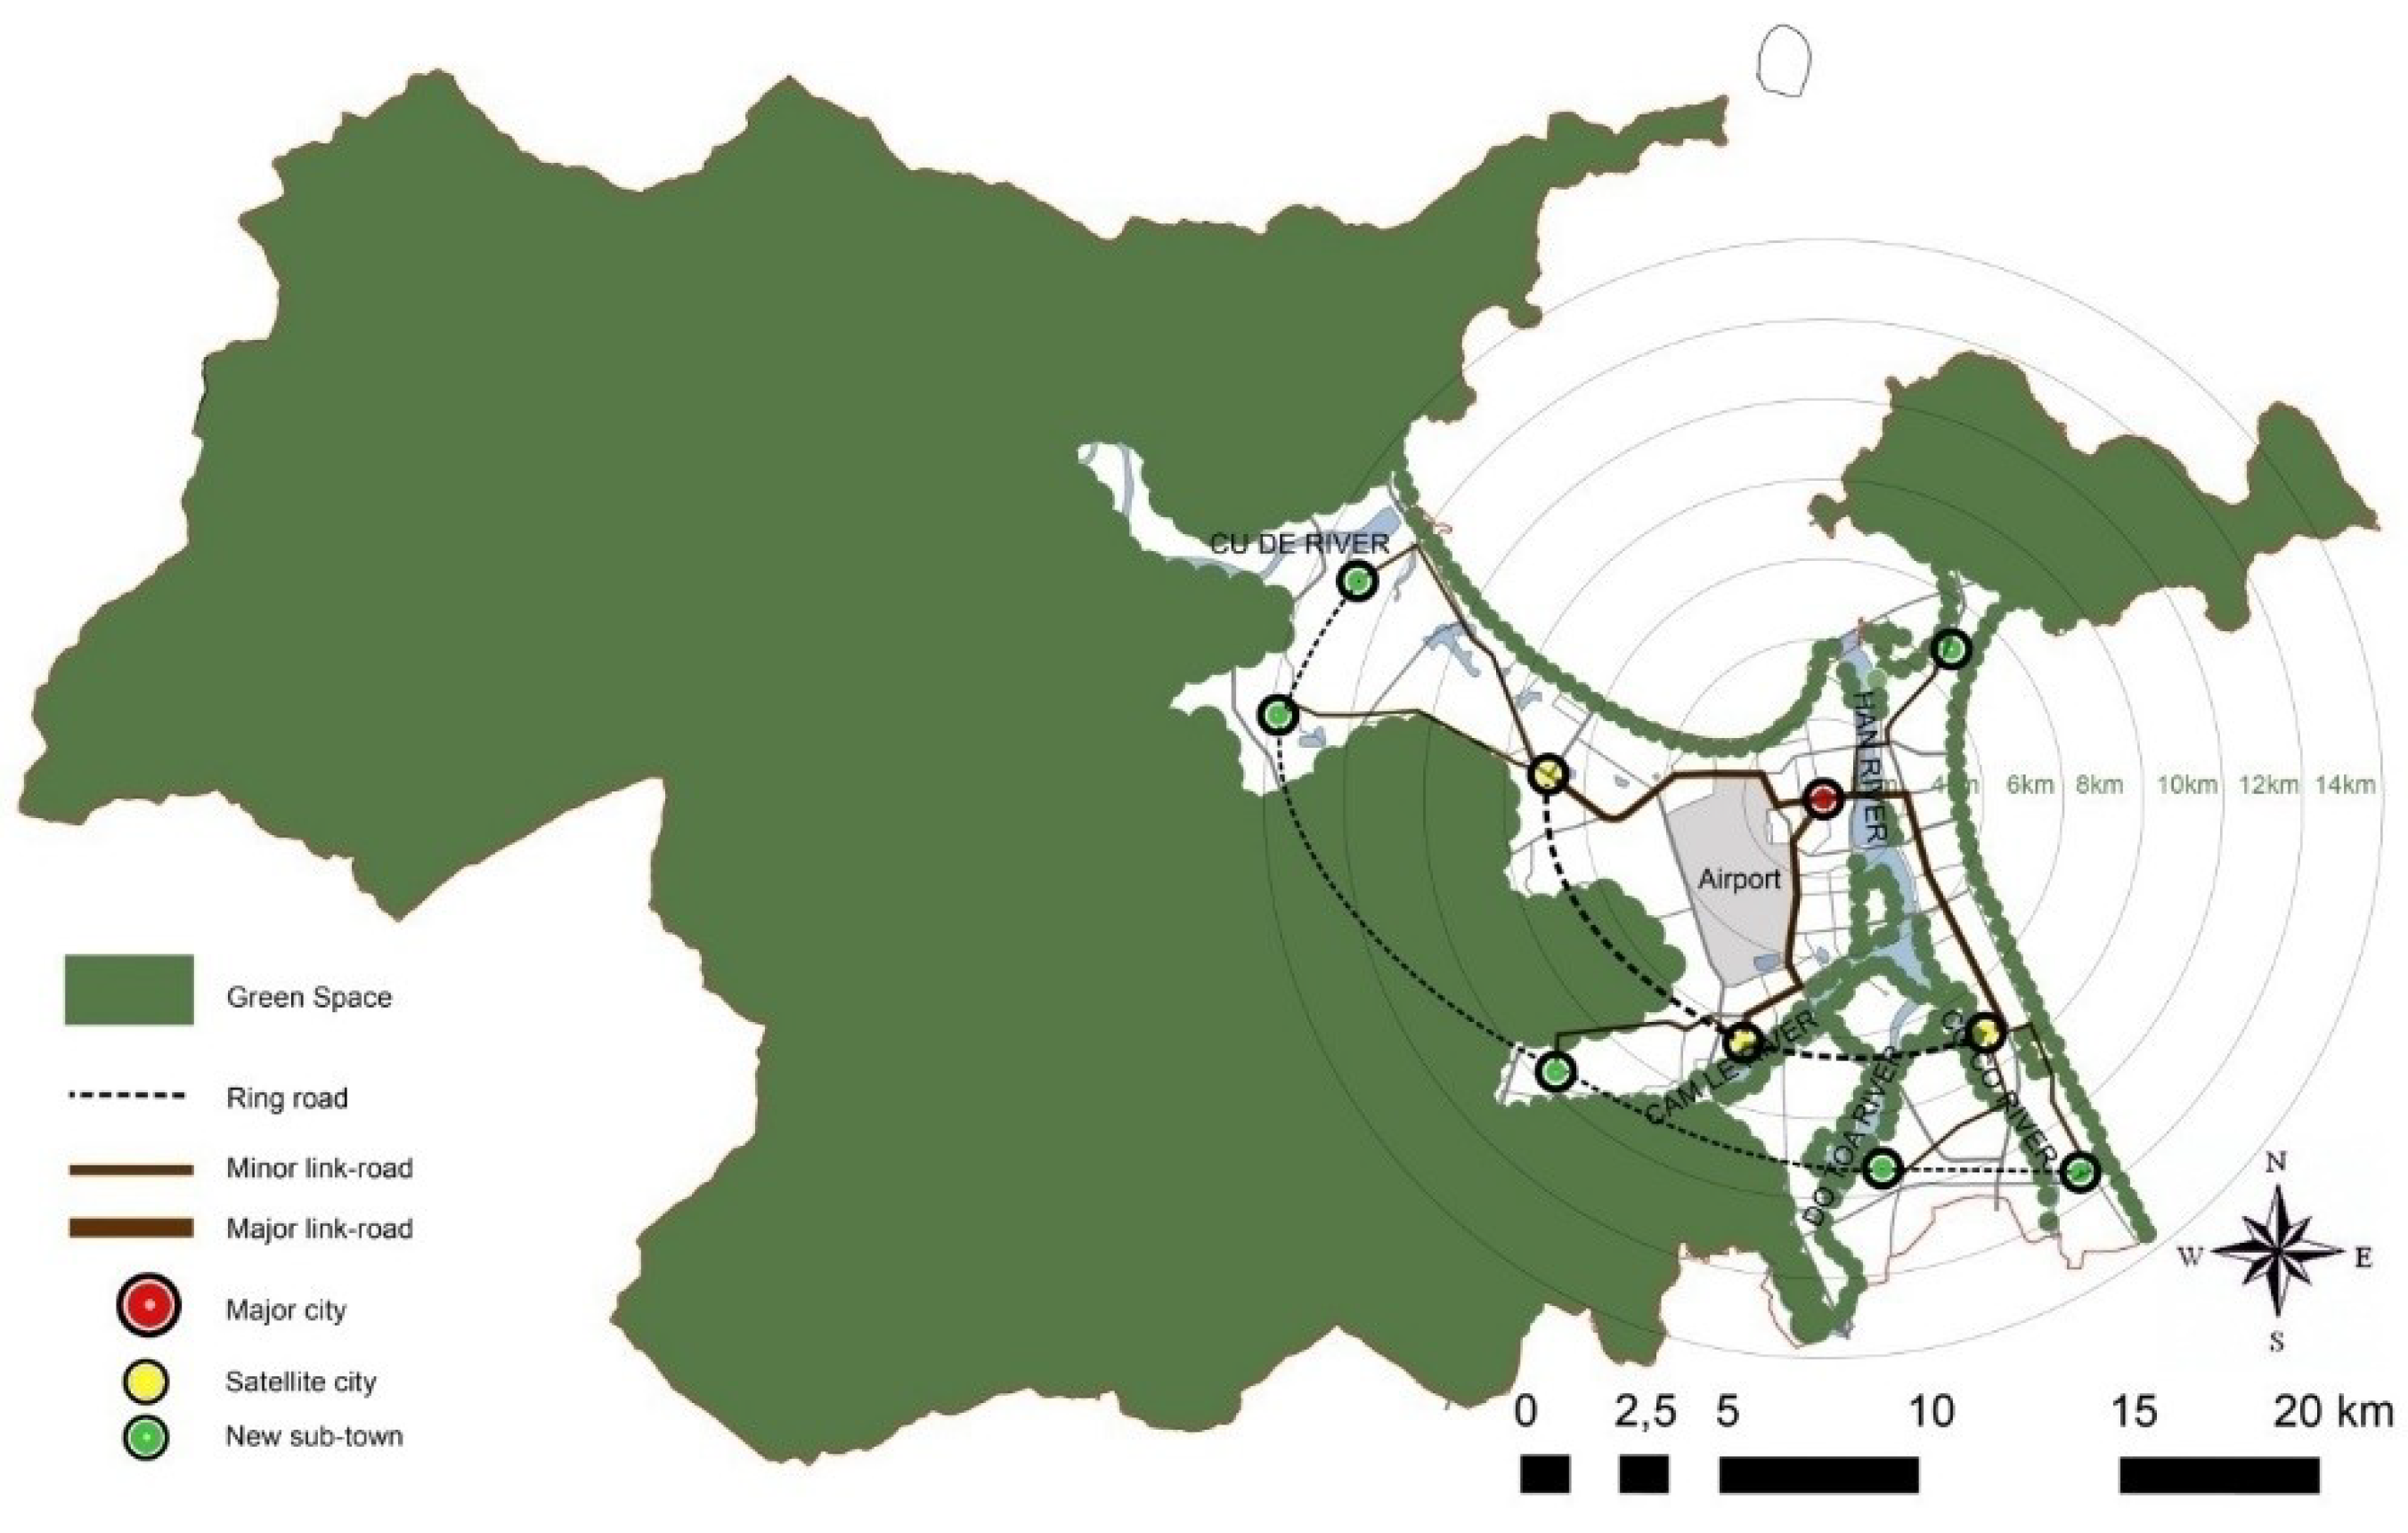
Urban planning regulates land-use scenarios in the future and orients population distribution around the city; this has an effect on the structure of green spaces. With Da Nang city’s development orientation in 2030 and vision by 2050, urban expansion to the south, south-west, south-east and north-west builds new urban centres as satellite cities [
55]. The overall plan puts forward suggestions for improving, upgrading old town areas, relocating unsuitable functions, and developing new satellite urban areas. Vietnam’s construction standards specify the area of urban green space as 10–12 m
2/person [
56], which is a foundation to establish a comprehensive system of green space standards.
To sum up, the distribution of population can illustrate the overview of the needs of people in using green open space. However, the main public green spaces of the city centre are almost all street space. The green space index of the whole city remained at 4 m2/person, whilst the green space standard for a common city specified by the government is 7–8 m2/person. This means that this city lacks 400 hectares of green space. By this way, a greenway can be considered for satisfying human needs and encouraging the connectivity between blocks in central and other areas. The oriented planning for 2030 and vision by 2050 proposed the connections between the city centre and other sub-cities surroundings, but only for regional traffic connection. It still does not consider the green space and movement connections.
3.6. Preservation Factors Assessment
Mentioning urban green spaces, conservation elements include existing green spaces, open spaces, the cultural, historical, ecological sites, ecological conservation areas, and rare plant species.
Da Nang owns more open spaces along the river and the sea, and parks and lakes that also play a role as an urban green space. In 2008, the statistical result showed that the average area per capita of the park in Da Nang is 0.45 m2/person. Among them, Hai Chau and Thanh Khe District cover an area of 0.53 m2/person and 1.19 m2/person respectively. Son Tra District has the lowest area of 0.43 m2/person. The rare existing park is developed based on terrain features, culture, and history, so it is the key to forming important links in the system of greenways.
Green spaces and heritage sites play an important role in entertainment functions. Da Nang—a major trading port of central Vietnam—is a cross-cultural region; moreover, Cham Pa Kingdom’s ancient culture is the predecessor of this land. It contains various community culture relics including temples, pagodas, churches, the ancient Champa Museum, the Ngu Hanh Son Mountain, and the Dien Hai Citadel that work together as notable historic sites. However, it is currently ignored and isolated between the other buildings.
Da Nang inherits unique natural heritages with long gorgeous beaches stretching along the city, the forest reserves, and diverse sea and forest ecosystems. It can be seen that protecting and exploiting as well as expanding the recreational space in coastal areas and riverside and developing forms of walking, open spaces in the crowded downtown area are necessary.
3.7. Riverside and Lakesides’ Green Spaces
Urban areas along the edge of the water inherit some certain benefits of open spaces. The waterfront shorelines are often ignored or improperly exploited in urban areas in Vietnam. The actual cases include Royal Spring Park in Georgetown, Kentucky, Creek Front in Denver, Colorado, and riparian greenways in Nanjing City, China.
3.8. Street and Pavement System
Streets with green trees like greenways will provide a green space network. However, faults in green networks of streets and pavements appear because some certain constraints in urban structures and planning should be resolved by replacing concrete walls with fences to join trees in private areas with pavements. In some regions with a high construction density, the strategy of garden plots is implemented [
57]. These buildings may occupy half of the width of one lot, and the rest of such a plot went on greening [
58]. Nevertheless, owing to the differences in housing forms in cities of Vietnam, it is possible to take advantage of infrastructure landlines after each row of houses as green tree lines for greening enhancement in front of each lot.
The function of such long and narrow garden plots provides residential greening spaces and are the head connectors of the overall green network, especially in which physical constraints do not allow a good design, even narrow paths can be transformed into linear green spaces.
3.9. Additional Parks
Parks are possibly formed owing to different factors but mainly based on two basic elements: subjective and objective. Subjective factors are attributed to the demands of human beings, which are determined by intersections and high population density to facilitate access and the relaxation of residents. One possible example is at Millennium Park in Chicago, USA, which is located in the crowded and noisy downtown area. Meanwhile, objective elements to form the park are locations with a certain attractiveness of landscape, environment, culture, and history.
3.10. Planting Arrangement
Projects of planting need to be investigated, invested, managed, and concerned effectively. Maximizing local plant species for urban greening systems and belts should be accompanied with the diversity of species, microclimate adjustment and effectiveness of aesthetic along with sustainable factors to resist external impacts of nature such as floods and storms.
Junk flora should be excluded, while appropriate plants must be retained to make spaces for the development of green spaces and open spaces. The prioritized native species are selected from appropriate ones in terms of shape, structure, and growth rate, resistance to the harshness of urban areas and storms, and an ability to survive in nature [
59].
5. Summary and Additional Discussion
There is no doubt that, landscape ecology principles are a useful tool for understanding landscapes structure in the urban region and support the green infrastructure planning which is a positive way to conceptualise green space planning. The analysis results mentioned in
Section 3 show a potential for contributing to sustainable development processes in Vietnamese cities because it contains the elements that can satisfy the landscape ecology principles. The most important thing is the connectivity of all the elements at various scales. Indeed, the investigation found the individual ecology elements in the green space pattern of Da Nang, nevertheless, most of them are developed in segregation; a few have been weakly linked together.
Connectivity is considered as the property of landscapes being the relationship between landscape structure and functions that refer to the level to which a landscape facilitates or impedes the energy, materials, nutrients, species, and human movements across a landscape. The connectivity in green space planning commonly addresses the connected network of open spaces and functions. The level of connection of green open space has the corresponding to the level of space quality.
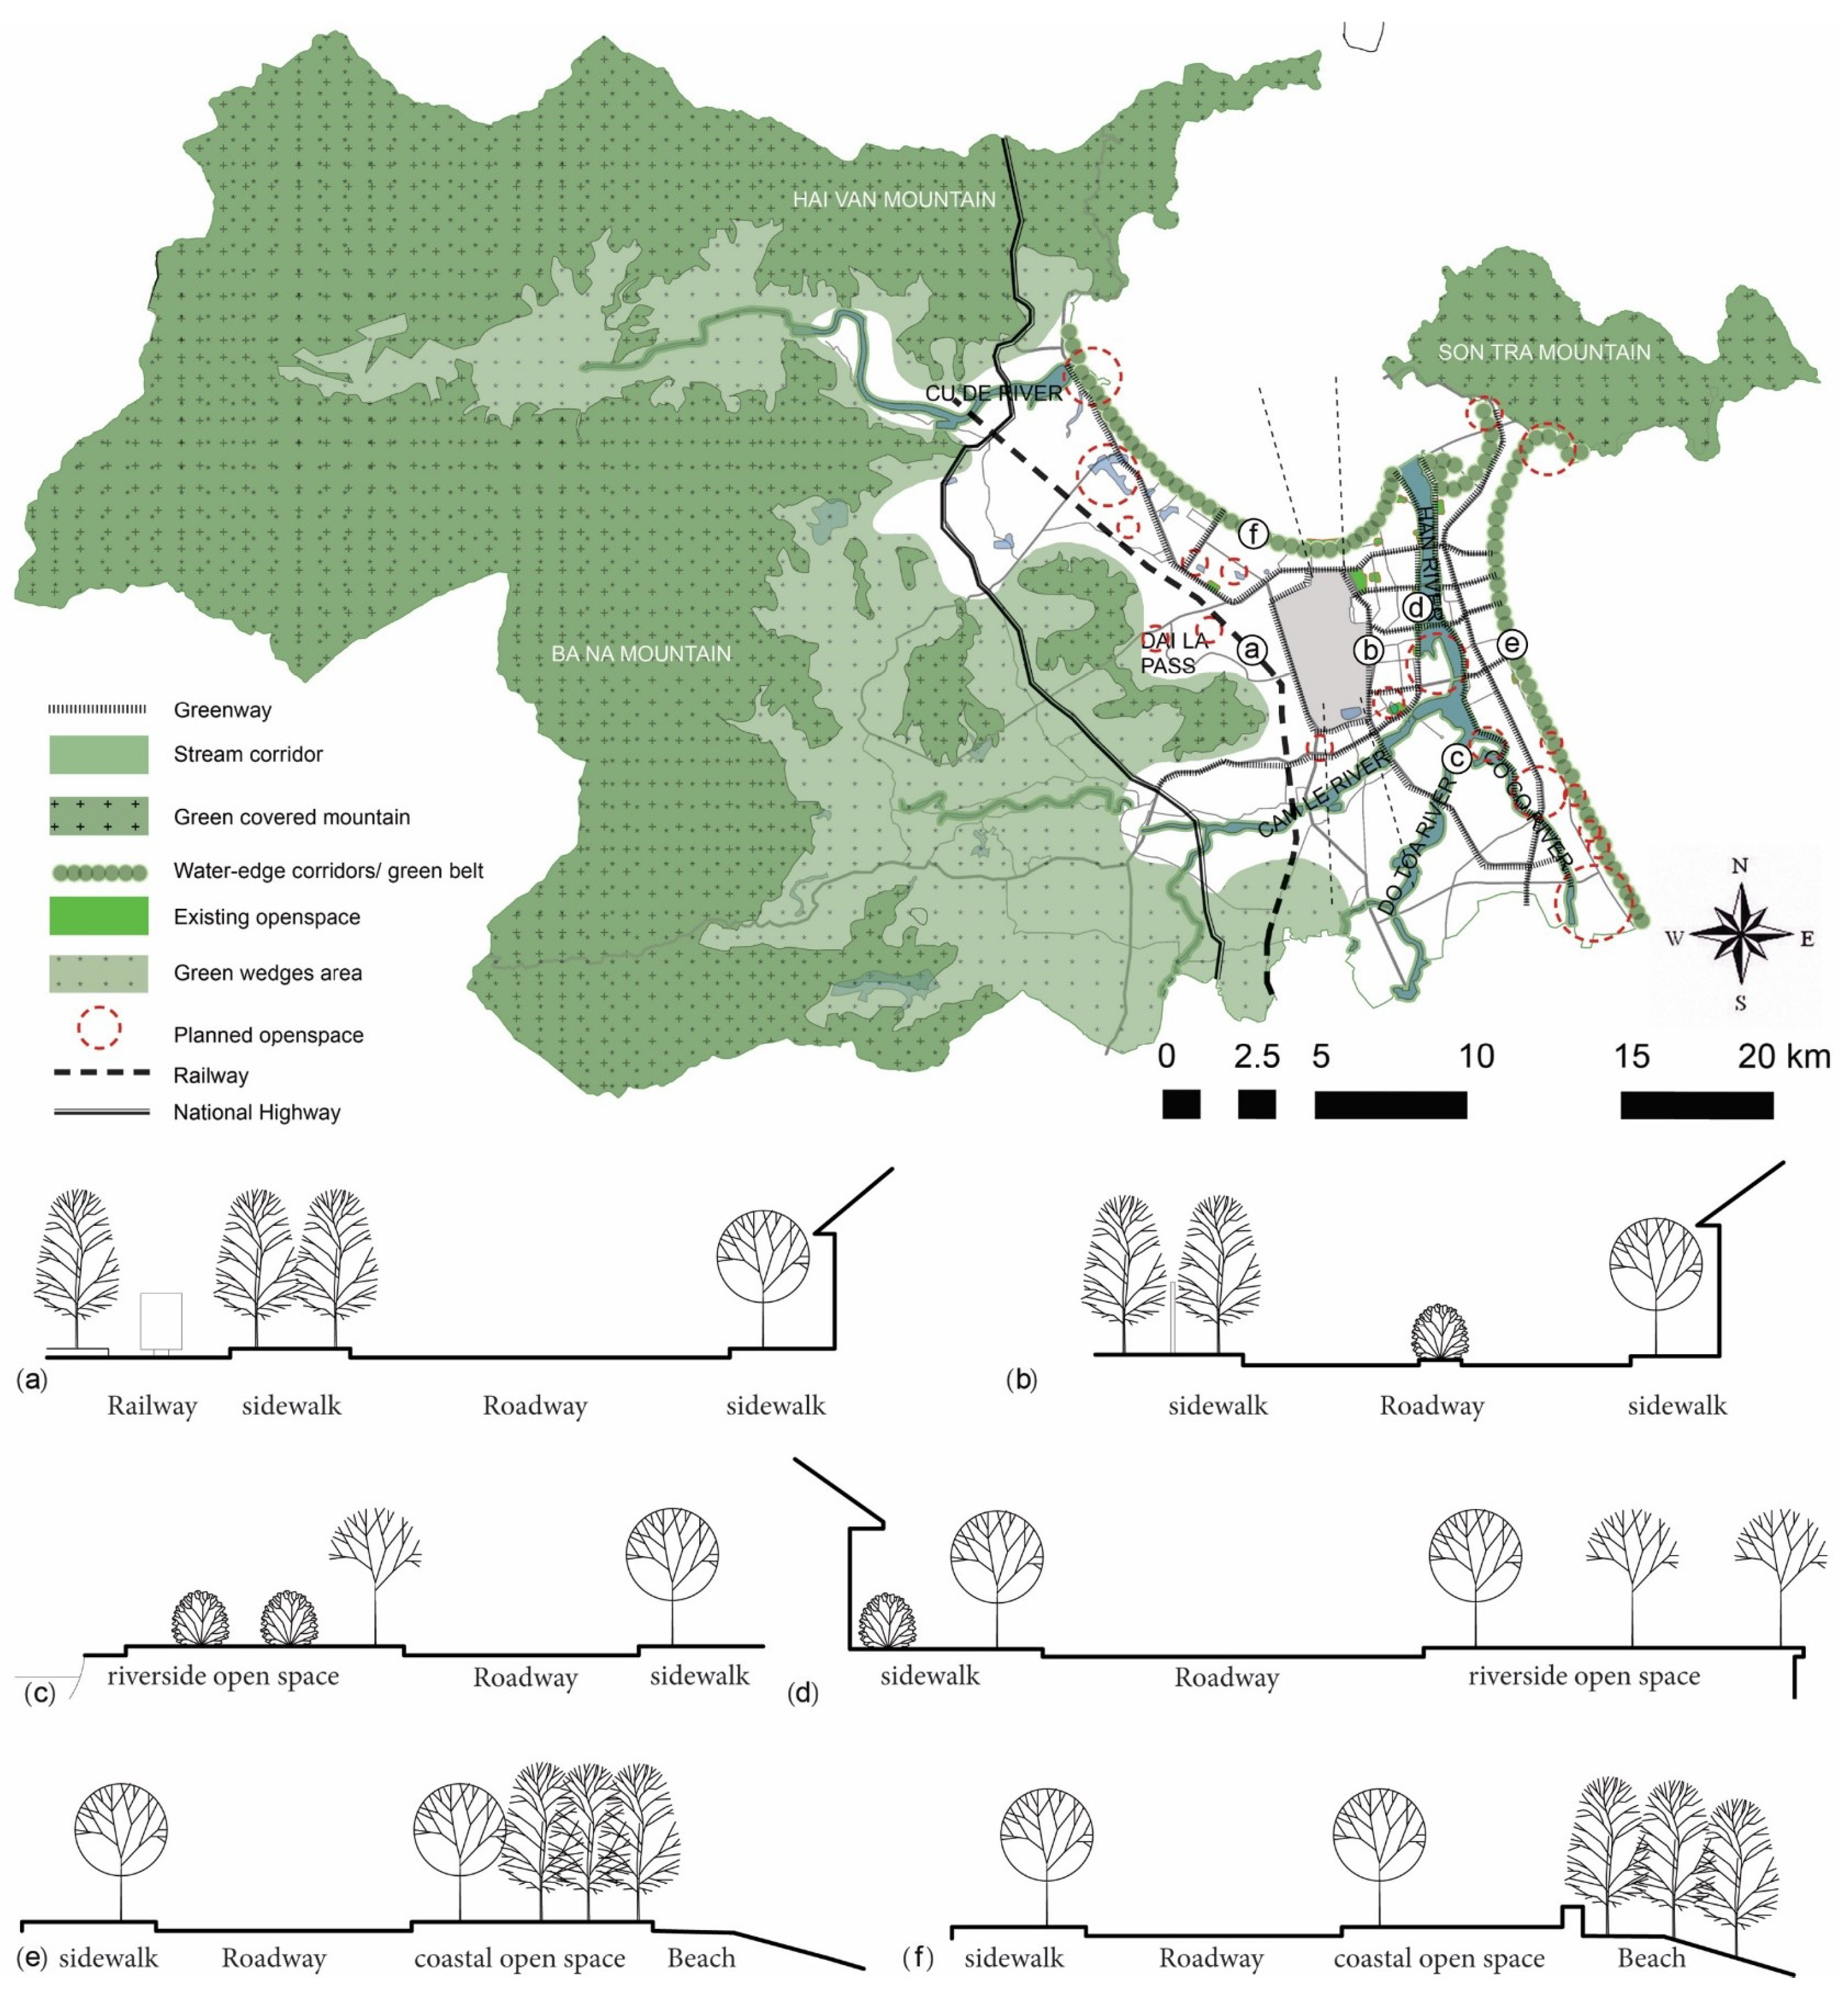
Space quality is acquired by the interaction between a community and environment and defined as three qualities that included quality of place, environment and life contained within the green infrastructure. It was assessed according to the connectivity and integrity of the networks which combined to form the green infrastructure. A high-quality green space system could be made up of high-quality green spaces and green routes that are connected together to form coherent networks. Therefore, the linkages of different functional areas and features was conducted for green space planning of Da Nang in different scales, starting at the urban region scale with the connection of urban green lobes and fingers for suburb areas and city areas; at the urban metropolis scale, the connection of various kinds of greenway, corridors, and green belts; and at the settlement scale, the connection of green matrixes being scattered in residence areas and other uncultivated spaces.
6. Conclusions
Urban ecology landscape is a quite new field for Vietnamese researchers and urban planners. Therefore, it is essential to apprehend and apply successfully ecology, landscape and ecological landscape knowledge to cities that need deliberate and meticulous research. Given Da Nang’s real situation and urban context, the understanding of the overall urban spatial planning oriented from 2020 to 2030 precisely, and the participation in conversations with urban planners, there are some fundamental chasms regarding urban landscape planning theories in the urban region, metropolis and settlement scales. Due to the complicated connection between old and newer areas, the obliged solution must progressively advance greening approaches by stages based on principles in accordance with the urban context and future-oriented planning of Da Nang. There are several shortcomings in treatment to deal with the urban situation, confusion over applying existing treatments or theories, linking between various areas. It is also a significant motivation for proposing a green space planning for the entire city based on landscape ecological rules.
Coming up with the construction idea of a green space system, which would satisfy the urgent urban requirements, increases the urban green-covered rate scientifically and suitably. The application of landscape metrics to a green space system analysis has described the characteristics of the landscape such as spatial distribution, area, density and shape in Da Nang city. Applying landscape ecology principles, the authors propose solutions for improving the green space system as follows: (1) at the urban region scale, maintenance corridors of suburb areas around the built-city will be established to resist urbanization invasions. Semi-natural and natural areas around the city area, which take a role as “the tremendous green lung” adjust microclimate for the whole city, purify polluted air, and return fresh air for the atmosphere and provide ecological recreation facilities; (2) at a fine-metropolis scale, establishing the green space system for the whole city aims to deal with urgent needs of the living environment which is affected seriously by climate change. In correlation between the existing urban configuration and urban green space, the green space system meets amusing needs within permissible limit of urban environment and provides a possible living environment for species in various semi-natural environment rangers; (3) at the settlement scale, paying attention to specific and more detailed green space element such as green matrices, which deeply affect the urban structure aims to interact with each entity in the city to supply the touch of nature through daily activities of human beings. A green space system is created by several factors, which are divided into a multidimensional hierarchy so as to maximize green matrices to bring significant advantages to the environment. The option between elements of configuration, tier, species, and form, which applied to an urban landscape system when approaching ecology affirms high stability, biodiversity, and sustainable development as a system.
The valuation of a healthy city is frequently assessed in terms of open space facilities and sustainability over time. Obtaining these things means preserving the green space system. Seven elements, which support a sustainable urban system, belong to green wedges, green corridors, river corridor, and coastal belts that restrain outer city-affected factors to the city area and prevent urbanization from pervading the green space system.
The limitation of this study is just using medium-resolution Landsat image data, so the land use-based assessment is largely dependent on the detailed and current land-use map of the city. The application of high-resolution data can solve this problem, especially for greenery in urban areas with higher fragmentation.
