Classification and Estimation of Irrigation Waters Based on Remote Sensing Images: Case Study in Yucheng City (China)


1
College of Business and Institute of Green Development, University of Jinan, Jinan 250022, Shandong, China
2
Water Bureau of Yucheng City, Yucheng 251200, Shandong, China
3
Institute of Geographical Science and Natural Resource Research, CAS, Beijing 100101, China
*
Author to whom correspondence should be addressed.
Sustainability 2018, 10(10), 3503; https://doi.org/10.3390/su10103503
Submission received: 4 September 2018
/
Revised: 24 September 2018
/
Accepted: 28 September 2018
/
Published: 29 September 2018
(This article belongs to the Section Environmental Sustainability and Applications)
Abstract
:The downstream plain of the Yellow River is experiencing some of the most severe groundwater depletion in China. Although the Chinese government has issued policies to ensure that the Yellow River can provide enough irrigation waters for this region, groundwater levels continue to decrease. Yucheng City was selected as a case study. A new method was designed to classify the cropland into various irrigated cropland. Subsequently, we analyzed data regarding these irrigated-cropland categories, irrigation norms, and the minimum amount of irrigation water being applied to cropland. The results showed that 91.5% of farmland can be classified as double irrigated (by both canal/river and well water), while 8.5% of farmland can be classified as well irrigated. During the irrigation season, the sediments brought in by the river have blocked portions of the canals. This has led to 23% of the double-irrigated cropland being irrigated by groundwater, and it is thus a main factor causing reductions in groundwater supply. These blocked canals should be dredged by local governments to mitigate local groundwater depletion. The method for classifying irrigated cropland from high-resolution images is valid and it can be used in other irrigated areas with a declining groundwater table for the sustainable use of groundwater resources.
1. Introduction
The downstream plain of the Yellow River is one of the most important irrigated regions in China. Currently, this region faces continuous declines of the groundwater table. Previous studies have indicated that the shallow groundwater table has descended at a rate of 0.46 ± 0.37 m/year, while the deep groundwater table has declined at a rate of 1.14 ± 0.58 m/year [1,2]. Hence, this region has become the largest groundwater funnel in the world [3]. The waters of the area are mainly used for the irrigation of agricultural lands and the over-exploration of groundwater for irrigation is considered to be the primary factor driving groundwater depletion. It should serve as an effective way to resolve the declining levels of groundwater in the region by increasing the use of canal irrigation while decreasing groundwater irrigation.
From 1972 to 2000, the waters of the Yellow River were highly diverted before reaching downstream areas, causing most cropland to be irrigated with groundwater [4]. To ensure a more reliable supply of river water, central governments issued the “Yellow River Water Annual Allocation and Main Stream Regulation Plan”, as well as the “Yellow Water Regulation and Management Methods” in 1998 (www.mwr.gov.cn). The goal of these policies was to distribute a specified amount of available river water to each administrative unit and to prevent the diversion of the river in downstream areas. These policies ensured that downstream areas would receive enough water to provide a potential basis for improving groundwater depletion after 2000. However, groundwater levels have continued to decrease despite the implementation of these government policies.
The main reason is that groundwater is still used as the irrigation source for cropland in some areas. Identifying those well-irrigated cropland at high accuracy got to be a necessary step to prevent the decreased groundwater table level. However, no methods are available to classify the cropland into various irrigated cropland at high accuracy currently. So, the empirical estimated data for various irrigated cropland was used in many studies. For example, Shu et al. [5] assumed that the cropland that is within 2 km of canals was classified as canal irrigated cropland, and others were classified as well irrigated cropland. This caused that some cropland that is irrigated with well within this scope was classified as canal irrigated cropland, and some canal irrigated cropland out of the scope was classified as well-irrigated cropland. The estimated data would cause the inaccuracy of related results and it would provide the wrong information for relevant groups. Zhang et al. [6] classify the whole region of Heihe River Base as well-irrigated cropland according to statistical data. Then, the water management methods were provided. Such a classifying method over-estimated the well-irrigate cropland area, and it would lead to inaccuracy estimation.
Remote sensing images have been widely applied for the extraction of geographical data. Lu et al. [7] extracted the single-cropping land and double cropping land from remote sensing images with the Normalized Vegetation Index (NDVI) characteristics of winter wheat and other crops during vegetation growing stages. Dong et al. [8] separated the paddy rice land from other land based on the flooding characteristics of rice during transplanting stage. These extraction methods all indicated that certain category could be extracted based on its special characteristics than any other types from remote sensing images. This also shows that various irrigated cropland could also be extracted from the remote sensing images. Therefore, this study’s objectives are: (1) designed a new method of classifying farmland into various irrigation types and identifying the actual scope of groundwater irrigation using high-resolution remote sensing images, (2) analyzed the relationship between the use of groundwater for irrigation and groundwater depletion, and (3) provided suggestions for mitigating the continuous declines in the groundwater table of the region. This study would help to prevent the groundwater table from decreasing in those areas that is similar to the study area.
2. Study Area
Yucheng City is located in northwestern Shandong Province, north of the downstream plain of the Yellow River (Figure 1). The Yellow River and groundwater are the main sources of irrigation water. The city is composed of 12 townships, with a total area of 990 km2 [9]. The altitude in the study area ranges from 19.3 to 27.3 m above mean sea level. Average annual rainfall is 555.5 mm and annual mean temperature is 13.3 °C. The major crop types planted in this area include corn, wheat, and soybean. The soils of the region are dominated by yellow soil and yellow-brown soil [10].
3. Data Sources and Methodology
3.1. Data Sources
Six datasets were used to classify cropland and analyze the amount of irrigation water from various sources. Cropland data and other land-use categories in Yucheng City in 2017 were derived from remote sensing images. Gao Fen Er Hao images recorded in early May at 0.8 m resolution were used to obtain farmland and other land-use categories in 2017. These images were downloaded from the China Centre for Resources Satellite Data and Application (www.cresda.com). Data for irrigation categories and the actual area of cropland that is irrigated by canals were both derived from images at 0.8 m resolution recorded in early May 2018, while using the visual interpretation method. Daily meteorological data were obtained from the weather observation station in the study area, recorded by the State Meteorological Bureau. Data on river and underground irrigation waters for one unit of farmland were acquired from local governments.
3.2. Methodology
In the study area, all farmland can be irrigated by groundwater and could therefore be classified as well-irrigated cropland. However, only some cropland, i.e., lands adjacent to rivers or canals or are connected by sublateral canals, can be classified as canal-irrigated cropland. Therefore, croplands were classified into two categories: well-irrigated cropland and double-irrigated cropland (i.e., cropland that could be irrigated by both groundwater and canal/river water).
The agricultural areas of the study region are divided into land parcels by roads, rivers, canals, various landforms, and administrative units. Land parcels were initially extracted from remote sensing images using the visual interpretation method. Rivers and canals are typically more than 2 m wide, and data for these waterways were extracted from the Gao Fen Er Hao images. According to our investigation, if a land parcel is within 300 m of the river or canals and the river or canals contain enough water, farmers often connect the land parcel to the river through water belts (Figure 2); therefore, these land parcels were classified as canal-irrigated cropland using the visual interpretation method. Sublateral canals are a type of connection ditch between rivers/canals and land parcels or between wells and land parcels; these canals are approximately 1.0 m wide. The pan-band of the Gao Fen Er Hao images is sensitive to water, and the sublateral canals could be identified from the 0.8 m resolution images. If a land parcel was located far from the river, but was connected to it by sublateral canals, it was also classified as canal-irrigated cropland. All other land parcels were classified as well-irrigated cropland. Our categorizations were checked while using 30 samples for canal-irrigated cropland and 30 samples for well-irrigated cropland. All of the samples were randomly selected in the study area, and the percentage of accurately classified irrigated cropland was above 95% (Table 1), verifying that our classification method was appropriate for the categorization of irrigated cropland.
The crops in the study area primarily include winter wheat, summer corn, and soybean. Winter wheat is planted in early October and harvested in early June. After winter wheat is harvested, summer corn or soybeans grow from early June to October, during which rainfall is abundant and irrigation is unnecessary. By contrast, winter wheat requires three irrigation events during its growing season. The first irrigation occurs in early October when the wheat is planted. The second occurs in late March, and the third is in early May when the wheat is in the filling stage.
The river water used for irrigation is supplied from the irrigation canals. The water gate at the Yellow River irrigation canals is opened during the irrigation period to allow for waters from the Yellow River to flow into the canals. Due to sand deposition and damage from human activities, some parts of the canal system have become blocked, and no irrigation water is able to flow through them. When this occurs, the corresponding cropland shifts to well irrigation. The actual area that is irrigated during the wheat growing season seldom changes. Therefore, the Gao Fen Er Hao images that were recorded in early May 2017 were used to extract the actual canal irrigation area.
The gross irrigation water use from various water sources was calculated while using Equation (1):
where Wg is gross water use (m3), N is gross irrigation norm (m3/ha), and A is actual irrigation area (ha). N changes as annual rainfall changes. Gross water use was estimated based on various values of N under different probabilities of irrigation (Table 2).
The improved Penman-Monteith equation was used to calculate daily potential evapotranspiration (Equation (2)) [11]:
where PE is the potential evapotranspiration (mm d–1), Rn is net canopy radiation (MJ m–2 d–1), G is soil heat flux (MJ m–2 d–1), T is the air temperature at 2 m height (°C), U2 is the wind velocity at 2 m height (m s–1), es is the saturation vapor pressure (k Pa), ea is vapor pressure (k Pa), Δ is the slope of the saturation vapor pressure curve (k Pa °C–1), and γ is the psychrometer constant (k Pa °C–1). Values of T, U2, and ea were obtained from weather station data. Rns is net shortwave radiation (MJ m–2 day–1), α2 is albedo, Rs is shortwave radiation (MJ m–2 day–1), n is actual duration of sunshine (h), N is the maximum possible duration of sunshine or daylight (h), as and bs are the fractions of extraterrestrial radiation reaching the Earth on a clear day (n = N), Ra is extraterrestrial radiation (MJ m–2 day–1), Gsc is a solar constant (0.082 MJ m–2 min–1), dr is the inverse relative distance between the Sun and the Earth, J is the day of the year ranging from 1 to 365 or 366, δ is solar declination (rad), φ is latitude (rad), Lm is longitude (degrees), Rnl is net longwave radiation (MJ m–2 day–1), Tmax is the maximum absolute temperature during a 24 h period, and Tmin is the minimum absolute temperature during a 24 h period. Daily evapotranspiration was summed to 10-day evapotranspiration.
Equation (8) was used to calculate the effective precipitation [12]:
where EP is effective precipitation (mm/d), P is precipitation (mm/d) and is the coefficient of precipitation. The value of is gotten according to Fang (2008) [12].
Crop evapotranspiration is calculated with Equation (9):
where ETc is crop evapotranspiration (mm/d) and Kc is the winter wheat coefficient.
The growing period of winter wheat is divided into several stages [11] (Allen et al., 1985, wenku.baidu.com). Kc is the winter wheat coefficient that is calculated according to Equation (10).
where K0 is a value provided by the FAO, U2 is the mean value for daily wind speed at 2 m height (m/s), RHmin is the daily minimum relative humidity (%), and h is plant height (m) during the growth stage.
Equation (11) was used to calculate the minimum amount of irrigation water for winter wheat (MIW):
where ETc is actual water consumption by evapotranspiration (mm/d), EP is effective precipitation (mm/d), and Gn is the underground water supply (mm/d), which was 0 in our study area. D is the number of days of winter wheat growth.
Values of mean MIW were listed in numerical order, and then the accumulative percentages of 50% and 75% were obtained. The mean MIW for probabilities of 50% and 75% were calculated.
4. Results
4.1. Area of Double-Irrigation and Well-Irrigation Farmland
Based on our classification methods, 91.5% of farmland in the region is classified as double irrigation and 8.5% of farmland is classified as well irrigation (Table 3 and Figure 3). The areas of double- and well-irrigation cropland were 51,149 and 4724 ha, respectively. Most well-irrigation farmland is located in the southwestern and northeastern areas of Yucheng City, primarily because the drainage density is relatively lower in these areas (Figure 4). The density of canals in this region is very high for northern China, as this area is located in the Yellow River watershed and it is well-known for its saline and alkaline lands in eastern China. The percentage of farmland is very high, and the region is economical key for its grain production. The central government selected this county as a test site for the improvement of its saline and alkaline soil in the 1970s, with the goal of increasing grain production. During that period, groundwater levels were very high and were at the surface in many areas. Drainage ditches and irrigation canals were widely constructed and used to discharge groundwater. The canals were used to draw from the Yellow River and to export excess saline and alkali soil using the canal-irrigation method. Consequently, the area of saline and alkaline lands began to decline. With subsequent economic development, large amounts of groundwater were used for industrial and domestic purposes. Due to this overexploitation of groundwater, levels began to decrease. Today, groundwater levels have decreased to 4 m, and saline and alkaline lands are disappearing (www.iqilu.com). Most drainage ditches have been transformed into canals to draw water from the canal. Therefore, the percentage of well-irrigated land is now very low. In other areas, the density of the canals is very low due to the low percentage of saline and alkaline farmland. The corresponding percentage of canal-irrigated farmland in other areas is therefore also expected to be very low.
4.2. Actual Area of Farmland Irrigated with Yellow River Water
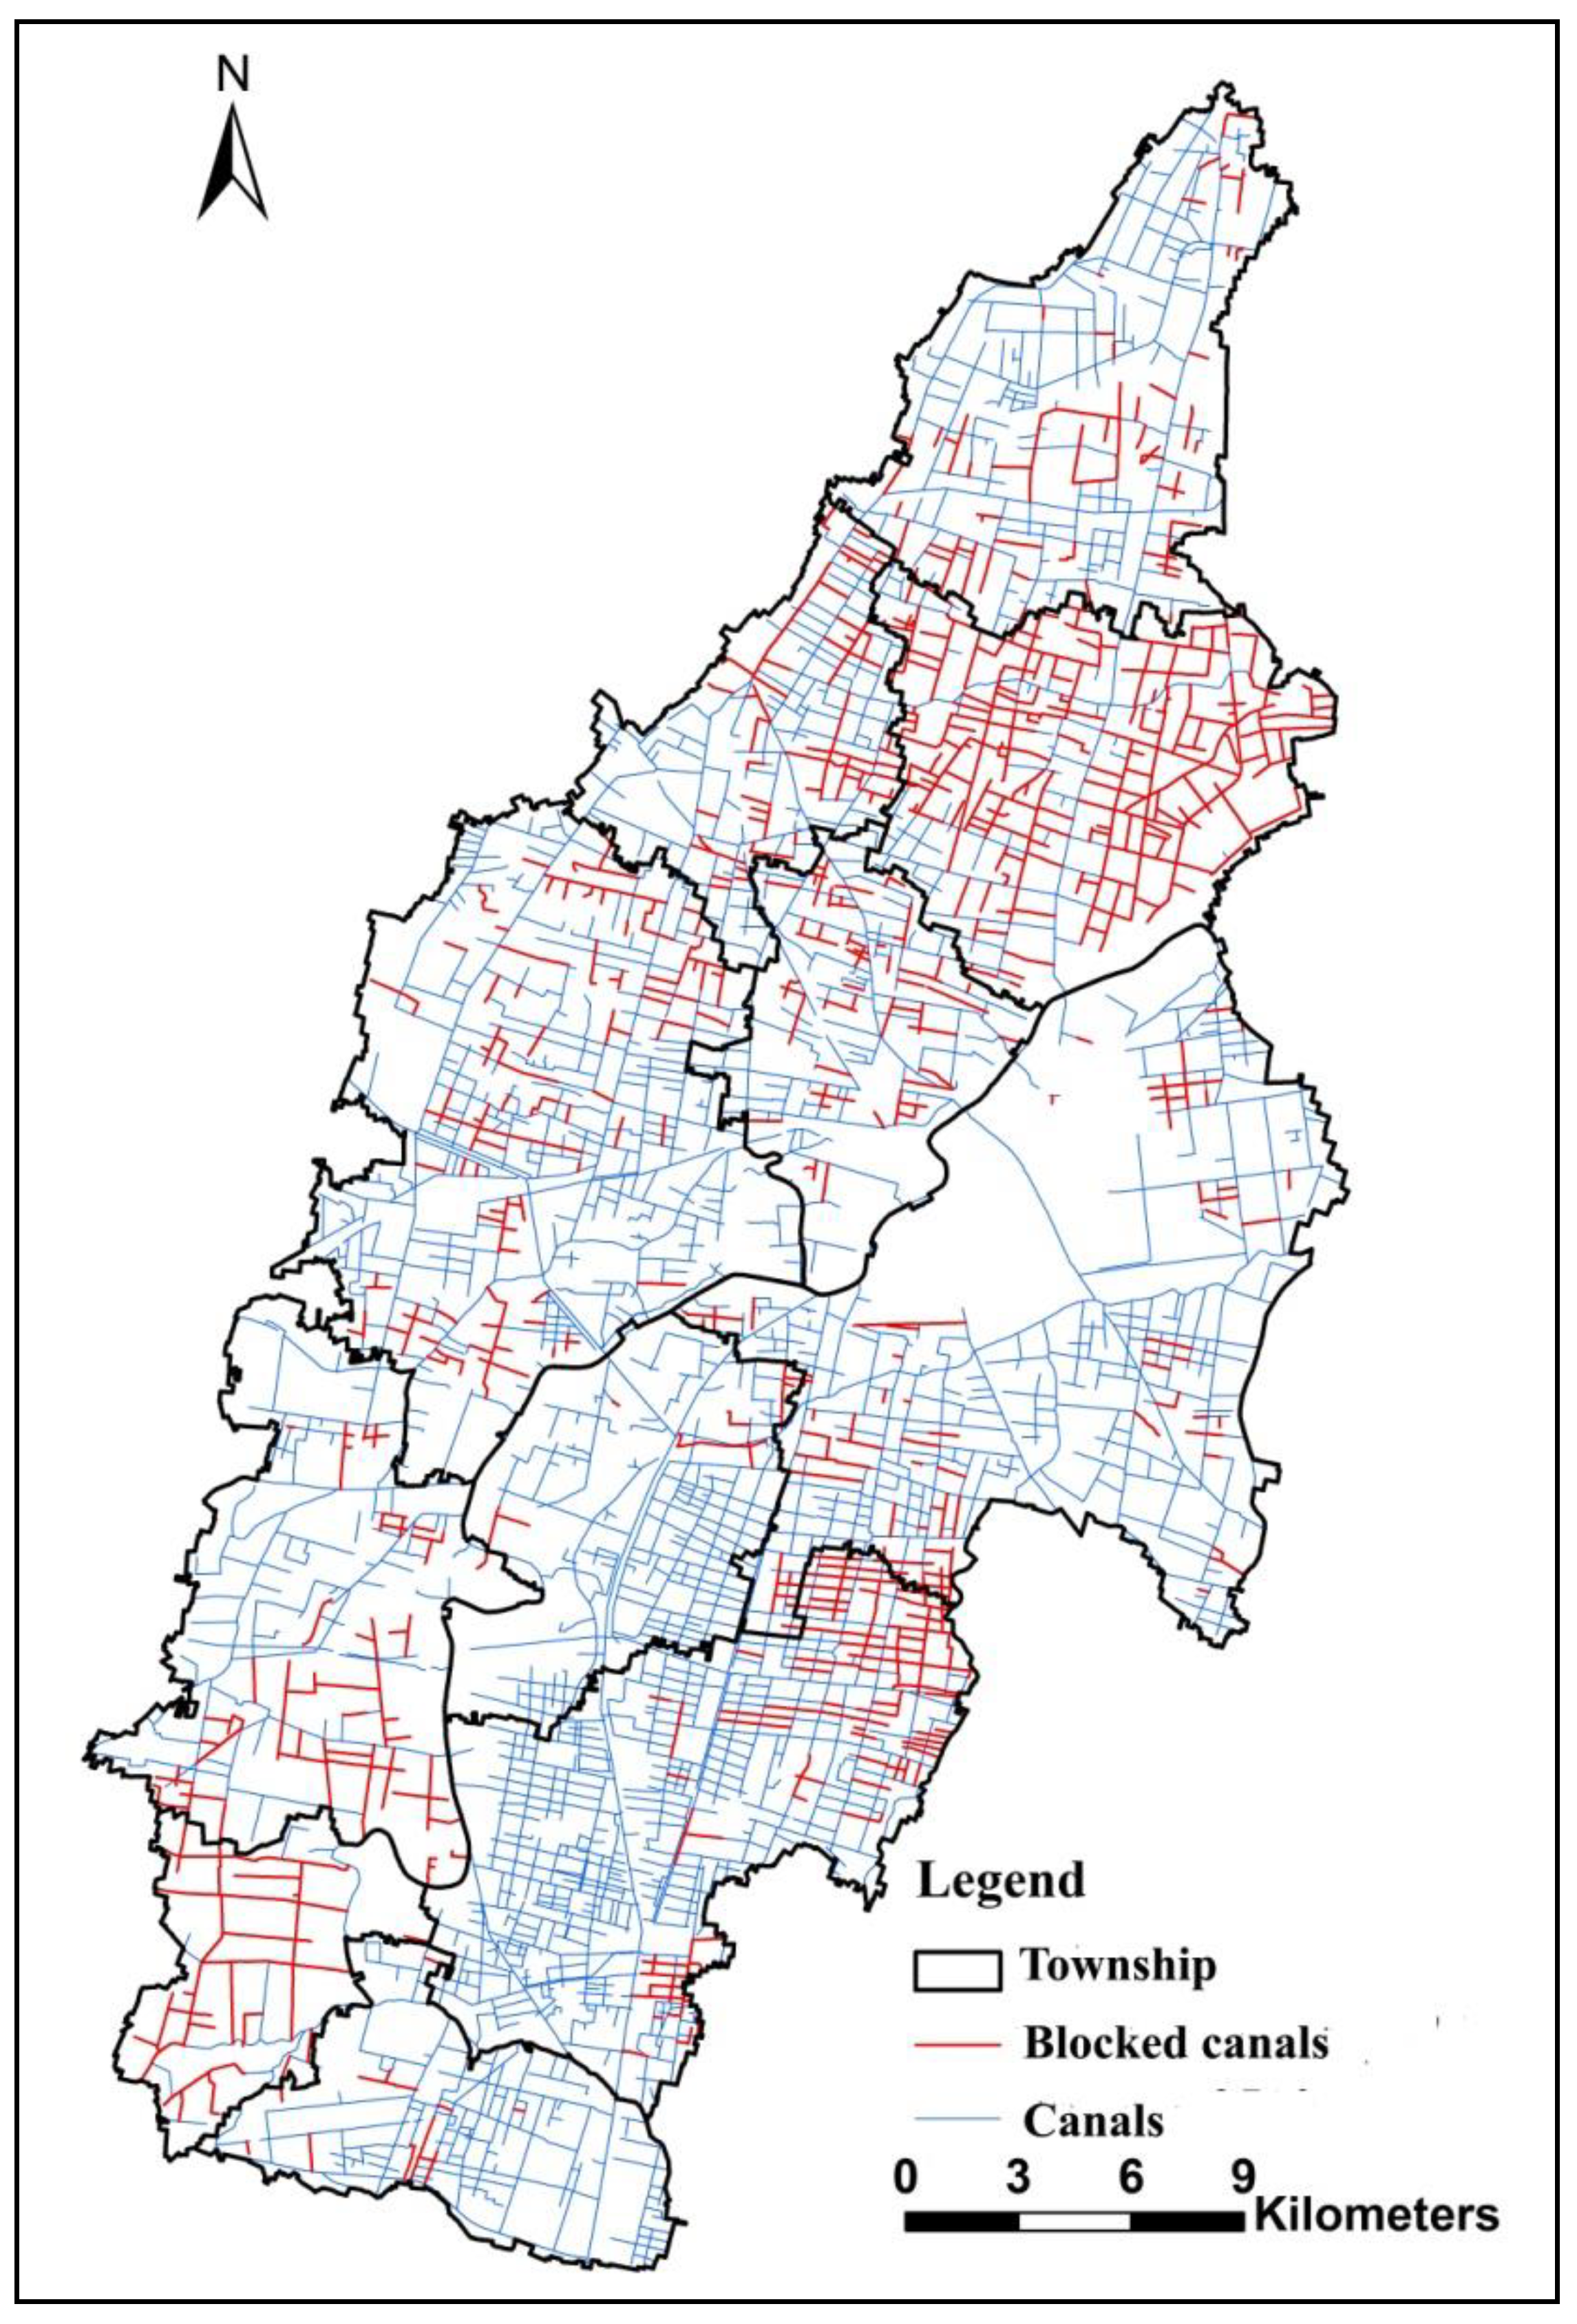
The water gates in the trunk channel of the Yellow River diversion are opened to allow water to flow into irrigation canals during periods of winter wheat irrigation. At this time, canal-irrigation farmland is irrigated with river water, because both the area of farmland that is reached by the water and the time that is required irrigating a unit of land are lower for canal waters than for well-irrigation waters. The Yellow River carries a great deal of sediment that becomes deposited in the canals when the river water enters the canal system. If the irrigation canals are not dredged, they become blocked; hence, approximately 23.0% of irrigation canals cannot currently be filled with river water due to sediment deposition (Table 4).
The total lengths of canal that are blocked and not blocked are 2,173,596.5 and 649,392.5 km, respectively (Table 4). The area of canal-irrigation farmland that cannot be irrigated due to canal blockage is 11,764.3 ha (Figure 5). Prior to 2000, irrigation canals were regularly dredged by local governments; however, due to continuous economic development, an increasing number of farmers have begun to migrate to urban areas to earn extra money to enhance their living conditions.
Thus, local governments have been unable to continue to recruit enough labor to dredge the drainage canals, and regular dredging ceased after 2000. As a result, the blocked drainage canals have become a serious issue in this region, and historically river-irrigated farmland has instead had to be irrigated by using well water.
4.3. ET, Precipitation, and Crop Water Deficit
In the study area, only winter wheat requires irrigation; therefore, the minimum amount of irrigation water needed for winter wheat was calculated using Equations (2)–(11). The results are listed in Table 5. The mean ET during the winter wheat growing season was 609.7 mm, while mean precipitation was 130.3 mm. The mean MIW was 3180.0 mm. Mean values of ET under 50% and 75% probability conditions were 624.8 and 655.9 mm, separately (Table 6). The mean values of precipitation under 50% and 75% probability conditions were 144.4 and 129.2 mm, respectively. The mean values of MIW under 50% and 75% probability conditions were 3002.2.4 and 3401.7 m3/ha, respectively.
4.4. Estimated Amount of Irrigation Water from Various Water Sources
The total area of farmland in the study area is 55,873 ha (Table 3). The total areas that were classified within the well-irrigation and double-irrigation categories were 4724 and 51,149 ha, respectively. Within this region, flooding is used as the primary method of irrigation of cropland. The irrigation probability is an index that is used by local governments and it is based on the fact that the amount of water used for irrigation is affected by rainfall and temperature. Two irrigation probabilities are used for this index, 75% and 50%. The former indicates that this irrigation norm could be satisfied in 75% of calendar years, while the latter means that this irrigation norm is satisfied in 50% of calendar years.
Under a 75% irrigation probability, the river-irrigation norm is 5355 m3/ha (Table 2). The annual amount of water that is used for river irrigation of farmland is 8.2 × 10⁸ m3 (Table 7). The well-irrigation norm is 4755 m3/ha, and the annual amount of water used for well irrigation of farmland is 6.7 × 10⁷ m3 (Table 2 and Table 8). Under a 75% irrigation probability, blocked canals caused the area of river-irrigated farmland to decrease by 11,764.3 ha, which led to the use of 1.7 × 10⁸ m3 of groundwater (Table 8, Figure 5). The actual amount of water used for canal irrigation decreased to 6.3 × 10⁸ m3.
Under a 50% irrigation probability, the annual amount of water that is drawn from canals for the double irrigation of farmland is 7.4 × 10⁸ m3, while the annual amount of water drawn from groundwater for the well irrigation of farmland is 6.1 × 10⁷ m3 (Table 7). Blocked canals caused 11,764.3 ha of double-irrigation farmland to be irrigated with groundwater (Figure 5). The increased amount of well-irrigated farmland due to blockage led to 1.5 × 10⁸ m3 of groundwater to be used, causing declines in groundwater levels (Table 8). However, the water efficiencies for well irrigation under 50% and 75% probabilities were 69.9% and 71.5%, respectively (Figure 6). The water efficiencies for canal irrigation under 50% and 75% probabilities were 62.4% and 63.5%, respectively (Figure 6). This indicates that flooding irrigation efficiency was too low; thus, this irrigation method should be further improved or replaced by other high-efficiency methods.
5. Discussion
Canal and well irrigation are widely used for agricultural purposes worldwide. In Nepal, access to an irrigation system is correlated with the value of farmland [13]. Irrigation canals provide water for paddy growing in Northern provinces of Thailand, and the location of the paddy is mainly determined by the availability of irrigation waters in the dry season [14]. In Iran, irrigation canals and wells provide large amounts of water for agricultural production each year, and the huge demand has led to the diminishment of freshwater lakes as well as additional environmental problems [15]. In Idaho and other states of the United States of America (USA), irrigation canals also provide support for cropland and the management of irrigation water has become a primary government duty [16]. Therefore, identifying well-irrigated and canal-irrigated lands can provide helpful advice for many countries around the world.
The groundwater used for industry and residential areas in the study area is 2.2 × 10⁷ m3/year [9]. Groundwater used for the well irrigation of cropland is at least 1.5 × 10⁸ m3, of which is well irrigation due to canal blockage (Table 8). Therefore, blocked canals are one of the main factors causing declines in groundwater levels. Using remote sensing images, blocked canals were accurately identified in the present study; thus, this method could help governments formulate valuable plans for the dredging of canals, which would ameliorate local groundwater depletion. Irrigated canals have also been widely built in many other regions. The methods identified in the present study could also be used by other regional governments to improve their local irrigation system and to mitigate corresponding environmental problems. Therefore, our results are important for informing efforts in both canal management and groundwater level improvement.
Flooding irrigation is a widely applied irrigation method worldwide. However, one main shortcoming of this method is that it uses large amounts of water. Decreasing the amount of groundwater used for irrigation as well as other water-saving irrigation methods, such as sparkler irrigation and drip irrigation, should be widely applied in the study area.
6. Conclusions
It is very important for preventing groundwater level table decline in the downstream plain of the Yellow River that classifying the cropland into well-irrigated cropland and double irrigated cropland. However, no existing methods are available to classify the irrigated cropland. Therefore, a classifying method for irrigated cropland that is based on images was designed, and the well-irrigated cropland and double irrigated cropland was extracted from remote sensing images. The accuracy of extraction is very high. This shows that this method could be used to extract various irrigated cropland from remote sensing images. The shrinked double irrigated cropland was further identified from images due to blocked canals. Our analysis showed that the blocked canals are the main reason of the continuous groundwater levels decreasing in the study area. Therefore, blocked canals must be dredged to decrease the extent of groundwater depletion.
Author Contributions
Conceptualization, Q.L.; Methodology, Q.L.; Formal Analysis, X.X., S.L.; Investigation, Q.L., S.L.; Resources, X.X.; Data Curation, S.L.; Writing-Original Draft Preparation, Q.L.; Writing-Review & Editing, X.X., S.L.; Visualization, X.X.; Supervision, Q.L.; Project Administration, S.L.; Funding Acquisition, Q.L.
Funding
This research was funded by Natural Science Foundation of Beijing (9182004), National Natural Science Foundation of China (31670471), and National Social Science Fund Project of China (17AJL008). Thanks for two anonymous reviewers’ valuable comments.
Acknowledgments
Thanks for Kaikun Jing for his technical support, and two anonymous reviewers and assistant editor’s kind help.
Conflicts of Interest
There are no conflicts of interest in this article.
References
- Zhang, X.Q.; Kong, X.B. China Land Sustainable Use Impacted by Groundwater Depletion in China’s HHH Plains. China Land Sic. 2014, 28, 90–96, (In Chinese with English Abstract). [Google Scholar]
- Kong, X.B.; Zhang, X.L.; Lal, R.; Zhang, F.R.; Chen, X.H.; Niu, Z.G.; Han, L.; Song, W. Groundwater Depletion by Agricultural Intensification in China’s HHH Plains, Since 1980s. Adv. Agron. 2016, 135, 59–106. [Google Scholar] [CrossRef]
- Yin, W.J.; Hu, L.T.; Jiao, J. Evaluation of Groundwater Storage Variations in Northern China Using GRACE Data. Geofluids 2017, 2017, 1–13. [Google Scholar] [CrossRef] [Green Version]
- Xia, J.; Wang, Z.G.; Liu, C.M. The renewability of water resources and its Quantification of the Yellow River Basin in China. Acta Geogr. Sin. 2003, 58, 534–541, (In Chinese with English Abstract). [Google Scholar] [CrossRef]
- Shu, Y.; Villholth, K.G.; Jensen, K.H.; Stisen, S.; Lei, Y. Integrated hydrological modeling of the north china plain: Options for sustainable groundwater use in the alluvial plain of mt. taihang. J. Hydrol. 2012, 464–465, 79–93. [Google Scholar] [CrossRef]
- Zhang, X.; Ren, L.; Kong, X. Estimating spatiotemporal variability and sustainability of shallow groundwater in a well-irrigated plain of the Haihe River basin using SWAT model. J. Hydrol. 2016, 541, 1221–1240. [Google Scholar] [CrossRef]
- Lu, Q.S.; Liang, F.; Bi, X.L.; Duffy, R.; Zhao, Z.P. Effects of Urbanization and Industrialization on Agricultural Land Use in Shandong Peninsula. Ecol. Indic. 2011, 11, 1710–1714. [Google Scholar] [CrossRef]
- Dong, J.; Xiao, X.; Menarguez, M.A.; Zhang, G.; Qin, Y.; Thau, D. Mapping paddy rice planting area in northeastern Asia with Landsat 8 images, phenology-based algorithm and Google Earth Engine. Remote Sens. Environ. 2016, 185, 142–154. [Google Scholar] [CrossRef] [PubMed] [Green Version]
- Dezhou Statistic Bureau. Statistic Yearbook; China Statistic Press: Beijing, China, 2017. [Google Scholar]
- Chinese Soil Taxonomy Research Group, Institute of Soil Science; Academia Sinica and Cooperative Research Group on Chinese Soil Taxonomy. Chinese Soil Taxonomy (Revised Proposal); China Agricultural Science and Technology Press: Beijing, China, 1995. [Google Scholar]
- Allen, R.G.; Pereira, L.S.; Raes, D.; Smith, M. Crop Evapotranspiration—Guidelines for Computing Crop Water Requirements; FAO Irrigation and Drainage Paper 56; FAO: Rome, Italy, 1998. [Google Scholar]
- Fang, K.H. An Encyclopedia of Architecture & Civil Engineering of China: Water Project; China Architecture & Building Press: Beijing, China, 2008. (In Chinese) [Google Scholar]
- Joshi, J.; Ali, M.; Berrens, R.P. Valuing farm access to irrigation in Nepal: A hedonic pricing model. Agric. Water Manag. 2017, 181, 35–46. [Google Scholar] [CrossRef]
- Kosanlawit, S.; Soni, P.; Shivakoti, G.P. The Relationship between Effective and Equitable Water Allocation, Local Rice Farmer Participation and Economic Well-Being: Insights from Thailand’s Chiang Mai Province. Water 2017, 9, 319. [Google Scholar] [CrossRef]
- Hesami, A.; Amini, A. Changes in irrigated land and agricultural water use in the Lake Urmia basin. Lake Reserv. Manag. 2016, 32, 288–296. [Google Scholar] [CrossRef]
- Bjorneberg, D.L. Water temperature in irrigation return flow from the Upper Snake Rock watershed. Agric. Water Manag. 2015, 158, 209–212. [Google Scholar] [CrossRef] [Green Version]
Figure 1.
Location of study area.

Figure 2.
Sublateral canals and irrigation water belts in the study area.

Figure 3.
Irrigated cropland categories in the study area.

Figure 4.
Canals in the study area.

Figure 5.
The area of blocked and unblocked double-irrigation cropland.

Figure 6.
Irrigation water efficiency.


Table 1.
Accuracy of classified cropland.
| Canal-Irrigated Cropland | Well-Irrigated Cropland | |
|---|---|---|
| Samples | 30 | 30 |
| Accuracy | 96% | 95% |
Table 2.
Mean gross irrigation norm with flood irrigation in the study area for winter wheat.
| Probability of Irrigation (%) | Gross Irrigation Norm (m/ha) | |
|---|---|---|
| Well | Canal | |
| 50 | 4290 | 4815 |
| 75 | 4755 | 5355 |
Source: Irrigation norm standard of main crops in Shandong Province.
Table 3.
Area of double-irrigation and well-irrigation croplands.
| Double-Irrigated Cropland | Well-Irrigated Cropland | Total | ||
|---|---|---|---|---|
| Area (ha) | Percent (%) | Area (ha) | Percent (%) | Area (ha) |
| 51,149 | 91.5 | 4724 | 8.5 | 55,873 |
Table 4.
Length of canals in the study area.
| Length with Blockage (Km) | Length without Blockage (Km) | Total Length (Km) | Length with Blockage (%) | |
|---|---|---|---|---|
| River | 649,392.5 | 2,173,596.5 | 2,822,989.0 | 23.0% |
Table 5.
Mean ET, Precipitation and MIW from 1960–2017.
| Mean MIW (m3/ha) | Mean Precipitation (mm) | Mean ET (mm) |
|---|---|---|
| 3180.0 | 130.2 | 609.7 |
Table 6.
Mean precipitation, ET, and MIW under various probabilities.
| Probability | Mean Precipitation (mm) | Mean ET (mm) | Mean MIW (m3/ha) |
|---|---|---|---|
| 50% | 144.4 | 624.8 | 3002.2 |
| 75% | 129.2 | 655.9 | 3401.7 |
Table 7.
Water used by various types of irrigation.
| Irrigated Probability | Double Irrigation (m3) | Well Irrigation (m3) |
|---|---|---|
| 75% | 8.2 × 10⁸ | 6.7 × 10⁷ |
| 50% | 7.4 × 10⁸ | 6.1 × 10⁷ |
Table 8.
Water used for irrigation after canal blockage.
| Irrigation Probability | River Water (m3) | Groundwater (m3) | Increased Groundwater due to Blocking (m3) |
|---|---|---|---|
| 75% | 6.3 × 10⁸ | 2.4 × 10⁸ | 1.7 × 10⁸ |
| 50% | 5.7 × 10⁸ | 2.1 × 10⁸ | 1.5 × 10⁸ |
© 2018 by the authors. Licensee MDPI, Basel, Switzerland. This article is an open access article distributed under the terms and conditions of the Creative Commons Attribution (CC BY) license (http://creativecommons.org/licenses/by/4.0/).
Share and Cite
MDPI and ACS Style
Lu, Q.; Liang, S.; Xu, X. Classification and Estimation of Irrigation Waters Based on Remote Sensing Images: Case Study in Yucheng City (China). Sustainability 2018, 10, 3503. https://doi.org/10.3390/su10103503
AMA Style
Lu Q, Liang S, Xu X. Classification and Estimation of Irrigation Waters Based on Remote Sensing Images: Case Study in Yucheng City (China). Sustainability. 2018; 10(10):3503. https://doi.org/10.3390/su10103503
Chicago/Turabian StyleLu, Qingshui, Shangzhen Liang, and Xinliang Xu. 2018. "Classification and Estimation of Irrigation Waters Based on Remote Sensing Images: Case Study in Yucheng City (China)" Sustainability 10, no. 10: 3503. https://doi.org/10.3390/su10103503
Note that from the first issue of 2016, this journal uses article numbers instead of page numbers. See further details here.