Quantifying the Spatiotemporal Dynamics of Industrial Land Uses through Mining Free Access Social Datasets in the Mega Hangzhou Bay Region, China

 ,
, 

Abstract
:
1. Introduction
2. Study Area and Data Preparation
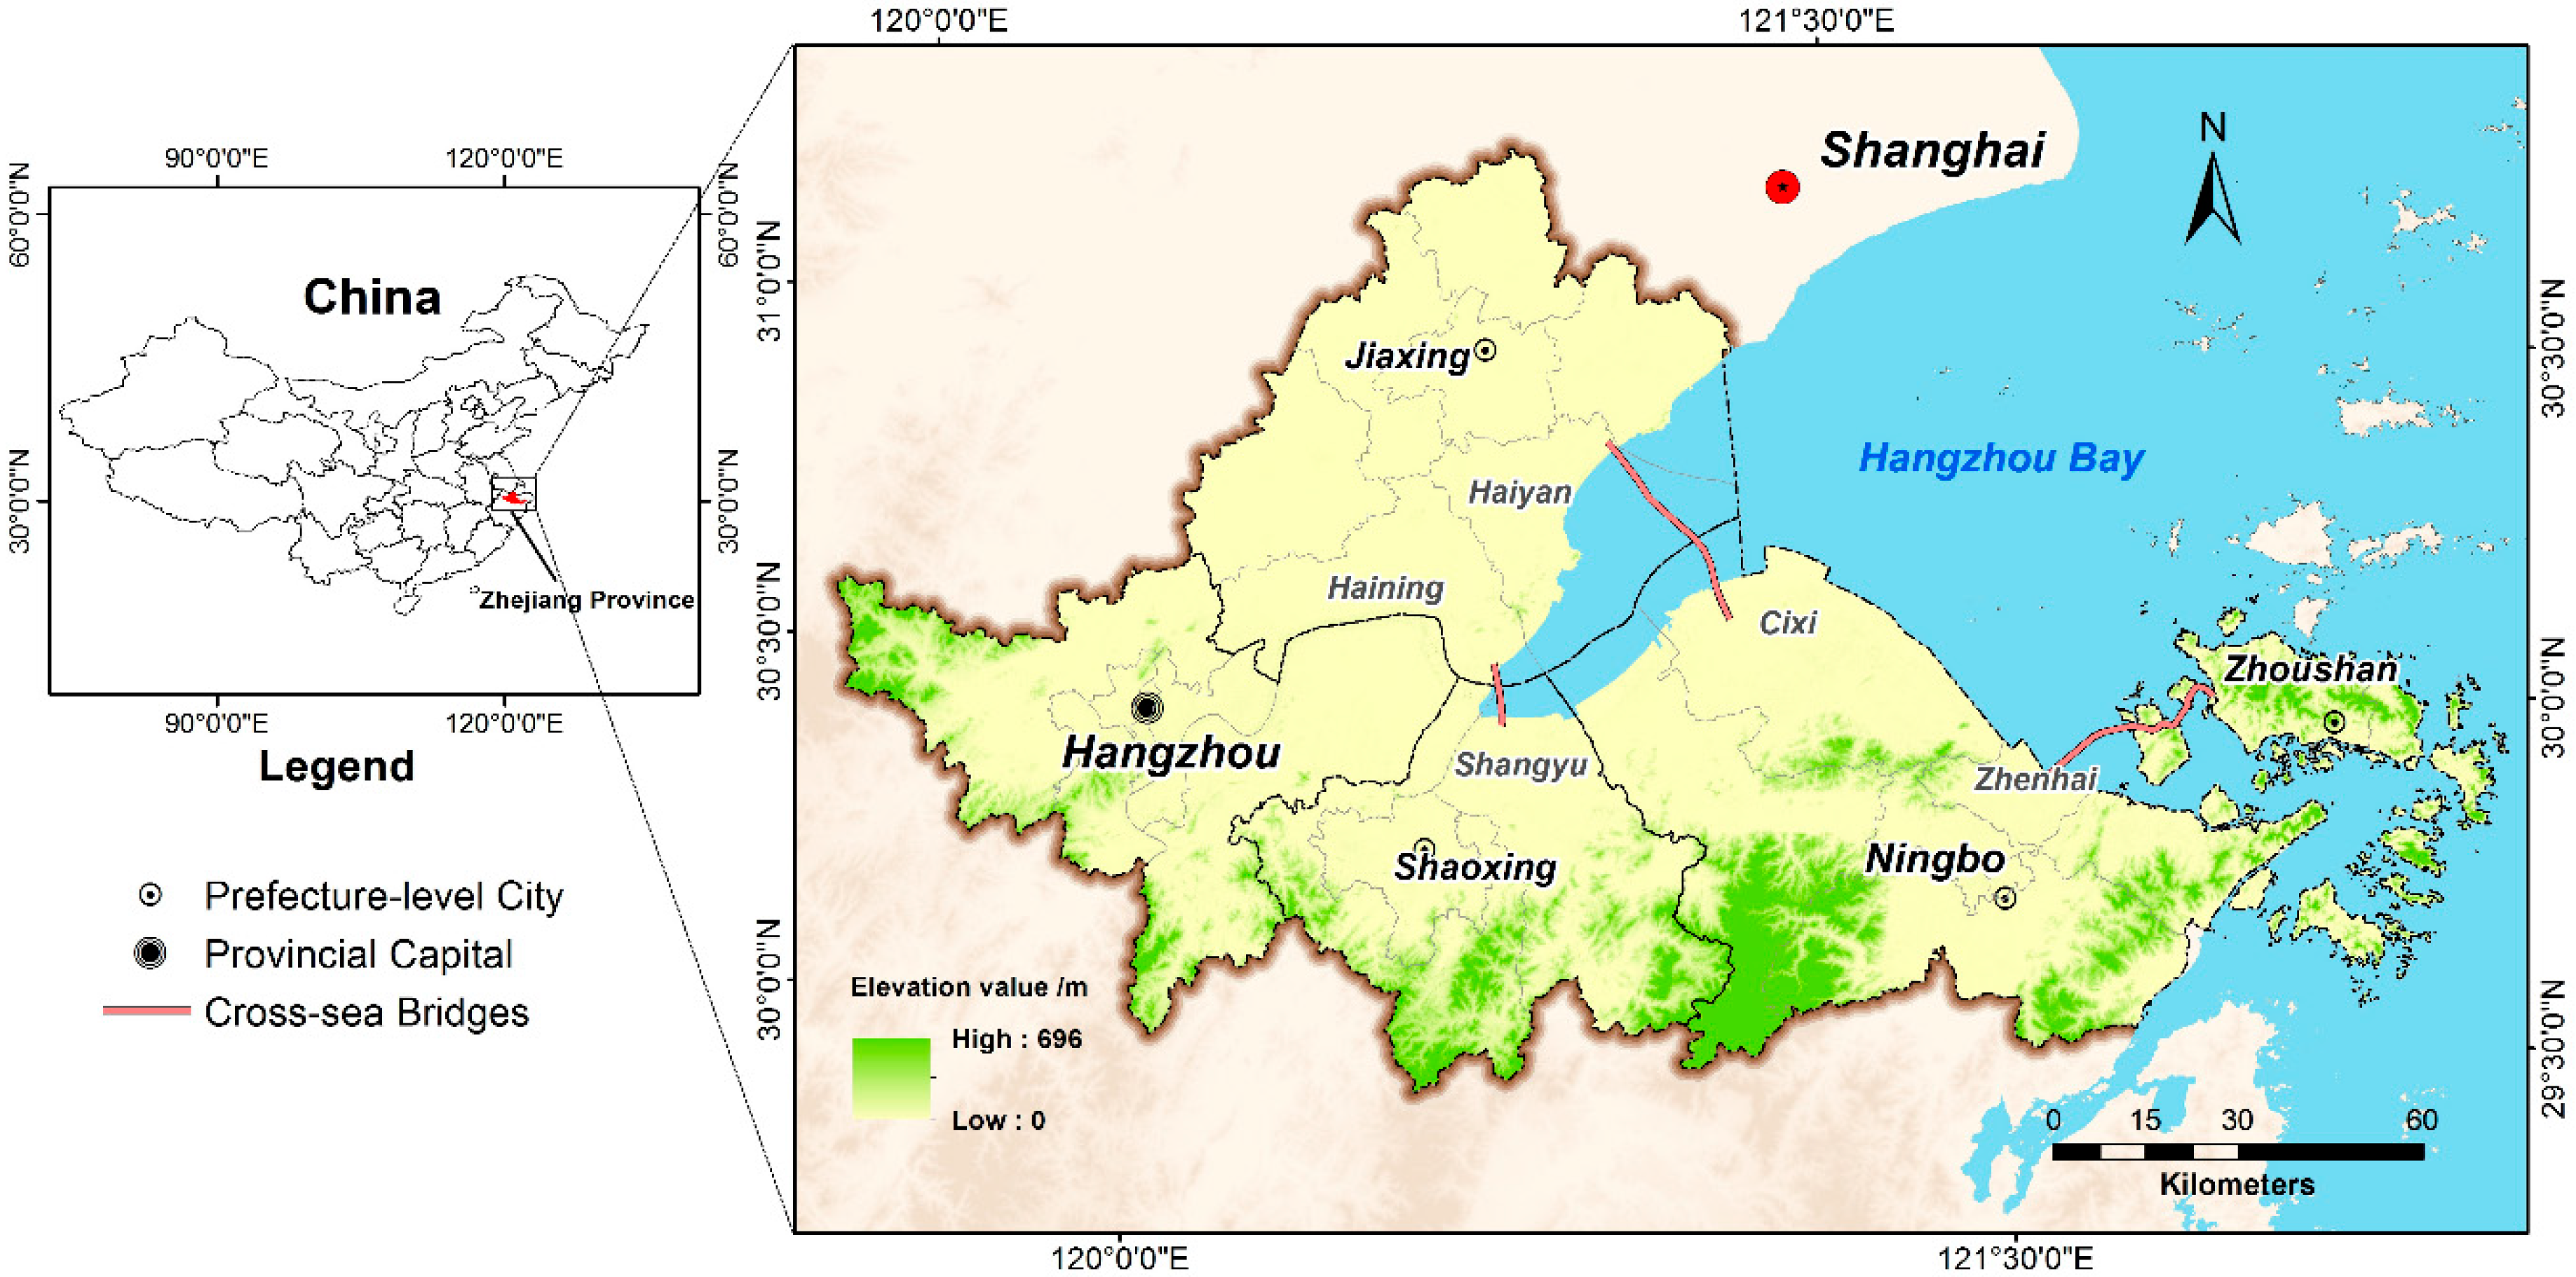
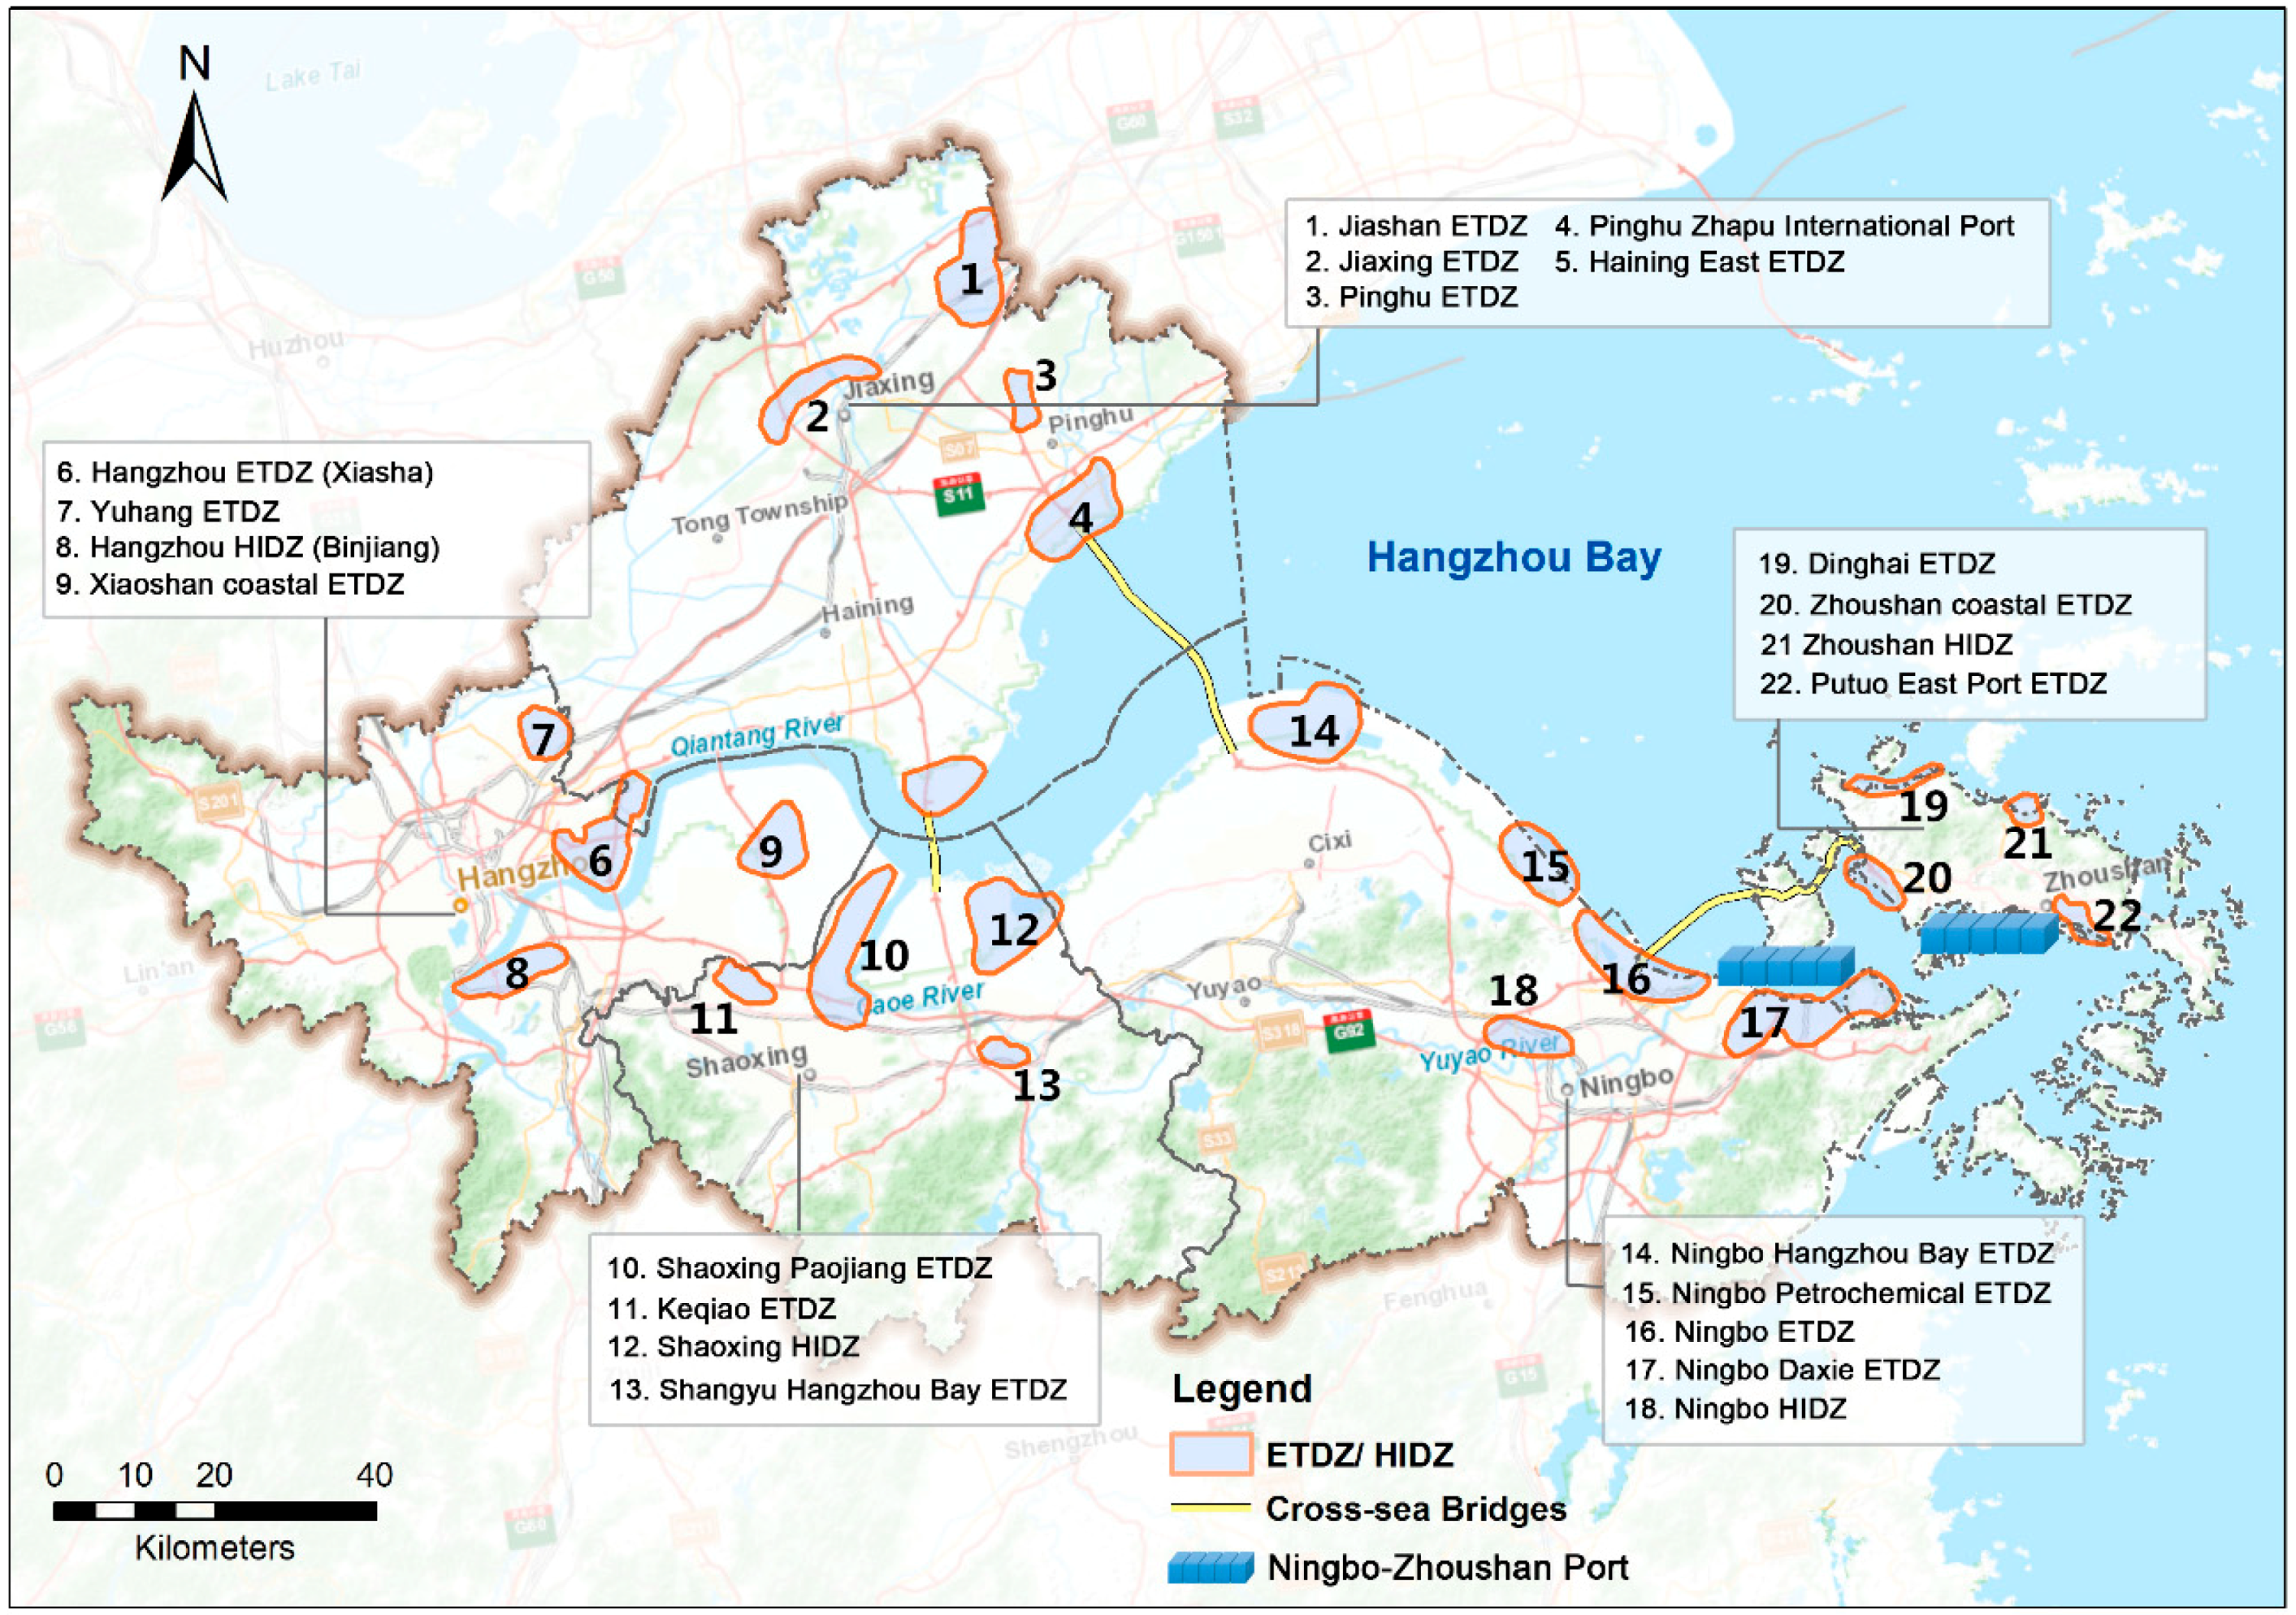
2.1. Study Area
2.2. Data Preparation
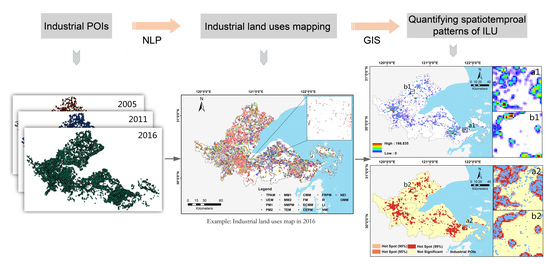
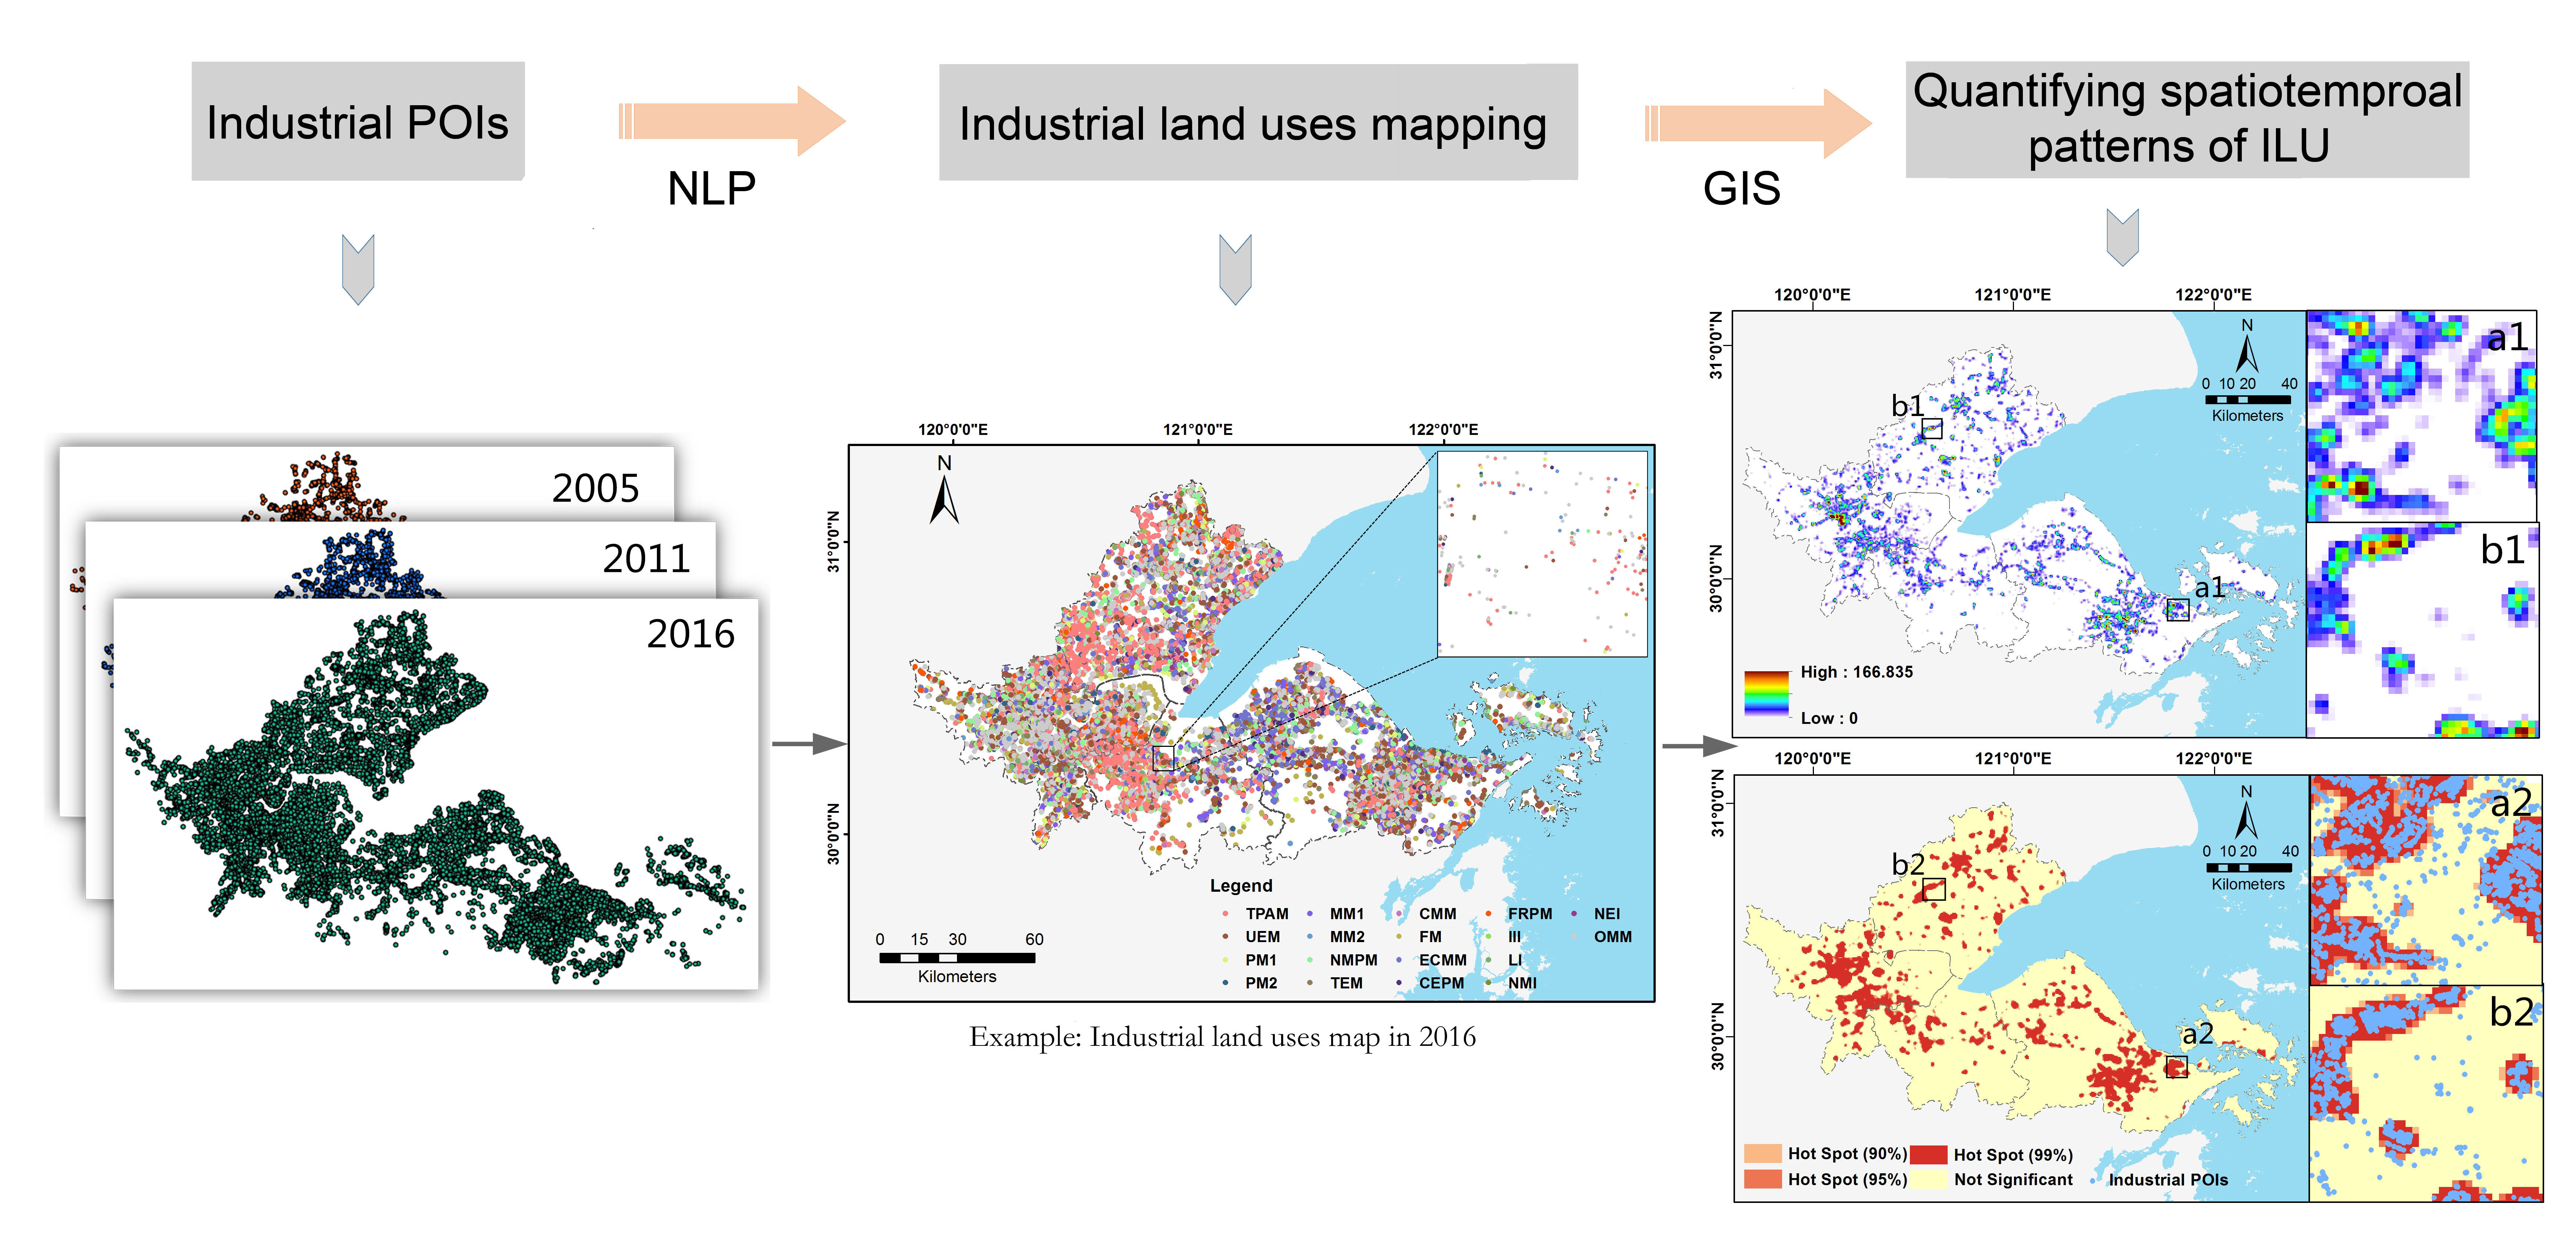
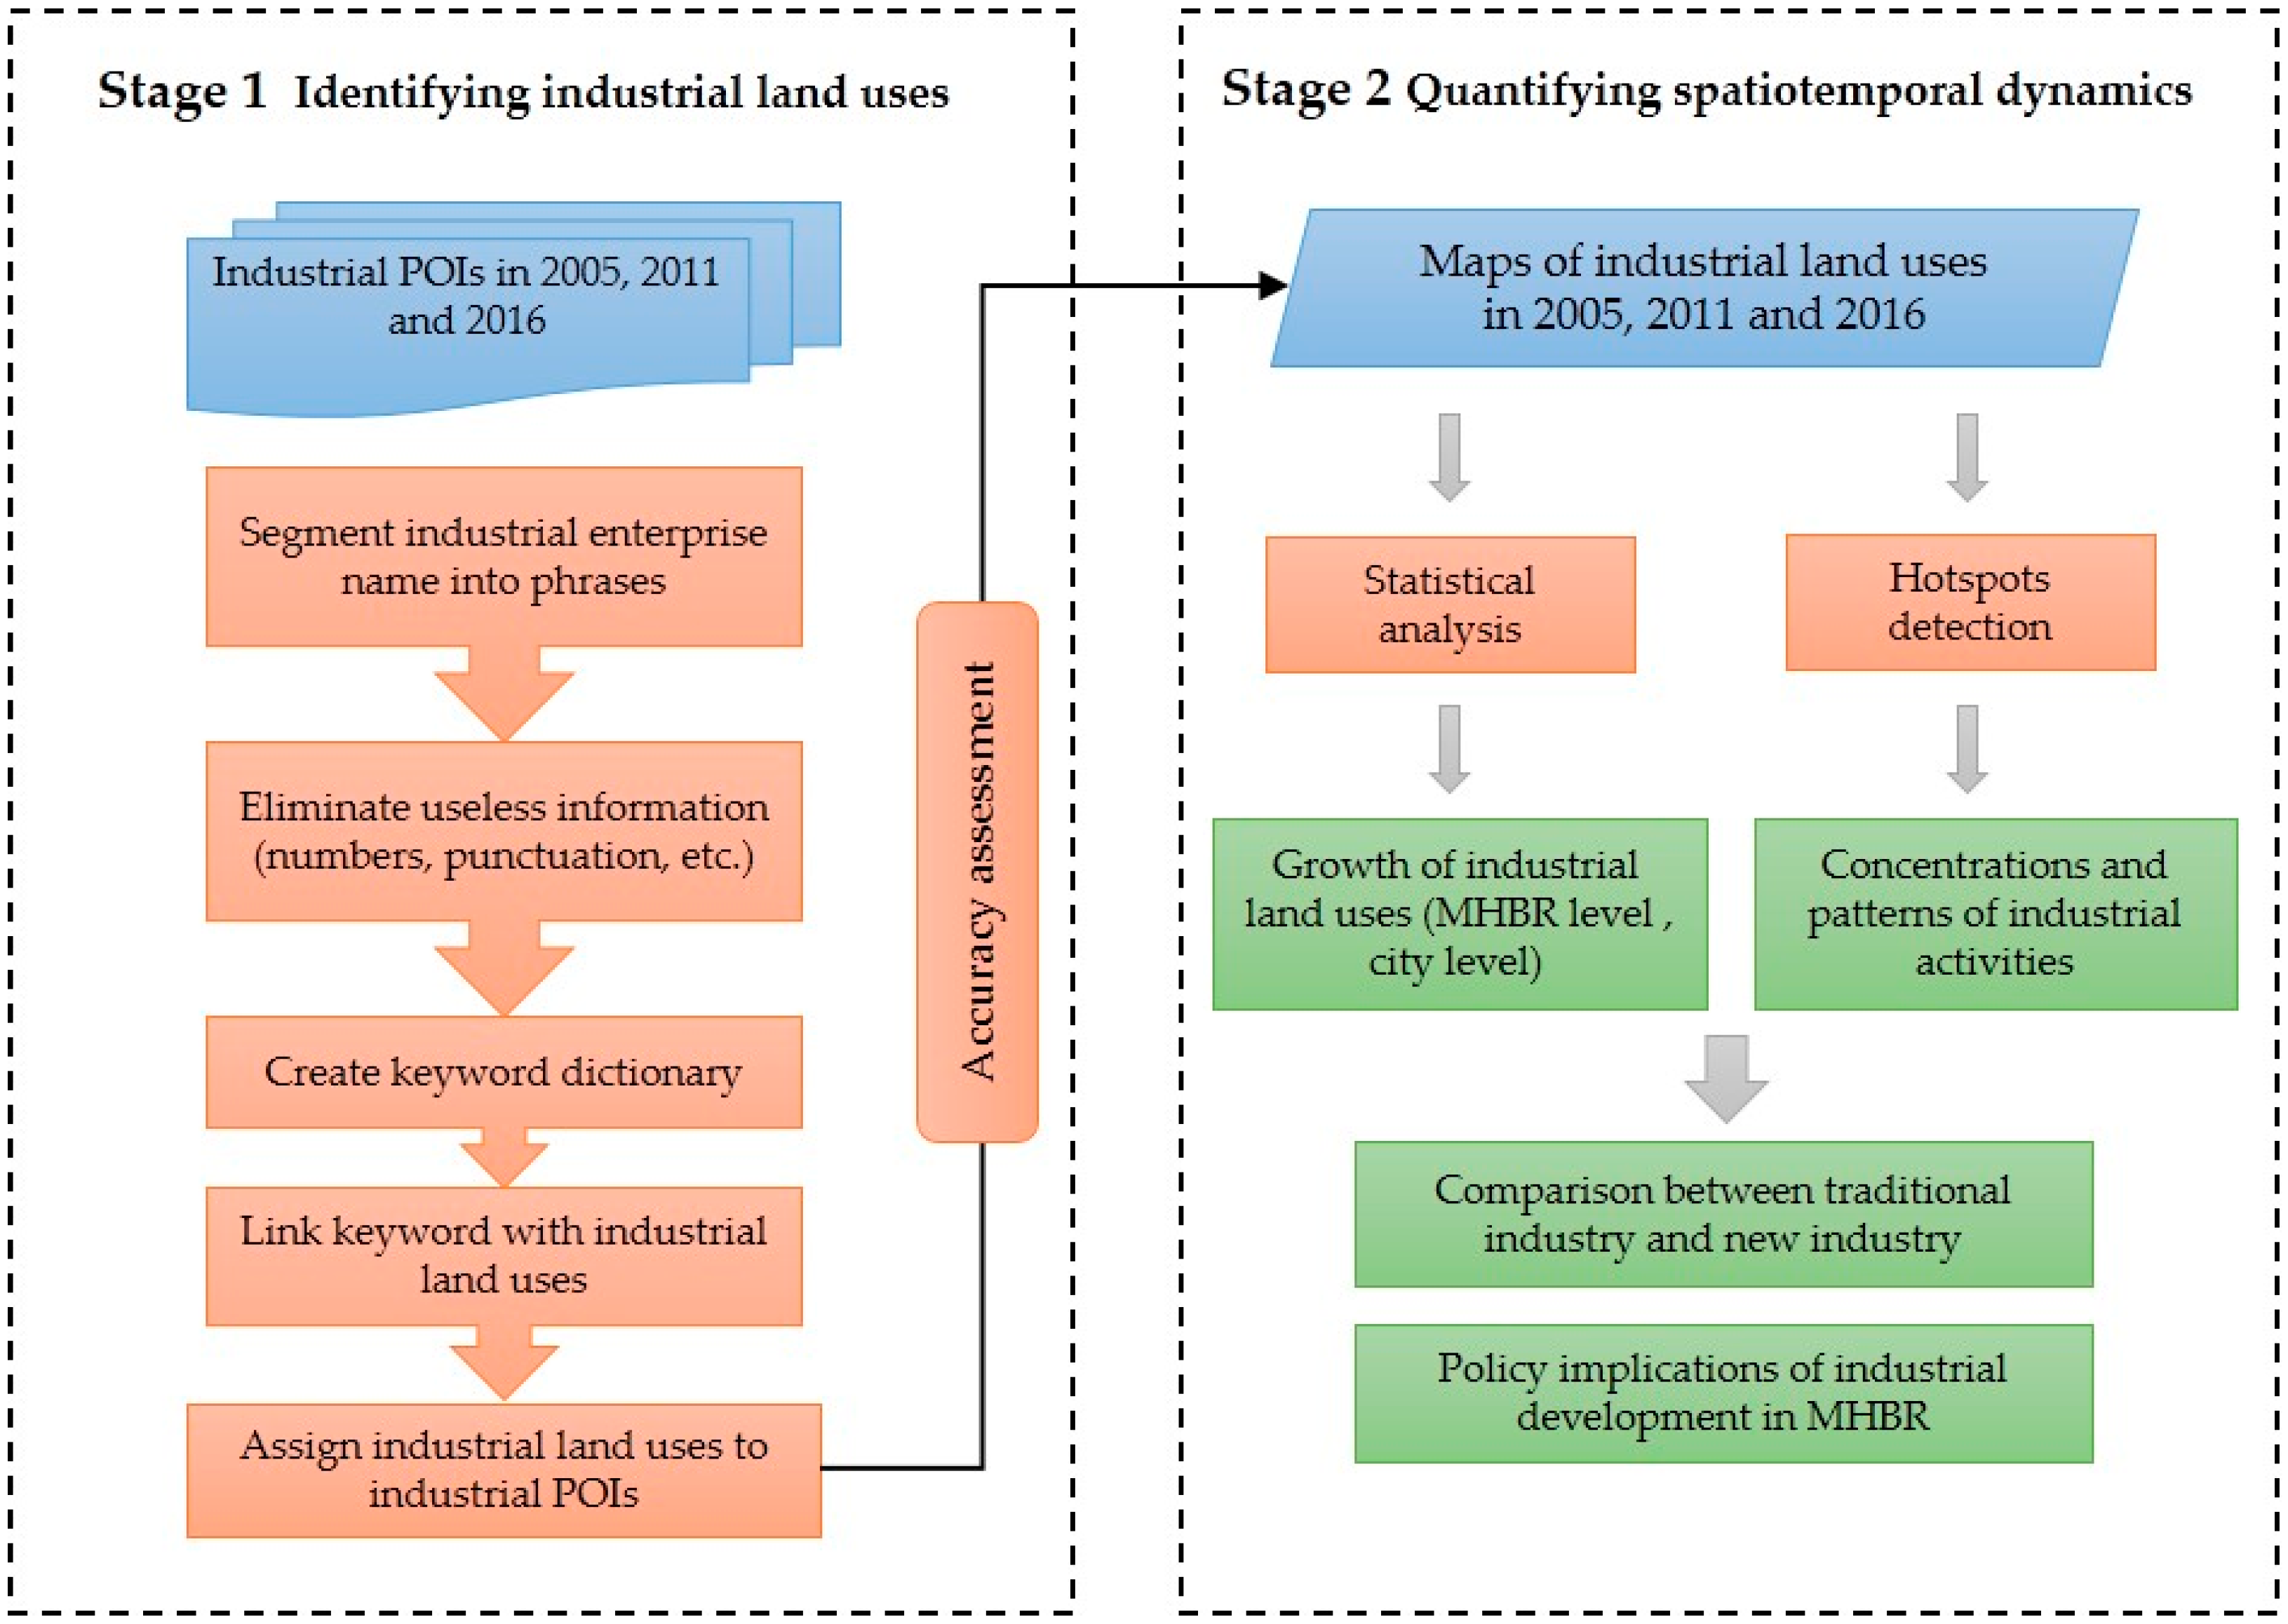
3. Methodology
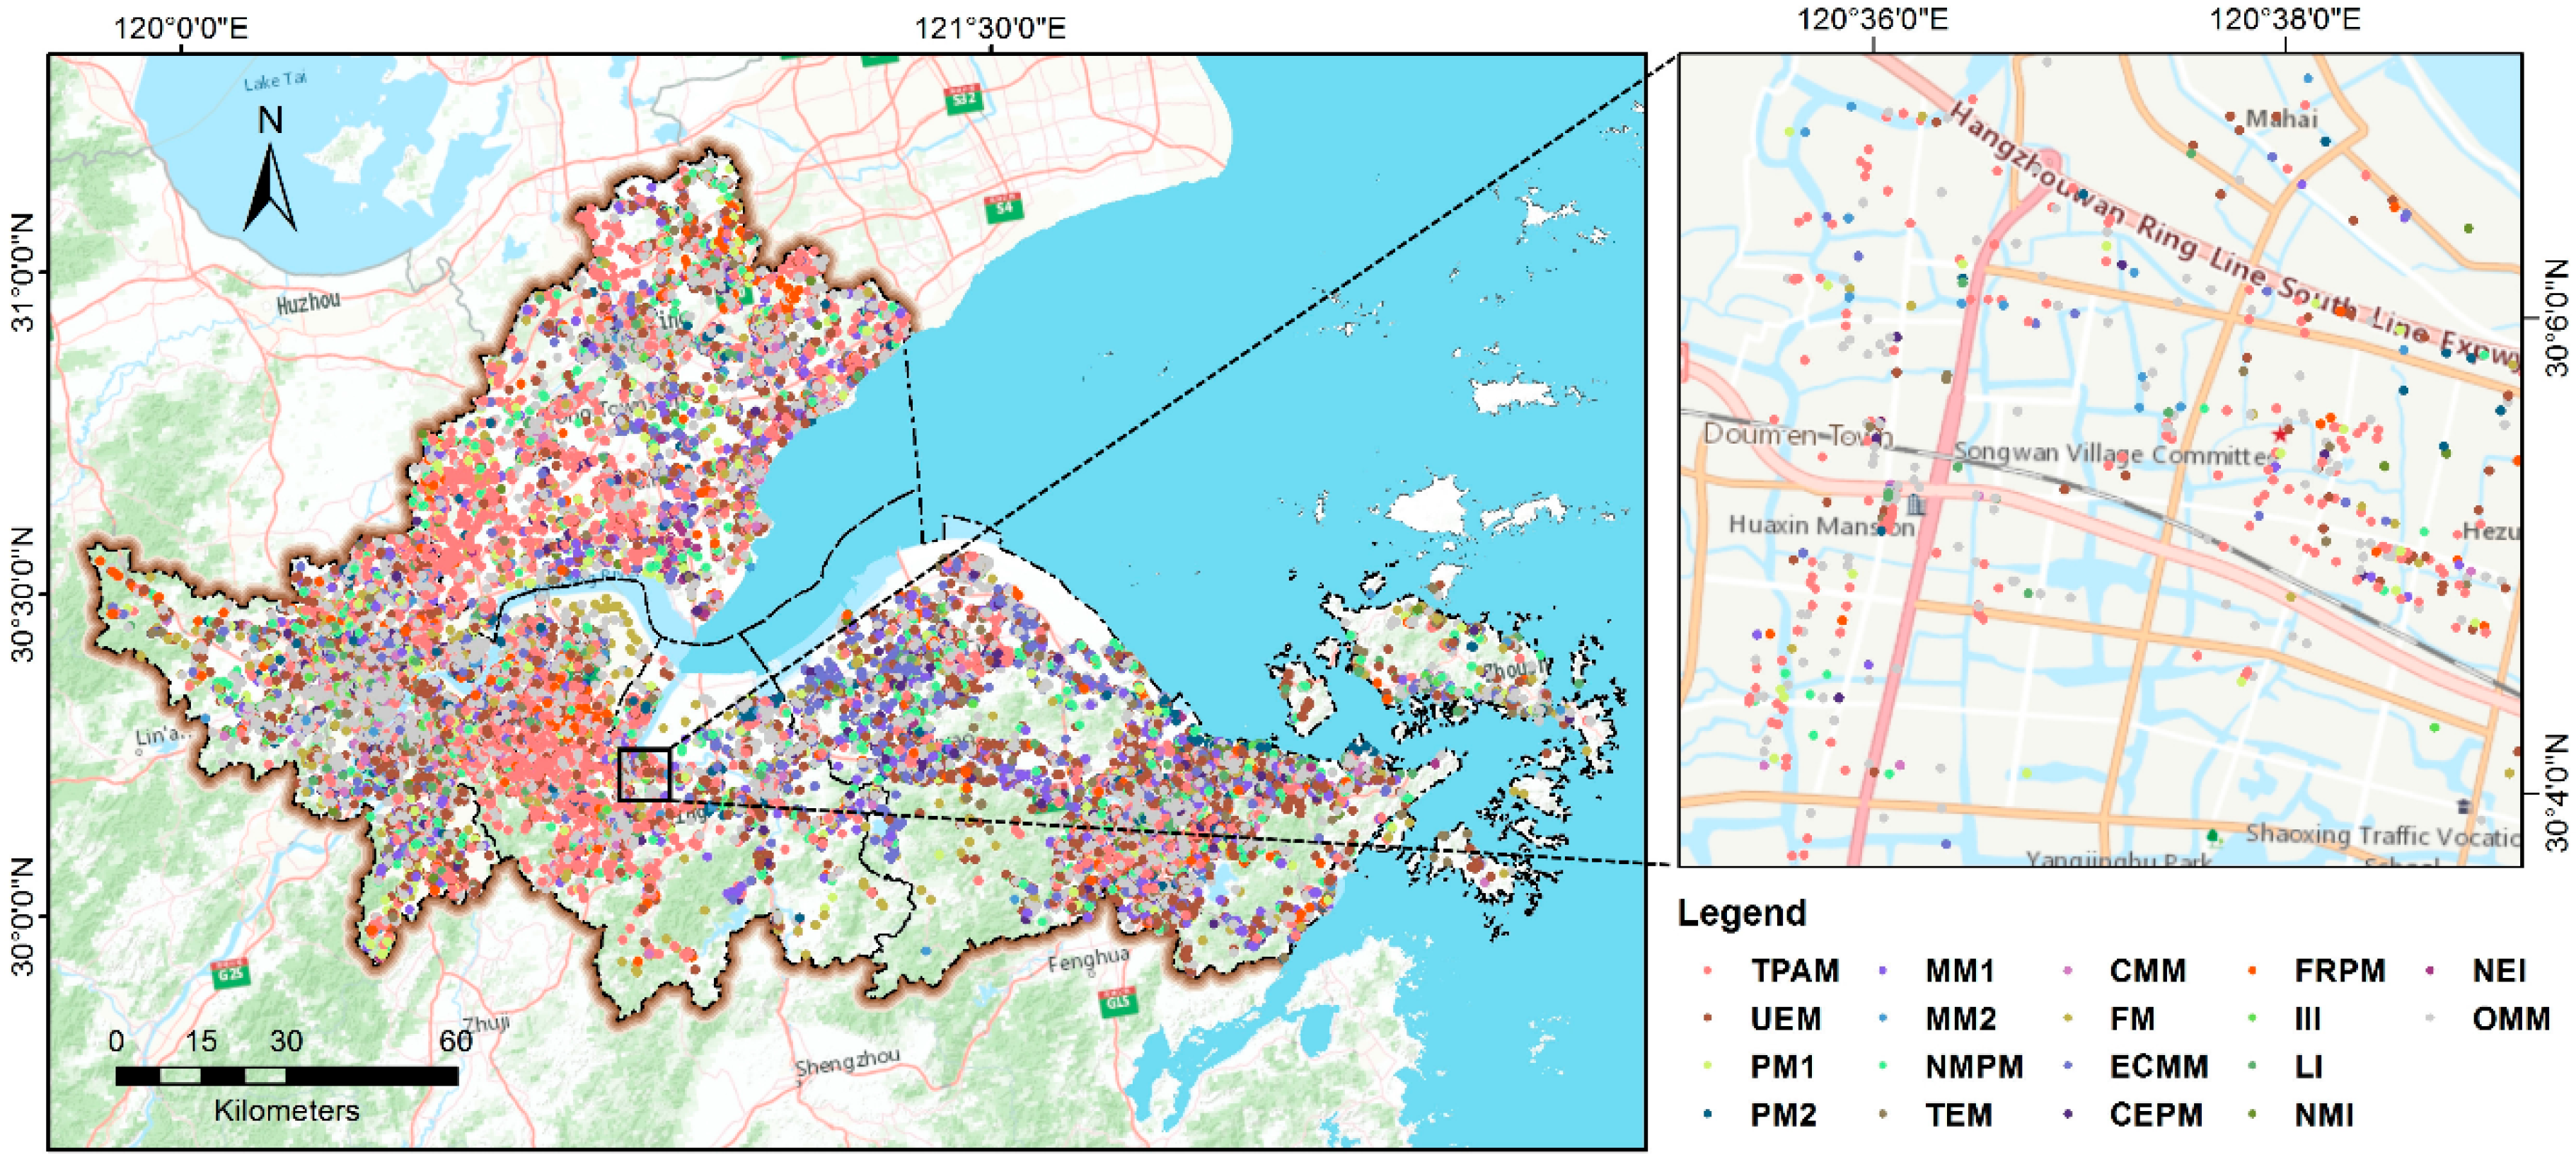
3.1. Identifying Industrial Land Uses Using Natural Language Processing
3.2. Analysis of Enterprise Number and Growth Rate of Industrial Land Uses
3.3. Hotspots Detection
4. Results and Analysis
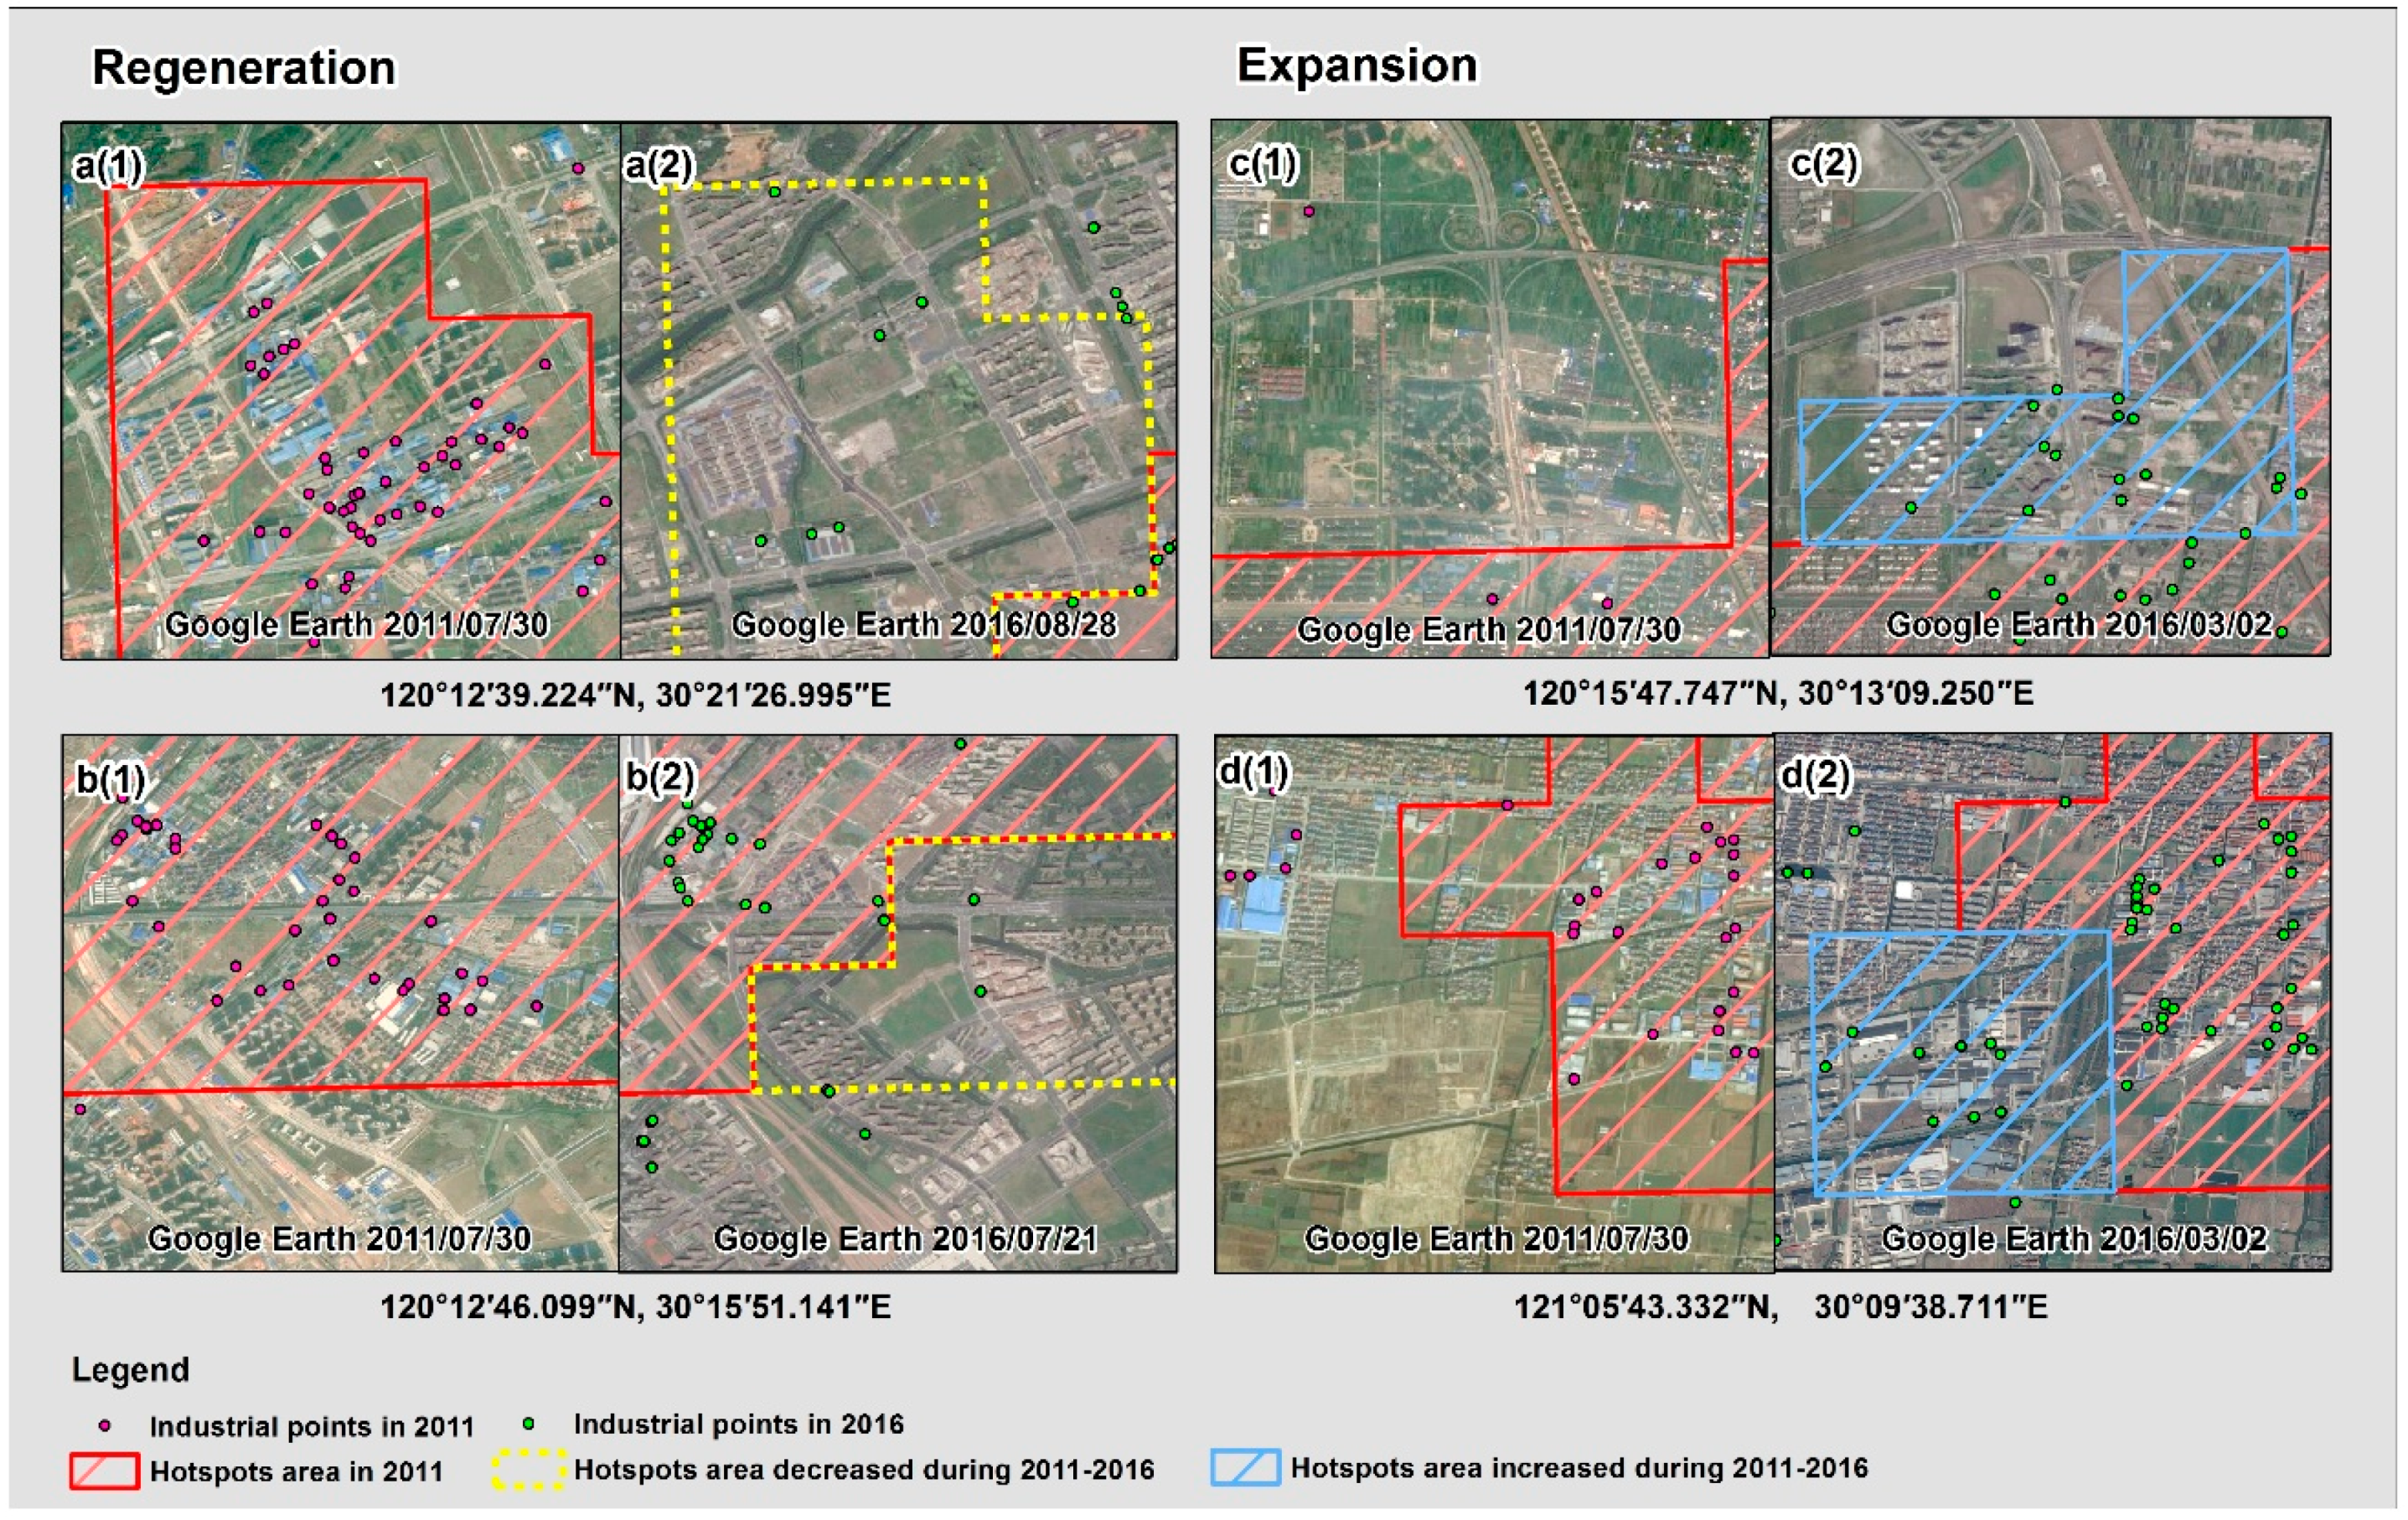
4.1. Industrial Land Uses Change Detection
4.2. Growth of Industrial Regions at the MHBR Level.
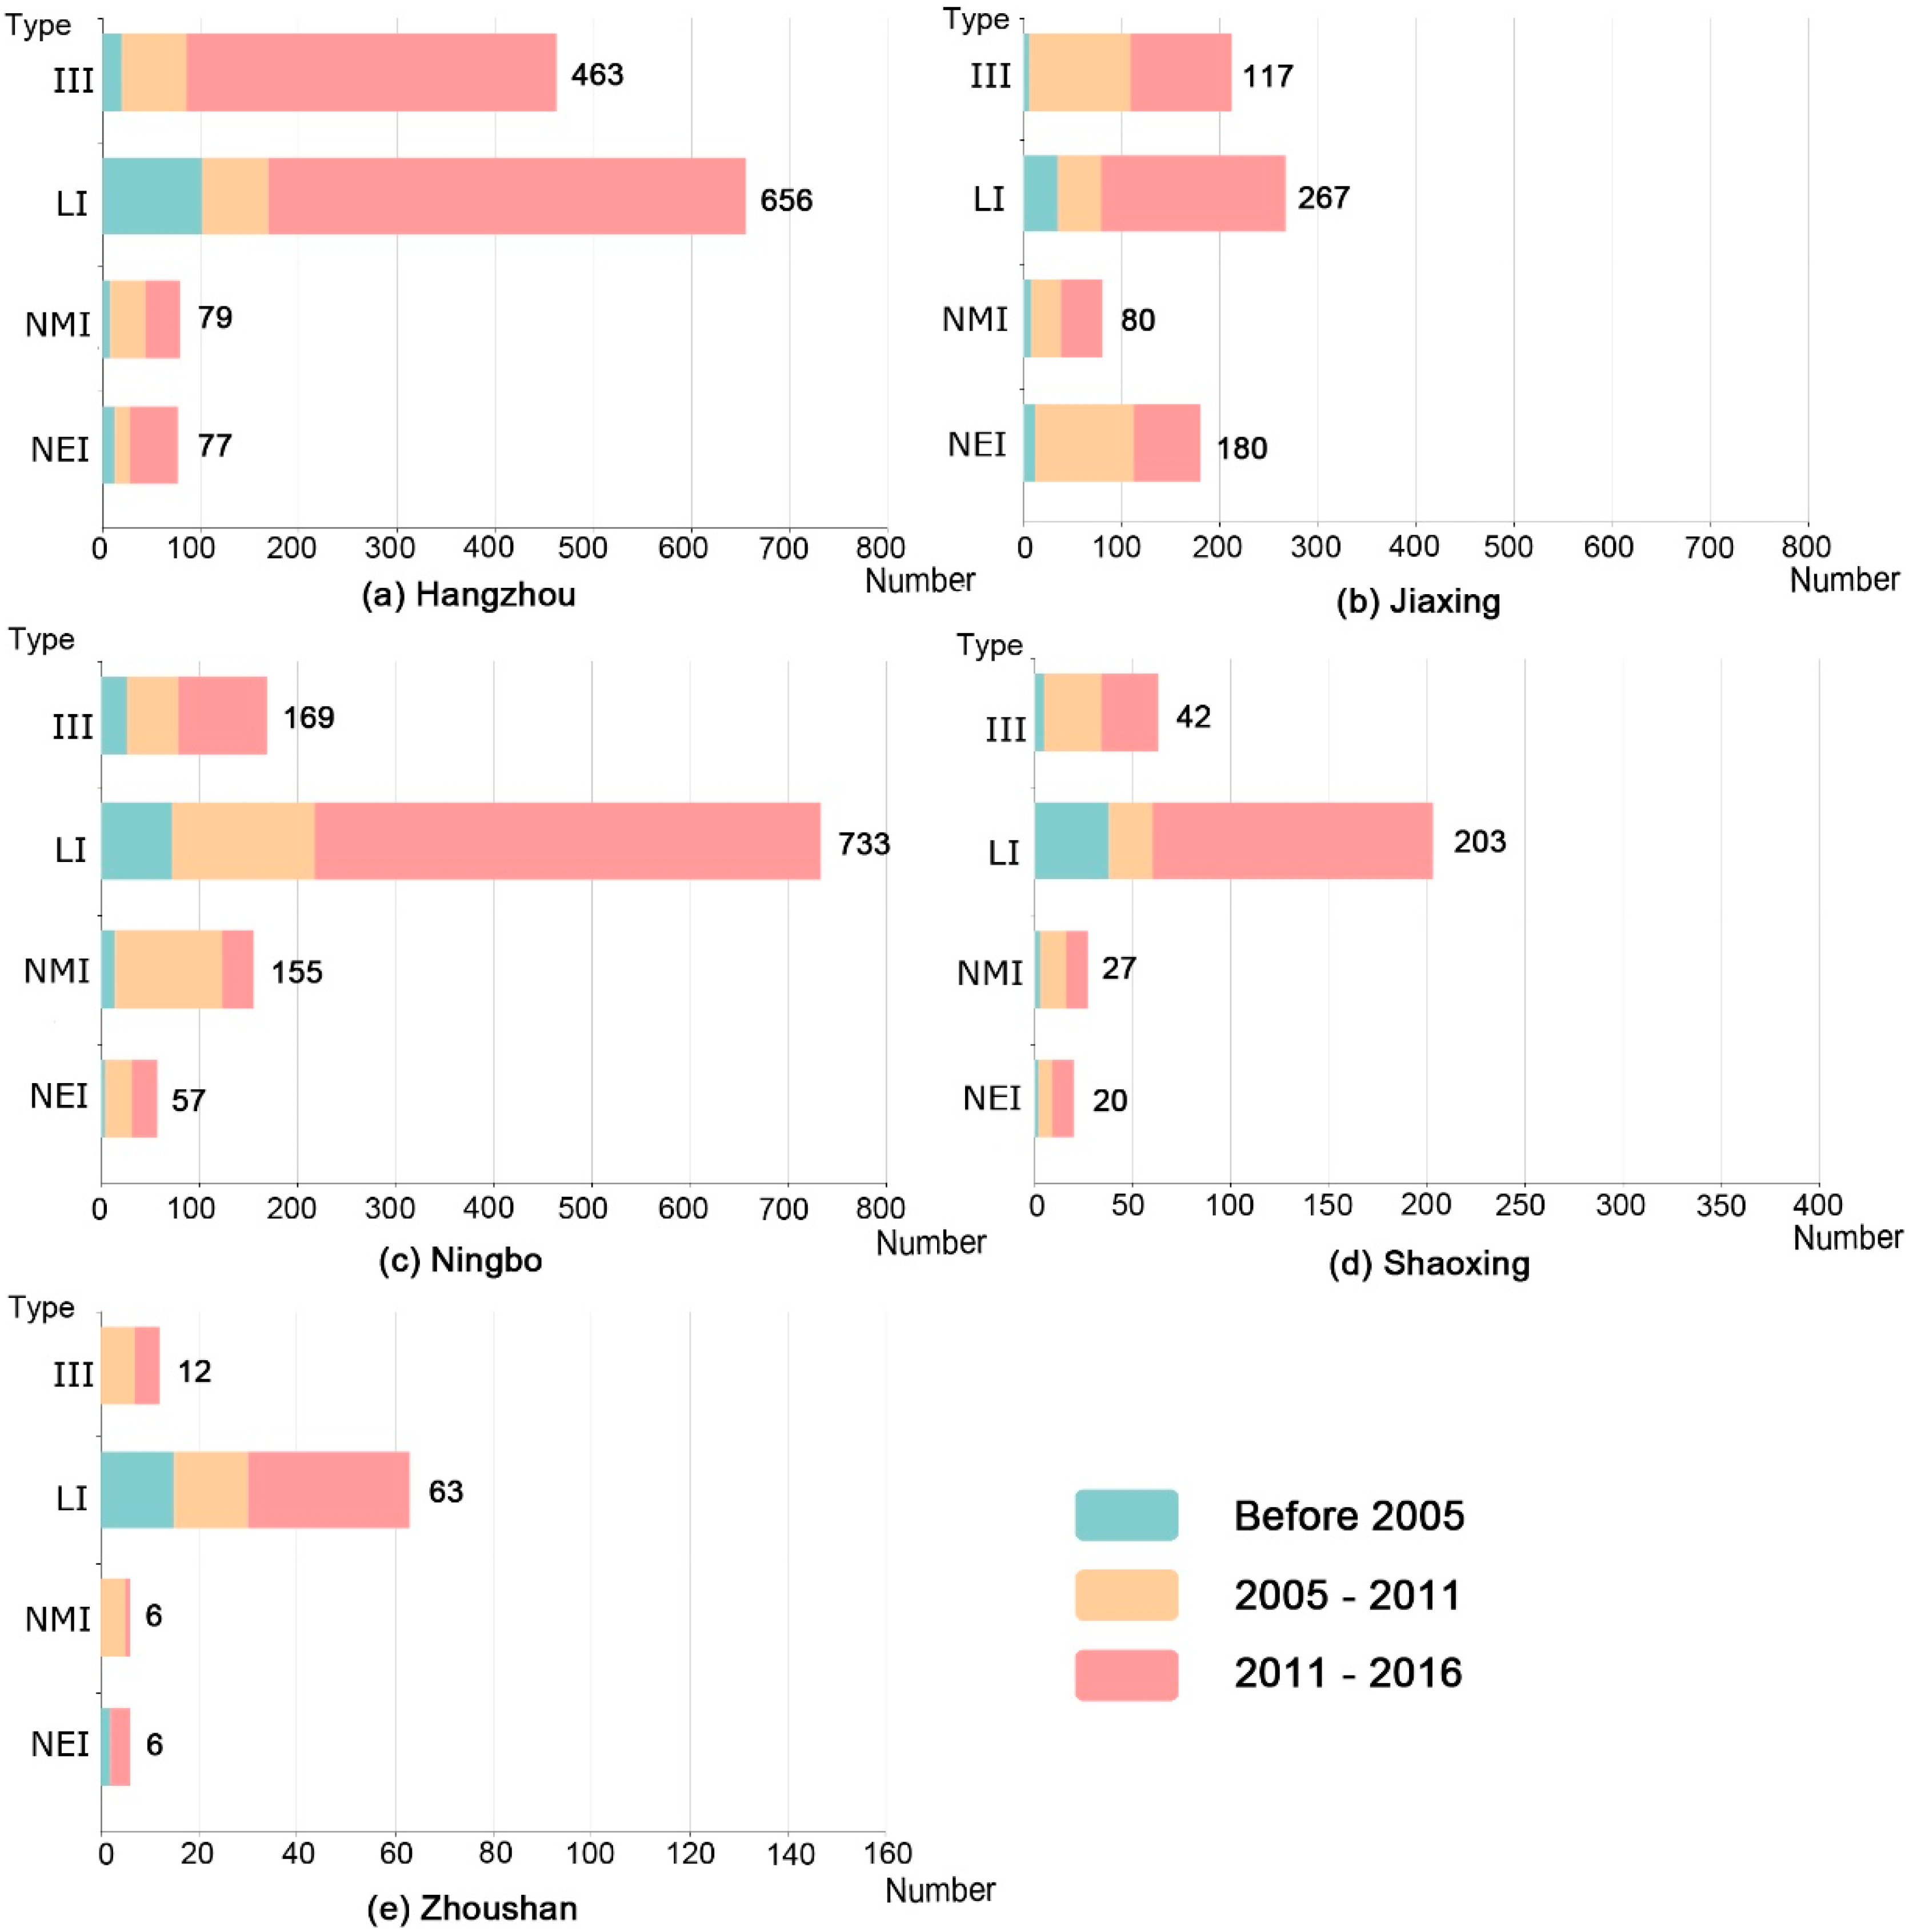
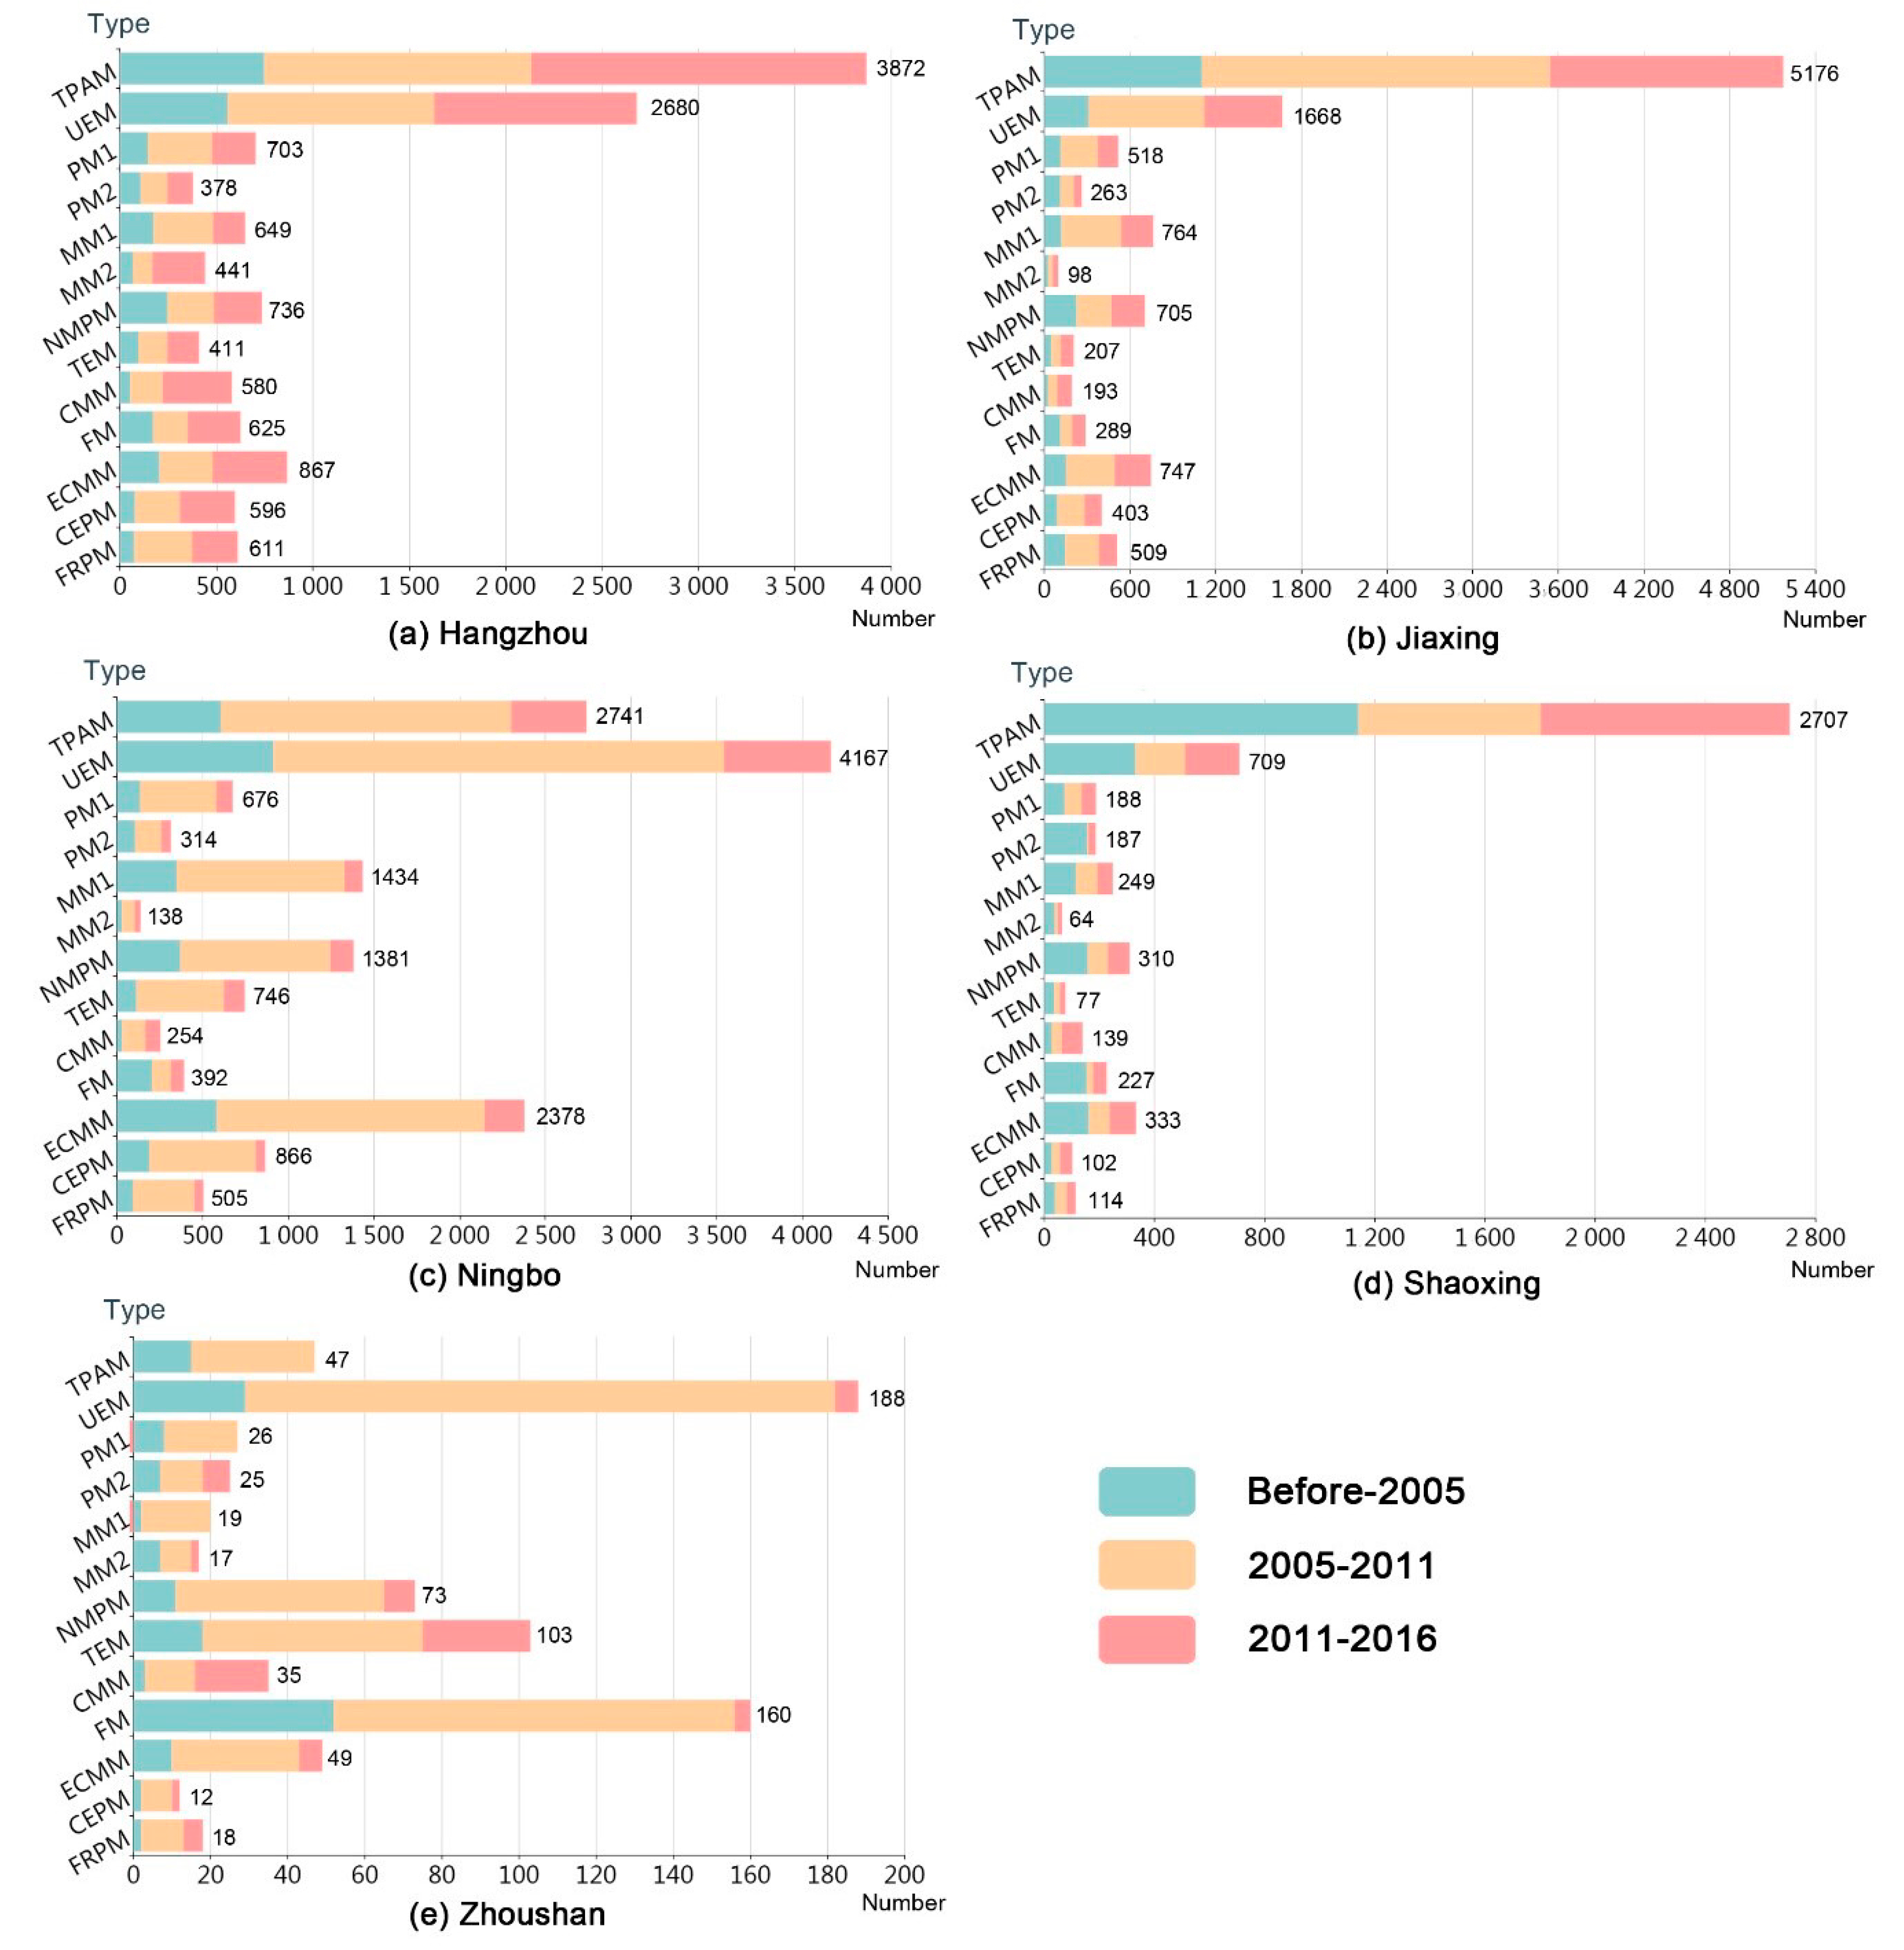
4.3. Growth of Industrial Regions at the City Level
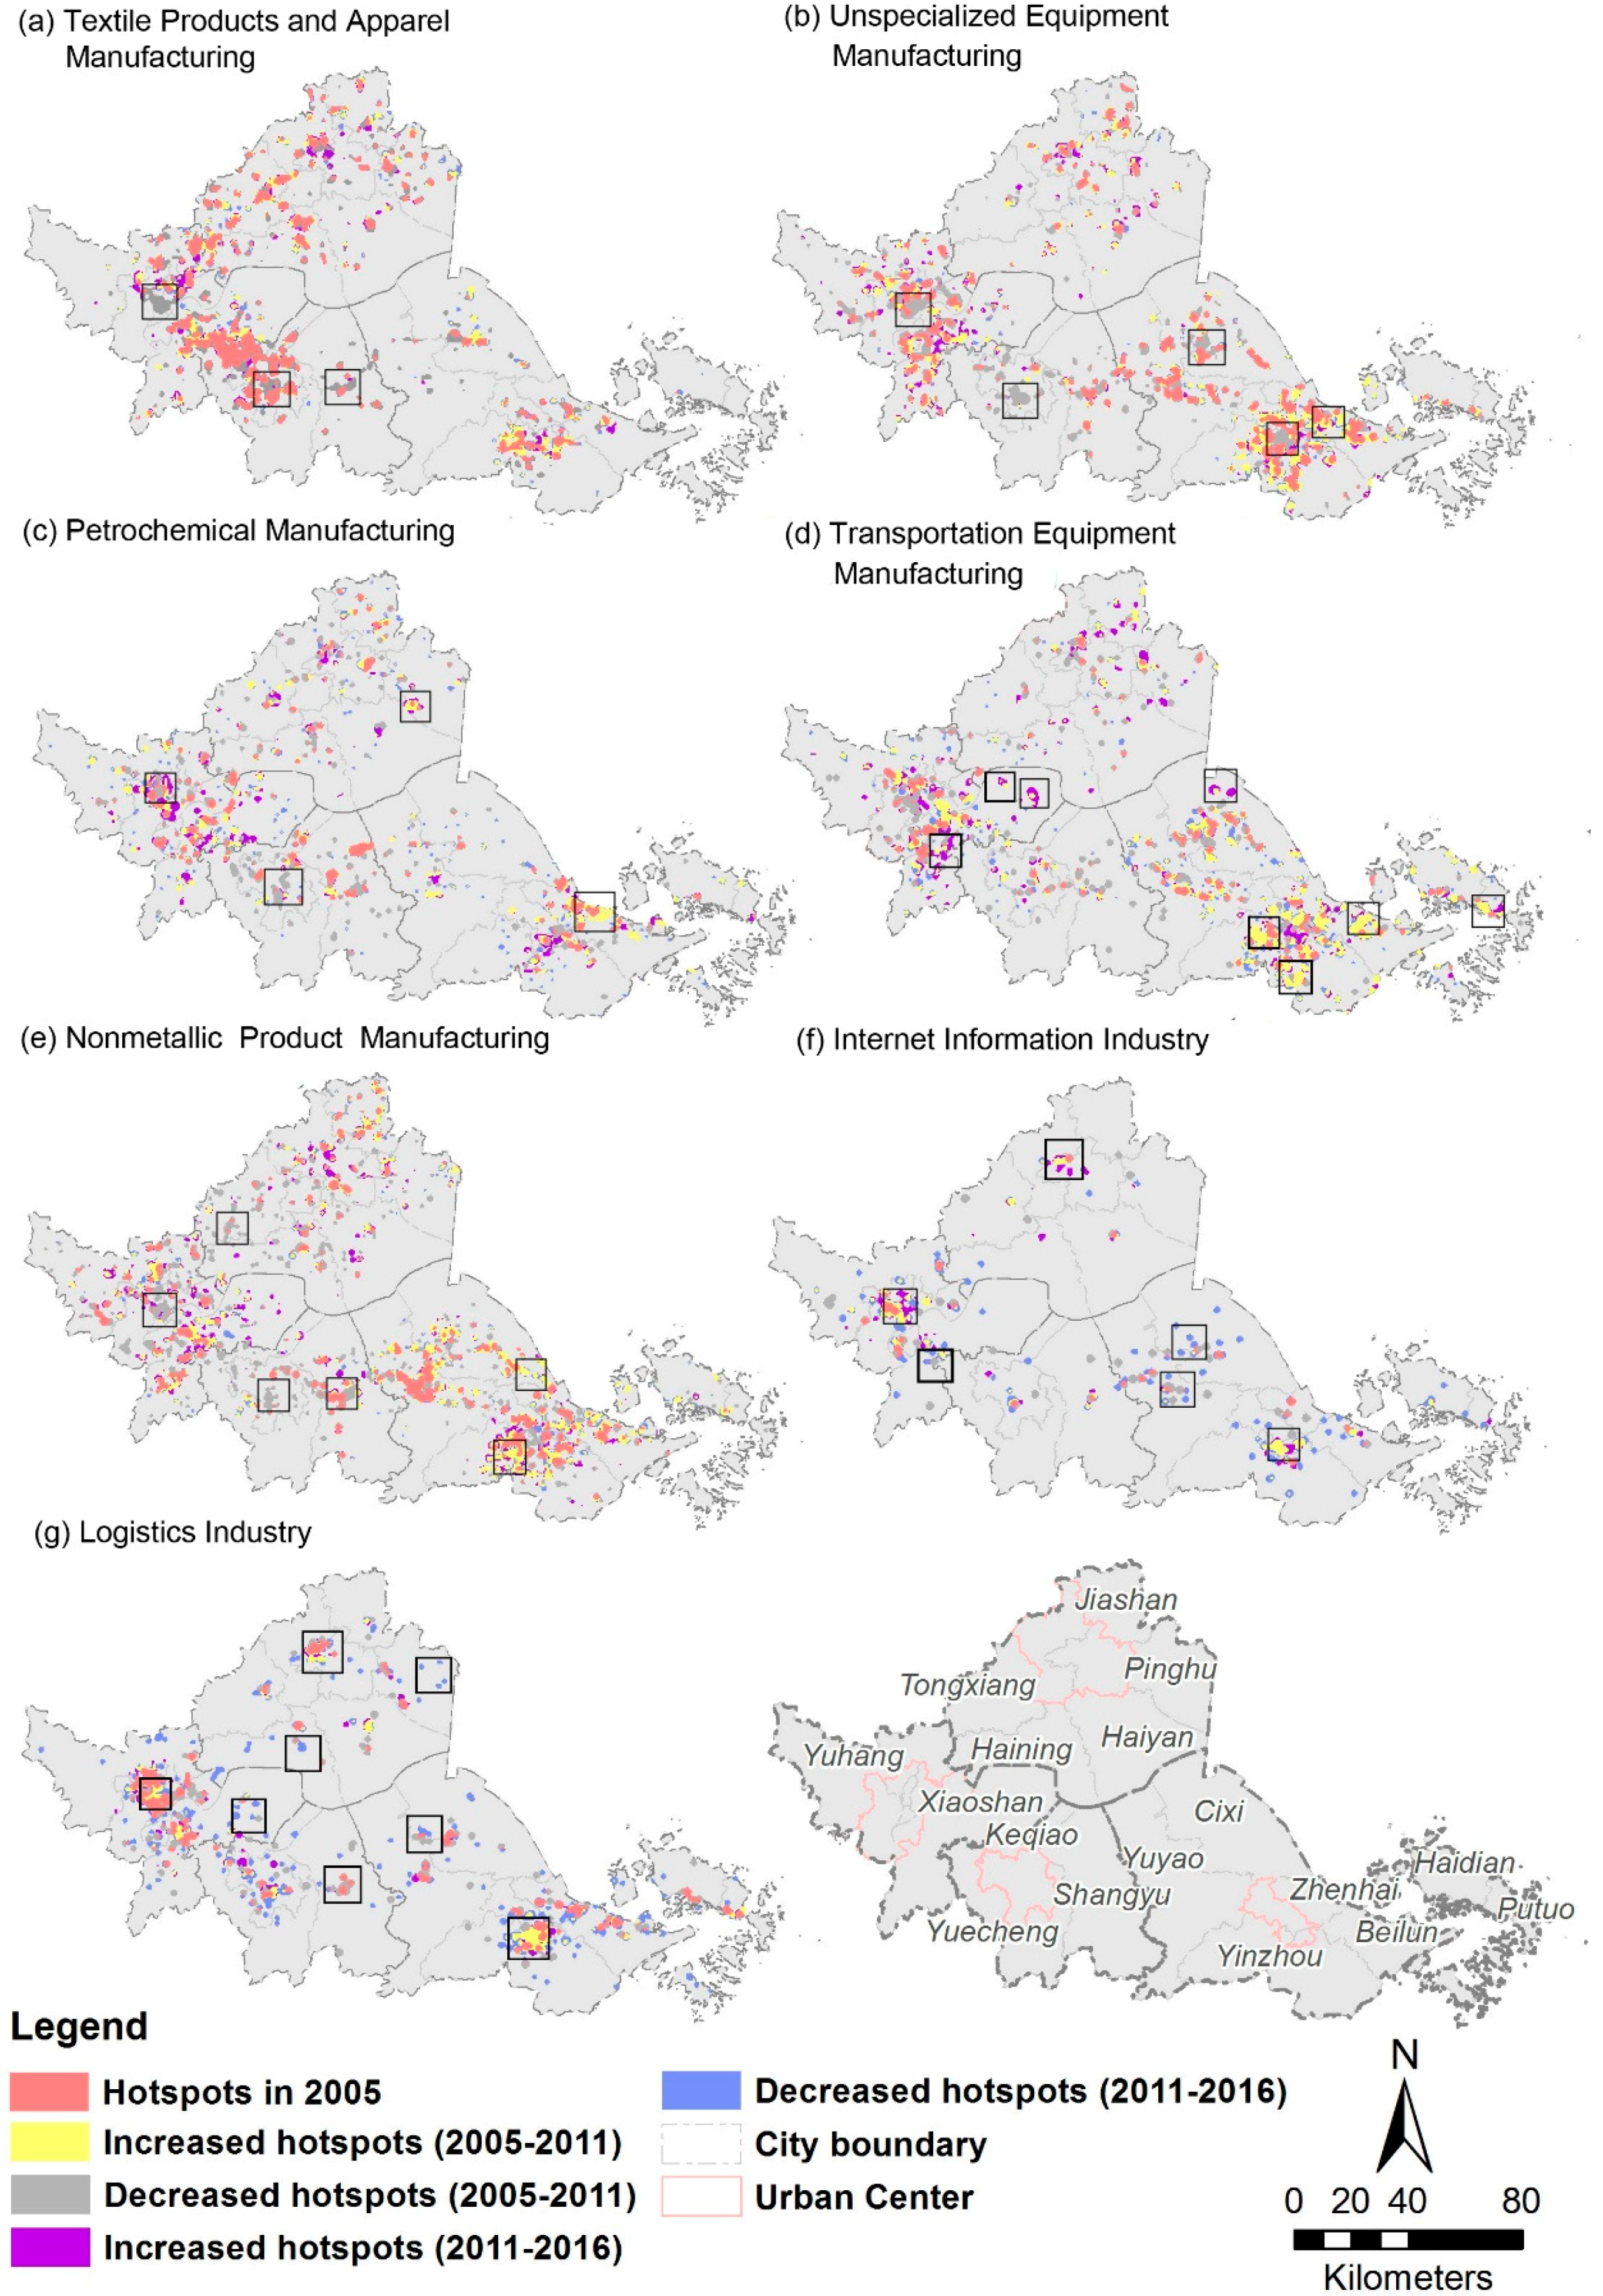
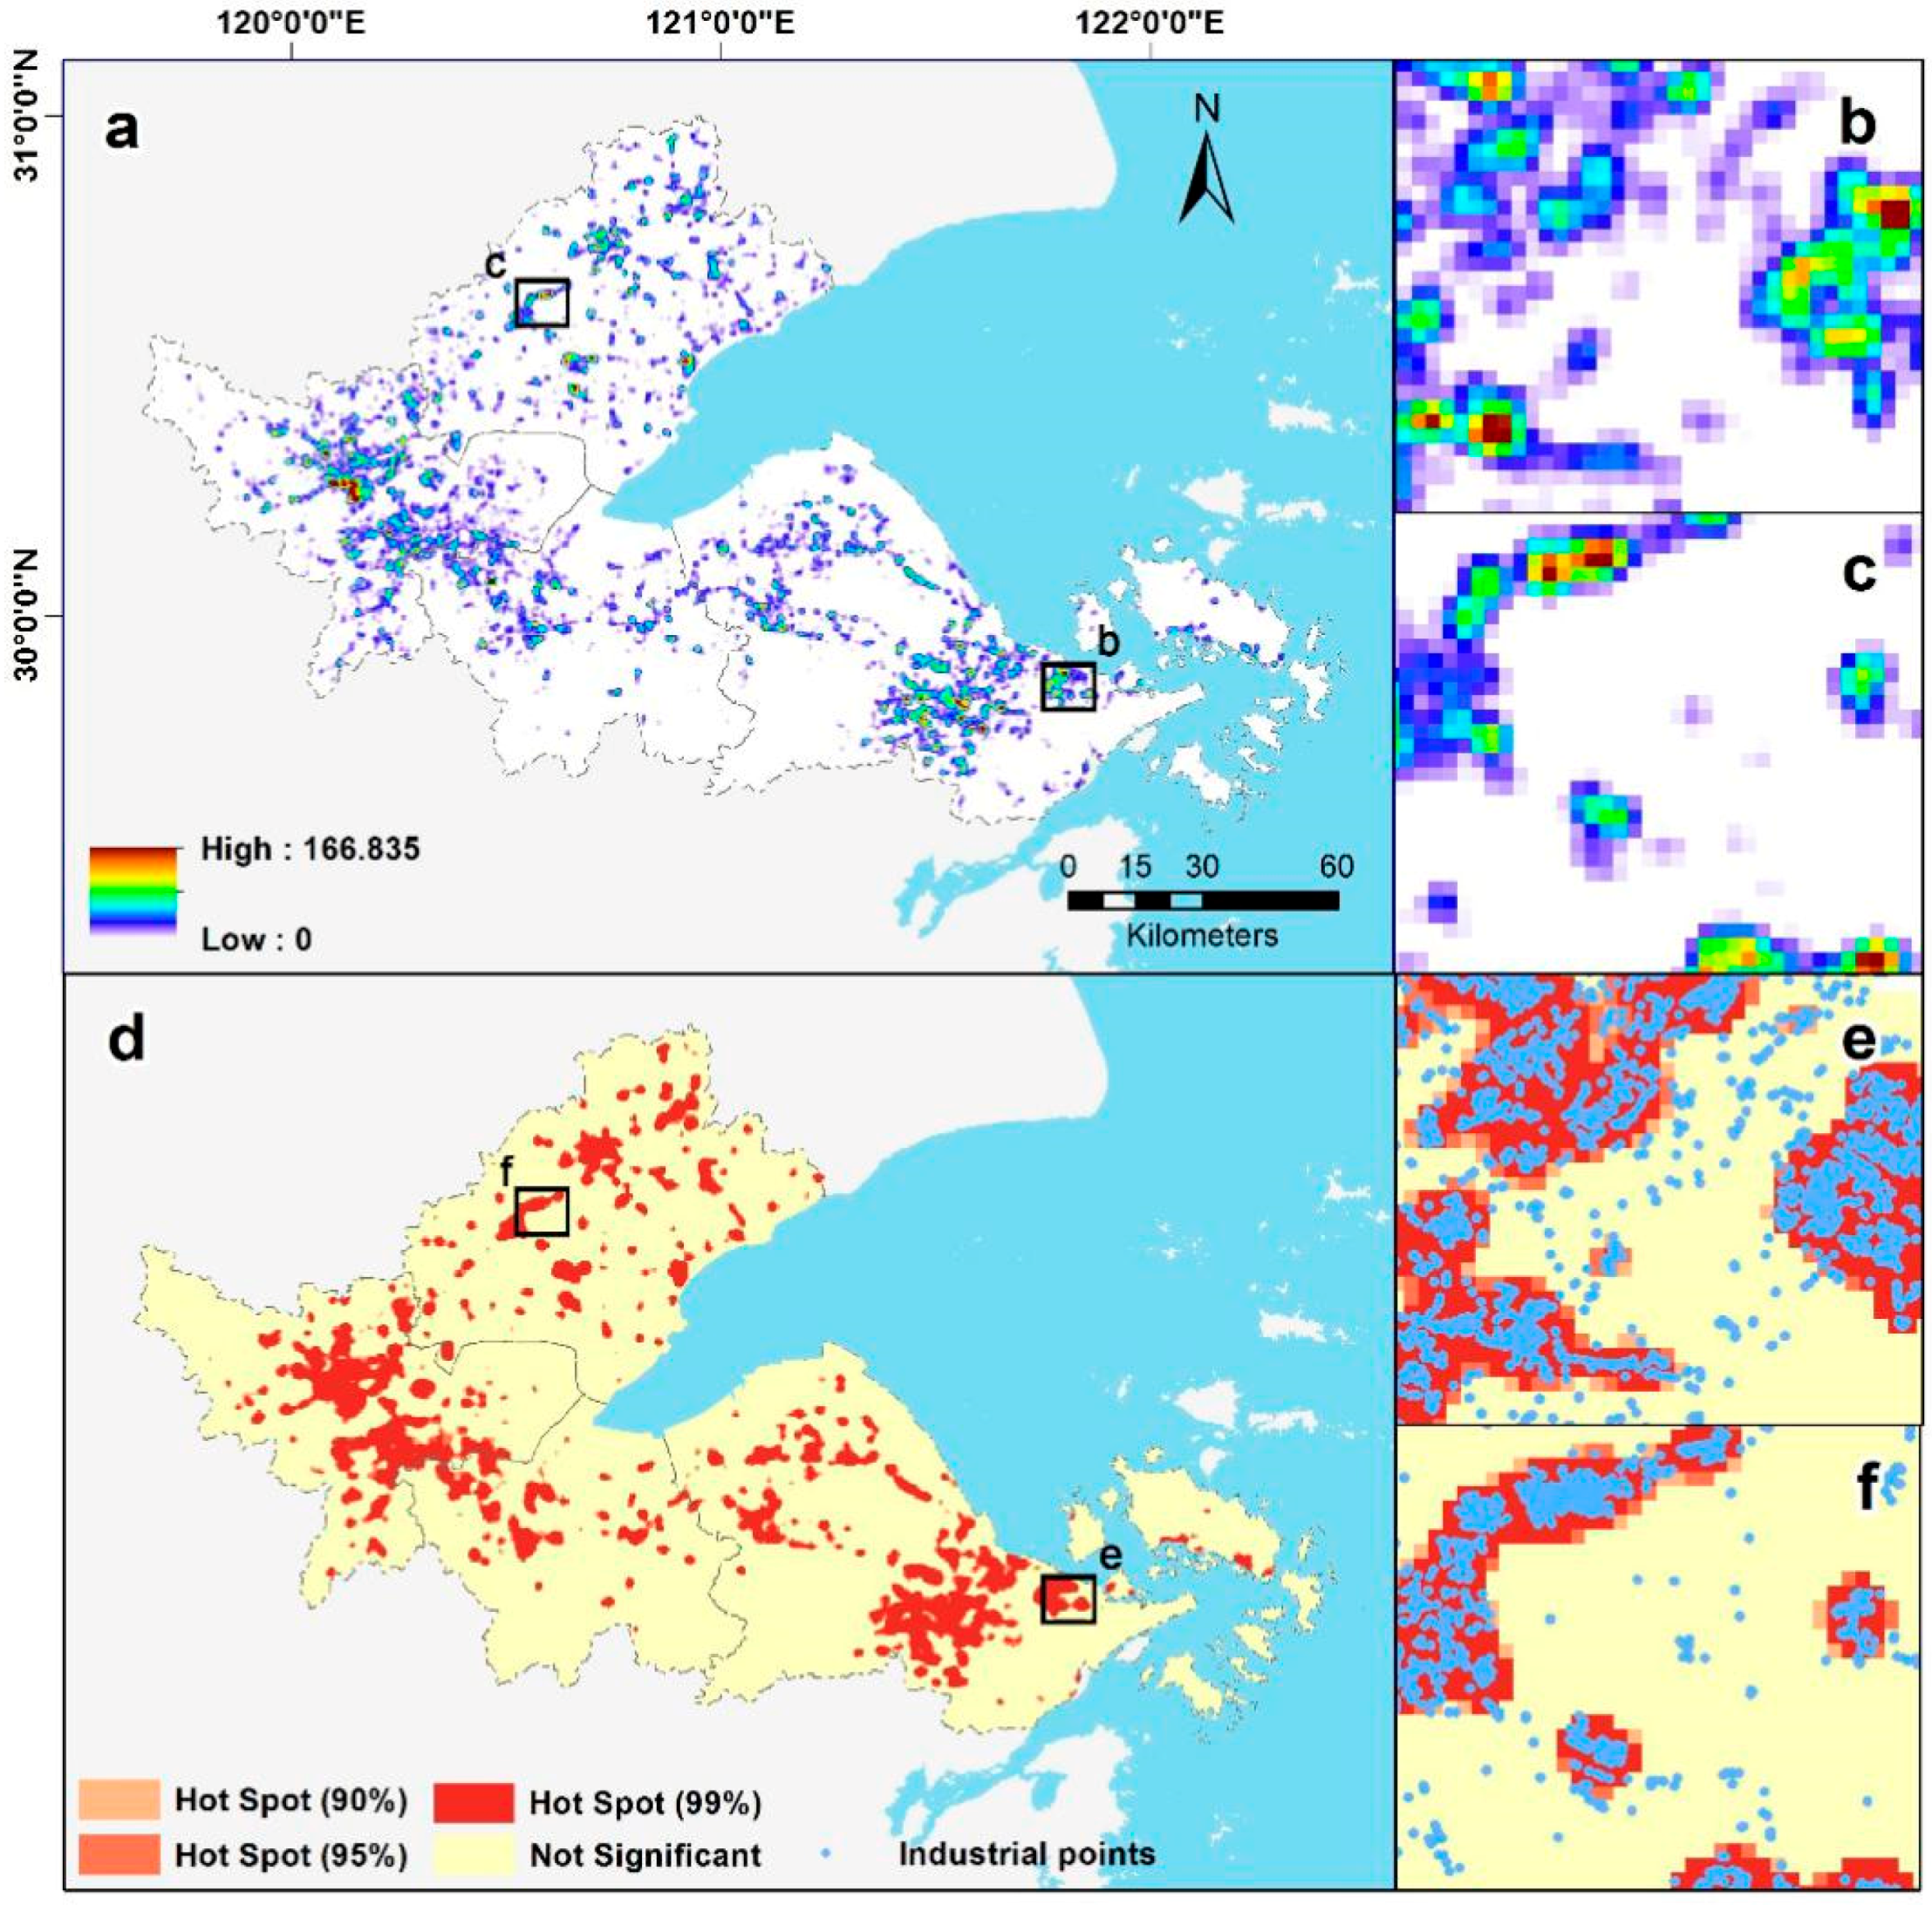
4.4. Concentration and Patterns of Industrial Activities
5. Discussion
5.1. Comparision of Traditional Industry with New Industry
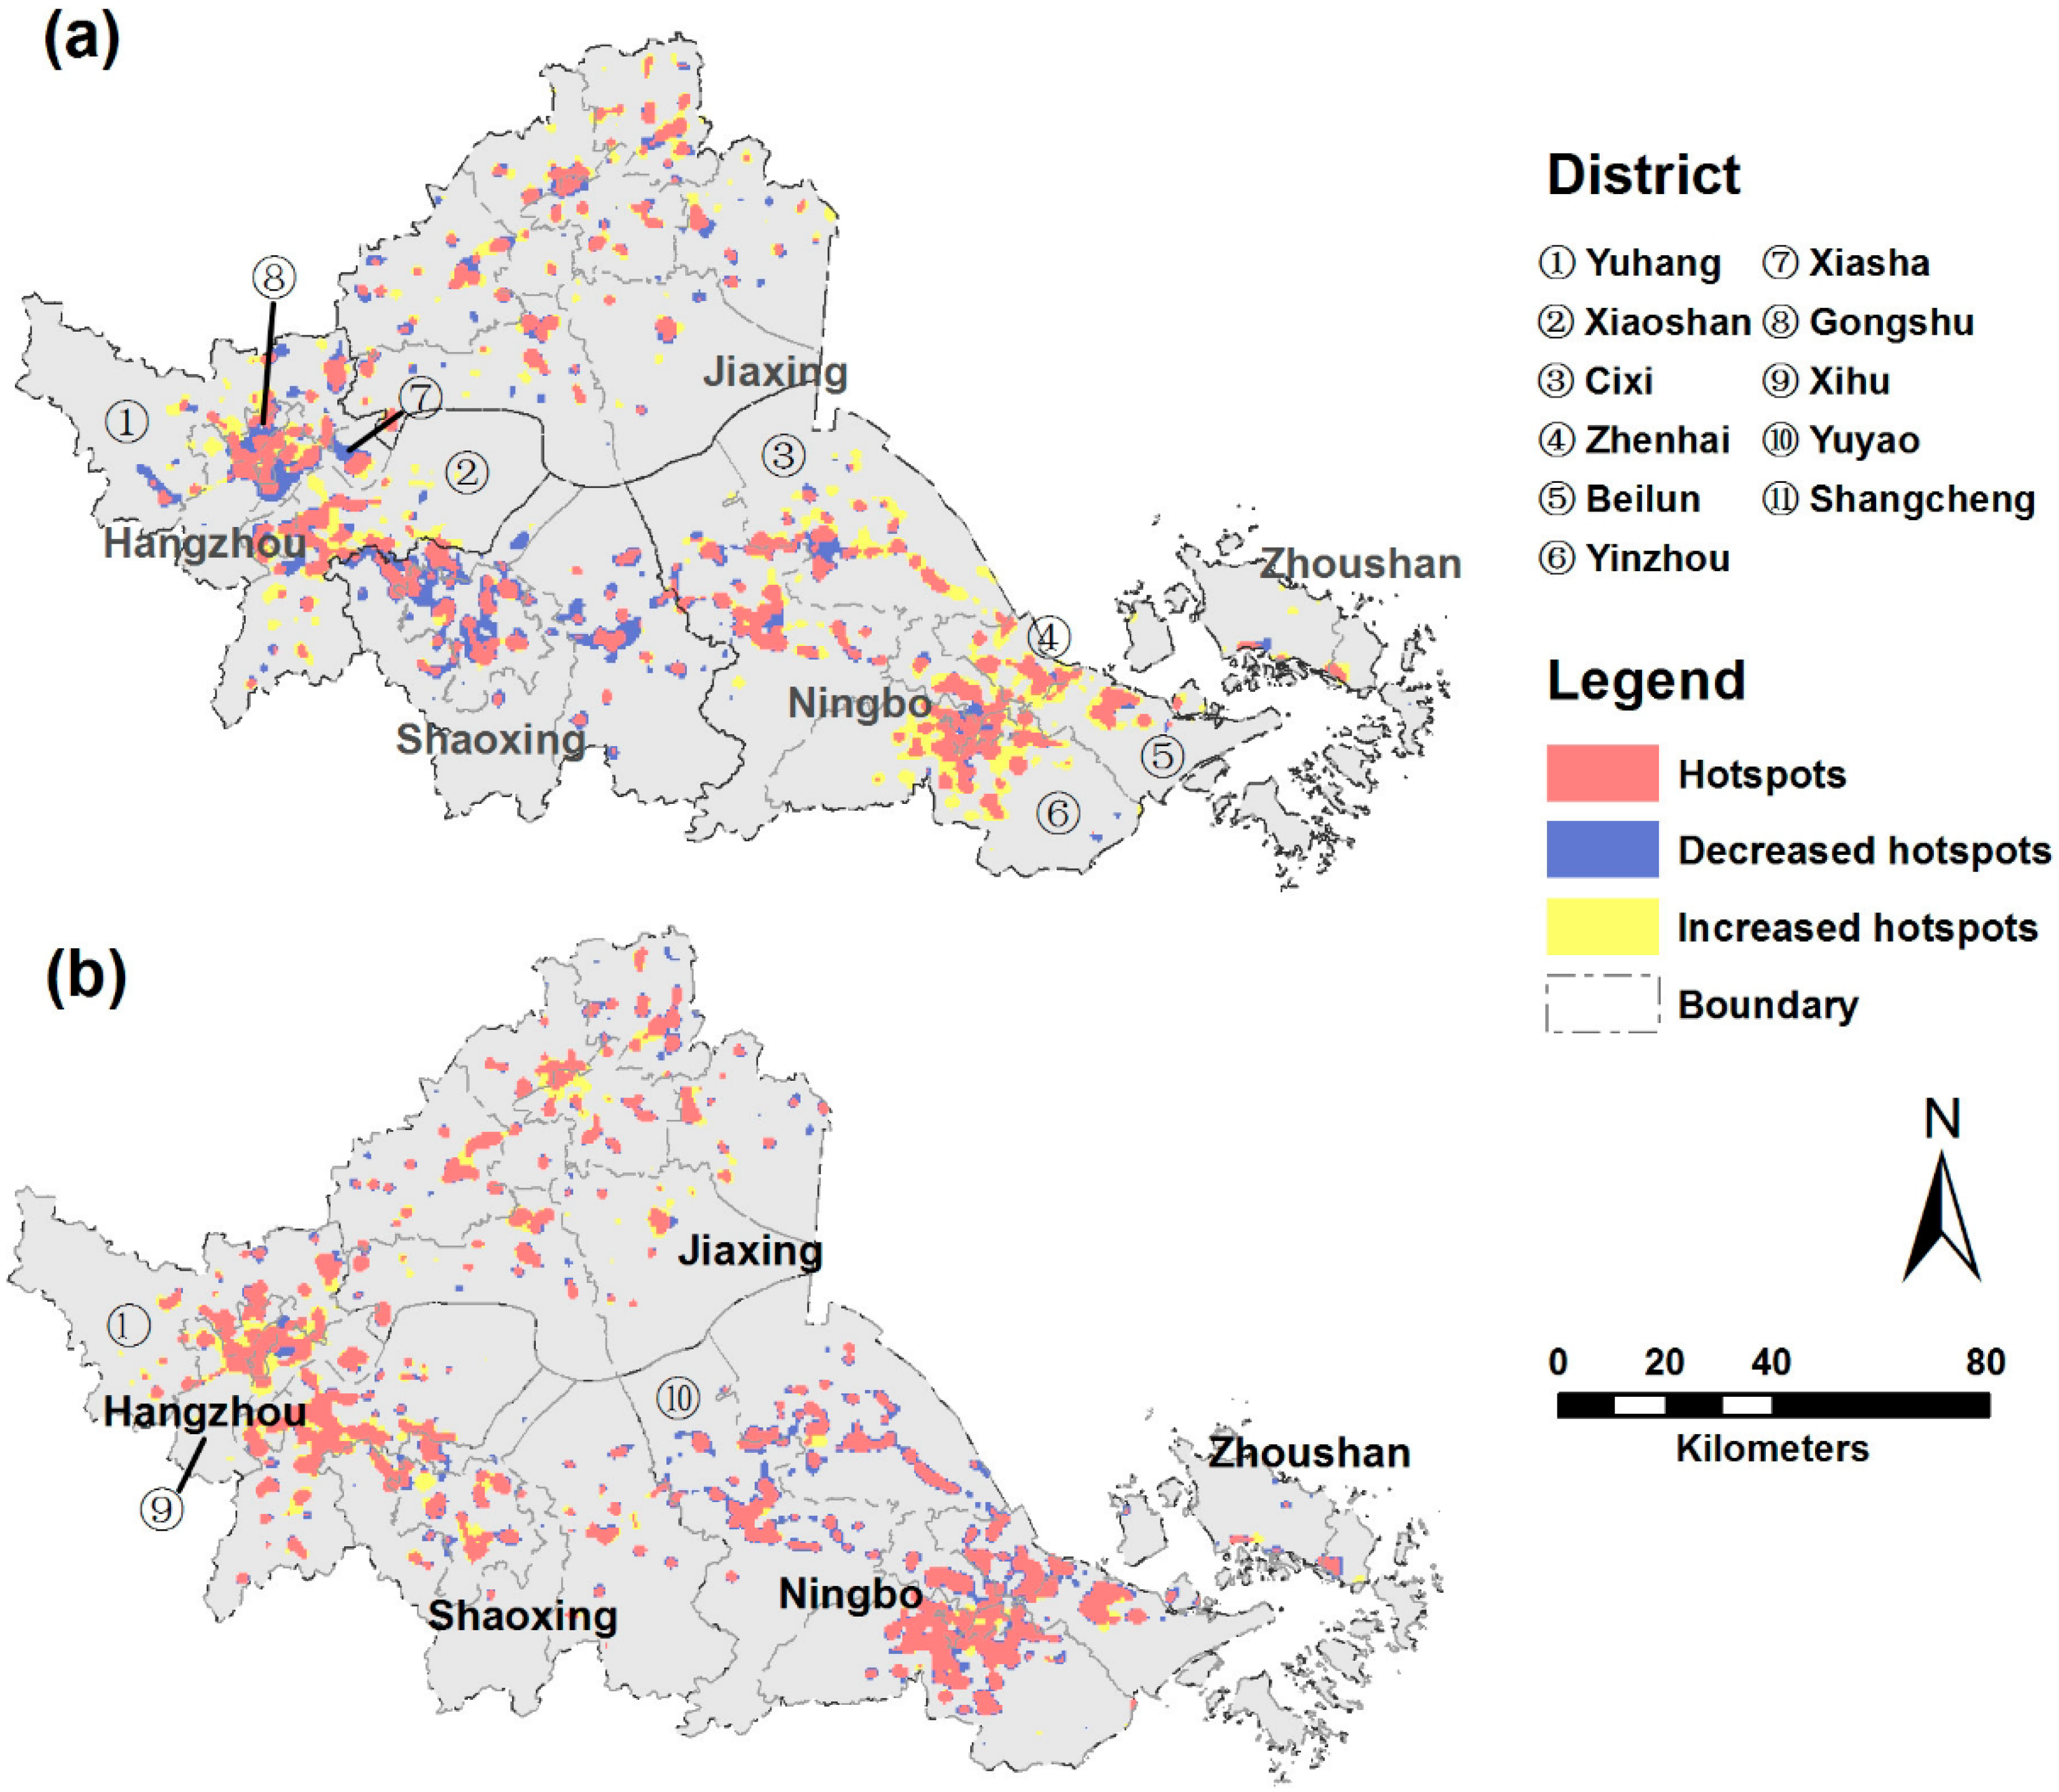
5.2. Spatiotemporal Changes of Industrial Hotspots
5.3. Methodology Assessment
5.4. Sustainable Industrial Development: Policy Implications
6. Conclusions
Author Contributions
Funding
Acknowledgments
Conflicts of Interest
Appendix A

| TPAM | UEM | PM1 | PM2 | MM1 | MM2 | NMPM | TEM | CMM | FM | ECMM | CEPM | FRPM | III | LI | NMI | NEI | OMM | UA | |
|---|---|---|---|---|---|---|---|---|---|---|---|---|---|---|---|---|---|---|---|
| TPAM | 48 | 0 | 0 | 1 | 0 | 0 | 1 | 1 | 0 | 1 | 0 | 0 | 0 | 0 | 0 | 0 | 0 | 0 | 92.31% |
| UEM | 0 | 42 | 0 | 3 | 1 | 1 | 0 | 1 | 1 | 0 | 1 | 0 | 0 | 0 | 0 | 1 | 0 | 2 | 79.25% |
| PM1 | 0 | 0 | 49 | 0 | 1 | 0 | 0 | 0 | 0 | 1 | 0 | 0 | 0 | 0 | 0 | 1 | 0 | 2 | 90.74% |
| PM2 | 1 | 2 | 0 | 46 | 0 | 0 | 1 | 0 | 0 | 0 | 1 | 0 | 0 | 0 | 0 | 0 | 0 | 2 | 86.79% |
| MM1 | 0 | 1 | 0 | 0 | 49 | 0 | 0 | 0 | 0 | 0 | 1 | 0 | 0 | 0 | 0 | 0 | 0 | 3 | 90.74% |
| MM2 | 0 | 0 | 0 | 0 | 1 | 49 | 0 | 0 | 1 | 0 | 0 | 0 | 0 | 0 | 0 | 0 | 0 | 1 | 94.23% |
| NMPM | 1 | 0 | 1 | 0 | 0 | 0 | 43 | 0 | 8 | 0 | 0 | 0 | 0 | 0 | 0 | 0 | 0 | 0 | 81.13% |
| TEM | 0 | 2 | 1 | 1 | 0 | 0 | 0 | 43 | 0 | 0 | 4 | 1 | 0 | 0 | 0 | 0 | 0 | 0 | 82.69% |
| CMM | 0 | 0 | 1 | 0 | 0 | 0 | 0 | 0 | 50 | 0 | 0 | 0 | 0 | 0 | 0 | 0 | 0 | 2 | 94.34% |
| FM | 0 | 1 | 0 | 0 | 0 | 0 | 0 | 0 | 0 | 49 | 0 | 0 | 0 | 0 | 0 | 0 | 0 | 4 | 90.74% |
| ECMM | 0 | 1 | 0 | 0 | 2 | 0 | 0 | 0 | 0 | 0 | 47 | 0 | 0 | 0 | 0 | 0 | 0 | 2 | 90.38% |
| CEPM | 0 | 0 | 0 | 0 | 0 | 0 | 0 | 0 | 0 | 0 | 7 | 44 | 0 | 1 | 1 | 0 | 0 | 2 | 80.00% |
| FRPM | 0 | 0 | 0 | 1 | 1 | 0 | 0 | 0 | 0 | 0 | 0 | 0 | 46 | 0 | 0 | 0 | 0 | 4 | 88.46% |
| III | 0 | 0 | 0 | 1 | 0 | 0 | 1 | 0 | 0 | 0 | 0 | 1 | 0 | 47 | 1 | 0 | 0 | 1 | 90.38% |
| LI | 0 | 0 | 0 | 0 | 1 | 0 | 1 | 1 | 2 | 0 | 0 | 0 | 0 | 0 | 44 | 0 | 0 | 3 | 84.62% |
| NMI | 1 | 1 | 1 | 0 | 0 | 0 | 0 | 0 | 3 | 1 | 0 | 0 | 0 | 0 | 0 | 47 | 0 | 0 | 87.04% |
| NEI | 1 | 1 | 0 | 0 | 0 | 0 | 0 | 0 | 1 | 0 | 0 | 0 | 0 | 0 | 0 | 0 | 48 | 2 | 90.57% |
| OMM | 2 | 3 | 0 | 2 | 1 | 0 | 0 | 1 | 0 | 0 | 0 | 0 | 1 | 2 | 0 | 0 | 0 | 40 | 76.92% |
| PA | 88.89% | 77.78% | 92.45% | 83.64% | 85.96% | 98.00% | 91.49% | 91.49% | 75.76% | 94.23% | 77.05% | 95.65% | 97.87% | 94.00% | 95.65% | 95.92% | 100.00% | 57.14% | 87.29% |
References
- Gao, J.; Dennis, Y.; Chen, W.; Chen, J. Economic Transition and urban Land Expansion in Provincial China. Habitat Int. 2014, 44, 461–473. [Google Scholar] [CrossRef]
- Wing, K.; Chan, K.W. Fundamentals of China’s Urbanization and Policy. China Rev. 2016, 10, 63–93. [Google Scholar]
- Liu, Y.; Fang, F.; Li, Y. Key Issues of Land Use in China and Implications for Policy Making. Land Use Policy 2014, 40, 6–12. [Google Scholar] [CrossRef]
- Tu, F.; Yu, X.; Ruan, J. Industrial Land Use Efficiency under Government Intervention: Evidence from Hangzhou, China. Habitat Int. 2014, 43, 1–10. [Google Scholar] [CrossRef]
- Yang, B.D.; Lv, J.; Yang, Y.J.; Chen, F.; Liu, G.J. Evolution of Industrial Land Location in Xuzhou City since Chinese Reform and Opening-up. Procedia Eng. 2017, 198, 1137–1148. [Google Scholar] [CrossRef]
- National Bureau of Statistics. China’s Urban Construction Statistical Yearbook-2014; China Statistics Press: Beijing, China, 2014; pp. 50–51. (In Chinese)
- Chen, T.; Chang, Q.; Liu, J.; Clevers, J.G.P.W.; Kooistra, L. Identification of Soil Heavy Metal Sources and Improvement in Spatial Mapping Based on Soil Spectral Information: A Case Study in Northwest China. Sci. Total Environ. 2016, 565, 155–164. [Google Scholar] [CrossRef] [PubMed]
- Jiang, L.; Bai, L. Spatio-Temporal Characteristics of Urban Air Pollutions and Their Causal Relationships: Evidence from Beijing and Its Neighboring Cities. Sci. Rep. 2018, 8, 1–12. [Google Scholar] [CrossRef] [PubMed]
- Chen, Z.; Kahn, M.E.; Liu, Y.; Wang, Z. The Consequences of Spatially Differentiated Water Pollution Regulation in China. J. Environ. Econ. Manag. 2018, 88, 468–485. [Google Scholar] [CrossRef]
- Wei, B.; Yang, L. A Review of Heavy Metal Contaminations in Urban Soils, Urban Road Dusts and Agricultural Soils from China. Microchem. J. 2010, 94, 99–107. [Google Scholar] [CrossRef]
- Wei, Y.H.D.; Liefner, I. Globalization, Industrial Restructuring, and Regional Development in China. Appl. Geogr. 2012, 32, 102–105. [Google Scholar] [CrossRef]
- National Development and Reform Commission. National New Urbanization Plan (2014–2020). Available online: http://ghs.ndrc.gov.cn/zttp/xxczhjs/ghzc/201605/t20160505_800839.html (accessed on 5 May 2016). (In Chinese)
- The Central People’s Government of the People’s Republic of China. Circular of the State Council on the Issuance of the Plan for Industrial Transformation and Upgrading (2011–2015). Available online: http://www.gov.cn/zwgk/2012-01/18/content_2047619.htm (accessed on 18 January 2012). (In Chinese)
- Ministry of Industry and Information Technology of the People’s Republic of China. Circular of the State Council on the Issuance of Manufacturing 2025 in China. Available online: http://www.miit.gov.cn/n973401/n1234620/n1234622/c4409653/content.html (accessed on 19 May 2015). (In Chinese)
- Ministry of Industry and Information Technology of the People’s Republic of China. Midterm Evaluation Report of the Plan for Industrial Transformation and Upgrading (2011–2015). Available online: http://www.miit.gov.cn/n1146295/n1652858/n1652930/n3757016/c3762448/content.html (accessed on 10 Februray 2014). (In Chinese)
- Fang, C.; Yu, D. Urban Agglomeration: An Evolving Concept of an Emerging Phenomenon. Landsc. Urban Plan. 2017, 162, 126–136. [Google Scholar] [CrossRef]
- Gao, Y.; Ma, Y. What is Absent from the Current Monitoring: Idleness of Rural Industrial Land in Suburban Shanghai. Habitat Int. 2015, 49, 138–147. [Google Scholar] [CrossRef]
- Huang, Z.; He, C.; Wei, Y.H.D. A Comparative Study of Land Efficiency of Electronics Firms Located Within and Outside Development Zones in Shanghai. Habitat Int. 2016, 56, 63–73. [Google Scholar] [CrossRef]
- Shi, Y.; Fan, W.; Pu, S. Comparative Analysis of Scale, Structure and Benefits of Metropolitan Industrial Land in China. Tongji Univ. Soc. Sci. 2010, 21, 26–31. (In Chinese) [Google Scholar]
- Deng, P.D.; Jefferson, G.H. Explaining Spatial Convergence of China’s Industrial Productivity. Oxf. Bull. Econ. Stat. 2011, 73, 818–832. [Google Scholar] [CrossRef]
- Zheng, Q.; Wang, K.; Huang, L.; Zheng, Q.; Abubakar, G.A. Monitoring the Different Types of Urban Construction Land Expansion (UCLE) in China’s Port City: A Case Study of Ningbo’s Central City. Sustainability 2017, 9, 2374. [Google Scholar] [CrossRef]
- Liang, Y.; Wang, F.; Li, G.; Jiang, H. Present Condition and Thoughts on Cadastral Information Service Policy. Shandong Land Resour. 2014, 30, 94–96. [Google Scholar]
- Zheng, X.; Wu, B.; Weston, M.V.; Zhang, J.; Gan, M.; Zhu, J.; Deng, J.; Wang, K.; Teng, L. Rural Settlement Subdivision by Using Landscape Metrics as Spatial Contextual Information. Remote Sens. 2017, 9, 486. [Google Scholar] [CrossRef]
- Blaschke, T. Object Based Image Analysis for Remote Sensing. ISPRS J. Photogramm. Remote Sens. 2010, 65, 2–16. [Google Scholar] [CrossRef]
- Berger, C.; Voltersen, M.; Hese, O.; Walde, I.; Schmullius, C. Robust Extraction of Urban Land Cover Information from HSR Multi-Spectral and LiDAR Data. IEEE J. Sel. Top. Appl. Earth Obs. Remote Sens. 2013, 6, 2196–2211. [Google Scholar] [CrossRef]
- Voltersen, M.; Berger, C.; Hese, S.; Schmullius, C. Object-Based Land Cover Mapping and Comprehensive Feature Calculation for an Automated Derivation of Urban Structure Types at Block Level. Remote Sens. Environ. 2014, 154, 192–201. [Google Scholar] [CrossRef]
- Comber, A.J.; Brunsdon, C.F.; Farmer, C.J.Q. Community Detection in Spatial Networks: Inferring Land Use from a Planar Graph of Land Cover Objects. Int. J. Appl. Earth Obs. Geoinf. 2012, 18, 274–282. [Google Scholar] [CrossRef]
- Hu, T.; Yang, J.; Li, X.; Gong, P. Mapping Urban Land Use by Using Landsat Images and Open Social Data. Remote Sens. 2016, 8, 151. [Google Scholar] [CrossRef]
- Chen, Y.; Liu, X.; Li, X.; Liu, X.; Yao, Y.; Hu, G.; Xu, X.; Pei, F. Delineating Urban Functional Areas with Building-Level Social Media Data: A Dynamic Time Warping (DTW) Distance Based K-Medoids Method. Landsc. Urban Plan. 2017, 160, 48–60. [Google Scholar] [CrossRef]
- Jiang, S.; Alves, A.; Rodrigues, F.; Ferreira, J.; Pereira, F.C. Mining Point-of-Interest Data from Social Networks for Urban Land Use Classification and Disaggregation. Comput. Environ. Urban Syst. 2015, 53, 36–46. [Google Scholar] [CrossRef]
- Yao, Y.; Li, X.; Liu, X.; Liu, P.; Liang, Z.; Zhang, J.; Mai, K. Sensing Spatial Distribution of Urban Land Use by Integrating Points-of-Interest and Google Word2Vec Model. Int. J. Geogr. Inf. Sci. 2016, 31, 825–848. [Google Scholar] [CrossRef]
- Zhang, X.; Du, S.; Wang, Q. Hierarchical Semantic Cognition for Urban Functional Zones with VHR Satellite Images and POI Data. ISPRS J. Photogramm. Remote Sens. 2017, 132, 170–184. [Google Scholar] [CrossRef]
- Yuan, J.; Zheng, Y.; Xie, X. Discovering Regions of Different Functions in a City Using Human Mobility and POIs. In Proceedings of the 18th ACM SIGKDD International Conference on Knowledge Discovery and Data Mining, Beijing, China, 12–16 August 2012; pp. 186–194. [Google Scholar]
- Ningbo-Zhoushan Port. Ningbo-Zhoushan Port Overview. Available online: http://www.portnbzs.com.cn/Introduction/overview (accessed on 1 Juanary 2006). (In Chinese).
- Zhou, D.; Xu, J.; Wang, L.; Lin, Z. Assessing Urbanization Quality Using Structure and Function Analyses: A Case Study of the Urban Agglomeration Around Hangzhou Bay (UAHB), China. Habitat Int. 2015, 49, 165–176. [Google Scholar] [CrossRef]
- Zhejiang Provincial Development and Reform Commission. Zhejiang Zhoushan Islands New Area Development Plan. Available online: http://www.zjdpc.gov.cn/art/2013/1/24/art_719_493202.html (accessed on 17 Juanary 2013). (In Chinese)
- National Bureau of Statstics. Zhejiang Statistical Yearbook-2017; China Statistics Press: Beijing, China, 2017. (In Chinese)
- Tang, G.; Xu, W.; Wang, S. A study on the Geographic Distribution Features and the Performance and the Forming Mechanism for the Zhejiang Regional Mass Economy. Hum. Geogr. 2003, 4, 53–59. (In Chinese) [Google Scholar]
- Shahtahmassebi, A.R.; Wu, C.; Blackburn, G.A.; Zheng, Q.; Huang, L.; Shortridge, A.; Shahtahmassebi, G.; Jiang, R.; He, S.; Wang, K.; et al. How do Modern Transportation Projects Impact on Development of Impervious Surfaces via New Urban Area and Urban Intensification? Evidence from Hangzhou Bay Bridge, China. Land Use Policy 2018, 77, 479–497. [Google Scholar] [CrossRef]
- Zhejiang People’s Government. Interpretation of the Plan for the Spatial Development of the Urban Agglomeration in the Hangzhou Bay in Zhejiang Province. Policy Outlook 2004, 1, 5–7. [Google Scholar]
- Zhejiang People’s Government. The Plan for Powerful Zhejiang Province Construction Depending on Industry. Available online: http://www.zj.gov.cn/art/2012/5/15/art_12460_121053.html (accessed on 15 May 2012). (In Chinese)
- Sun, S.; Luo, C.; Chen, J. A Review of Natural Language Processing Techniques for Opinion Mining Systems. Inf. Fusion 2017, 36, 10–25. [Google Scholar] [CrossRef]
- Yu, W.; Ai, T.; Yang, M.; Liu, J. Detecting “Hot Spots” of Facility POIs Based on Kernel Density Estimation and Spatial Autocorrelation Technique. Geomat. Inf. Sci. Wuhan Univ. 2016, 41, 221–226. [Google Scholar]
- Liu, Y.; Zeng, C.; Cui, H.; Song, Y. Sustainable Land Urbanization and Ecological Carrying Capacity: A Spatially Explicit Perspective. Sustainability 2018, 10, 3070. [Google Scholar] [CrossRef]
- Getis, A.; Ord, J.K. The Analysis of Spatial Association by Use of Distance Statistics. Geogr. Anal. 1992, 24, 189–206. [Google Scholar] [CrossRef]
- Ord, J.K.; Getis, A. Local Spatial Autocorrelation Statistics: Distributional Issues and an Application. Geogr. Anal. 1995, 27, 286–306. [Google Scholar] [CrossRef]
- Chance Scott, M.; Sen Roy, S.; Prasad, S. Spatial Patterns of Off-the-System Traffic Crashes in Miami–Dade County, Florida, during 2005–2010. Traffic Inj. Prev. 2016, 17, 729–735. [Google Scholar] [CrossRef] [PubMed]
- Ministry of Industry and Information Technology of the People’s Republic of China. The Twelfth Five-Year National Strategic New Industry Development Plan. Available online: http://www.miit.gov.cn/n1146295/n1146562/n1146650/c3074425/content.html (accessed on 9 July 2012). (In Chinese)
- Ministry of Finance of the People’s Republic of China. The Management of Special Funds for Strategic New Industry. Available online: http://jjs.mof.gov.cn/zhengwuxinxi/zhengcefagui/201301/t20130124_729883.html (accessed on 31 December 2012). (In Chinese)
- Porter, M. The Competitive Advantage of Nations. Harv. Bus. Rev. 1990, 68, 73–93. [Google Scholar]
- Roberts, P. The Evolution, Definition and Purpose of Urban Regeneration. Urban Regen. 2000, 2, 9–36. [Google Scholar]
- Han, F. Review of “Zhejiang Model”. J. Zhejiang Shuren Univ. 2009, 9, 70–74. [Google Scholar]
- Tang, G.; Xu, W.; Luo, M. Study on the Distribution Character of “Regional Mass Economy” and the Optimal Disposition of Industry in Zhejiang Province. Econ. Geogr. 2008, 23, 457–461. [Google Scholar]
- Li, J. Research on Development of Regional Massive Economic in Zhejiang Province. Master’s Thesis, Nanjing University of Aeronautics and Astronautics, Nanjing, China, June 2010. [Google Scholar]
- Kshetri, N. The Evolution of the Internet of Things Industry and Market in China: An Interplay of Institutions, Demands and Supply. Telecommun. Policy 2017, 41, 49–67. [Google Scholar] [CrossRef]
- Clifford Coonan. China’s Internet King Eyes World Domination. Available online: https://www.independent.co.uk/news/world/asia/chinas-internet-king-eyes-world-domination-2077573.html (accessed on 19 September 2010).
- Barreto, L.; Amaral, A.; Pereira, T. Industry 4.0 Implications in Logistics: An Overview. Procedia Manuf. 2017, 13, 1245–1252. [Google Scholar] [CrossRef]
- Zhejiang People’s Government. The Plan for the Development of Industrial Clusters Area in Zhejiang Province (2011–2020). Available online: http://www.zj.gov.cn/art/2010/10/13/art_12460_7548.html (accessed on 13 October 2010). (In Chinese)
- Zhejiang People’s Government. The Suggestion of Accelerating the Project of ‘Vacating Cage to Change Bird’ to Promote Industrial Transformation and Upgrading. Available online: http://www.zjdlr.gov.cn/art/2012/6/26/art_1228220_414.html (accessed on 26 June 2012). (In Chinese)
- Sun, T.; Lin, W.; Chen, G.; Guo, P.; Zeng, Y. Wetland Ecosystem Health Assessment through Integrating Remote Sensing and Inventory Data with an Assessment Model for the Hangzhou Bay, China. Sci. Total Environ. 2016, 566, 627–640. [Google Scholar] [CrossRef] [PubMed]
- Bunting, R.J.; Chang, O.Y.; Cowen, C.; Hankins, R.; Langston, S.; Warner, A.; Yang, X.; Louderback, E.R.; Roy, S.S. Spatial Patterns of Larceny and Aggravated Assault in Miami–Dade County, 2007–2015. Prof. Geogr. 2018, 70, 34–46. [Google Scholar] [CrossRef]


| Industrial Land Uses | Description | |
|---|---|---|
| 1. Traditional Industry | Textile Products and Apparel Manufacturing (TPAM) | This Industry includes preparation and spinning of fiber, weaving of fabric, and finishing of textiles. It also covers manufacturing of clothing (e.g., outerwear and underwear). |
| Unspecialized Equipment Manufacturing (UEM) | This industry includes the manufacturing of equipment applied in more than one industry, such as the manufacturing of bearings, gear and transmission equipment; pump and compression equipment; metal-working equipment; packaging equipment; and other unspecialized accessories. | |
| Paper Manufacturing (PM1) | This industry includes the manufacturing of pulp and converted paper. The printing of paper products (e.g., newspapers, books and greeting cards) is also included. | |
| Petrochemical Manufacturing (PM2) | The industry includes chemical manufacturing, which involves transforming organic and inorganic raw materials via a chemical process for the formation of products. It also includes the transformation of crude petroleum into usable products. | |
| Metallurgical Manufacturing (MM1) | This industry includes the manufacturing of basic metals and fabricated metal products. | |
| Medical Manufacturing (MM2) | This industry includes the manufacturing of basic pharmaceutical products and pharmaceutical preparation. Additionally, it includes medicinal, chemical and botanical product manufacturing. | |
| Non-metallic Product Manufacturing (NMPM) | This industry includes the manufacturing of rubber and plastics products, glass and glass products, ceramic products, and other non-metallic products. Materials used in construction are excluded. | |
| Transportation Equipment Manufacturing (TEM) | This industry produces equipment for transporting people and goods, such as motor vehicles, aircraft, ships and boats, railway rolling stock and locomotives, and their accessories. | |
| Construction Material Manufacturing (CMM) | This industry includes the manufacturing of products used for construction, such as tiles and bricks, cement and plaster, dimension stone, wall materials and other materials. | |
| Food Manufacturing (FM) | This industry includes the production of different types of food: meat, fish, fruit and vegetables, oil, milk products, beverages and drinks. Additionally, the manufacturing of tobacco (e.g., cigarettes and cigars) is included. | |
| Electrical Machinery and Component Manufacturing (ECMM) | This industry includes the manufacturing of products that generate, distribute and use electrical power. Additionally, it includes the manufacturing of electrical lighting, signaling equipment and electrical household appliances. | |
| Computer and Electronic Products Manufacturing (CEPM) | This industry includes the manufacturing of computers, computer peripherals, communications equipment, and similar electronic products. | |
| Furniture and Related Product Manufacturing (FRPM) | This industry includes the manufacturing of furniture and related articles, such as mattresses, window blinds, cabinets and fixtures. | |
| 2. New Industry | Internet Information Industry (III) | This industry specializes in cyber source collection and Internet information technology development, production, storage, transmission, and marketing for information commodity. |
| Logistics Industry (LI) | This industry includes the planning, implementation and control of the transportation, reverse flow and storage of goods, services, and related information between the point of origin and the point of terminal. | |
| New Material Industry (NMI) | This industry includes the manufacturing of new materials that have applied new techniques or crafts during production, and have better performance or generate new functions, such as biomaterials, nanomaterials, and superconductor. | |
| New Energy Industry (NEI) | This industry includes the manufacturing of new energy, especially renewable energy, such as hydroelectric power, wind power, and solar power generation. | |
| 3. Other Miscellaneous Manufacturing | Other Miscellaneous Manufacturing(OMM) | This industry includes the manufacturing of a variety of products not contained in other classifications. Specifically, it consists of the manufacturing of sport and athletic goods, dolls and toys, jewelry and other accessories. |
| Industrial Land Uses | Number of Enterprises (Ratio: %) | Rate of Growth (%) | |||
|---|---|---|---|---|---|
| 2005 | 2011 | 2016 | 2005–2011 | 2011–2016 | |
| 1. Traditional industry | |||||
| TPAM | 3616 (21.7) | 9825 (21.4) | 14543 (19.5) | 28.6 | 9.6 |
| UEM | 2143 (12.8) | 6987 (15.2) | 9412 (12.6) | 37.7 | 6.9 |
| PM1 | 477 (2.9) | 1595 (3.5) | 2111 (2.8) | 39.1 | 6.5 |
| PM2 | 488 (2.9) | 892 (1.9) | 1167 (1.6) | 13.8 | 6.2 |
| MM1 | 759 (4.6) | 2563 (5.6) | 3115 (4.2) | 39.6 | 4.3 |
| MM2 | 170 (1.0) | 394 (0.9) | 758 (1.0) | 22.0 | 18.5 |
| NMPM | 1010 (6.1) | 2497 (5.4) | 3205 (4.3) | 24.5 | 5.7 |
| TEM | 314 (1.9) | 1116 (2.4) | 1544 (2.1) | 42.6 | 7.7 |
| CMM | 141 (0.8) | 559 (1.2) | 1201 (1.6) | 49.4 | 23.0 |
| FM | 694 (4.2) | 1194 (2.6) | 1693 (2.3) | 12.0 | 8.4 |
| ECMM | 1111 (6.7) | 3400 (7.4) | 4374 (5.9) | 34.3 | 5.7 |
| CEPM | 389 (2.3) | 1470 (3.2) | 1979 (2.7) | 46.3 | 6.9 |
| FRPM | 356 (2.1) | 1302 (2.8) | 1757 (2.4) | 44.3 | 7.0 |
| 2. New industry | |||||
| III | 57 (0.3) | 198 (0.4) | 803 (1.1) | 41.2 | 61.1 |
| LI | 262 (1.6) | 555 (1.2) | 1922 (2.6) | 18.6 | 49.3 |
| NMI | 33 (0.2) | 226 (0.5) | 347 (0.5) | 97.5 | 10.7 |
| NEI | 33 (0.2) | 182 (0.4) | 340 (0.5) | 75.3 | 17.4 |
| 3. Other miscellaneous manufacturing | |||||
| OMM | 4625 (27.7) | 10866 (23.7) | 24343 (32.6) | 22.5 | 24.8 |
| Industrial Land Uses | Hangzhou | Ningbo | Jiaxing | Shaoxing | Zhoushan | |||||
|---|---|---|---|---|---|---|---|---|---|---|
| A | B | A | B | A | B | A | B | A | B | |
| 1. Traditional industry | ||||||||||
| TPAM | 30.9 | 16.3 | 46.4 | 3.8 | 36.8 | 9.2 | 9.7 | 10 | 35.6 | - |
| UEM | 32.0 | 12.9 | 48.0 | 3.5 | 43.4 | 9.8 | 9.1 | 7.7 | 87.9 | 0.7 |
| PM1 | 38.2 | 9.5 | 55.1 | 3.3 | 37.1 | 7.7 | 14.4 | 7.6 | 39.6 | −0.7 |
| PM2 | 21.5 | 10.9 | 24.2 | 4.2 | 14.3 | 5.3 | 0.5 | 3.2 | 26.2 | 7.8 |
| MM1 | 29.5 | 6.9 | 47.2 | 1.6 | 57.4 | 8.4 | 11.3 | 5.8 | 150 | −1.0 |
| MM2 | 24.9 | 32.8 | 39.2 | 6.5 | 19.8 | 13.2 | 4.8 | 6.1 | 19.0 | 2.7 |
| NMPM | 16.3 | 10.3 | 39.6 | 2.2 | 18.0 | 10.0 | 7.7 | 6.8 | 81.8 | 2.5 |
| TEM | 25.9 | 13.6 | 74.6 | 3.9 | 22.4 | 16.0 | 9.0 | 7.0 | 52.8 | 7.5 |
| CMM | 52.8 | 32.5 | 70.3 | 10.4 | 42.3 | 22.0 | 22.2 | 24.1 | 72.2 | 23.8 |
| FM | 17.3 | 15.6 | 9.0 | 5.0 | 12.5 | 9.5 | 2.5 | 5.6 | 33.3 | 0.5 |
| ECMM | 22.5 | 16.1 | 44.7 | 2.2 | 37.5 | 10.2 | 7.7 | 8.1 | 55.0 | 2.8 |
| CEPM | 50.4 | 18.5 | 54.3 | 1.4 | 34.8 | 8.4 | 17.3 | 15.8 | 66.7 | 4.0 |
| FRPM | 68.7 | 12.7 | 63.3 | 2.4 | 26.6 | 6.6 | 17.5 | 7.8 | 91.7 | 7.7 |
| 2. New industry | ||||||||||
| III | 55 | 87.7 | 33.3 | 23.3 | 22.2 | 147.1 | 26.7 | 44.6 | - | 14.3 |
| LI | 10.9 | 57.6 | 33.6 | 47.6 | 21.0 | 47.6 | 9.6 | 47.7 | 16.7 | 22.0 |
| NMI | 75.0 | 15.9 | 129.8 | 5.2 | 62.5 | 22.1 | 72.2 | 13.8 | - | 4.0 |
| NEI | 19.2 | 35.0 | 112.5 | 16.8 | 138.9 | 12.1 | 58.3 | 24.4 | - | 40.0 |
| 3. Other Miscellaneous Manufacturing | ||||||||||
| OMM | 25.1 | 48.1 | 29 | 10.3 | 20.9 | 26.3 | 6.8 | 19.4 | 26.2 | 19.2 |
| Period | Hangzhou | Ningbo | Jiaxing | Shaoxing | Zhoushan |
|---|---|---|---|---|---|
| 2005–2011 | 36.25 | 272.50 | 37.50 | −215.25 | 11.75 |
| 2011–2016 | 95.00 | −211.75 | 19.25 | −8.75 | −10.00 |
| 2005–2016 | 131.25 | 60.75 | 56.75 | −224.00 | 1.75 |
© 2018 by the authors. Licensee MDPI, Basel, Switzerland. This article is an open access article distributed under the terms and conditions of the Creative Commons Attribution (CC BY) license (http://creativecommons.org/licenses/by/4.0/).
Share and Cite
Huang, L.; Wu, Y.; Zheng, Q.; Zheng, Q.; Zheng, X.; Gan, M.; Wang, K.; Shahtahmassebi, A.; Deng, J.; Wang, J.; et al. Quantifying the Spatiotemporal Dynamics of Industrial Land Uses through Mining Free Access Social Datasets in the Mega Hangzhou Bay Region, China. Sustainability 2018, 10, 3463. https://doi.org/10.3390/su10103463
Huang L, Wu Y, Zheng Q, Zheng Q, Zheng X, Gan M, Wang K, Shahtahmassebi A, Deng J, Wang J, et al. Quantifying the Spatiotemporal Dynamics of Industrial Land Uses through Mining Free Access Social Datasets in the Mega Hangzhou Bay Region, China. Sustainability. 2018; 10(10):3463. https://doi.org/10.3390/su10103463
Chicago/Turabian StyleHuang, Lingyan, Yani Wu, Qing Zheng, Qiming Zheng, Xinyu Zheng, Muye Gan, Ke Wang, AmirReza Shahtahmassebi, Jingsong Deng, Jihua Wang, and et al. 2018. "Quantifying the Spatiotemporal Dynamics of Industrial Land Uses through Mining Free Access Social Datasets in the Mega Hangzhou Bay Region, China" Sustainability 10, no. 10: 3463. https://doi.org/10.3390/su10103463
APA StyleHuang, L., Wu, Y., Zheng, Q., Zheng, Q., Zheng, X., Gan, M., Wang, K., Shahtahmassebi, A., Deng, J., Wang, J., & Zhang, J. (2018). Quantifying the Spatiotemporal Dynamics of Industrial Land Uses through Mining Free Access Social Datasets in the Mega Hangzhou Bay Region, China. Sustainability, 10(10), 3463. https://doi.org/10.3390/su10103463